Coverage Technology User Guide - pudn.comread.pudn.com/downloads343/ebook/1502221/cov_ug.pdf ·...
364
Coverage Technology User Guide Version D-2010.06 June 2010 Comments? E-mail your comments about this manual to: [email protected].
Transcript of Coverage Technology User Guide - pudn.comread.pudn.com/downloads343/ebook/1502221/cov_ug.pdf ·...

Coverage Technology User GuideVersion D-2010.06June 2010
Comments?E-mail your comments about this manual to:[email protected].

2
Copyright Notice and Proprietary InformationCopyright © 2010 Synopsys, Inc. All rights reserved. This software and documentation contain confidential and proprietary information that is the property of Synopsys, Inc. The software and documentation are furnished under a license agreement and may be used or copied only in accordance with the terms of the license agreement. No part of the software and documentation may be reproduced, transmitted, or translated, in any form or by any means, electronic, mechanical, manual, optical, or otherwise, without prior written permission of Synopsys, Inc., or as expressly provided by the license agreement.
Right to Copy DocumentationThe license agreement with Synopsys permits licensee to make copies of the documentation for its internal use only.Each copy shall include all copyrights, trademarks, service marks, and proprietary rights notices, if any. Licensee mustassign sequential numbers to all copies. These copies shall contain the following legend on the cover page:
This document is duplicated with the permission of Synopsys, Inc., for the exclusive use of
_________________________________ and its employees. This is copy number______.”
Destination Control StatementAll technical data contained in this publication is subject to the export control laws of the United States of America.Disclosure to nationals of other countries contrary to United States law is prohibited. It is the reader’s responsibility todetermine the applicable regulations and to comply with them.
DisclaimerSYNOPSYS, INC., AND ITS LICENSORS MAKE NO WARRANTY OF ANY KIND, EXPRESS OR IMPLIED, WITHREGARD TO THIS MATERIAL, INCLUDING, BUT NOT LIMITED TO, THE IMPLIED WARRANTIES OFMERCHANTABILITY AND FITNESS FOR A PARTICULAR PURPOSE.
Registered Trademarks (®)Synopsys, AMPS, Cadabra, CATS, CRITIC, CSim, Design Compiler, DesignPower, DesignWare, EPIC, Formality, HSIM, HSPICE, iN-Phase, in-Sync, Leda, MAST, ModelTools, NanoSim, OpenVera, PathMill, Photolynx, Physical Compiler, PrimeTime, SiVL, SNUG, SolvNet, System Compiler, TetraMAX, VCS, Vera, and YIELDirector are registered trademarks of Synopsys, Inc.
Trademarks (™)AFGen, Apollo, Astro, Astro-Rail, Astro-Xtalk, Aurora, AvanWaves, Columbia, Columbia-CE, Cosmos,CosmosEnterprise, CosmosLE, CosmosScope, CosmosSE, DC Expert, DC Professional, DC Ultra, Design Analyzer,Design Vision, DesignerHDL, Direct Silicon Access, Discovery, Encore, Galaxy, HANEX, HDL Compiler, Hercules,Hierarchical Optimization Technology, HSIMplus, HSPICE-Link, iN-Tandem, i-Virtual Stepper, Jupiter, Jupiter-DP,JupiterXT, JupiterXT-ASIC, Liberty, Libra-Passport, Library Compiler, Magellan, Mars, Mars-Xtalk, Milkyway,ModelSource, Module Compiler, Planet, Planet-PL, Polaris, Power Compiler, Raphael, Raphael-NES, Saturn, Scirocco, Scirocco-i, Star-RCXT, Star-SimXT, Taurus, TSUPREM-4, VCS Express, VCSi, VHDL Compiler, VirSim, and VMC are trademarks of Synopsys, Inc.
Service Marks (SM)MAP-in, SVP Café, and TAP-in are service marks of Synopsys, Inc.
SystemC is a trademark of the Open SystemC Initiative and is used under license.ARM and AMBA are registered trademarks of ARM Limited.Saber is a registered trademark of SabreMark Limited Partnership and is used under license.All other product or company names may be trademarks of their respective owners.

1
Contents
1. Introducing Coverage Technology
Coverage Metrics Overview . . . . . . . . . . . . . . . . . . . . . . . . . . . . . . 1-2
Coverage Flow . . . . . . . . . . . . . . . . . . . . . . . . . . . . . . . . . . . . . . . . 1-4
Types of Coverage . . . . . . . . . . . . . . . . . . . . . . . . . . . . . . . . . . . . . 1-5Line Coverage . . . . . . . . . . . . . . . . . . . . . . . . . . . . . . . . . . . . . . 1-5
Line Coverage for Verilog. . . . . . . . . . . . . . . . . . . . . . . . . . . 1-6Line Coverage for VHDL . . . . . . . . . . . . . . . . . . . . . . . . . . . 1-13
Toggle Coverage . . . . . . . . . . . . . . . . . . . . . . . . . . . . . . . . . . . . 1-14Condition Coverage . . . . . . . . . . . . . . . . . . . . . . . . . . . . . . . . . . 1-15
Verilog Conditional Coverage Not Monitored . . . . . . . . . . . . 1-18VHDL Conditional Coverage Not Monitored. . . . . . . . . . . . . 1-20
FSM Coverage. . . . . . . . . . . . . . . . . . . . . . . . . . . . . . . . . . . . . . 1-21FSM Coverage for Verilog . . . . . . . . . . . . . . . . . . . . . . . . . . 1-22FSM Coverage for VHDL . . . . . . . . . . . . . . . . . . . . . . . . . . . 1-24
Branch Coverage. . . . . . . . . . . . . . . . . . . . . . . . . . . . . . . . . . . . 1-26Functional Coverage . . . . . . . . . . . . . . . . . . . . . . . . . . . . . . . . . 1-29
Generating the Coverage Database . . . . . . . . . . . . . . . . . . . . . . . . 1-29

2
Generating Coverage Reports. . . . . . . . . . . . . . . . . . . . . . . . . . . . . 1-29Unified Report Generator. . . . . . . . . . . . . . . . . . . . . . . . . . . . . . 1-30DVE Coverage GUI . . . . . . . . . . . . . . . . . . . . . . . . . . . . . . . . . . 1-30
Post-processing Coverage Data . . . . . . . . . . . . . . . . . . . . . . . . . . . 1-32
Using Unified Coverage API . . . . . . . . . . . . . . . . . . . . . . . . . . . . . . 1-32
2. Generating Coverage Database
Unified Coverage Database . . . . . . . . . . . . . . . . . . . . . . . . . . . . . . 2-33
How to Obtain Coverage Data for your Design . . . . . . . . . . . . . . . . 2-35Compiling Design Files . . . . . . . . . . . . . . . . . . . . . . . . . . . . . . . 2-35Running the Simulation and Monitoring Coverage . . . . . . . . . . 2-36Viewing Coverage Reports . . . . . . . . . . . . . . . . . . . . . . . . . . . . 2-36
Generating Coverage Metrics . . . . . . . . . . . . . . . . . . . . . . . . . . . . . 2-38
3. Viewing the Coverage Report Using Unified Report Generator
Supported Metrics . . . . . . . . . . . . . . . . . . . . . . . . . . . . . . . . . . . . . . 3-44
Invoking URG . . . . . . . . . . . . . . . . . . . . . . . . . . . . . . . . . . . . . . . . . 3-45Merging Coverage Results of Several Runs of the Same
Executable . . . . . . . . . . . . . . . . . . . . . . . . . . . . . . . . . . . 3-46
Format to Display Coverage Results. . . . . . . . . . . . . . . . . . . . . . . . 3-47
What is Covered in Each Coverage Metrics . . . . . . . . . . . . . . . . . . 3-49The Line Coverage Report . . . . . . . . . . . . . . . . . . . . . . . . . . . . 3-50The Toggle Coverage Report. . . . . . . . . . . . . . . . . . . . . . . . . . . 3-53The Condition Coverage Report . . . . . . . . . . . . . . . . . . . . . . . . 3-54

3
Condition Coverage Report Splitting for Large Number of Conditions. . . . . . . . . . . . . . . . . . . . . . . . . . . . . . . . . . . . 3-57
The FSM Coverage Report . . . . . . . . . . . . . . . . . . . . . . . . . . . . 3-59The Branch Coverage Report . . . . . . . . . . . . . . . . . . . . . . . . . . 3-61The Assertion Coverage Report . . . . . . . . . . . . . . . . . . . . . . . . 3-68The Covergroup Report . . . . . . . . . . . . . . . . . . . . . . . . . . . . . . . 3-70
Viewing Results for Coverage Group Variants . . . . . . . . . . . 3-73Understanding Covergroup Page Splitting . . . . . . . . . . . . . . 3-74Reporting Which Test Covered Which Covergroup Bin or Assert
3-76
Difference Reports for Functional Coverage . . . . . . . . . . . . . . . . . . 3-77Diff Results Shown in the Dashboard and Test Pages . . . . . . . 3-78What is Shown as Covered . . . . . . . . . . . . . . . . . . . . . . . . . . . . 3-79
Report for Default Mode (-diff or -diff object) . . . . . . . . . . . . 3-79Report for Count Mode (-diff count) . . . . . . . . . . . . . . . . . . . 3-80
Unsupported Flags . . . . . . . . . . . . . . . . . . . . . . . . . . . . . . . . . . 3-81Exclusions . . . . . . . . . . . . . . . . . . . . . . . . . . . . . . . . . . . . . . . . . 3-82
Reporting Only Uncovered Objects (-show brief) . . . . . . . . . . . . . . 3-83Brief Report for Line Coverage. . . . . . . . . . . . . . . . . . . . . . . 3-83Brief Report for Condition Coverage: . . . . . . . . . . . . . . . . . . 3-85Brief Report for FSM Coverage . . . . . . . . . . . . . . . . . . . . . . 3-86
Report Changes. . . . . . . . . . . . . . . . . . . . . . . . . . . . . . . . . . . . . 3-86Dashboard . . . . . . . . . . . . . . . . . . . . . . . . . . . . . . . . . . . . . . 3-86Module List . . . . . . . . . . . . . . . . . . . . . . . . . . . . . . . . . . . . . . 3-86Hierarchy . . . . . . . . . . . . . . . . . . . . . . . . . . . . . . . . . . . . . . . 3-87Groups . . . . . . . . . . . . . . . . . . . . . . . . . . . . . . . . . . . . . . . . . 3-88Tests . . . . . . . . . . . . . . . . . . . . . . . . . . . . . . . . . . . . . . . . . . . 3-89HVP . . . . . . . . . . . . . . . . . . . . . . . . . . . . . . . . . . . . . . . . . . . 3-89

4
Assertions Report. . . . . . . . . . . . . . . . . . . . . . . . . . . . . . . . . 3-89Module and Instance Header Sections . . . . . . . . . . . . . . . . 3-89
Coverage Report Files . . . . . . . . . . . . . . . . . . . . . . . . . . . . . . . . . . 3-90Common Report Elements. . . . . . . . . . . . . . . . . . . . . . . . . . . . . 3-90The Dashboard File . . . . . . . . . . . . . . . . . . . . . . . . . . . . . . . . . . 3-92The Hierarchy File . . . . . . . . . . . . . . . . . . . . . . . . . . . . . . . . . . . 3-94The Modlist File . . . . . . . . . . . . . . . . . . . . . . . . . . . . . . . . . . . . . 3-96The Groups File . . . . . . . . . . . . . . . . . . . . . . . . . . . . . . . . . . . . . 3-97The modN File . . . . . . . . . . . . . . . . . . . . . . . . . . . . . . . . . . . . . . 3-98
Module with Parameters. . . . . . . . . . . . . . . . . . . . . . . . . . . . 3-102The grpN Files . . . . . . . . . . . . . . . . . . . . . . . . . . . . . . . . . . . . . . 3-102The Asserts File . . . . . . . . . . . . . . . . . . . . . . . . . . . . . . . . . . . . . 3-104The Tests File. . . . . . . . . . . . . . . . . . . . . . . . . . . . . . . . . . . . . . . 3-104
Analyzing Trend Charts . . . . . . . . . . . . . . . . . . . . . . . . . . . . . . . . . . 3-105Quick Overview . . . . . . . . . . . . . . . . . . . . . . . . . . . . . . . . . . . . . 3-105
Generating Trend Charts . . . . . . . . . . . . . . . . . . . . . . . . . . . 3-106Customizing Trend Charts . . . . . . . . . . . . . . . . . . . . . . . . . . 3-109Navigating Trend Charts. . . . . . . . . . . . . . . . . . . . . . . . . . . . 3-114
Trend Chart Linkage . . . . . . . . . . . . . . . . . . . . . . . . . . . . . . . . . 3-116Organization of Trend Charts . . . . . . . . . . . . . . . . . . . . . . . . 3-117Top-Level Chart . . . . . . . . . . . . . . . . . . . . . . . . . . . . . . . . . . 3-117Metric-Wide Breakdown Linkage . . . . . . . . . . . . . . . . . . . . . 3-120Hierarchical Linkage. . . . . . . . . . . . . . . . . . . . . . . . . . . . . . . 3-125Links to Previous Sessions . . . . . . . . . . . . . . . . . . . . . . . . . 3-128
4. Viewing Coverage Reports Using the DVE Coverage GUI
Starting the DVE in Coverage Mode . . . . . . . . . . . . . . . . . . . . . . . . 4-130
5
Opening a Database . . . . . . . . . . . . . . . . . . . . . . . . . . . . . . . . . 4-130Loading Multiple Coverage Tests Incrementally . . . . . . . . . . . . 4-136Loading and Saving Sessions . . . . . . . . . . . . . . . . . . . . . . . . . . 4-138
Saving a Session . . . . . . . . . . . . . . . . . . . . . . . . . . . . . . . . . 4-138Loading a Session . . . . . . . . . . . . . . . . . . . . . . . . . . . . . . . . 4-139
DVE Coverage Source / Database File Relocation . . . . . . . . . . 4-140
Using the Coverage GUI . . . . . . . . . . . . . . . . . . . . . . . . . . . . . . . . . 4-142The Navigation Pane . . . . . . . . . . . . . . . . . . . . . . . . . . . . . . . . . 4-142
The Coverage Summary Table Window. . . . . . . . . . . . . . . . 4-143The Coverage Summary Map Window . . . . . . . . . . . . . . . . . . . 4-146The Coverage Detail Window . . . . . . . . . . . . . . . . . . . . . . . . . . 4-147Navigating in the Source Pane . . . . . . . . . . . . . . . . . . . . . . . . . 4-148
Creating User-Defined Groups. . . . . . . . . . . . . . . . . . . . . . . 4-149
Displaying Code Coverage . . . . . . . . . . . . . . . . . . . . . . . . . . . . . . . 4-151Displaying Line Coverage . . . . . . . . . . . . . . . . . . . . . . . . . . . . . 4-151Displaying Toggle Coverage . . . . . . . . . . . . . . . . . . . . . . . . . . . 4-152
Nets and Registers. . . . . . . . . . . . . . . . . . . . . . . . . . . . . . . . 4-152Multi-Dimensional Arrays . . . . . . . . . . . . . . . . . . . . . . . . . . . 4-154
Displaying Condition Coverage . . . . . . . . . . . . . . . . . . . . . . . . . 4-155Viewing Condition IDs . . . . . . . . . . . . . . . . . . . . . . . . . . . . . 4-156DVE Coverage with Condition Coverage Observability . . . . 4-157
Displaying Finite State Machine (FSM) Coverage . . . . . . . . . . . 4-158Displaying Transition Details . . . . . . . . . . . . . . . . . . . . . . . . 4-159Displaying Sequences . . . . . . . . . . . . . . . . . . . . . . . . . . . . . 4-160
Displaying Branch Coverage . . . . . . . . . . . . . . . . . . . . . . . . . . . 4-162The Branch Coverage Detail window . . . . . . . . . . . . . . . . . . 4-163Displaying Implied Branches . . . . . . . . . . . . . . . . . . . . . . . . 4-164

6
Displaying Assertion Coverage . . . . . . . . . . . . . . . . . . . . . . . . . . . . 4-164SVA Naming Convention . . . . . . . . . . . . . . . . . . . . . . . . . . . . . . 4-166OVA Naming Convention . . . . . . . . . . . . . . . . . . . . . . . . . . . . . . 4-166The Covers Tab . . . . . . . . . . . . . . . . . . . . . . . . . . . . . . . . . . . . . 4-168
Displaying Testbench Coverage . . . . . . . . . . . . . . . . . . . . . . . . . . . 4-169
Working with HVP Files . . . . . . . . . . . . . . . . . . . . . . . . . . . . . . . . . . 4-173
Working with Coverage Results . . . . . . . . . . . . . . . . . . . . . . . . . . . 4-173Running Scripts . . . . . . . . . . . . . . . . . . . . . . . . . . . . . . . . . . . . . 4-173Filtering the Hierarchy Display . . . . . . . . . . . . . . . . . . . . . . . . . . 4-174Setting Display Preferences. . . . . . . . . . . . . . . . . . . . . . . . . . . . 4-175
Generating URG Report from DVE Coverage GUI . . . . . . . . . . . . . 4-177
5. Post-processing Coverage Data
Merging . . . . . . . . . . . . . . . . . . . . . . . . . . . . . . . . . . . . . . . . . . . . . . 5-183Serial Merging . . . . . . . . . . . . . . . . . . . . . . . . . . . . . . . . . . . . . . 5-185Parallel Merging. . . . . . . . . . . . . . . . . . . . . . . . . . . . . . . . . . . . . 5-185
Specifying the Machines that Perform the Jobs . . . . . . . . . . 5-188Using a GRID Computing Engine. . . . . . . . . . . . . . . . . . . . . 5-189Using LSF. . . . . . . . . . . . . . . . . . . . . . . . . . . . . . . . . . . . . . . 5-189Specifying the Number of Tests in a Merging . . . . . . . . . . . . 5-190
Flexible Merging . . . . . . . . . . . . . . . . . . . . . . . . . . . . . . . . . . . . 5-190Merge Equivalence. . . . . . . . . . . . . . . . . . . . . . . . . . . . . . . . 5-191Rules for Flexible Merging Databases . . . . . . . . . . . . . . . . . 5-192Example . . . . . . . . . . . . . . . . . . . . . . . . . . . . . . . . . . . . . . . . 5-193Flexible Merge Database . . . . . . . . . . . . . . . . . . . . . . . . . . 5-196
Correlation Report: Which Tests Covered Which Bins. . . . . . . . 5-197

7
Covered Objects. . . . . . . . . . . . . . . . . . . . . . . . . . . . . . . . . . 5-198Tests Page . . . . . . . . . . . . . . . . . . . . . . . . . . . . . . . . . . . . . . 5-200Unsupported Arguments . . . . . . . . . . . . . . . . . . . . . . . . . . . 5-201
Grading and Coverage Analysis . . . . . . . . . . . . . . . . . . . . . . . . . . . 5-201Examples Using the Grading Option . . . . . . . . . . . . . . . . . . . . . 5-202
Scoring . . . . . . . . . . . . . . . . . . . . . . . . . . . . . . . . . . . . . . . . . 5-202Quick Grading . . . . . . . . . . . . . . . . . . . . . . . . . . . . . . . . . . . 5-203Greedy Grading . . . . . . . . . . . . . . . . . . . . . . . . . . . . . . . . . . 5-204
Grading and the -scorefile Option. . . . . . . . . . . . . . . . . . . . 5-205
Mapping Coverage . . . . . . . . . . . . . . . . . . . . . . . . . . . . . . . . . . . . . 5-207Mapping Subhierarchy Coverage in VHDL . . . . . . . . . . . . . . . . 5-211Understanding Instance-Based Mapping. . . . . . . . . . . . . . . . . . 5-212
Examples of Instance-Based Mapping. . . . . . . . . . . . . . . . . 5-214Using Multiple -map Options . . . . . . . . . . . . . . . . . . . . . . . . . . . 5-215Mapping Relocated Source File. . . . . . . . . . . . . . . . . . . . . . . . . 5-215
Exclusion . . . . . . . . . . . . . . . . . . . . . . . . . . . . . . . . . . . . . . . . . . . . . 5-216Exclusion Using DVE Coverage GUI . . . . . . . . . . . . . . . . . . . . . 5-217
Coverage Exclusion with DVE . . . . . . . . . . . . . . . . . . . . . . . 5-217Excluding Covergroups . . . . . . . . . . . . . . . . . . . . . . . . . . . . 5-238
Generating URG Reports Using Exclude Files . . . . . . . . . . . . . 5-242Exclusion in Strict Mode . . . . . . . . . . . . . . . . . . . . . . . . . . . . 5-244Covergroup Exclusion in URG . . . . . . . . . . . . . . . . . . . . . . . 5-244Editing Exclude Files . . . . . . . . . . . . . . . . . . . . . . . . . . . . . . 5-245Exclusion Annotations in URG . . . . . . . . . . . . . . . . . . . . . . . 5-255
Exclusion in UCAPI . . . . . . . . . . . . . . . . . . . . . . . . . . . . . . . . . . 5-257Hierarchy Exclusion Files . . . . . . . . . . . . . . . . . . . . . . . . . . . 5-257Exclusion by Object Handle . . . . . . . . . . . . . . . . . . . . . . . . . 5-258

8
Default vs. Strict Exclusion . . . . . . . . . . . . . . . . . . . . . . . . . . 5-259
Editing the Covergroup Coverage Database. . . . . . . . . . . . . . . . . . 5-260db_edit_file Syntax. . . . . . . . . . . . . . . . . . . . . . . . . . . . . . . . . . . 5-261Resetting Covergroups or Coverpoints . . . . . . . . . . . . . . . . . . . 5-261Removing Covergroups from the Database. . . . . . . . . . . . . . . . 5-262Editing the Assertion Coverage Database . . . . . . . . . . . . . . . . . 5-263
Resetting the Coverage Scores for Assertions . . . . . . . . . . 5-263Removing Assertions from the Coverage Database . . . . . . 5-264
6. Unified Coverage API
Overview . . . . . . . . . . . . . . . . . . . . . . . . . . . . . . . . . . . . . . . . . . . . . 6-265Database Contents . . . . . . . . . . . . . . . . . . . . . . . . . . . . . . . . . . 6-268Persistence . . . . . . . . . . . . . . . . . . . . . . . . . . . . . . . . . . . . . . . . 6-268UCAPI Setup and Compilation Requirements . . . . . . . . . . . . . . 6-269
Enabling Error Reporting . . . . . . . . . . . . . . . . . . . . . . . . . . . 6-271
Data Model . . . . . . . . . . . . . . . . . . . . . . . . . . . . . . . . . . . . . . . . . . . 6-271UCAPI Object . . . . . . . . . . . . . . . . . . . . . . . . . . . . . . . . . . . . . . 6-272Common Properties. . . . . . . . . . . . . . . . . . . . . . . . . . . . . . . . . . 6-273Coverable Objects . . . . . . . . . . . . . . . . . . . . . . . . . . . . . . . . . . . 6-276
Block. . . . . . . . . . . . . . . . . . . . . . . . . . . . . . . . . . . . . . . . . . . 6-276Value Set . . . . . . . . . . . . . . . . . . . . . . . . . . . . . . . . . . . . . . . 6-277Integer and Scalar values. . . . . . . . . . . . . . . . . . . . . . . . . . . 6-279Interval values . . . . . . . . . . . . . . . . . . . . . . . . . . . . . . . . . . . 6-279BDD values . . . . . . . . . . . . . . . . . . . . . . . . . . . . . . . . . . . . . 6-280Vector values . . . . . . . . . . . . . . . . . . . . . . . . . . . . . . . . . . . . 6-280Value Set . . . . . . . . . . . . . . . . . . . . . . . . . . . . . . . . . . . . . . . 6-283Sequence . . . . . . . . . . . . . . . . . . . . . . . . . . . . . . . . . . . . . . . 6-284

9
Cross . . . . . . . . . . . . . . . . . . . . . . . . . . . . . . . . . . . . . . . . . . 6-287Design Objects. . . . . . . . . . . . . . . . . . . . . . . . . . . . . . . . . . . . . . 6-287
Design and Test Name. . . . . . . . . . . . . . . . . . . . . . . . . . . . . 6-288Tests and Metrics . . . . . . . . . . . . . . . . . . . . . . . . . . . . . . . . . 6-288Source Definition and Source Instance . . . . . . . . . . . . . . . . 6-289Test-qualified Source Regions . . . . . . . . . . . . . . . . . . . . . . . 6-298
Other Objects. . . . . . . . . . . . . . . . . . . . . . . . . . . . . . . . . . . . . . . 6-300Container . . . . . . . . . . . . . . . . . . . . . . . . . . . . . . . . . . . . . . . 6-300
Predefined Coverage Metrics . . . . . . . . . . . . . . . . . . . . . . . . . . . . . 6-302Line Coverage . . . . . . . . . . . . . . . . . . . . . . . . . . . . . . . . . . . . . . 6-302Condition Coverage . . . . . . . . . . . . . . . . . . . . . . . . . . . . . . . . . . 6-305Branch Coverage. . . . . . . . . . . . . . . . . . . . . . . . . . . . . . . . . . . . 6-311Finite State Machine Coverage . . . . . . . . . . . . . . . . . . . . . . . . . 6-317Toggle Coverage . . . . . . . . . . . . . . . . . . . . . . . . . . . . . . . . . . . . 6-321Assertion Coverage . . . . . . . . . . . . . . . . . . . . . . . . . . . . . . . . . . 6-325Testbench Coverage . . . . . . . . . . . . . . . . . . . . . . . . . . . . . . . . . 6-334
Setting Hit Count on Bins . . . . . . . . . . . . . . . . . . . . . . . . . . . 6-335Usage. . . . . . . . . . . . . . . . . . . . . . . . . . . . . . . . . . . . . . . . . . 6-336Set covdbStatusCovered . . . . . . . . . . . . . . . . . . . . . . . . . . . 6-336Contents of the Bin Tables . . . . . . . . . . . . . . . . . . . . . . . . . . 6-337Limitations . . . . . . . . . . . . . . . . . . . . . . . . . . . . . . . . . . . . . . 6-342
Loading a Design . . . . . . . . . . . . . . . . . . . . . . . . . . . . . . . . . . . . . . 6-342Available Tests . . . . . . . . . . . . . . . . . . . . . . . . . . . . . . . . . . . . . . 6-343Loading Tests. . . . . . . . . . . . . . . . . . . . . . . . . . . . . . . . . . . . . . . 6-343
Determining Which Test Covered an Object . . . . . . . . . . . . 6-345

10

1-1
Unified Coverage Reporting
1Introducing Coverage Technology 1
This chapter contains the following sections:
• “Coverage Metrics Overview”
• “Types of Coverage”
• “Generating the Coverage Database”
• “Generating Coverage Reports”
• “Post-processing Coverage Data”
• “Using Unified Coverage API”

1-2
Unified Coverage Reporting
Coverage Metrics Overview
VCS can monitor and evaluate the coverage metrics of Verilog, VHDL, and mixed HDL designs during simulation to determine which portions of the design have not been tested. The results of the analysis are reported in a number of ways that allow you to see the shortcomings in your testbench and improve tests as needed to obtain the complete coverage. Functional coverage is the determination of how much functionality of the design has been exercised by the verification environment.
VCS writes both code and functional coverage databases during the simulation. Using VCS, you can generate the following two types of coverage databases:
• Code Coverage
You can get two types of code coverage information.
- The first is control-flow coverage that tracks which lines and branches have taken the flow of execution through the Verilog or VHDL code. Control-flow metrics include line coverage and branch coverage.
- The second type is value coverage, which monitors what values signals and expressions take on during simulation. Value-coverage metrics include toggle coverage and FSM coverage, which track the values (or value-transitions) for signals and variables.

1-3
Unified Coverage Reporting
• Functional Coverage
Functional coverage provides you with information of your testbench variable and signal values and their state transitions. You can enable cross-coverage between variables and signals.
The VCS implementation of SystemVerilog supports the covergroup construct, which you specify as the user. These constructs allow the system to monitor values and transitions for variables and signals. They also enable cross-coverage between variables and signals.

1-4
Unified Coverage Reporting
Coverage Flow
Following is a high level picture of the VCS Coverage flow:

1-5
Unified Coverage Reporting
This document is created based on this flow.
Types of Coverage
This section provides introductory descriptions of the following types of coverage metrics.
• “Line Coverage”
• “Toggle Coverage”
• “Condition Coverage”
• “FSM Coverage”
• “Branch Coverage”
• “Functional Coverage”
Line Coverage
Line coverage (or statement coverage) shows you which lines of code are exercised — and which ones are not — by your testbench during a simulation run. VCS generates metrics for total coverage of lines, blocks, and branches that tell you how much of your code is actually executed by the tests. Line coverage is applied to signal and variable assignments in HDL code and gives an indication of the number of times each assignment statement was executed when the design was simulated. A zero execution count pin-points a line of code that has not been exercised that could be the source of a potential design error.

1-6
Unified Coverage Reporting
Line coverage also produces annotated listings, which identify the unexercised statements, therefore, giving you the information you need to write more tests to complete the coverage. However, coverage reports do not tell you how many times a line of code is executed.
In line coverage, VCS keeps track of the following in the source code:
• Individual procedural statements
• Procedural statement blocks
• Procedural statement block type
• Missing (implied) conditional statements
Note:• Statement blocks consist of a set of individual procedural
statements executed sequentially and always executed together in the same time step.
• By default, line coverage does not keep track of continuous assignment statements, but you can enable it; see “Enabling Line Coverage for Continuous Assignments” .
Line Coverage for Verilog
VCS tracks the following types of Verilog procedural statements:
• Statements that cause a simulation event, such as a procedural assignment statement, or a system task.
• Statements that control which other statements are executed, such as a while or an if statements.
The following code example illustrates what is covered in Verilog:

1-7
Unified Coverage Reporting
Example 1-1 Monitored Statements in Line Coveragemodule top;reg clk;reg [8:0] data;wire [8:0] results;
initialbegin $display("Assigning initial values"); clk=0; data=256; #100 $finish;end
always #3 clk=~clk;
dev dev1 (results,clk,data);
endmodule
module dev (out,clock,in);output [8:0] out;input clock;input [8:0] in;reg [8:0] out;reg en;
task splitter;input [8:0] tin;output [8:0] tout;begin tout = tin/2;endendtask
always @ (posedge clock)beginif (in % 2 !== 0) $display("error cond, input not even"); else out = in;

1-8
Unified Coverage Reporting
if (in % 2 == 0)en = 1;while (en) forever case (out % 2) !0 : #0 $finish; 0 : #5 splitter(out,out); endcaseendendmodule
In Example 1-1, the boldface lines contain statements that VCS tracks for line coverage.
VCS line coverage also includes information about always and initial blocks and other types of blocks of code. In line coverage, a block is a nesting level in the code, not so much a level in the hierarchy, but a level of control of the execution of the procedural code. Typically, you change the indentation of your source code for a nesting level. Example 1-2 illustrates the code blocks in the source code in Example 1-1. It is interrupted in a number of places to explain the blocks.

1-9
Unified Coverage Reporting
Example 1-2 Code Blocks in Line Coveragemodule top;reg clk;reg [8:0] data;wire [8:0] results;
initialbegin $display("Assigning initial values"); clk=0; data=256; #100 $finish;end
The initial block is a distinct block of code in this top-level module. Inside the initial block is a procedural delay on the $finish system task. This delay and system task constitutes a separate block of code, so that if simulation ends before time 100, the other statements in the initial block can be covered, just not the $finish system task.
Notice that the assignment statements to regs clk and data are on the same line. This illustrates the difference between line and statement coverages. In this case, one line is covered if two statements are covered.
Also, in terms of the statement coverage, the procedural delay is considered a separate wait statement in addition to the $finish system task on that line, so the initial block contains five statements in three lines.

always #3 clk=~clk;
dev dev1 (results,clk,data);
endmodule
1-10
Unified Coverage Reporting
The always block that contains an assignment statement with a procedural delay is one block instead of two. This occurs because it is always a mistake to put neither an event control (such as @ (posedge clk)) nor a delay specification (such as #10) between the always keyword and a procedural statement, so there is no need for the two blocks.
Similarly, the procedural delay in the always block is not a separate wait statement.
module dev (out,clock,in);output [8:0] out;input clock;input [8:0] in;reg [8:0] out;reg en;task splitter;input [8:0] tin;output [8:0] tout;begin tout = tin/2;endendtask
The procedural statements in a task definition (in this case, one statement) are a separate block.

always @ (posedge clock)beginif (in % 2 !== 0) $display("error cond, input not even"); else out = in;if (in % 2 == 0) en = 1;while (en) forever case (out % 2) !0 : #0 $finish; 0 : #5 splitter(out,out); endcase
endendmodule
1-11
Unified Coverage Reporting
A block for this always block contains three statements: if-else, if, and while statements.
The $display system task is controlled by the if construct of the if-else statement and is in a separate block.
The procedural assignment to reg out is a separate block because it is controlled by the else construct.
The procedural assignment to reg en is a separate block because it is controlled by the second if construct. This is one statement on two lines.
The forever statement is in a separate block because it is controlled by the while statement.

1-12
Unified Coverage Reporting
The case statement is in a separate block because it is controlled by the forever statement.
The case item statements are separate blocks and the procedural delays on these case item statements are considered separate wait statements. There can also be blocks for missing constructs. If you use an if statement instead of an if-else statement, VCS considers the else construct to be missing. If you use a case statement and do not enter a default case, VCS considers the default case to be missing.
Enabling Line Coverage for Continuous AssignmentsBy default, line coverage does not include Verilog continuous assignments. You can enable line coverage for continuous assignments with the -cm_line contassign compile-time option and keyword argument. For example:
vcs -f design_files -cm line -cm_line contassign
When you include this compile-time option and keyword argument, URG shows the continuous assignment statement, including any delay specification, as a block of code.
If a continuous assignment assigns a constant value, VCS does not compile or monitor it for line coverage. For example:
module dev;wire w1,w2,w3;reg r1,r2;...assign #5 w1=1;assign #3 w2=r1;assign #10 w3=r1 && r2;

1-13
Unified Coverage Reporting
endmodule
VCS compiles and monitors the continuous assignments to w2 and w3 for line coverage, but not to w1.
Line Coverage for VHDL
In line coverage, VCS tracks the following in the VHDL source code:
• Individual statements
• Statement blocks
• Statement block type
Note:- Statement blocks consist of a set of individual statements
executed sequentially and always executed together in the same time step.
- Concurrent signal assignments and component instantiations are not reported in the coverage reports because they are always executed.
- Coverage information is not reported for design regions running in cycle mode.
- Coverage information is not reported for execution lines in entity or configuration declaration statements.
- VCS monitors line coverage inside for-generates, but individual instances of the generate loop are not monitored separately. Therefore, a line is reported as covered if it is covered in any iteration of the loop, and a line is reported not covered only if it is not covered in any iteration of the loop.
1-14
Unified Coverage Reporting
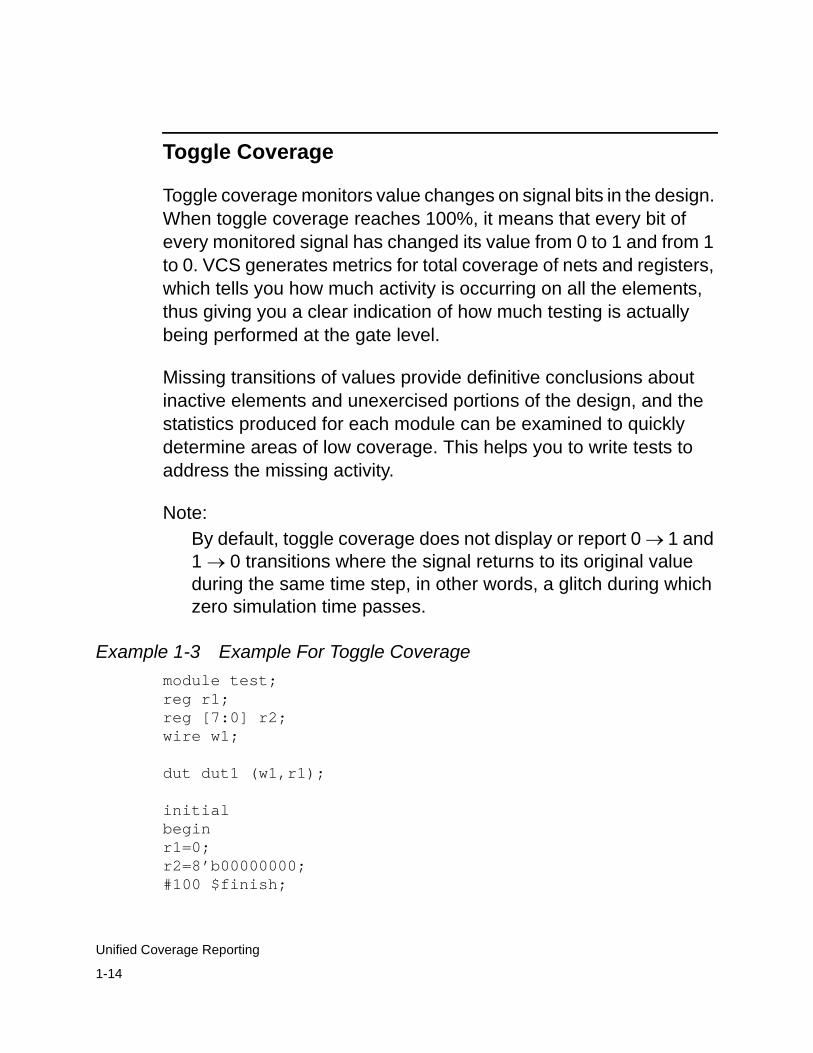
Toggle Coverage
Toggle coverage monitors value changes on signal bits in the design. When toggle coverage reaches 100%, it means that every bit of every monitored signal has changed its value from 0 to 1 and from 1 to 0. VCS generates metrics for total coverage of nets and registers, which tells you how much activity is occurring on all the elements, thus giving you a clear indication of how much testing is actually being performed at the gate level.
Missing transitions of values provide definitive conclusions about inactive elements and unexercised portions of the design, and the statistics produced for each module can be examined to quickly determine areas of low coverage. This helps you to write tests to address the missing activity.
Note:By default, toggle coverage does not display or report 0 → 1 and 1 → 0 transitions where the signal returns to its original value during the same time step, in other words, a glitch during which zero simulation time passes.
Example 1-3 Example For Toggle Coveragemodule test;reg r1;reg [7:0] r2;wire w1;
dut dut1 (w1,r1);
initialbeginr1=0;r2=8’b00000000;#100 $finish;

1-15
Unified Coverage Reporting
end
always#10 r1=~r1;
always#25 r2=r2+1;
endmodule
module dut (out,in);output out;input in;reg dutr1;
always @ indutr1=in;
assign out=dutr1;endmodule
In Example 1-3, the top-level module, test, instantiates module dut. The top-level module, test, contains two registers, r1 and r2, and one net, w1. The module instance dut1 of module dut contains one register dutr1 and two nets, ports in and out.
In the top-level module, test, reg r1 will have ten 0 → 1 or 1 → 0 transitions and vector reg r2 will increment three times.
In module instance dut1, all the signals will have ten 0 → 1 or 1 → 0 transitions.
Condition Coverage
Condition coverage monitors whether certain expressions and subexpressions in your code evaluate to true or false. By default, the expressions and subexpressions are as follows:

1-16
Unified Coverage Reporting
• The conditional expression used with the conditional operator “?:” in a continuous or procedural assignment statement. For example, note the following continuous assignment statement for Verilog:
assign w1 = r1 ^~ r2 ? r2 : r3;
The conditional expression is r1 ^~ r2 and the truth or falsity of this expression are conditions for condition coverage.
• The conditional expression used in conditional concurrent signal assignment or selected concurrent signal assignment, as shown in either of the following VHDL examples:
c <= '0' when (a='0' and b= '0') else '1' when (a='1' and b= '1'); -- conditional concurrent -- signal assignment
or
with (a and b or d) select c <= '0' when '0', '1' when '1', 'X' when others;
In the previous example, the conditional expressions are (a='0' and b= '0') and (a='1' and b= '1') conditional concurrent signal assignment, and (a and b or d) for selected concurrent signal assignment.
• Sub expressions are other conditional operands to the logical AND(&&), logical OR (||), or ternary operators. For example, see the following Verilog assignment statement:
r8 = (r1 == r2) && r3 ? r4 : r6;

1-17
Unified Coverage Reporting
Here, the conditional expression is (r1 == r2) && r3 and the operands of the logical AND && are the subexpressions (r1 == r2) and r3. The conditions for condition coverage are the truth or falsity of the conditional expression and these two subexpressions.
In the case of VHDL, expression (a and b or d) consists of two subexpressions: (a and b) (expr1 or d). The conditions for condition coverage are the truth or falsity of the whole expression and these two subexpressions.
• Subexpressions that are the operands to the logical AND && or logical OR || operators in the conditional expression in an if statement. For example, in the following Verilog if statement:
if ((r1 ^ (!r2)) && (r3 == r4)) begin . . . end
The subexpressions that are the operands of the logical and operator && are (r1 ^ (!r2)) and (r3 == r4))and the conditions for condition coverage are the truth or falsity of these VHDL subexpressions.
if ( A = '0') and ( B = '0') then ... end if;
• Subexpressions that are the operands to the logical AND && or logical OR || operators in an expression in a continuous or procedural assignment statement. For example, in the following Verilog continuous assignment statement:
assign w2 = r5 || r6;

1-18
Unified Coverage Reporting
Subexpressions r5 and r6 are operands of the logical OR || operator and their truth or falsity are conditions in condition coverage.
For another example, in the following Verilog procedural assignment statement:
r6 = (r6 !== r7) || r8;
Subexpressions (r6 !== r7) and r8 are operands of the logical OR || operator and their truth or falsity are conditions in condition coverage.
• Concurrent or sequential assignment statements in VHDL. For example:
d <= (mba < mbb) and (mbb <= mbc);
• Sequential assignment statements in VHDL. For example:
a <= (b /= c) or d; (a, b must be type of BOOLEAN)
Verilog Conditional Coverage Not Monitored
Not all occurrences of conditional expressions with the right operators result in conditions for condition coverage. The following are cases where there are conditional expressions, but VCS do not monitor for condition coverage:
• In terminal connection lists in task-enabling statements:
#1 t1(r11 && r12,r12,r3);
• In instance connection lists:
dev d1(r11 && r12);

1-19
Unified Coverage Reporting
• In PLI routine calls:
$pli((r11 && r12);
• In for loops:
for (i=0;i<10;i=i+1) if(r1 && r2) r3=r1; else r3=r2;
In this example, VCS does not monitor the conditional expression (r1 && r2)for condition coverage.
By default, VCS does not monitor for conditional expressions in for loops.
For more information, see the topic Enabling Condition Coverage in For Loops in the Coverage Technology Reference Manual.
• In user-defined tasks and functions:
task mytask;input in;output out;beginif (r1 && r2) out=in; else out=~in;endendtask
By default, VCS does not monitor for conditional expressions in user-defined tasks and functions.
1-20
Unified Coverage Reporting
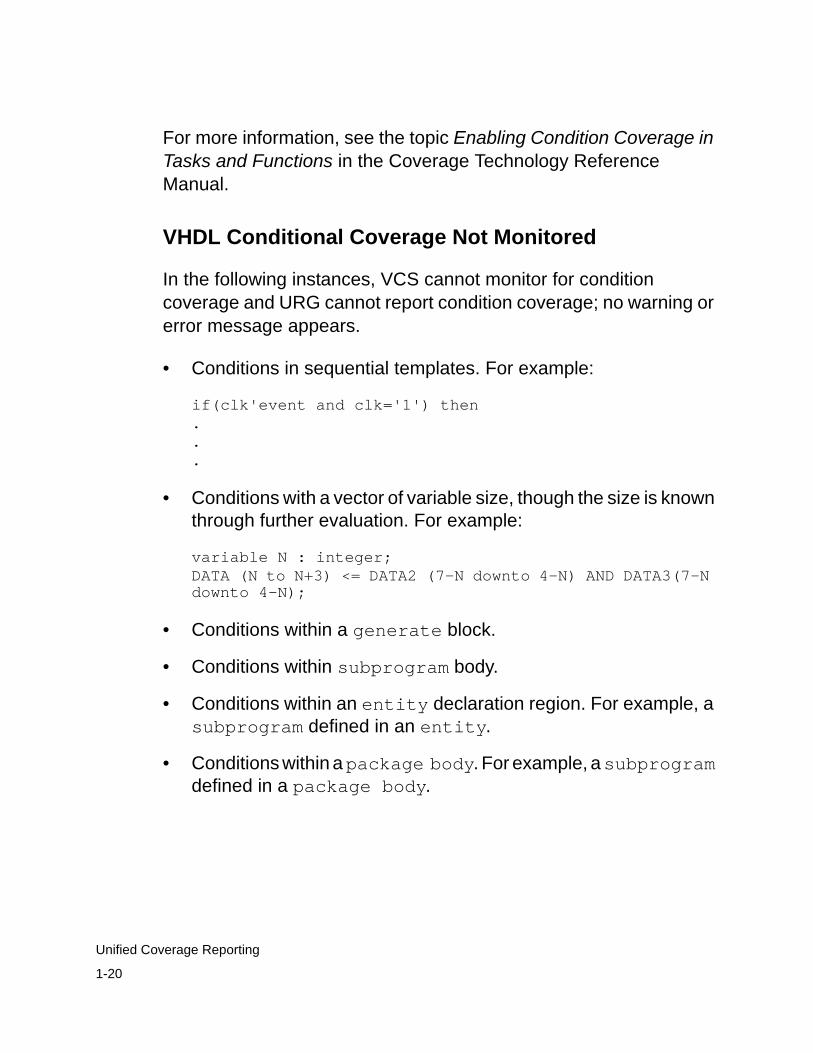
For more information, see the topic Enabling Condition Coverage in Tasks and Functions in the Coverage Technology Reference Manual.
VHDL Conditional Coverage Not Monitored
In the following instances, VCS cannot monitor for condition coverage and URG cannot report condition coverage; no warning or error message appears.
• Conditions in sequential templates. For example:
if(clk'event and clk='1') then...
• Conditions with a vector of variable size, though the size is known through further evaluation. For example:
variable N : integer;DATA (N to N+3) <= DATA2 (7-N downto 4-N) AND DATA3(7-N downto 4-N);
• Conditions within a generate block.
• Conditions within subprogram body.
• Conditions within an entity declaration region. For example, a subprogram defined in an entity.
• Conditions within a package body. For example, a subprogram defined in a package body.

1-21
Unified Coverage Reporting
FSM Coverage
In hardware, a Finite State Machine (FSM) is a sequential logic that outputs a current state and a combinational logic that outputs the next state. When VCS compiles your design for FSM coverage, it identifies a group of statements in the source code to be an FSM and tracks the states and transitions that occur in the FSM during simulation.
The sequential logic is driven by the next state signal and clock and reset signals. The combinational logic is driven by the current state and the inputs to the FSM.
Figure 1-1 Finite State Machine
sequential logic
determines the current state
combinational logicdetermines thenext state
next state
inputs
clock
resetcurrent state
In higher level Verilog or VHDL, a group of statements can be a higher level of abstraction of an FSM. VCS treats a group of statements as an FSM if the group contains a procedural assignment statement to assign the current state of the FSM. The values assigned in the group of statements must be clearly identifiable as

1-22
Unified Coverage Reporting
constants and there must be a dependency between the current state and the next state. The following group of Verilog statements is an FSM:
input in;reg [3:0] current,next;
initialcurrent=4’b0001;
always @ inbegincase (1’b1)current [0] : next=4’b0010;current [1] : next=4’b0100;current [2] : next=4’b1000;current [3] : next=4’b0001;endcase#2 current=next;end
FSM Coverage for Verilog
In Verilog, a group of statements can be used to describe a higher level of abstraction of an FSM. VCS treats a group of statements as an FSM if it meets the following criteria:
• The group of statements must contain a procedural assignment statement to a vector variable to assign the current state of the FSM.
The group can also contain one of the following (though this is not required):
- A procedural assignment to assign the next state to another variable.

1-23
Unified Coverage Reporting
- A concurrent assignment statement to assign the next state to a net.
• In the group, a dependency exists between the current value assigned and the next value assigned.
When you write such a group of statements, it is important to know if the statements made the assignments to all possible states of the FSM and all possible transitions between states.
VCS does not automatically extract an FSM when:
• The group of statements exists in a user-defined task (in VHDL, a function or procedure), including a SystemVerilog global task (it will extract if the group is in a user-defined function, including a SystemVerilog global function).
• There are less than three possible states.
Example 1-4 is a Verilog module definition that contains statements that function as an FSM:
Example 1-4 Verilog Module Definition Containing an FSMmodule dev (clk,in,state);input clk,in;output [1:0] state;
reg [1:0] state,next;parameter idle = 2’b00, first = 2’b01, second = 2’b10, third = 2’b11;
initialbeginstate=idle;next=idle;end

1-24
Unified Coverage Reporting
always @ inbeginnext = state; // by default holdcase (state) idle : if (in) next = first; first : if (in) next = second; second : if (in) next = third; third : if (in) next = idleendcaseend
always @ (posedge clk)state=next;
endmodule
The FSM has four states: idle, first, second, and third. It is possible for a testbench to apply stimulus such that line coverage indicates that VCS executed all the executable lines, but FSM coverage indicates that there never was a transition from the third to the idle state.
The values that the statements in the group assign to a signal are the states of the FSM, and must be of an identifiable set of parameters, numeric constants, or text macros (where the macro text that VCS substitutes for the macro name is a numeric constant). The states can also be enumerated types in SystemVerilog.
FSM Coverage for VHDL
VCS automatically extracts FSMs from VHDL code when it sees the following:
• The state values are stored in enumerated, std_logic_vector, bit_vector, or integer data types.
1-25
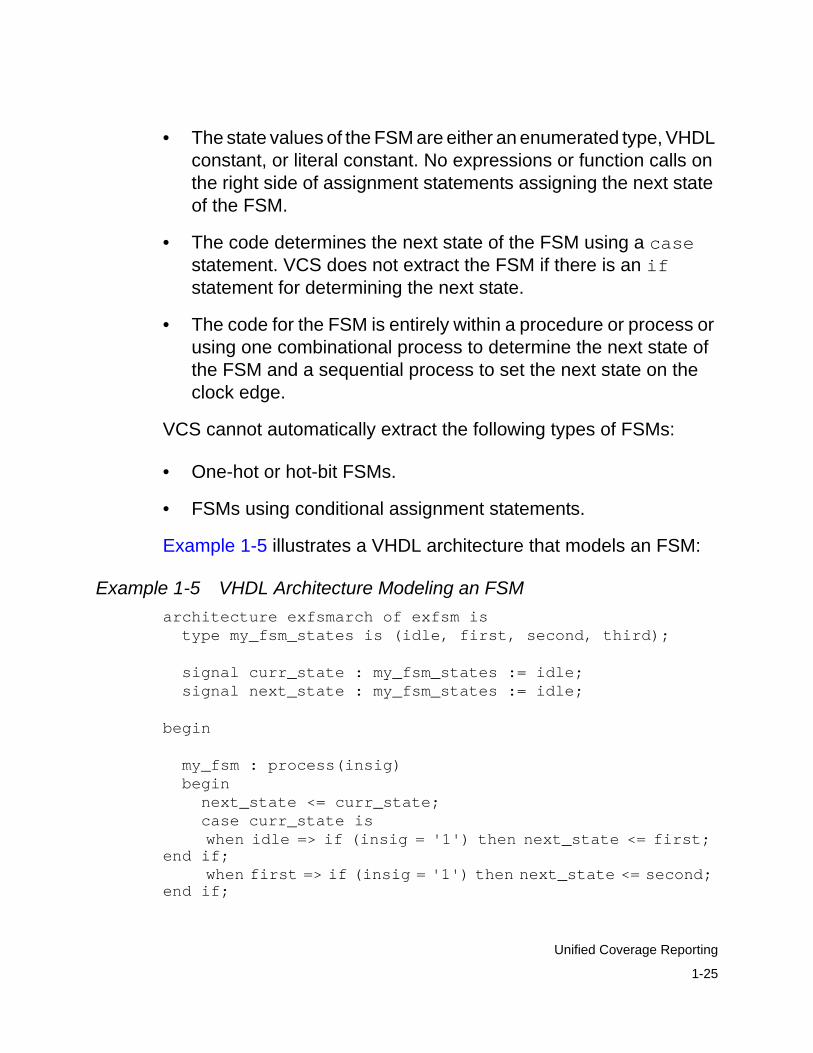
Unified Coverage Reporting
• The state values of the FSM are either an enumerated type, VHDL constant, or literal constant. No expressions or function calls on the right side of assignment statements assigning the next state of the FSM.
• The code determines the next state of the FSM using a case statement. VCS does not extract the FSM if there is an if statement for determining the next state.
• The code for the FSM is entirely within a procedure or process or using one combinational process to determine the next state of the FSM and a sequential process to set the next state on the clock edge.
VCS cannot automatically extract the following types of FSMs:
• One-hot or hot-bit FSMs.
• FSMs using conditional assignment statements.
Example 1-5 illustrates a VHDL architecture that models an FSM:
Example 1-5 VHDL Architecture Modeling an FSMarchitecture exfsmarch of exfsm is type my_fsm_states is (idle, first, second, third);
signal curr_state : my_fsm_states := idle; signal next_state : my_fsm_states := idle;
begin
my_fsm : process(insig) begin next_state <= curr_state; case curr_state is
when idle => if (insig = '1') then next_state <= first; end if;
when first => if (insig = '1') then next_state <= second; end if;

1-26
Unified Coverage Reporting
when second => if (insig = '0') then next_state <= third; end if;
when third => if (insig = '1') then next_state <= idle; end if; end case; end process;
advance_fsm : process begin wait until clk'event and clk = '1'; curr_state <= next_state; end process;
end exfsmarch;
Branch Coverage
Branch coverage analyzes how if and case statements and the use of the ternary operator (?:) establish branches of execution in your Verilog design. It shows you vectors of signal or expression values that enable or prevent simulation events.
For example, consider the following code:
case (r1) 1’b1 : if (r2 && r3) r4 = (r5 && r6) ? 1’b0 : 1’b1; 1’b0 : if (r7 && r8) r9 = (r10 && r11) ? 1’b0 : 1’b1; default : $display("no op");endcase
In this block of code, there are procedural assignment statements where the value assigned is controlled by the ternary operator (?:). These in turn are controlled by if statements, and the if statements are controlled by a case statement.

1-27
Unified Coverage Reporting
Consider the code in Example 1-6:
Example 1-6 Branch Coverage Code Examplecase (r1) 1’b1 : if (r2 && r3) r4 = (r5 && r6) ? 1’b0 : 1’b1; 1’b0 : if (r7 && r8) r9 = (r10 && r11) ? 1’b0 : 1’b1; default : $display("no op");endcase
In this block of code, there are procedural assignment statements where the value assigned is controlled by the ternary operator (?:). These in turn are controlled by if statements and the if statements are controlled by a case statement.
In this block of code, the possible vectors of signal or expression values that result in simulation events or prevent simulation events are as follows:
r1 (r2 && r3) (r5 && r6) (r7 && r8) (r10 && r11)
1 1 1 - -1 1 0 - -1 0 - - - 0 - - 1 10 - - 1 00 - - 0 -default - - - -
For example, in the first vector, r1 is 1’b1 and the expression (r2 && r3) is true, therefore, the value of r4 depends on the value of (r5 && r6). The values of (r7 && r8) and (r10 && r11)do not matter.
Another example, r1 is 1’b1, but the expression (r2 && r3) is false, and the values of the other expressions do not matter, therefore nothing happens.

1-28
Unified Coverage Reporting
Branch coverage shows you these vectors and then tells you whether these vectors ever occurred during simulation, in other words, whether they were covered.
By default, VCS does not monitor for branch coverage if and case statements and uses of the ternary operator (?:) if they are in user-defined tasks or functions or in code that executes as a result of a for loop. You can, however, enable branch coverage in this code.
For more information, see For Loops and User-defined Tasks and Functions in the Coverage Technology Reference Manual.
Branch Coverage With Unknown and High Impedance ValuesIf the conditional expression in an if statement evaluates to X or Z, branch coverage treats this as a false value and reports that 0 value for the expression is covered.
If the case expression in a case statement evaluates to X or Z, unless there is a case item with the case item expression that evaluates to X or Z, VCS executes the default case item. When this occurs, branch coverage reports that the vector for the default case item is covered. If there is no default case item, branch coverage reports a vector for the missing default case item and reports it as covered.
When the conditional expression for a ternary operator evaluates to X or Z, the vector for the expression is not covered.
1-29
Unified Coverage Reporting
Functional Coverage
You can gather the functional coverage metrics during your simulation runs. If your design has assertions or covergroup defined, VCS collects the coverage data and generates the coverage database in simv.vdb. Once you have simv.vdb, you can either use the Unified Report Generator (URG) to generate text or HTML reports or use the DVE Coverage GUI (Cov GUI) to view your assertion or covergroup reports. For more information about functional coverage metrics, see the VCS User Guide.
Generating the Coverage Database
To generate the coverage database, you need to perform the following steps in VCS:
• Compile your design
• Run the simulation
For information on how to perform these steps, see the chapter Introducing Coverage Technology.
Generating Coverage Reports
After you have generated the coverage database, you need to generate the coverage reports.

1-30
Unified Coverage Reporting
Important:cmView GUI is deprecated from release 2010.06 onwards. cmView batch mode is currently supported, but will be deprecated in next release.
You can generate the coverage reports using any of the following tools:
Unified Report Generator
URG generates combined reports for all types of coverage information. You can view these reports organized by the design hierarchy, module lists, or coverage groups. You can also view the overall summary of the entire design/testbench on the dashboard. The reports consist of a set of HTML or text files.
The HTML version of the reports take the form of multiple interlinked HTML files. For example, a hierarchy.html file shows the design's hierarchy and contains links to individual pages for each module and its instances.
The HTML file that URG writes can be read by any web browser that supports CSS (Cascading Style Sheets) level 1, which includes Internet Explorer (IE) 5.0 and later versions, any version of Opera, and the later versions of Netscape Firefox 1.5.
DVE Coverage GUI
Visualization for coverage data in the DVE (Discovery Visualization Environment) is a comprehensive visualization environment which integrates with the design hierarchy display and can be used to get

1-31
Unified Coverage Reporting
a summary of the coverage results or details of various types of coverages. DVE coverage also introduces more advanced feature enabling interactive operations, such as excluding parts of design.
DVE can display three kinds of coverage information:
• Code coverage information — DVE can display the following types of code coverage information:
- Line coverage — what lines or statements were executed during simulation.
- FSM coverage — VCS can identify blocks of code that make up finite state machines or FSMs. FSM coverage reports on the states, transitions, and sequences of states during simulation.
- Toggle coverage — whether the signals in the design toggle from 0 to 1 and 1 to 0 during simulation.
- Condition coverage — conditions are expressions and sub-expressions that control the execution of code or the assignment of values to signals. Condition coverage tests whether both true and false states of these conditions were covered during simulation.
- Branch coverage — analyzes how if and case statements and the ternary operator (?:) establish branches of execution in your Verilog design. It shows you vectors of signal or expression values that enable or prevent simulation events.
• Testbench coverage — coverage of SystemVerilog and OpenVera testbench coverage groups.
• Assertion coverage — coverage of OpenVera and SystemVerilog cover directives.

1-32
Unified Coverage Reporting
Post-processing Coverage Data
Once you have the coverage database, you might want to analyze your coverage data, do some post-simulation procedures, or merge the data after multiple simulation runs. You can analyze the coverage data in the following ways:
• Edit the covergroup coverage database by resetting the covergroups or coverpoints, or removing the covergroups from the coverage database.
• Merge the coverage data to get combined report.
• Autograde to eliminate redundant tests.
• Map the subhierarchy coverage from one design to another.
• Exclude part of data.
• Access covergroup coverage data to modify it.
For more information about all these post-processing techniques and processes, see the chapter Post-processing Coverage Data.
Using Unified Coverage API
Unified Coverage Application programming Interface (UCAPI) is a set of APIs that you can use to extract specific data from your coverage database. This is needed when you want to generate custom reports to analyze your coverage data. For more information about UCAPI, see the chapter Unified Coverage API.

2-33
Unified Coverage Reporting
2Generating Coverage Database 1
This chapter contains the following section:
• “Unified Coverage Database”
• “How to Obtain Coverage Data for your Design”
• “Generating Coverage Metrics”
Unified Coverage Database
The Unified Coverage Database is to simplify data management with a single database while at the same time provide merge time and grade time performance. The Unified coverage database, as the name indicates, contains coverage data for Code coverage, Functional coverage, and Assertion coverage (various aspects of coverage).

2-34
Unified Coverage Reporting
With the unified database,
• coverage data of all the metrics (Line, Toggle, Branch, Condition, FSM, Assertion, and Functional coverage) is collected in a single directory simv.vdb.
• all the metrics are supported with the same post-processing tools. URG for batch merging, grading, and reporting, DVE Coverage GUI for interactive analysis, and UCAPI for custom developed applications.
Note:• The compile-time switch -cm_olddb will enable coverage in old
database mode. This switch is provided for backward compatibility and should be considered as transitional aid in migrating to the unified database.
• The old and unified databases are not supported together, that is flow should be all old or all unified. URG, DVE, and UCAPI do not support mixing of old database and unified database.

2-35
Unified Coverage Reporting
How to Obtain Coverage Data for your Design
To obtain coverage metrics for your design, you must compile your design, run the simulation, and view coverage report in the coverage tools. For VCS MX flow, you also need to perform the analysis step using vlogan or vhdlan command options. For more information about VCS and VCS MX flow, see the VCS User Guide and VCS MX User Guide.
Compiling Design Files
You tell VCS the types of coverage for which you want it to compile your design. After a design is compiled for a type of coverage, VCS automatically collects coverage information for that type of coverage.
To compile the design for coverage, enter the following command:
%vcs [cover_options] [compile_options] source.v
Where,
[cover_options] are coverage related compilation options. For example, -cm line or -cm line+tgl.
[compile_options] are compilation options.
source.v is your design file.
In the process of compilation, VCS creates a directory simv.vdb, that contains code, assertion, and functional coverage data. You can also use -cm_dir and -cm_name compilation options.

2-36
Unified Coverage Reporting
-cm_dir directory_path_name, specifies an alternative name and location for the default simv.vdb directory. If not specified, VCS automatically adds the extension .vdb to the directory name. Note that if you compile the design with the -cm_dir option, and then move simv.vdb, you must use -cm_dir at runtime to point to the new location of simv.vdb.
-cm_name filename as a compile-time or runtime option, specifies an alternative test name instead of the default name. The default test name is "test".
Running the Simulation and Monitoring Coverage
To monitor for coverage during simulation, enter the following command:
% simv [cover_options] [run_options]
Where,
[cover_options] are coverage related compilation options. See “Generating Coverage Metrics” .
[run_options] are runtime options.
Viewing Coverage Reports
In URGTo invoke URG, you need to specify one or more coverage database directories. Under default coverage options, the coverage database directory can be the *.vdb directory containing code coverage, covergroup coverage, and assertion coverage data.
2-37
Unified Coverage Reporting
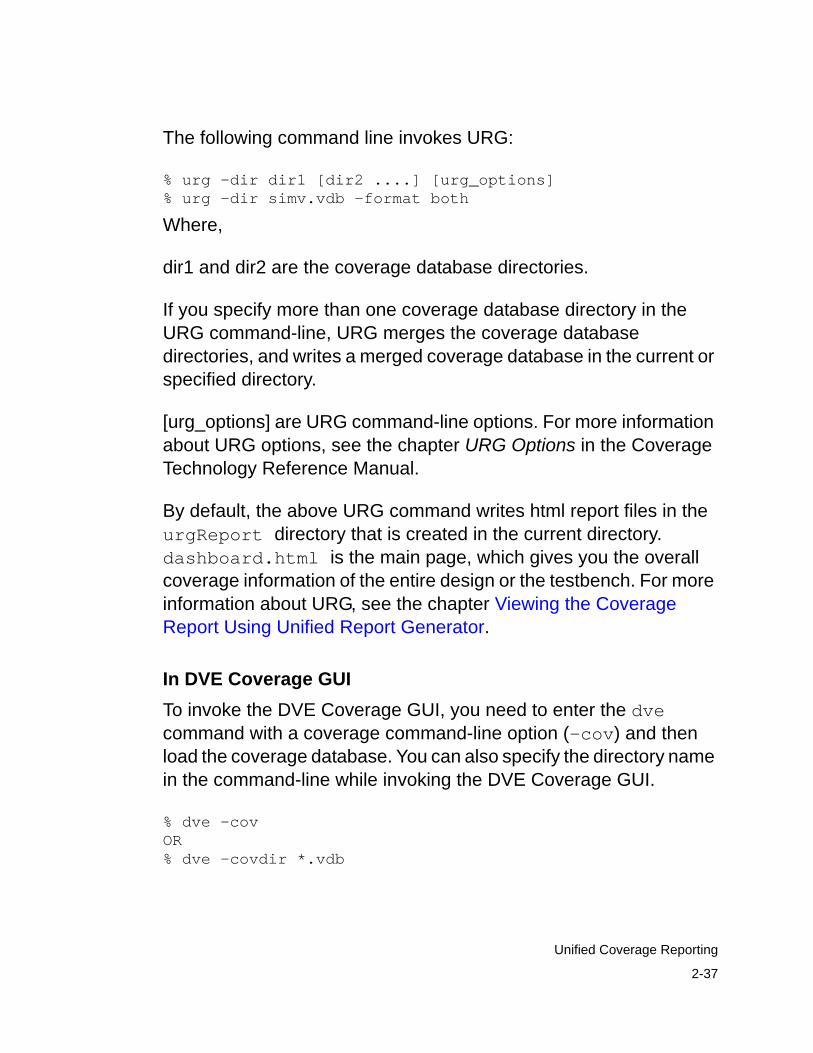
The following command line invokes URG:
% urg -dir dir1 [dir2 ....] [urg_options]% urg -dir simv.vdb -format both
Where,
dir1 and dir2 are the coverage database directories.
If you specify more than one coverage database directory in the URG command-line, URG merges the coverage database directories, and writes a merged coverage database in the current or specified directory.
[urg_options] are URG command-line options. For more information about URG options, see the chapter URG Options in the Coverage Technology Reference Manual.
By default, the above URG command writes html report files in the urgReport directory that is created in the current directory. dashboard.html is the main page, which gives you the overall coverage information of the entire design or the testbench. For more information about URG, see the chapter Viewing the Coverage Report Using Unified Report Generator.
In DVE Coverage GUITo invoke the DVE Coverage GUI, you need to enter the dve command with a coverage command-line option (-cov) and then load the coverage database. You can also specify the directory name in the command-line while invoking the DVE Coverage GUI.
% dve -cov OR% dve -covdir *.vdb

2-38
Unified Coverage Reporting
For more information about the DVE Coverage GUI, see the chapter Viewing Coverage Reports Using the DVE Coverage GUI.
Generating Coverage Metrics
To generate various coverage metrics, you use the command:
-cm <cov_metrics_name>
The arguments to the -cm option are as follows:
line
Specifies line coverage.
cond
Specifies condition coverage.
tgl
Specifies toggle coverage.
fsm
Specifies FSM coverage.
branch
Specifies branch coverage.
assert
Specifies assertion coverage.

2-39
Unified Coverage Reporting
You can include more than one argument using a plus (+) as a delimiter between arguments.
The -cm option is also a compile-time option.
Coverage for covergroup and cover property is automatically turned on in VCS, hence there’s no need to specify any commands to collect the same.
The following examples show compilation and runtime options for all the metrics and how to invoke URG and Coverage GUI:
Example 2-1 Line Coverage Onlyvcs -cm line source.vsimv -cm lineurg -dir simv.vdb -metric linedve -covdir simv.vdb
In this example:
1. VCS compiles for line coverage.
2. During simulation, VCS looks for line coverage.
Example 2-2 Line, Condition and FSM Coveragevcs -cm line+cond+fsm source.vsimv -cm line+cond+fsmurg -dir simv.vdb -metric line+cond+fsmdve -covdir simv.vdb
In this example,
1. VCS compiles for Line, Condition, and FSM coverage.
2. During simulation, VCS looks for Line, Condition, and FSM coverage.

2-40
Unified Coverage Reporting
Example 2-3 Line, Condition, FSM, Toggle, and Branch Coveragevcs -cm line+cond+fsm+tgl+branch -lca source.vsimv -cm line+cond+fsm+tgl+branchurg -dir simv.vdb -metric line+cond+fsm+tgl+branchdve -covdir simv.vdb
In this example,
1. VCS compiles for Line, Condition, FSM, Toggle, and Branch coverage.
2. During simulation, VCS keeps track of Line, Condition, FSM, Toggle, and Branch coverage.
Example 2-4 Line, Condition, and Assertion Coveragevcs -cm line+cond+assert source.vsimv -cm line+cond+asserturg -dir simv.vdb -metric line+cond+assertdve -covdir simv.vdb
In this example,
1. VCS compiles for Line, Condition, and Assertion coverage.
2. During simulation, VCS keeps track of Line, Condition, and Assertion coverage.
Example 2-5 Compiling for FSM, Toggle, and Branch Coverage while Simulating only Branch Coverage
vcs -cm fsm+tgl+branch source.vsimv -cm branchurg -dir simv.vdb -metric branchdve -covdir simv.vdb
In this example,
1. VCS compiles for FSM, Toggle, and Branch coverage.

2-41
Unified Coverage Reporting
2. You can choose to simulate VCS to track only few metrics than what you have specified during the compilation stage, such as Branch coverage.
However, choosing fewer metrics for coverage compilation and choosing more during simulation doesn’t work.
Example 2-6 Specifying More Metrics at Compile-time and Generating Reports for Fewer Metrics
vcs -cm line+fsm+branch+cond source.vsimv -cm line+fsm+branch+condurg -dir simv.vdb -metric line+fsmdve -covdir simv.vdb
In this example,
1. VCS compiles for and simulates Line, FSM, Branch, and Condition coverage.
2. While generating reports, you can choose to generate reports for fewer metrics than what you have specified during compilation and simulation and use URG to generate only Line and FSM coverage.

2-42
Unified Coverage Reporting
3-43
Unified Coverage Reporting
3Viewing the Coverage Report Using Unified Report Generator 1
This chapter contains the following sections:
• “Supported Metrics”
• “Invoking URG”
• “Format to Display Coverage Results”
• “What is Covered in Each Coverage Metrics”
• “Difference Reports for Functional Coverage”
• “Reporting Only Uncovered Objects (-show brief)”
• “Coverage Report Files”
• “Analyzing Trend Charts”

3-44
Unified Coverage Reporting
Supported Metrics
URG generates reports that include the following metrics:
• Code coverage
- “The Line Coverage Report”
- “The Toggle Coverage Report”
- “The Condition Coverage Report”
- “The FSM Coverage Report”
- “The Branch Coverage Report”
• “The Assertion Coverage Report”
• “The Covergroup Report”
The following reports are generated as .html or .txt files:
• “The Dashboard File”
• “The Hierarchy File”
• “The Modlist File”
• “The Groups File”
• “The modN File”
• “The grpN Files”
• “The Asserts File”
• “The Tests File”

3-45
Unified Coverage Reporting
Invoking URG
The usage model to invoke URG is as follows:
1. Compile the test file.
% vcs [compile_options]
2. Simulate the test file.
% simv [runtime_options]
3. Run URG command
urg -dir coverage_directory.vdb urg_options
You must specify the directories containing coverage data files. simv.vdb directory contains code coverage, covergroup or assertion/property coverage data.
Data files are grouped into tests based on the names of the files. Therefore, if you have the following data files, URG considers all of them as data for 'test1'.
./simv.vdb/snps/coverage/db/testdata/test1
You can use the -metric argument as follows to select which types of coverage you want to report:
-metric [+]line+cond+fsm+tgl+assert+group
For example:
urg -dir simv.vdb -metric line+cond+fsm
3-46
Unified Coverage Reporting
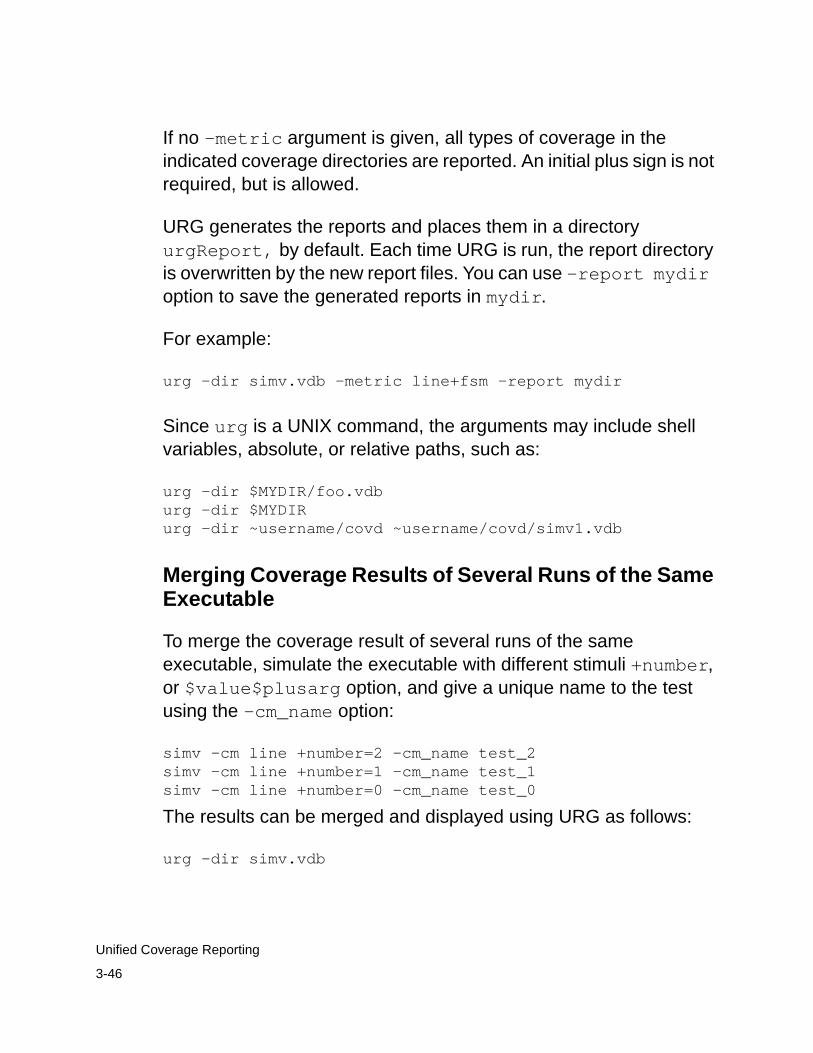
If no -metric argument is given, all types of coverage in the indicated coverage directories are reported. An initial plus sign is not required, but is allowed.
URG generates the reports and places them in a directory urgReport, by default. Each time URG is run, the report directory is overwritten by the new report files. You can use -report mydir option to save the generated reports in mydir.
For example:
urg -dir simv.vdb -metric line+fsm -report mydir
Since urg is a UNIX command, the arguments may include shell variables, absolute, or relative paths, such as:
urg -dir $MYDIR/foo.vdburg -dir $MYDIRurg -dir ~username/covd ~username/covd/simv1.vdb
Merging Coverage Results of Several Runs of the Same Executable
To merge the coverage result of several runs of the same executable, simulate the executable with different stimuli +number, or $value$plusarg option, and give a unique name to the test using the -cm_name option:
simv -cm line +number=2 -cm_name test_2simv -cm line +number=1 -cm_name test_1simv -cm line +number=0 -cm_name test_0
The results can be merged and displayed using URG as follows:
urg -dir simv.vdb
3-47
Unified Coverage Reporting
Now open the URG reports, select tests.html and the following text is displayed in the report:
Data from the following tests was used to generate this reportsimv/test_0simv/test_1simv/test_2
Format to Display Coverage Results
URG introduces two basic types of format to display coverage results:
• Statistics table
• Table of coverable objects
Statistics tables are summaries of types of coverage elements. Each line in a statistics table reports the coverage for a class or category of object. Figure 3-1 shows an example of a statistics table for line coverage:

3-48
Unified Coverage Reporting
Figure 3-1 Example of a Statistics Table
Statistics tables are color-coded using the same color legend as for coverage tables shown in Figure 3-22.
The table of coverable objects shows the coverage results for individual coverable objects. Coverable objects do not have percentages; they are either covered or uncovered. Coverable object tables show covered (and observed) objects in green and uncovered objects in red. Figure 3-7 in the Condition Coverage Section shows a coverage data table for condition coverage.
For all types of coverage, the data section begins with a statistics table showing the basic categories (for example, lines, statements, and blocks, or logical and non-logical conditions). This is followed by a table of coverable objects.
Note that several metrics have options that change exactly what is covered and how to display it. For example, use the condition coverage option -cm_cond allops to control which vectors and conditions are monitored.

3-49
Unified Coverage Reporting
For more information, click this link Coverage Technology Reference Manual if you are using the VCS Online Documentation.
If you are using the PDF interface, click this link cov_ref.pdf.
What is Covered in Each Coverage Metrics
URG, by default, shows detailed coverage reports for all the modules and instances for any given metric. URG shows the entire summary table for a metric it reports. For example, consider the following toggle coverage report.

3-50
Unified Coverage Reporting
The Line Coverage Report
The Line coverage report starts with a table listing individual statistics of each always block, initial block, VHDL process, and continuous assignment. For example:
Figure 3-2 Example of a Line Coverage Section Report:
Note that each line in the table is identified by its type (always, initial, continuous assignment, and so on) and its starting line number. These entries do not represent the scores for individual lines or statements, but for the whole always block, initial block, VHDL process, or continuous assignment. You can then see which part(s) of the module require the most attention.
If the source code of your design is available, the second section in the report displays the annotated source code. The first column shows the line number in the source file. If a line contains a coverable statement, the second column shows the number that are covered and the total coverable statements that begin on that line. For example, on line 37 below, there is one coverable statement and it is covered (1/1). On line 51, there is one coverable statement and it is not covered (0/1). On line 64, there are two coverable statements and neither is covered (0/2).

3-51
Unified Coverage Reporting
Each coverable statement appears in boldface – black if covered, red if uncovered. For example:
Figure 3-3 Example of an Annotated Source Code File
Note:When statements are spread across multiple lines, the covered/coverable numbers and the coloring/boldface will only be shown on the first line (as shown on line 48 in the example above).
3-52
Unified Coverage Reporting
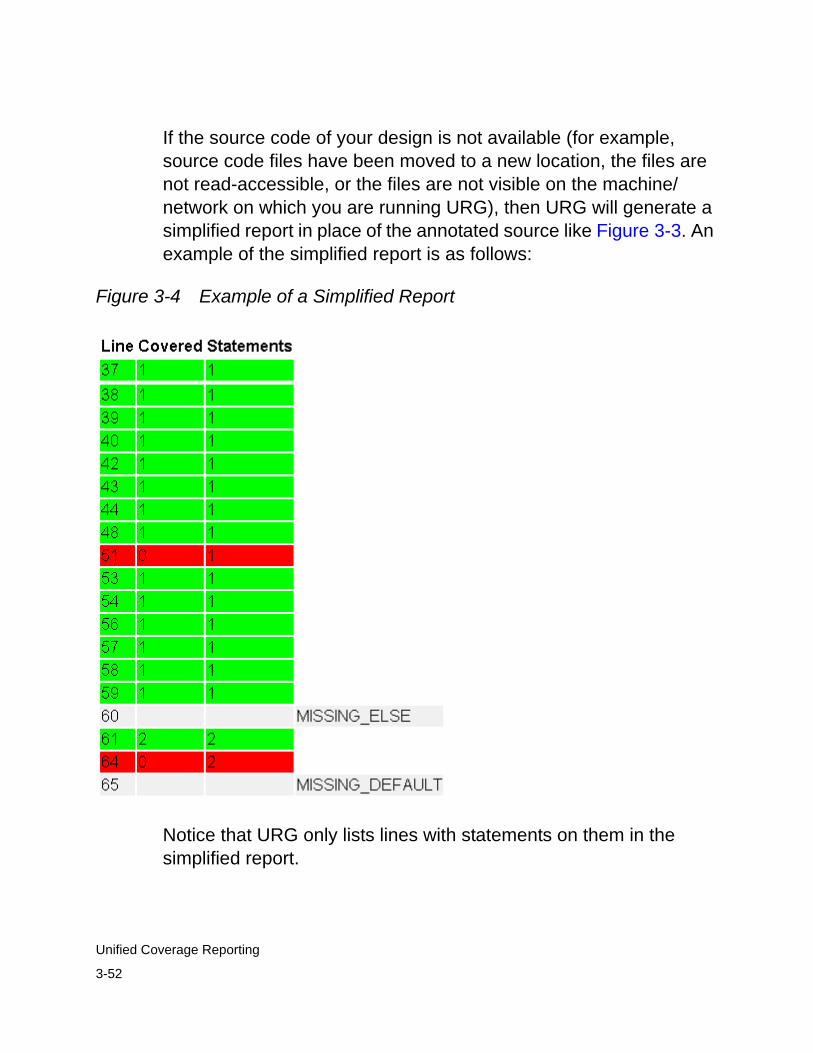
If the source code of your design is not available (for example, source code files have been moved to a new location, the files are not read-accessible, or the files are not visible on the machine/network on which you are running URG), then URG will generate a simplified report in place of the annotated source like Figure 3-3. An example of the simplified report is as follows:
Figure 3-4 Example of a Simplified Report
Notice that URG only lists lines with statements on them in the simplified report.

3-53
Unified Coverage Reporting
The Toggle Coverage Report
URG covers any toggle, be it 1->0 or 0->1.
The toggle coverage report starts with a table containing the number of signals, the bits in each, and the summary coverage statistics for each type of signal. It then shows a table for each type of signal, listing each signal and indicating whether it was fully covered or not. The following figure is an example toggle summary table.
Figure 3-5 Example of a Toggle Coverage Summary Report
The following figure shows a toggle coverage detailed report. In the detailed table, URG lists signals and ports that are not fully covered.

3-54
Unified Coverage Reporting
Figure 3-6 Example of a Toggle Coverage Detailed Report
The Condition Coverage Report
By default, condition coverage reports shows the conditions True or False for all the logical operators and its sensitized vectors for the expression and its sub-expressions, as shown in the following report

3-55
Unified Coverage Reporting
Condition coverage information is shown as a table with each type of condition, followed by an enumeration of each condition showing the source code.

3-56
Unified Coverage Reporting
Figure 3-7 Example of a Condition Coverage Report
When there are nested conditions, URG reports them hierarchically. For example, using the expression (go && (press || x_not) && ((!oe_s))), the two terms for the operator && is (go) and (press || x_not).
3-57
Unified Coverage Reporting
The subexpression (press || x_not) is then broken down into its terms, press and ((x_not)). These are reported separately in the second section.
Condition Coverage Report Splitting for Large Number of Conditions
A module may contain an extremely large number of conditions and at times the report page may be too large for a browser to handle.
Using URG, you can separate the condition report itself into its own page. But it can happen that the condition section by itself is still too large. In such cases with large expressions, the URG report will be split in a list format. You can control the splitting threshold using the URG option -split N. If page size of the line coverage annotation exceeds N, it is moved into a new page, and links are created for navigation.

3-58
Unified Coverage Reporting
Figure 3-8 List format for coverage text report with large expressions

3-59
Unified Coverage Reporting
Figure 3-9 HTML report to cover large expressions
The FSM Coverage Report
The FSM coverage report begins with a summary table for states, transitions, and sequences for all FSMs in the module/instance/entity. Subsequently, it shows individual state, transition, and sequence tables for each FSM.

3-60
Unified Coverage Reporting
Figure 3-10 Example of an FSM Coverage Summary Report

3-61
Unified Coverage Reporting
The Branch Coverage Report
URG branch coverage reports display the source code text with annotations showing both covered and uncovered branches. For example, use the following source code:
Figure 3-11 Original Source Code
1 always@(posedge clk) 2 if(rst) 3 chg_cnt <=#2 3'h0; 4 else 5 begin 6 if((chg_cnt > 3'h0)&&(y_tot || x_not)) 7 begin 8 chg_cnt <=#2 chg_cnt - 1; 9 nck_pulse <=#2 1'h1; 10 end 11 else 12 begin 13 chg_cnt <=#2 change; 14 nck_pulse <=#2 1'h0; 15 end 16 end

3-62
Unified Coverage Reporting
Figure 3-12 URG Branch Coverage Report
1 always@(posedge clk) 2 if(rst) -1- ==> 3 chg_cnt <=#2 3'h0; 4 else 5 begin 6 if((chg_cnt > 3'h0)&&(y_tot || x_not)) -2- ==> 7 begin 8 chg_cnt <=#2 chg_cnt - 1; 9 nck_pulse <=#2 1'h1; 10 end 11 else ==> 12 begin 13 chg_cnt <=#2 change; 14 nck_pulse <=#2 1'h0; 15 end 16 end
BRANCH -1- -2- 1 - | Not Covered 0 1 | Not Covered 0 0 | Not Covered
In Figure 3-12, the URG branch coverage report first shows the source code, which contains the branch alternatives for a given branch, with each branch control highlighted and indexed with a number. Subsequently, the source code is followed by a table showing the different combinations and the coverage status of the control branches.
One difference between URG and DVE Coverage GUI reports is that URG displays an arrow (==>) for each branch.
The following is the same example with some of the branches covered:

3-63
Unified Coverage Reporting
Figure 3-13 The Same Example Showing Covered Branches
1 always@(posedge clk) 2 if(rst) -1- ==> 3 chg_cnt <=#2 3'h0; 4 else 5 begin 6 if((chg_cnt > 3'h0)&&(y_tot || x_not)) -2- ==> 7 begin 8 chg_cnt <=#2 chg_cnt - 1; 9 nck_pulse <=#2 1'h1; 10 end 11 else ==> 12 begin 13 chg_cnt <=#2 change; 14 nck_pulse <=#2 1'h0; 15 end 16 end
BRANCH -1- -2- 1 - | Not Covered 0 1 | Covered 0 0 | Covered
Note that the source code and the index number for control branch -2- are both colored in green because it is fully covered. The arrow (==>) is at the same indentation as the corresponding index.
Figure 3-14 displays the same source code with different coverage. Note that the source code and index of control branch -2- are in red because it is not fully covered, that is, the else statement branch is not covered.

3-64
Unified Coverage Reporting
Figure 3-14 The Same Example Showing Different Coverage
1 always@(posedge clk) 2 if(rst) -1- ==> 3 chg_cnt <=#2 3'h0; 4 else 5 begin 6 if((chg_cnt > 3'h0)&&(y_tot || x_not)) -2- ==> 7 begin 8 chg_cnt <=#2 chg_cnt - 1; 9 nck_pulse <=#2 1'h1; 10 end 11 else ==> 12 begin 13 chg_cnt <=#2 change; 14 nck_pulse <=#2 1'h0; 15 end 16 end
BRANCH -1- -2- 1 - | Covered 0 1 | Covered 0 0 | Not Covered
For ternary operators, the entire line of the source code is colored. It is only green if both branches are covered. There is no arrow (==>) for ternary operator branches. For example:

3-65
Unified Coverage Reporting
Figure 3-15 Coverage Example of a Ternary Operator
316 tri[7:0]dsko=oe_s ?dsko_n:8’hzz; -1- BRANCH -1- 1 | Not Covered 0 | Covered
If there are multiple branches on a single line, each branch has its individual index and an arrow (==>) beneath each index. The entire line is colored in red unless all branches are fully covered. For example:

3-66
Unified Coverage Reporting
Figure 3-16 Example of Multiple Branches on a Single Line
15 if(a) x <= 3’h0; else if(y) x <= 3’h1; else x <= 3’h2; -1- -2- ==> ==> ==> BRANCH -1- -2- 1 - | Covered 0 1 | Covered 0 0 | Not Covered
3-67
Unified Coverage Reporting
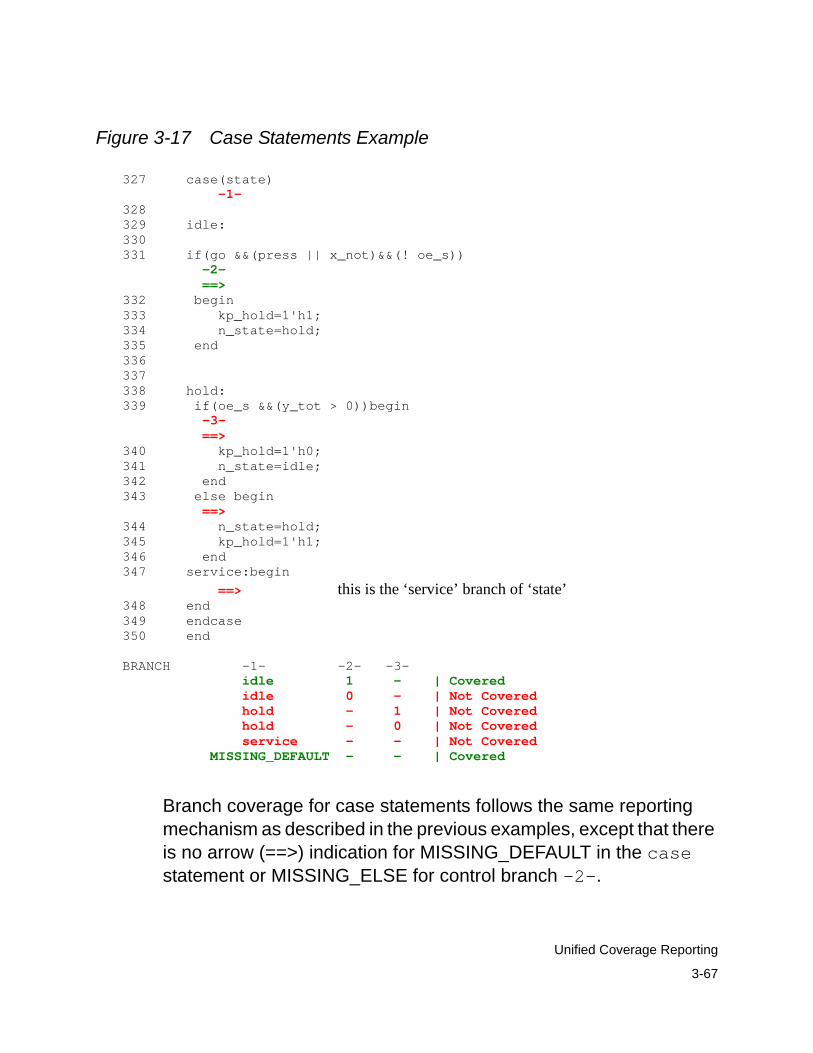
Figure 3-17 Case Statements Example
327 case(state) -1- 328 329 idle: 330 331 if(go &&(press || x_not)&&(! oe_s)) -2- ==> 332 begin 333 kp_hold=1'h1; 334 n_state=hold; 335 end 336 337 338 hold: 339 if(oe_s &&(y_tot > 0))begin -3- ==> 340 kp_hold=1'h0; 341 n_state=idle; 342 end 343 else begin ==> 344 n_state=hold; 345 kp_hold=1'h1; 346 end 347 service:begin ==> this is the ‘service’ branch of ‘state’ 348 end 349 endcase 350 end BRANCH -1- -2- -3- idle 1 - | Covered idle 0 - | Not Covered hold - 1 | Not Covered hold - 0 | Not Covered service - - | Not Covered MISSING_DEFAULT - - | Covered
Branch coverage for case statements follows the same reporting mechanism as described in the previous examples, except that there is no arrow (==>) indication for MISSING_DEFAULT in the case statement or MISSING_ELSE for control branch -2-.

3-68
Unified Coverage Reporting
The summary table for branch coverage is organized by top-level branch statements (these correspond directly to the tables in the detailed reports). The summary table shows the line number on which the branch statement starts, the number of branch alternatives the branch contains, and the number of branches covered. For example:
Line NumberNumber of Branches Covered Percentage
1 3 0 0.00
15 3 2 66.67
316 2 1 50.00
The Assertion Coverage Report
URG list only assertions that have failed or are not covered. Only uncovered “covers” are listed.
The assertion coverage report displays a table showing the statistics of assertions.

3-69
Unified Coverage Reporting
Figure 3-18 Example of an Assertions Coverage Report
The first column lists the names of the block identifier for assert or cover statements.
The ATTEMPTS column lists the number of times VCS began to see if the assert statement or directive succeeded or the cover statement or directive matched.
The REAL SUCCESSES column lists the number of times the assert statement succeeded. A real success is when the entire expression succeeds or matches without the vacuous successes. This column is color-coded. A cell with 0 value shows there are no real success and is colored in red and the success values are shown in green.

3-70
Unified Coverage Reporting
The MATCHES column lists the total number of times the cover statement matched. The MATCHES column is color-coded according to its content. A cell with a 0 value is considered not covered and is displayed in red, while a cell with a non-zero value is considered covered and is displayed in green.
The FAILURES column lists the number of times the assert statement does not succeed. Because cover statements do not have failures, the entry for cover statements in this column is not shown.
The INCOMPLETES column lists the number of times VCS started keeping track of the statement or directive, but simulation ended before the statement could succeed or match.
The Covergroup Report
Each covergroup report lists all points and crosses and their coverage scores at the top.

3-71
Unified Coverage Reporting
Figure 3-19 Example of a Covergroup Report
In Figure 3-20, the VCS coverage feature hole analysis compresses 5 bins into a single row for the UNCOVERED BINS table. The following is an example of cross details:

3-72
Unified Coverage Reporting
Figure 3-20 Example of a Detailed Cross Table
There is also a section for each point and cross showing the

3-73
Unified Coverage Reporting
individual coverage percentage, information about the point or cross, and so on.
Viewing Results for Coverage Group Variants
A shape designation in a coverage group name indicates coverage results for variants of a coverage group. Because parameter values can affect the number or size of bins to be monitored, coverage group instances can have different shapes.
In the following Vera example, the program has two instances of W (w1 and w2). Variants of the coverage group, cov0, were instantiated with different parameters in w1 and w2.
#define UPPER 4'h7#define LOWER 4'h0
class W { rand bit [3:0] addr; rand bit [3:0] resp;
coverage_group cov0(bit [3:0] lower, bit [3:0] upper) { sample_event = @(posedge CLOCK); sample resp; sample addr; cross cc1 (resp, addr) { state cross_low_range( addr >= lower && addr <= upper ); } cumulative = 1; }
task new(bit [3:0] lower, bit [3:0] upper) { cov0 = new(lower,upper); } task display(integer id = -1) { printf("%d -> \t%h \t%s \n", id, addr, resp);

3-74
Unified Coverage Reporting
}}
program prog { W w1, w2; w1 = new(LOWER, UPPER); w2 = new(LOWER+8, UPPER+8); @(posedge CLOCK);
void = w1.randomize() with {addr == 4'h6;}; w1.display(1);
void = w2.randomize() with {addr == 4'h6;}; w2.display(2);
@(posedge CLOCK); }
The coverage results for w1 and w2 are found in W::cov0_SHAPE_0 and W::cov0_SHAPE_1, respectively.
Crosses for Group : W::cov0_SHAPE_0Automatically Generated Bins for respname count at least auto[3:3] 1 1
Samples for Group : W::cov0_SHAPE_1Automatically Generated Bins for respname count at least auto[6:6] 1 1
Understanding Covergroup Page Splitting
The HTML version of the detailed covergroup report can become quite large, which can cause difficulties when you load and view this report.

3-75
Unified Coverage Reporting
Important: The page-splitting functionality applies only to HTML reports, not text reports.
Note the following page-splitting guidelines for covergroup reports:
• Instance splitting - URG splitting behavior for covergroup instances resembles code coverage splitting for module instances. When URG generates a report for any group instance, URG checks the size of the current page and creates a new page if the report exceeds the value you defined with -split N.
URG never splits a group report.
• Bin table splitting - If the bin table is so large that the previous splitting strategy is not enough to make the page fit in the page size limit, URG splits the bin table across several pages. In this situation, the covergroup page displays a note alerting you to the multiple-page splitting that URG has performed. The covergroup page also contains links to the various pages.
Each page that is split contains a summary table of coverage information.
The following examples show how a report for a hypothetical covergroup a is split:
Page for covergroup a, before splitting:
Group a
Group instance a1
Group instance a2
Group instance a3
Group instance a4
3-76
Unified Coverage Reporting
Pages for covergroup a, after splitting:
Page for covergroup a:
Group a
Group instance a1
Subpage 1:
Group instance a2
Group instance a3
Subpage 2:
Group instance a4
Reporting Which Test Covered Which Covergroup Bin or Assert
When you have multiple test files (intermediate results files) from multiple simulations, URG merges the coverage results so that if something is covered in one, but not all the test files, URG reports it as covered. In covergroup and assertion coverage, you can have URG indicate in the modinfo.txt/mod*.html pages which test covered each assertion or bin. This feature is enabled with the -show tests option. For more information about this option, see the section “Correlation Report: Which Tests Covered Which Bins” .

3-77
Unified Coverage Reporting
Difference Reports for Functional Coverage
Coverage driven verification is an iterative process of running some tests, analyzing coverage results, adding new tests, and repeating the cycle until the required level of coverage is achieved. During this iterative process, it sometimes helps to understand the differential value that a new test adds to an existing coverage result. That is, it is helpful to compare the coverage results of a new test run with an existing base or a reference test run. This is referred to as Difference Report (Diff report) in URG.
Given two tests test1 and test2, a diff report shows the difference in the objects covered by the two tests. The difference is the set of objects covered by one test minus the set of objects covered by the other test.
To create a diff report, use the -diff flag as follows:
urg –dir mydir1.vdb mydir2.vdb –tests myfile –diff
The filename specified with the -tests flag (myfile in the example above) must contain the names of the two tests. If more or fewer than two tests are specified, or if the -tests flag is not given at all, URG reports an error and exits.
The order in which the two tests are specified matters. The first test specified is called the diff test. The second test is called the base test. The diff operation is diff test – base test.
The default for -diff is to report a number of objects. However, a count option can be specified with the -diff flag to change the operation from object-based to count-based. The two forms are:

3-78
Unified Coverage Reporting
urg –dir mydir.vdb –tests myfile –diff [object] urg –dir mydir.vdb –tests myfile –diff count
A sample myfile looks like this:
simv/testsimv/test_gen_1
If the -diff count flag is used, then the differences between the hit counts are shown for fcov and assert metrics that have counting data in tests. The hit count in the base test is subtracted from the hit count in the diff test for each object. If the result is greater than 0, the result is shown as the hit count in the diff report. If the result is greater than or equal to the hit count goal (1 by default), then the object is shown as covered.
Only the assert and covergroup metrics are supported with the -diff flag. If data from other metrics is present, URG prints a warning message, and the other metrics data are ignored. No scores, objects, or other values from other metrics appear in a report generated with -diff.
Diff Results Shown in the Dashboard and Test Pages
Details about the diff being processed are shown at the top of the dashboard and test pages. For example, assume that the –tests file contains the following:
simv/test2 simv/test1

3-79
Unified Coverage Reporting
Then the dashboard page would show this:
Date: date-and-timeUser: usernameVersion: VCS-versionCommand line: urg -diff -dir simv.vdb -tests mytests
This report was generated with the -diff flag. The testsused were:
base test: simv/test1diff test: simv/test2
The only objects not shown as covered in this report are those that are covered in simv/test2 that are not covered in simv/test1.
In a diff report, there are no list of tests in the tests.html/txt file, since the only two tests are the base test and the diff test, and they are already specified explicitly.
What is Shown as Covered
Report for Default Mode (-diff or -diff object)
In a report generated with the –diff or –diff object flag, the only things shown as covered are those objects that were covered in the diff test but not covered in the base test. The overall scores, the summary tables, and the detailed reports all show only what was covered in the diff test but not covered in the base test.

3-80
Unified Coverage Reporting
For example, suppose the following information appears in the dashboard:
Hierarchical coverage data for top-level instances
SCORE LINE COND TOGGLE FSM ASSERT NAME
9.84 15.11 0.00 1.51 29.06 3.54 vitv
This means that 15.11% of all line coverage objects in the design that were not covered in the base test are covered in the diff test.
The following table shows how a given object is shown in the diff report for different combinations of coverage status in the base and diff tests:
Diff Test Base Test In Diff Report
Covered Covered Not covered
Not Covered covered Not covered
covered Not Covered Covered
Not covered Not covered Not covered
Note that in the default mode, the hit counts do not matter. For metrics that support hit counts in the report, the hit count of the diff test is shown for any objects that are covered in the diff test but not covered in the base test. For all other objects a hit count of 0 is shown.
Report for Count Mode (-diff count)
In –diff count mode, hit counts are computed as follows for each coverable object:

3-81
Unified Coverage Reporting
diff = diff test count – base test count if (diff >= 0) displayed count = diff else displayed count = 0
if (diff >= hit count goal for this object) displayed result = covered else displayed result = not covered
The following table shows some examples for a given object:
Hit Count Goal Diff Test Base Test In Diff Report
1 7 10 Not covered. count 0
1 10 7 Covered, count 3
4 10 7 Not covered, count 3
1 10 10 Not covered, count 0
1 10 10 Not covered, count 0
1 0 10 Not covered, count 0
1 1 0 Covered, count 1
For metrics for which counting is not enabled, the same reporting rules are used as for default mode (that is, –diff object), even when –diff count was given.
Unsupported Flags
The following flags are not compatible with the –diff flag. If any of these flags are given with the –diff flag, an error is reported and URG exits.
• -grade

3-82
Unified Coverage Reporting
• -annotate
• -trend
• -show tests
• -show maxtests N
• -show availabletests
• -dbname (You cannot save a merged diff db)
• -map
Exclusions
All types of exclusion are supported with the –diff flag, including the –hier file and the loading of exclude files.

3-83
Unified Coverage Reporting
Reporting Only Uncovered Objects (-show brief)
This section describes how URG allows you to create reports only for uncovered objects (instead of creating reports for all coverable objects).
URG supports a command-line option that causes only uncovered objects to be shown in the report:
% urg –show brief
You can use this option in combination with text mode to generate a brief text report:
% urg –show brief –format text
Brief Report for Line Coverage
For line coverage reports (which provides annotated source code that shows coverable objects and which objects are not covered), URG shows only the lines that contain uncovered statements (“uncovered lines”), with two lines of context before and after each uncovered line.
Showing some context is important because the coverage database does not know the extent of a statement—a statement could cross over several lines, in which case the statement would be truncated. URG provides two lines of context above and below a statement:
if (some condition)if (some other condition)
a <= (b ? c :( d ? e :
( f ? g :

3-84
Unified Coverage Reporting
( h ? i :( j ? k : l )))));
If the statement is uncovered, URG shows only this information:
if (some condition)if (some other condition)
a <= (b ? c :( d ? e :
( f ? g :
If several uncovered lines are grouped together, they are all grouped together in the report. For example:
if (some condition)begin
if (some other condition)begin
a <= b;if (yet another condition)begin
x <= y;end
endend
The report for the above example would show the following text, rather than reporting the information in two separate sections:
if (some other condition)begin
a <= b;if (yet another condition)begin
x <= y;end
end

3-85
Unified Coverage Reporting
Brief Report for Condition Coverage:
The condition that is fully covered is omitted in the brief report because that has no (uncovered) subconditions.
The brief report shows both the condition on line 510 and its subcondition—even though the condition itself is fully covered—because one vector of the subcondition is not covered.

3-86
Unified Coverage Reporting
Brief Report for FSM Coverage
URG omits from the report any FSMs that are fully covered (all states and transitions). However, these FSMs are shown in the FSM summary table—with only the FSM name and its score.
If an FSM is fully covered except for its sequences, URG omits the FSM even if the sequence score is less than 100.
If an FSM is not fully covered, URG lists all of the FSM’s states, and only its uncovered transitions and sequences.
Report Changes
This section describes how each report section changes when you use the -show brief option.
Dashboard
The dashboard report does not change. The total coverage summary for the design is shown with the summary for each top-level instance.
Module List
Only modules with an overall coverage score less than 100% are shown. Modules with no coverable objects in them (for any reported metric) are not listed.

3-87
Unified Coverage Reporting
For example, assume the module list report looks like this:
In brief mode, the module list report would only show the following modules:
Hierarchy
The hierarchy report omits any instances that do not have coverable objects in their subtree or whose entire subtree has a score of 100% (for all reported metrics). URG does not produce a comment or other indication that such an instance has been omitted.
In other words, the only parts of the hierarchy that will be deleted from the report are those entire subtrees that have coverage scores of 100%, or that have no coverable objects in them at all.

3-88
Unified Coverage Reporting
Assume the full report looks like this:
In brief mode, the report would show only the following modules:
Note that HNUCKIDVOXUSFT_0 is omitted because it has no coverable objects, and the subtree rooted at HNPSIDEDJI_0 is omitted because it has 100% coverage.
Groups
The groups report omits any groups that have a 100% score.

3-89
Unified Coverage Reporting
Tests
The tests report does not change.
HVP
The HVP format omits any features whose subtrees are either 100% covered or which have no coverable measures in them. Like the hierarchy, only entire subtrees are omitted (if any).
Assertions Report
URG lists in any of the tables only assertions that are not covered or that failed. Only covers and assertions that are not covered are listed.
The total number of assertions is still reported the same way in asserts.html.
Module and Instance Header Sections
In brief mode, URG generates module, instance, and group reports only for those modules and instances that have coverage scores less than 100%.
Module HeaderURG lists the same header for modules, including all self-instances—even those self-instances that have 100% coverage. However, the self-instances with 100% coverage do not link to any report because their reports are not generated. URG shows all self-instances because you can see how URG computed the scores for the module.

3-90
Unified Coverage Reporting
If a module is hidden from the module list page, but its instances are reported, the module header still appears at the top of the module page because the module header contains useful information for the whole page.
Instance HeaderURG shows the same instance header, including a list of all subtrees.
Coverage Report Files
URG generates a number of report files and a common dashboard that you can use to access the report files. The report files can be either HTML or text files. The HTML files contain a navigation menu and also follow a color code that helps to visually assess the coverage metrics.
In addition, URG also generates a session.xml file which contains VCS basic coverage data and VMM Planner metrics data for use with trend analysis. You use the -trend option to parse and analyze session.xml file to produce a series of trend charts.
Common Report Elements
Coverage data boxes are used throughout the URG report files. These are tables containing one box for each type of coverage.
The HTML version includes color-coded boxes, or boxes left empty if no coverage data for the coverage type represented by the box was collected. For example:

3-91
Unified Coverage Reporting
Figure 3-21 Example of a Coverage Table
In this example, the first box shows the overall score of all metrics. By default, this is the simple average of all the metric percentages. You can control the way the score is computed with the -scorefile option. For more information, see “Grading and the -scorefile Option” in the Coverage Technology Reference Manual.
In this example, URG displays line, condition, toggle, assertion, and group coverage collected. FSM coverage was turned on, but no FSM was found in this region.
The LINE box is green because it falls in the upper range of target values. As shown in Figure 3-22, values display in a range of 11 colors from red (low) to green (high). These colors are graduated every 10 percentage points (with 100 being the 11th class).
Each report file contains a legend showing the cutoff percentages for each color. Each file also contains a common navigation menu at the top. The menu is a simple list of the top-level pages that allow you to go directly to any of the main pages, including the hierarchy, modlist, groups, dashboard, asserts, or tests files.

3-92
Unified Coverage Reporting
Figure 3-22 Color Legend for Coverage Tables
Score tables have more than one row and are sortable by clicking any of the column headings: SCORE, LINE, COND, TOGGLE, TEST, and so on. Note that the hierarchy report does not support sorting, even for contiguous groups of instances under the same parent.
A text version of the report shown in Figure 3-21 is as follows:
SCORE LINE COND TOGGLE FSM ASSERT GROUP
46.15 87.08 40.11 20.24 -- 50.00 33.33
The Dashboard File
The dashboard file (dashboard.html or dashboard.txt) describes the top-level view of all the coverage data including coverage data boxes for the database as a whole. The following is an example of a dashboard report:

3-93
Unified Coverage Reporting
Figure 3-23 Example of a Dashboard Report
Note:- In this example report, the boldface words: dashboard,
hierarchy, modlist, tests, groups, asserts, are hyperlinked to the corresponding top-level files.
- If there is no group coverage information, the groups will not appear in boldface.

3-94
Unified Coverage Reporting
The Hierarchy File
The hierarchy file (hierarchy.html or hierarchy.txt) contains indented lists of all modules, interfaces, and component instances in the design. The indentation corresponds to the design hierarchy, that is, the child modules are indented underneath their parent modules.
The coverage data boxes for each instance in the hierarchy.html file shows the entire coverage information for the subtrees of the instantiation tree. The name of the instance is hyperlinked to its corresponding module in the modN.html page. Each metric in the coverage data box is hyperlinked to the corresponding coverage metric section of the module instance in the modN.html file.
Figure 3-24 displays a partial section of a hierarchy.html page. The data shown is the cumulative coverage information of the entire subtrees at each instance. For example, the coverage shown for MMRk0 is the coverage for that instance plus the coverage for DELAY_MOD and ovac_CHKR.
To see the coverage of instance MMRk0, click MMRk0 to open the coverage report. Notice that the color of a hypertext link changes to red and the score turns red when you hover your mouse on it.

3-95
Unified Coverage Reporting
Figure 3-24 Example of a Hierarchy File
To avoid overwhelming the browser with a single huge HTML file. a hierarchy tree may be broken into multiple pages if the design is very large. When this happens, you can click on 'subtree' to see the elided part of the design.
Figure 3-25 Example of a Hierarchy Broken into Multiple Pages
If an entire subtree in the design has no coverage data, the instances in that subtree will not have links to modN.html page. Although, they will still be shown in hierarchy.html, there will be empty coverage data boxes.
If a particular instance itself has no coverage data, but one of its children does, the instance has a link to a modN.html page. Therefore, you can still traverse through the coverage data in the modN.html page to the children or parents.
3-96
Unified Coverage Reporting
If there is no design coverage information, no hierarchy will be shown. The hierarchy page will not be generated and the hierarchy hypertext link will not appear in boldface.
The Modlist File
The modlist file (modlist.html or modlist.txt) contains a flat list of all modules, entity/architectures, and interfaces in the design. The module (or entity, or interface) names in the HTML file link to the corresponding modN.html page. The entries, without indentation, are similar to those in hierarchy.html, but the labels are module names rather than instance names. The coverage data boxes show the accumulated coverage information for all instances of the module (or entity/architecture, or interface).
Score tables having more than one row are sortable by clicking any column heading: SCORE, LINE, COND, TOGGLE, FSM, ASSERT, and NAME.
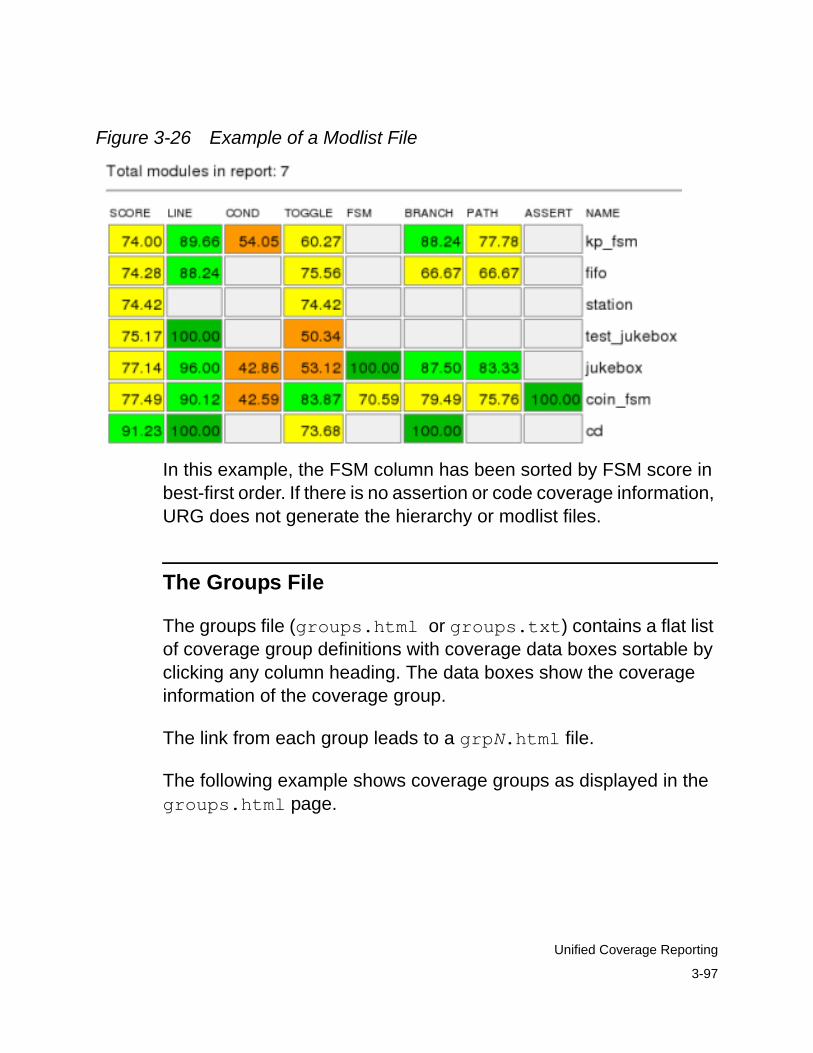
3-97
Unified Coverage Reporting
Figure 3-26 Example of a Modlist File
In this example, the FSM column has been sorted by FSM score in best-first order. If there is no assertion or code coverage information, URG does not generate the hierarchy or modlist files.
The Groups File
The groups file (groups.html or groups.txt) contains a flat list of coverage group definitions with coverage data boxes sortable by clicking any column heading. The data boxes show the coverage information of the coverage group.
The link from each group leads to a grpN.html file.
The following example shows coverage groups as displayed in the groups.html page.

3-98
Unified Coverage Reporting
Figure 3-27 Example of a Groups File
If there is no covergroup coverage data, no groups will be shown and the groups page will not be generated.
The modN File
Each modN.html file contains the summary coverage information for a module, entity/architecture, or interface. Unless the modN.html file has been split for size, it also contains coverage information for each of the instances of the module. If the file is very large or has a large number of instances, the individual data for each instance and the module itself is put in a separate modN_M.html file.

3-99
Unified Coverage Reporting
Each modN.html table has a header section and a coverage data section. The header section contains either the name of a module or a list of self-instances of the module. The self-instances and the coverage metrics are all sortable by clicking any of the headings.
Coverage data boxes are shown for the module summary information and for each of its instances, so you can see the status of each. The coverage data boxes of the self-instances are smaller than that of the module.
Figure 3-28 Example of a Module File
The self-instance hypertext links to the module instance information for each instance. These are the same links as from the hierarchy.html page for each of the instances.

3-100
Unified Coverage Reporting
The module instance sections also have header and coverage data sections. The header is similar to the module header, and it links to the parent instance and to child instances as shown.
Smaller coverage data boxes are used for the module summary information, the parent, and each child of the module instance. The names of each of these data boxes are hyperlinked to the respective module or module instance report.

3-101
Unified Coverage Reporting
Figure 3-29 Example of a Module Instance File
As for all report pages, the coverage data boxes column headings are linked to the corresponding coverage reports. In the above example, clicking on TOGGLE in the column headings opens the toggle coverage report for module instance vitv.HNTO_0.HNJOOVISP_0. These hypertext links provide a convenient way to navigate within a modN.html page, and the only way to view coverage data reports if the modN.html page has been split for size.
3-102
Unified Coverage Reporting
Module with Parameters
URG gives cumulative coverage for all the parameterized instances of a module. If a module has been instantiated twice and parameters are different for each instantiation, then the module coverage gives the overall coverage for all the two instances.
The grpN Files
Each grpN.html page has an outline similar to that of modN.html pages. There is a header for each coverage group showing its name and a list of instances. Both sections have the appropriate data boxes linking to coverage data reports.
Each coverage group report contains a statistics table for both variables and crosses showing the overall coverage for each variable and cross. The header of a group shows the group's name, coverage (both covered and uncovered), goal, and weight, with smaller data boxes for each of its child modules. For example:
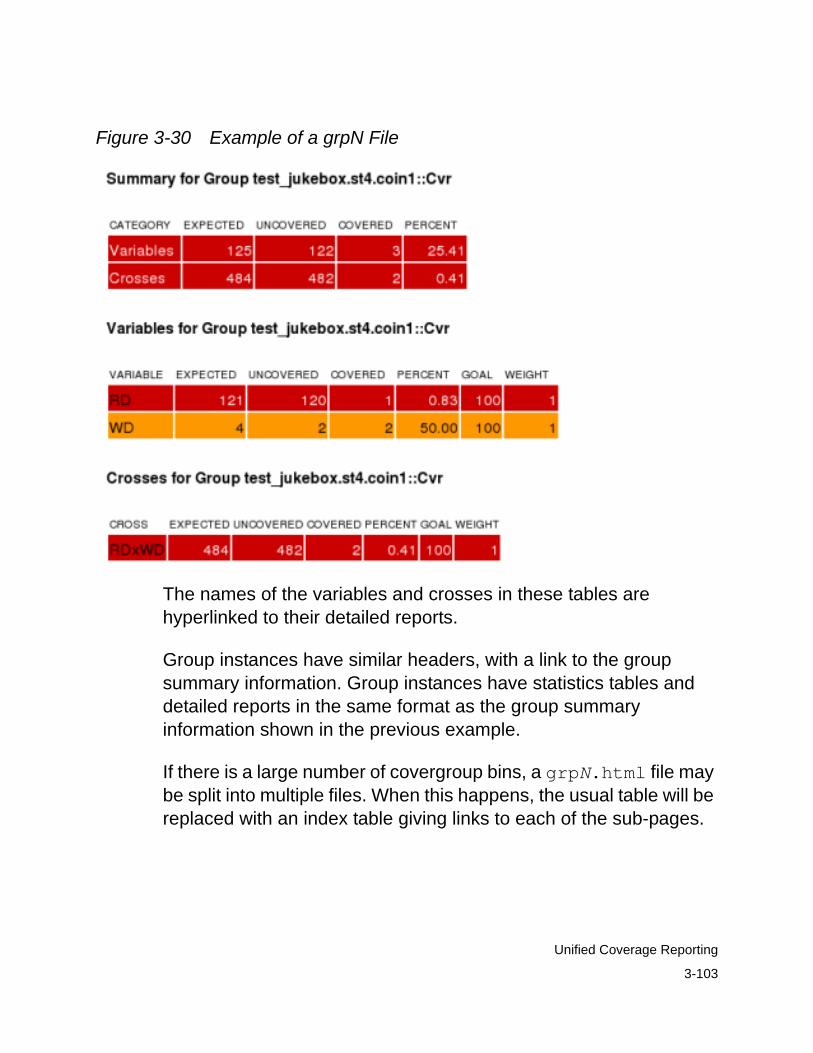
3-103
Unified Coverage Reporting
Figure 3-30 Example of a grpN File
The names of the variables and crosses in these tables are hyperlinked to their detailed reports.
Group instances have similar headers, with a link to the group summary information. Group instances have statistics tables and detailed reports in the same format as the group summary information shown in the previous example.
If there is a large number of covergroup bins, a grpN.html file may be split into multiple files. When this happens, the usual table will be replaced with an index table giving links to each of the sub-pages.

3-104
Unified Coverage Reporting
The Asserts File
The asserts report file (asserts.html or asserts.txt) displays assertions by category and severity as follows:
The Tests File
The tests report file (tests.html or tests.txt) has several different formats depending on if the grading option is applied and what argument is used. The default file format of a tests.html is shown in Figure 3-31.

3-105
Unified Coverage Reporting
Figure 3-31 Example of a Tests File
Analyzing Trend Charts
URG uses raw data from VCS basic coverage data and VMM Planner metrics data to plot trend charts. These trend charts allow you to graphically analyze the data from a number of previous URG sessions. You can combine a set of URG reports created over a span of time and plot their metrics as a time series chart to observe their trend.
Quick Overview
Each URG report contains coverage data and metrics data which constitutes a snapshot of the verification metrics for a single session at a point in time. URG provides trend analysis capability to combine and analyze multiple URG reports. To invoke URG trend analysis, you specify the -trend option with arguments to generate various trend chart reports.
%urg -trend [trend_options]
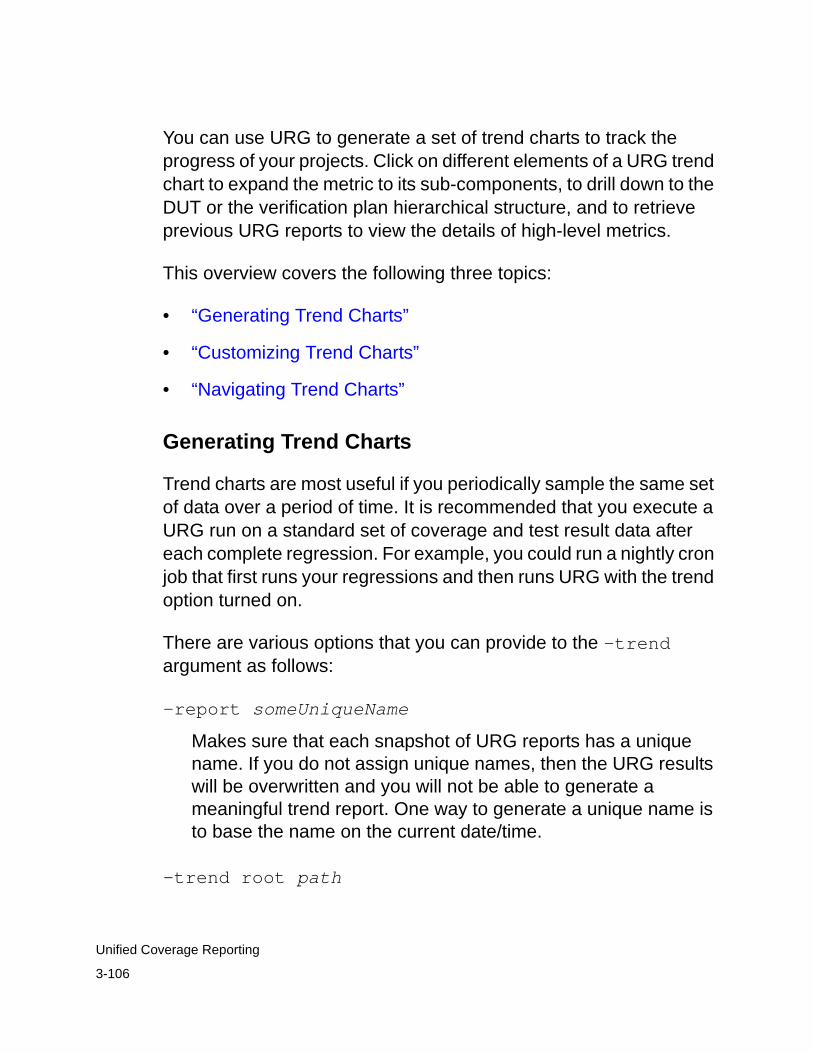
3-106
Unified Coverage Reporting
You can use URG to generate a set of trend charts to track the progress of your projects. Click on different elements of a URG trend chart to expand the metric to its sub-components, to drill down to the DUT or the verification plan hierarchical structure, and to retrieve previous URG reports to view the details of high-level metrics.
This overview covers the following three topics:
• “Generating Trend Charts”
• “Customizing Trend Charts”
• “Navigating Trend Charts”
Generating Trend Charts
Trend charts are most useful if you periodically sample the same set of data over a period of time. It is recommended that you execute a URG run on a standard set of coverage and test result data after each complete regression. For example, you could run a nightly cron job that first runs your regressions and then runs URG with the trend option turned on.
There are various options that you can provide to the -trend argument as follows:
-report someUniqueName
Makes sure that each snapshot of URG reports has a unique name. If you do not assign unique names, then the URG results will be overwritten and you will not be able to generate a meaningful trend report. One way to generate a unique name is to base the name on the current date/time.
-trend root path

3-107
Unified Coverage Reporting
Simplifies specifying which historical URG reports to use for trend charting. With the root option, URG recursively explores the path that you supply to locate all URG reports. If used with -report and unique report names, you need not change the URG command line arguments as new reports are added.
-trend root path rootdepth N
Scan the given root path and subdirectory recursively to find the URG reports. If you do not specify rootdepth, the default depth for N is 1.
-trend rootfile txtfile
Permits enumeration (in a text file) of multiple root paths for scanning.
-trend src report1 [report2 ... ]
Permits enumeration (with the src keyword) of all the URG reports. This option is useful to locate reports stored at different directories.
-trend srcfile txtfile
Permits enumeration (in a text file) of all the URG report paths.
Trend PlotURG automatically generates trend charts by scanning previously saved URG reports to extract metrics data for trend plot. You must specify the path where URG can locate the previous saved reports. Once URG finds the reports, it will extract all the metrics to create a set of trend charts.

3-108
Unified Coverage Reporting
Use the root keyword to specify the root directory where all the snapshots of URG reports are stored. Ideally, this is all you need to do to retrieve default reports. For example:
%urg -trend root urg_report_root_path
When you specify the -trend option on the command-line, URG reports will include a trend tab in the menu bar of trend chart dashboard. See Figure 3-32.

3-109
Unified Coverage Reporting
Figure 3-32 URG Dashboard with the -trend Option
Customizing Trend Charts
At the time URG reports are generated, you can select the maximum level of data details for trend charts.You select the level of chart details using the -trend depth option. It is recommended that you choose the same level of depth to create all URG reports during the project duration. You can customize trend charts using the following command options:
-trend depth number

3-110
Unified Coverage Reporting
Sets the depth number of the DUT instance/HVP feature hierarchy for which URG generates trend charts. The default depth is 1, that is, only the top-level chart is generated. The more levels that you specify, the more you can drill down into the trend reports to find finer-grained details of information. The larger values of number also result in larger URG report sizes and longer runtimes. The report sizes and runtimes grow exponentially with respect to the depth number. See “Trend Chart Linkage” on page 116 for more details. A command-line example follows:
%urg -dir wishbone.vdb -plan wishbone.hvp -trend root path depth 3
URG can also display curves with different line styles on the chart, for example, solid, dash, and so on. Different line styles are useful for printing on a monochrome printer. See the -trend linestyle option for more details. You should use the same value of depth for all URG reports to create a trend series, otherwise there may be gaps in the data on the trend charts.
-trend linestyle
Displays a different line style (solid line, dashed line, and so on) for each curve on the trend chart, particularly useful for black-and-white printing. Refer to Figure 3-34 for a chart with various line styles as compared to Figure 3-33 without different line styles. In Figure 3-34, not only has each line a distinct color, but also a unique line style. The line styles are automatically selected by internal line style palette. A command-line example follows:
%urg -dir wishbone.vdb -plan myplan.hvp -trend root path linestyle
-trend offbasicavg

3-111
Unified Coverage Reporting
Turns off basic coverage curves and displays only VMM Plan related score curves. For example:
%urg -dir wishbone.vdb -plan myplan.hvp -trend root path offbasicavg
With the -offbasicavg option, URG displays only the Plan Average curves without the Basic Average curves on the chart. This option is useful to avoid cluttering trend charts.
Note:The Basic Average consists of the raw Synopsys built-in coverage metrics (Line, Cond, FSM, Toggle, and Branch) and the two functional coverage metrics (Assert and Group). The Plan Average consists of the Synopsys seven built-in coverage metrics score captured by the VMM Verification Plan.
To manipulate the timestamp of the current URG report session, set the URG_FAKE_TIME environment variable. You must set this variable before using the urg command. The format of the variable is mm-dd-yyyy hh:mm:ss.
For example, in a C shell, you set the timestamp variable as follows, providing the “fake” value:
setenv URG_FAKE_TIME "11-16-2007 10:20:30"
To suppress the generation of the session.xml in the URG report, set the URG_NO_SESSION_XML environment variable. You should suppress session.xml if you want to prevent the current URG report from affecting future trend analysis.
For example, in a C shell, you suppress session.xml as follows:
setenv URG_NO_SESSION_XML
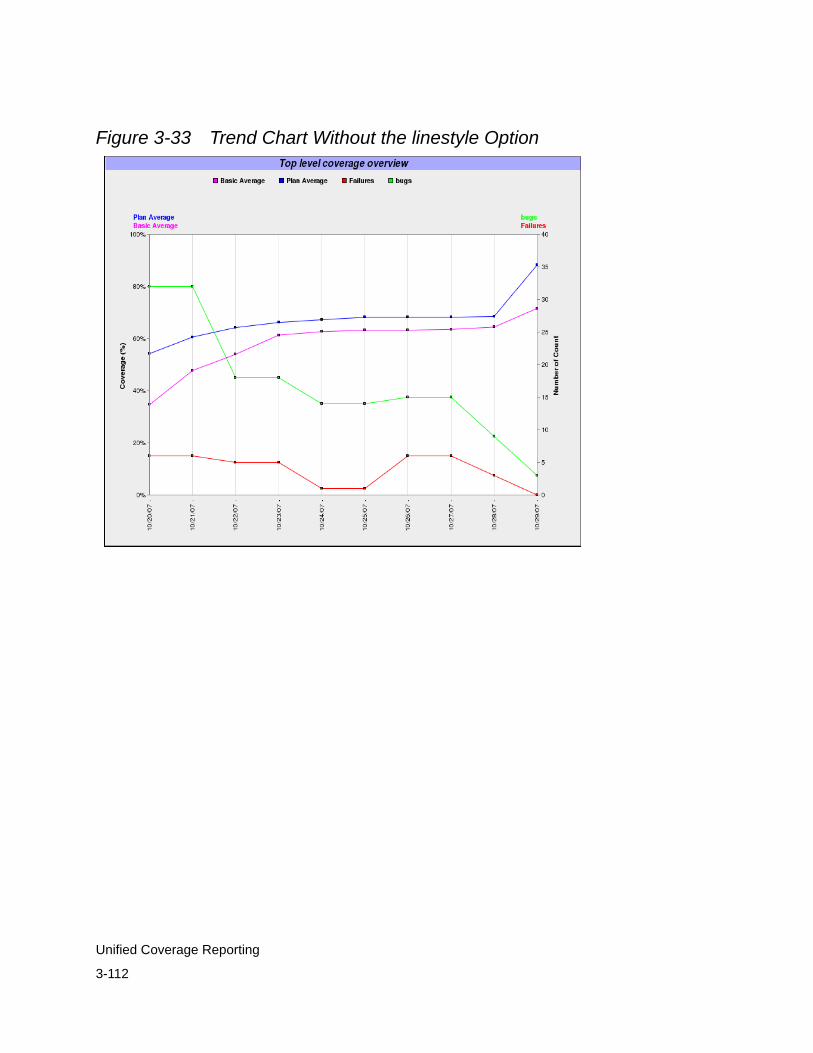
3-112
Unified Coverage Reporting
Figure 3-33 Trend Chart Without the linestyle Option

3-113
Unified Coverage Reporting
Figure 3-34 Trend Chart with the linestyle Option

3-114
Unified Coverage Reporting
Figure 3-35 Top-level Trend Chart Using the offbasicavg Option
Navigating Trend Charts
URG includes the capability to navigate from one trend chart to another trend chart or to a URG report. You use a web browser to view trend charts. URG uses hyperlinks to link one graphical user interface, such as an element in trend charts to some section of information in URG reports.
URG trend charts provide the following three types of hyperlinks:
1. Legend label hyperlinks above the y-axes link to metric-wise detailed charts.

3-115
Unified Coverage Reporting
2. Curve hyperlinks on a trend chart link to instance-wise or feature-wise hierarchical sub-level charts.
3. Session date hyperlinks of the x-axis link to older URG reports used to generate the data points on a trend charts.
The next section describes in more details the behavior of these various links.
In addition to hyperlinks, URG trend charts show graphical user interface elements like tooltips where appropriate. You hover the cursor over an element on a trend chart, without clicking it, and a small box appears with supplementary information regarding the element. Tooltips allow supplementary information to be annotated to the chart without cluttering it since only one tooltip can be displayed at a time. URG provides the following tooltips usage:
• The tooltips for curves display the metric name and score of the point for each curve. In addition, if the curve is clickable, the tooltip shows the next chart that you can see by clicking the label. For example:
78.1% - Basic raw coverage score curve90.5% - Click to see feature-wise subhierarchy breakdown for Plan Average Score
• The tooltips for the legends above y-axis show the next chart that you can see by clicking the label. For example:
Click to see metric-wise basic coverage breakdown chart
• The tooltips for the x-axis date labels show the exact date and time in mm/dd/yyyy hh:mm:ss format and the name of the URG report for each session.

3-116
Unified Coverage Reporting
Notice that each x-axis date label displays the date of each session in mm/dd/yyyy format without a time. If the number of sessions increases, URG shows only the “-” character instead of the date for each session.
Trend Chart Linkage
The approach to view coverage and VMM Verification Plan information is to start from high-level aggregated results down to low-level more specific information and data. If the -trend option is given, URG generates a top-level chart that makes a natural starting point for exploring trend information.
Many of the linkage paths are hierarchical, although the chart linkage does not need to be strictly hierarchical. There are two main hierarchies to consider: metric-wide and design-wide. The metric-wide hierarchy breakdown expands metrics into their sub-metrics. The design-wide hierarchy is simply the DUT hierarchy for Basic Average or the verification plan feature hierarchy for all other VMM Plan metrics. This section covers the following five topics:
• “Organization of Trend Charts”
• “Top-Level Chart”
• “Metric-Wide Breakdown Linkage”
• “Hierarchical Linkage”
• “Links to Previous Sessions”

3-117
Unified Coverage Reporting
Organization of Trend Charts
One HTML page displays one or more chart images. All other charts can be accessed from the top-level chart by clicking on curves or legend labels to drill down on the metric-wide or design-wide hierarchy. Figure 3-36 shows a diagram that illustrates the URG trend chart organization:
Figure 3-36 Trend Chart Hierarchy
Top chart flavor breakdown
flavor breakdownsub-metric wide breakdown chart
Click legend
DUT hierarchy 2nd level chart
HVP hierarchy 2nd level chart
DUT instance
DUT instance
DUT hierarchy 3rd level chart
DUT instance
DUT instance
HVP hierarchy’ 3rd level chart
Click BasicAverage Curve
Click PlanAverage Or userdef metric Curve
Click curve
Click curve
flavor breakdown
flavor breakdownsub-metric wide
breakdown chart
Click legend
flavor breakdown
flavor breakdownsub-metric wide
breakdown chart
Click legend
flavor breakdown
flavor breakdownsub-metric wide breakdown chart
Click legend
flavor breakdown
flavor breakdown
flavor breakdown
Click legend
Default pages
Generated when-hvp is given HVP hierarchy
2nd level chartHVP hierarchy 2nd level chart
Generated when-dir is given
Generated when -plan is given
Default pages
Generated when -dir is given
Top-Level Chart
URG displays a top-level chart when you select the trend tab in the menu bar from a URG report (see Figure 3-32). It shows the raw coverage metric score which is called the Basic Average score by

3-118
Unified Coverage Reporting
default. If you use the -plan option, URG will display the top-level VMM Plan Average score, the Failures for tests.fail metric, and other user-defined metrics such as bug count.
If you do not use the -plan option, the top-level chart will simply display a single line charting of the basic raw coverage average.
Although it seems redundant to include both the top-level raw coverage and the top-level VMM Plan coverage score on the same chart, yet you can use both information to perform basic sanity checks to ensure that your verification plan correlates sensibly with the raw metrics. You can turn off the Basic Average coverage display by specifying the -trend offbasicavg option.
In Figure 3-37, the top-level trend chart contains four metric legends:
- the Plan Average legend for VMM Plan coverage score.
- the Basic Average legend for raw coverage.
- the bugs legend for user-defined metric bug count.
- the Failures legend for test failure count.
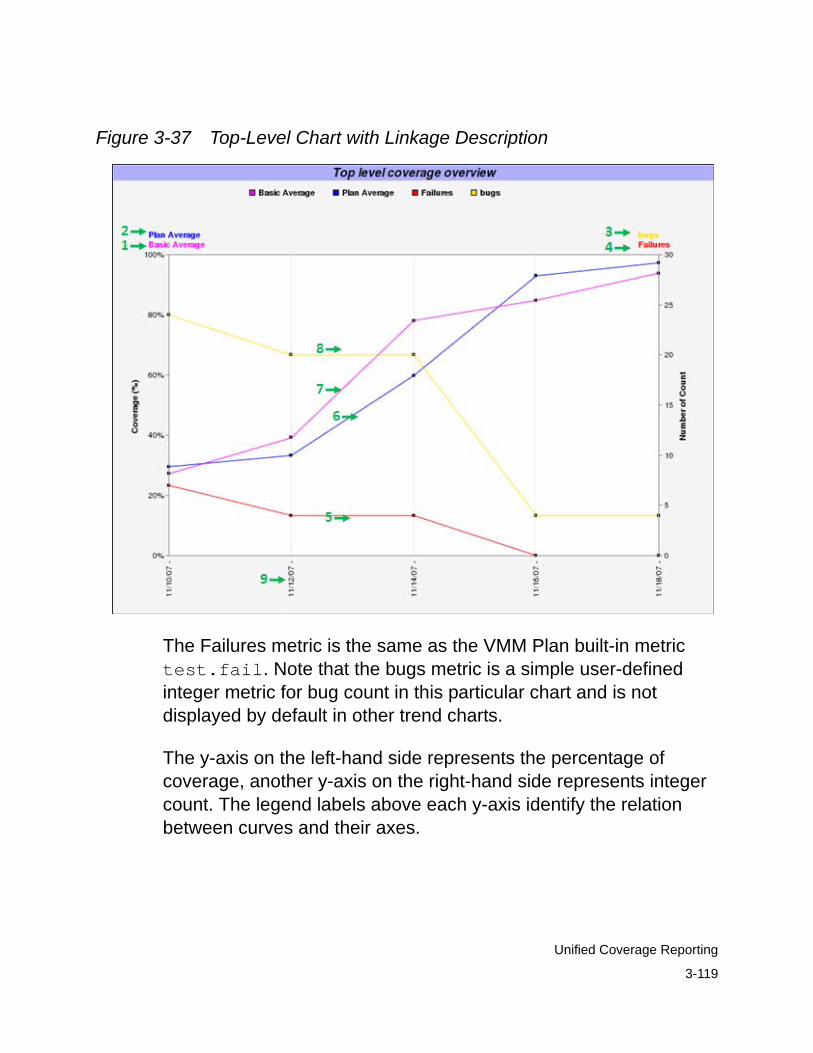
3-119
Unified Coverage Reporting
Figure 3-37 Top-Level Chart with Linkage Description
The Failures metric is the same as the VMM Plan built-in metric test.fail. Note that the bugs metric is a simple user-defined integer metric for bug count in this particular chart and is not displayed by default in other trend charts.
The y-axis on the left-hand side represents the percentage of coverage, another y-axis on the right-hand side represents integer count. The legend labels above each y-axis identify the relation between curves and their axes.
3-120
Unified Coverage Reporting
The Failures legend in Figure 3-37 represents the test.fail count. The Failures legend links to other enumerated scores in the test metric, such as total test count, test.pass, test.warn, and so on.
The metrics that have the same type of values (for instance, test.fail and the bugs metric integer values) share the same axis. If the score values of metrics vary over a wide range, the curves might not reflect the trend well because the metric with a lower range will be compressed due to the need for a higher range of y-axis.
Metric-Wide Breakdown Linkage
To view the complete breakdown chart of a metric, click a metric legend label above either of the y-axes. In Figure 3-37, the legend labels at the top of the y-axis are metric-wide breakdown chart links (Group, Assert, Cond, and Line). The Basic Average and Plan Average breakdown charts show the components that comprise the average score.
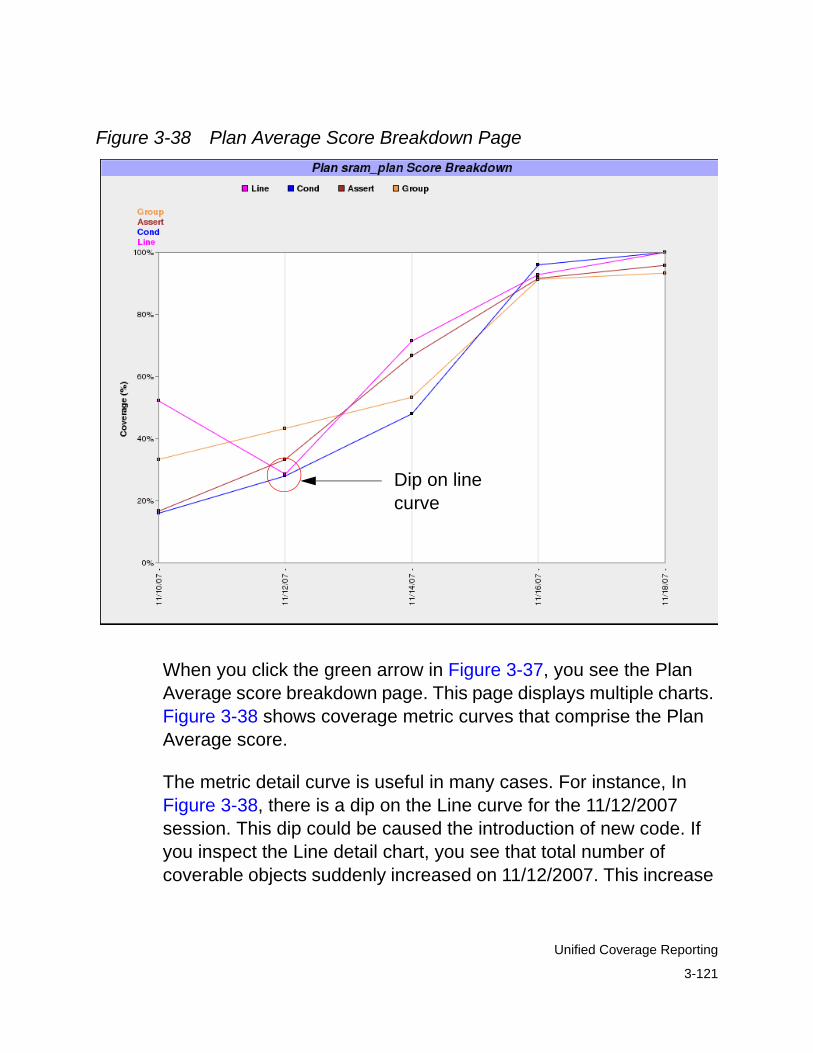
3-121
Unified Coverage Reporting
Figure 3-38 Plan Average Score Breakdown Page
Dip on line curve
When you click the green arrow in Figure 3-37, you see the Plan Average score breakdown page. This page displays multiple charts. Figure 3-38 shows coverage metric curves that comprise the Plan Average score.
The metric detail curve is useful in many cases. For instance, In Figure 3-38, there is a dip on the Line curve for the 11/12/2007 session. This dip could be caused the introduction of new code. If you inspect the Line detail chart, you see that total number of coverable objects suddenly increased on 11/12/2007. This increase

3-122
Unified Coverage Reporting
in coverable objects caused the drop of Line coverage score. The metric detail curve allows you to compare the goal and the real score in one chart. According to the chart, the Line score started meeting the goal on 11/16/2007.
Figure 3-39 and Figure 3-40 show each metric’s details, including the total coverable points curve and goal curve (if they exist).
Figure 3-39 Line Metric Detail for Plan Average Breakdown
In Figure 3-39, the three curves represent the Line Coverage score, the Goal of the line metric, and total number of Coverable Points, respectively.

3-123
Unified Coverage Reporting
Figure 3-40 Group Metric Detail for Plan Average Breakdown
In Figure 3-40, there is no curve for the total number of coverable objects because the group coverage metric is not a ratio type, but rather is a percentage type. If you have not specified a goal for the metric, URG does not create goal curve.
If there are other enumeration types of user-defined metrics in the verification plan, their legend label hyperlinks operate the same way as described in this section.

3-124
Unified Coverage Reporting
Figure 3-41 Failure Breakdown Chart
Notice that curves for instances such as test.unknown and test.assert may not be visible on a trend chart. It is because they have zero values throughout the time span of trend analysis and are therefore not interesting.
If a verification plan has several user-defined metrics, all of the metric curves are plotted on the top-level chart. Each hyperlink of the user-define metric curves links to feature-wide sub-level chart. Also, if any of the user-defined metrics is an enumeration type, the hyperlink on legend label links to the enumeration breakdown chart the same way as the hyperlink does for test.fail label.

3-125
Unified Coverage Reporting
Each breakdown chart such as the Basic Average, the Plan Average, or the Failures, is a leaf node chart. Therefore, there is no more linkage either on legend labels or curves to additional charts except for the session timestamp labels on the x-axis.
Hierarchical Linkage
You can view subhierarchy charts by clicking individual curve on a top-level chart. Take Figure 3-37 for an example, the green arrows 5, 6, 7, and 8 are subhierarchy chart hyperlinks. Each curve displays the trend of a metric and is color coded to match the metric legend it represents. Figure 3-37 displays:
- the Basic Average curve of raw coverage DUT instance hierarchy. It is clickable if you specify the -dir covdb option to generate the URG reports and the depth value is at least two or higher.
- the Plan Average curve of VMM Plan feature subhierarchy. It is clickable if the depth value is at least two or higher.
- other metric curves of VMM Plan feature subhierarchies. They are clickable if the depth value is at least two or higher.
For example:

3-126
Unified Coverage Reporting
Figure 3-42 Plan Average Feature Hierarchy Chart
Click the Basic Average legend (the green arrow 1 in Figure 3-37), which links to the chart of raw coverage score as shown in Figure 3-42. The top.wb_dma_test_top.dut instance contains five sub-instances. You can drill down one more level by clicking any individual curve to view the sub-instance chart. Further, the legend labels are also clickable to view the flavor breakdown charts of this average coverage score.
The hierarchy levels of charts are determined by the value of depth you specify with the -trend depth option. As you increase the depth value, the exponential increase in chart number lengthens URG runtime and takes up disk space. Therefore, it is recommended that you use a depth value of 4 or less.

3-127
Unified Coverage Reporting
Figure 3-43 VMM Plan Hierarchy Chart for Plan Average Score
Click the Plan Average legend (the green arrow 2 in Figure 3-37), which links to the chart of coverage score curves for each sub-feature as shown in Figure 3-43. Each curve is clickable if you specify the -trend depth <number> argument with a value of 2 or higher and there are indeed VMM Plan subhierarchies available. The legend labels above the y-axis are also clickable for flavor breakdown charts.
Other VMM Plan metric curves on the top chart are also clickable if their sub-features exist and the -trend depth <number> argument is large enough.

3-128
Unified Coverage Reporting
If you do not invoke URG with the -plan option, you will not see VMM Plan subhierarchy charts. Instead, you will only see the top-level chart which contains raw coverage data.
Links to Previous Sessions
The session date labels on the x-axis of a trend chart are clickable. You can use these links to view the URG report dashboard pages for previous sessions. If the number of sessions is too large to display clearly, the date labels for some sessions might be replaced with the “|” character to avoid text overlay. The tooltip of the “|” label shows the timestamp, and is clickable.
If the current URG report is located under the same trend root directory as other URG session reports, then the URL to the other session is a relative path, such as ../../urgReport_session_N/dashboard.html. Therefore, this hyperlink works even if you move the whole trend root directory to another path or you access the URG report from a Windows disk mount.
On the other hand, the hyperlink URL is based on the absolute UNIX path. In this situation, the hyperlink cannot be resolved.
4-129
Unified Coverage Reporting
4Viewing Coverage Reports Using the DVE Coverage GUI 1
This chapter contains the following section:
• “Starting the DVE in Coverage Mode”
• “Using the Coverage GUI”
• “Displaying Code Coverage”
• “Displaying Assertion Coverage”
• “Displaying Testbench Coverage”
• “Working with HVP Files”
• “Working with Coverage Results”
• “Generating URG Report from DVE Coverage GUI”

4-130
Unified Coverage Reporting
Starting the DVE in Coverage Mode
To start the VCS in coverage mode, enter the dve command with a coverage command line options as follows:
-cov
Opens the DVE Coverage GUI.
-dir <dir>
Opens the coverage database in the given directory.
-f <file>
Opens the coverage directories listed in the given file.
-tests <file>
Opens coverage tests listed in the given file.
-show availabletests
Lists the available tests for the given design.
-assert minimal
Reports only modules and instances which have assertion in assertion coverage. Code coverage database can not be loaded with this option.
Opening a Database
In DVE, you can open one of the three types of coverage databases to display coverage information.

4-131
Unified Coverage Reporting
You can select one of the following kinds of databases:
• A code coverage directory (by default named simv.vdb by VCS).
• An OpenVera or SystemVerilog assertions database directory (by default named simv.vdb by VCS).
• A testbench (by default named simv.vdb) directory containing testbench coverage files.
Note:DVE can load only one design database directory at a time.
To open a coverage database
1. Click File > Open Database.
The Open Coverage Database dialog box appears.

4-132
Unified Coverage Reporting
Figure 4-1
2. Click the Browse button below the Design hierarchy/testbench location field to locate and specify the design hierarchy/testbench location.

4-133
Unified Coverage Reporting
3. Click the Metrics drop-down list to select the metrics you want to include.

4-134
Unified Coverage Reporting
4. Click the More Options tab and select the desired coverage reporting options.
5. (Optional) Click any of the following buttons above the test directories list box to add and remove the directory:
- Adds a test directory.
- Adds the test files.

4-135
Unified Coverage Reporting
- Deletes a selected item from the list.
6. Select tests to manage one or more test files from the Available tests list box.
- Displays a dialog box for selecting a filter file.
- Toggles enabling and disabling of a filter file.
- Selects all tests in the list. If you select more than one test file, the results of the tests are merged.
- Clears all files in the list.
If you select more than one test file, the results of the tests are merged. Note that you can also check and clear tests in the list.
7. Accept the default name or enter a new name for the test results.
8. Click OK.
The DVE coverage windows are populated with coverage information.

4-136
Unified Coverage Reporting
Figure 4-2
Main Coverage Table Window
Navigation paneConsole Window
Loading Multiple Coverage Tests Incrementally
You can interactively load many coverage tests and merge them interactively in the DVE Coverage GUI.
As per the previous behavior, if you select two tests and load them in the DVE Coverage GUI, the two tests are merged into a single test. If you want to load another test (3rd test), you will have to close the currently loaded database, then reopen the database and select all the three tests to load them.

4-137
Unified Coverage Reporting
With the incremental loading feature, you can re-open the Open Database dialog box and select the third test, load it, and merge it together with the previously merged tests. Thus, you save your time to close, re-open, and merge the database.
To load multiple tests
1. Select File > Open database.
The Open Coverage Database dialog box appears.
1 2
2. Click the left icon from the Test directories field (indicated as 1 in the figure) to add a test path.

4-138
Unified Coverage Reporting
3. Repeat Step 2 to add multiple test, if required.
4. Click the right side icon from the Test directories field (indicated as 2 in the figure) if you have a file with test paths.
You can either perform step 2 or 3, or both to add the test directories.
5. Specify the test path in the Tests to Open field.
The tests are listed under the Test Name area.
6. Select or clear the check boxes against the test you want to open for the given design.
7. (Optional) Type the strings to filter the test in the Test filter field.
8. Click OK to open the databases.
Note:• This feature is supported only for XML-based coverage database.
• While loading the test incrementally, you can not change the Design Hierarchy and Metrics.
Loading and Saving Sessions
This section describes how to save a session and load a previously saved session.
Saving a Session
You can save all session data or arrangement of windows, views and panes for later reuse.

4-139
Unified Coverage Reporting
To save a session
1. Select File > Save Session
The Save Session dialog box appears.
2. Select one of the following:
- Save all session data including window layout, the current view and its contents, and coverage databases.
- Save the arrangement of windows, views, and panes.
3. Enter a file name.
4. Click Save.
The session is saved as a Tcl file for future use.
Loading a Session
To load a previously saved session
1. Select File > Load Session.
The Load Session dialog box appears.
2. Browse to a previously saved DVE session file (.tcl), then select the file.
When you select a session file, the right pane displays information on the session file.
3. Click Load.
The session is loaded.

4-140
Unified Coverage Reporting
DVE Coverage Source / Database File Relocation
If you change the location of a coverage file, and then attempt to load that file with DVE, DVE displays a dialog asking you to provide the new location of the file.
After you provide DVE with the new location of the file, DVE subsequently uses both the built-in location and the new location information you have provided.
Moreover, DVE compares the two locations to make a more intelligent attempt at locating the file.
For example, assume that the location of a file foo.v (as specified in the coverage database) is as follows:
/A/B/C/foo.v
But assume that you moved the file to this location, which you provided to DVE:
/X/Y/C/foo.v
Thereafter, DVE compares these two locations and, working from right to left, determines that the following location is the new root directory for design files is as follows:
/X/Y
Assume now that DVE performs a search for the following file, based on database information:
/A/B/E/bar.v

4-141
Unified Coverage Reporting
Instead of looking in /A/B, DVE searches in /X/Y, the correct location of this file:
/X/Y/E/bar.v
If DVE cannot find the file using the default location, then DVE displays a dialog asking for the correct location of the file.
Note:DVE can only remember one root location directory at a time. DVE replaces any earlier root location directory with whichever new location you specify.
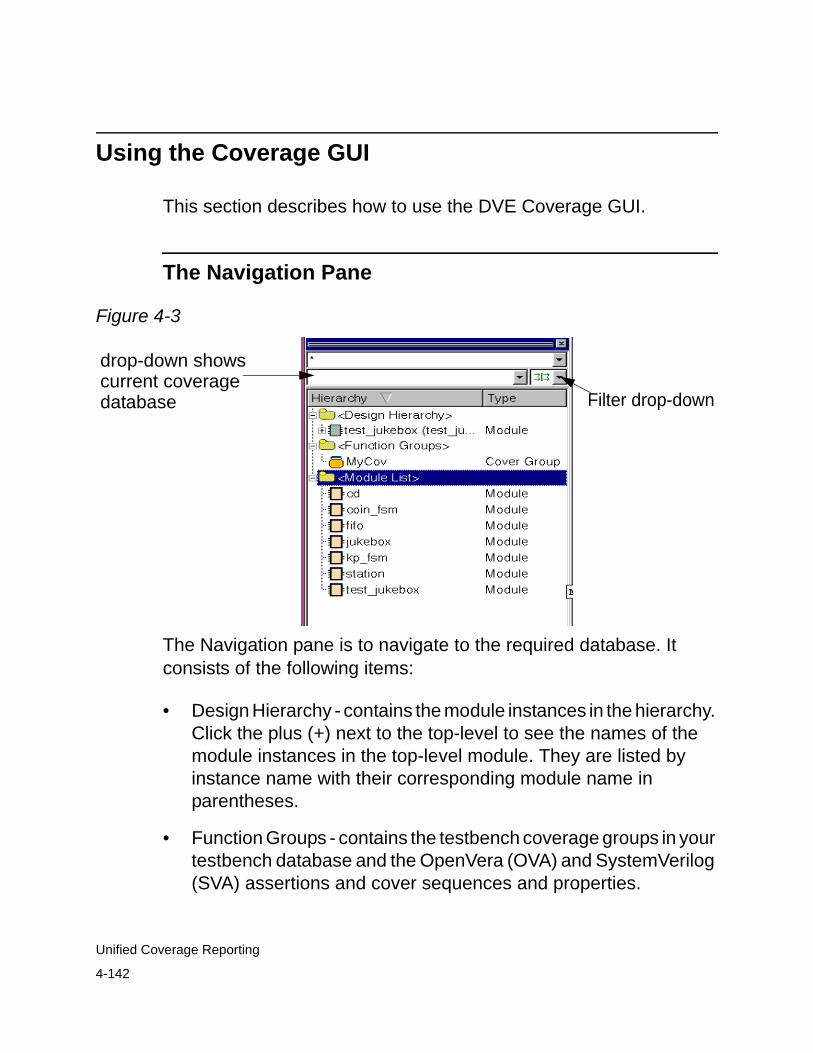
4-142
Unified Coverage Reporting
Using the Coverage GUI
This section describes how to use the DVE Coverage GUI.
The Navigation Pane
Figure 4-3
drop-down shows
Filter drop-down current coverage database
The Navigation pane is to navigate to the required database. It consists of the following items:
• Design Hierarchy - contains the module instances in the hierarchy. Click the plus (+) next to the top-level to see the names of the module instances in the top-level module. They are listed by instance name with their corresponding module name in parentheses.
• Function Groups - contains the testbench coverage groups in your testbench database and the OpenVera (OVA) and SystemVerilog (SVA) assertions and cover sequences and properties.

4-143
Unified Coverage Reporting
• Module Lists - lists all the module definitions in the design
• Text drop-down - shows the list of the coverage databases that you have loaded recently. If you want to load another database, you must close the database using the "Close Database" option in File menu.
• Filter drop-down - maintains a history of previously applied filters. You can see the history and select a filter to apply.
The Coverage Summary Table Window
Figure 4-4
The Main Coverage Table window gives you summary information for each type of coverage. For example, Figure 4-5 shows the details for lines covered.
To view the coverage details, select a cell and click View > Show Values.

4-144
Unified Coverage Reporting
The coverage detail appears as follows;
Figure 4-5
Total lines covered Total lines uncovered
Percentage of lines covered.
The Coverage Table window contains the following fields and options:
Show
Specifies the following options;
Functional Groups
Displays results by user defined groups including total score and scores for cover directive and covergroup coverage.
Instances
Displays results by module instances and their total coverage score and individual scores for line, condition, FSM, and toggle coverage. There is a row for each module instances (click the plus (+) to the left of the top-level module to see the instances under it). A plus down the design hierarchy indicates new instances to be revealed.
Modules
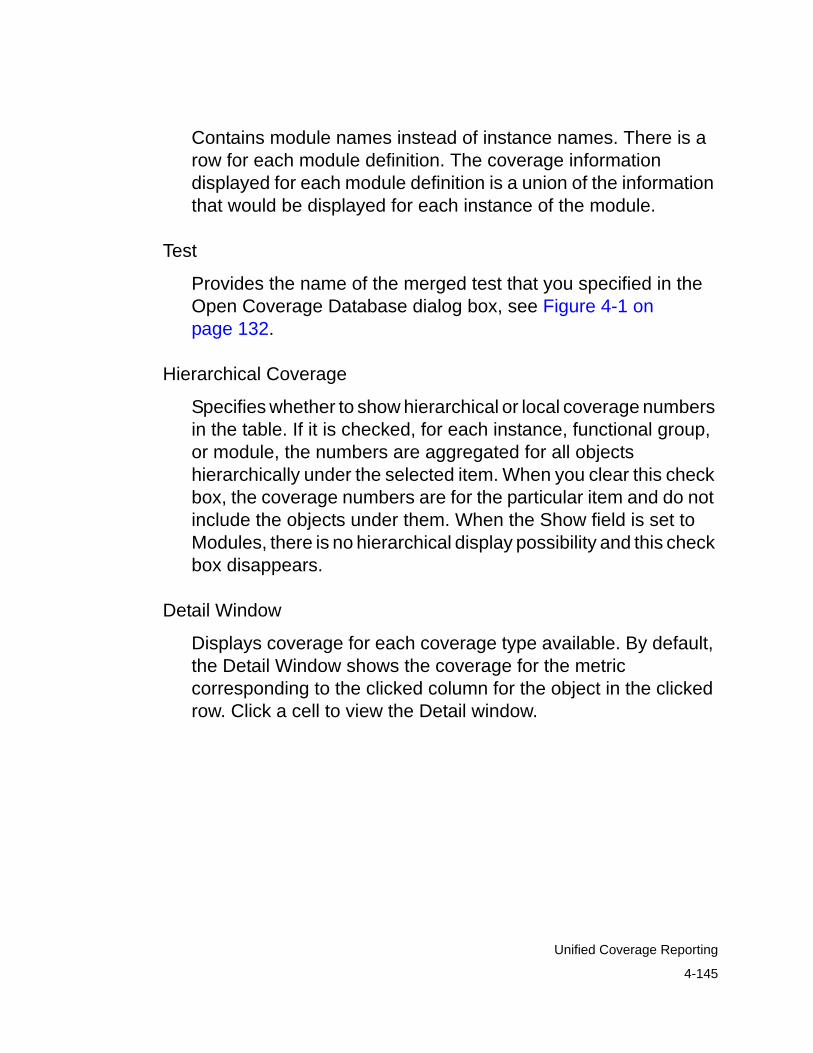
4-145
Unified Coverage Reporting
Contains module names instead of instance names. There is a row for each module definition. The coverage information displayed for each module definition is a union of the information that would be displayed for each instance of the module.
Test
Provides the name of the merged test that you specified in the Open Coverage Database dialog box, see Figure 4-1 on page 132.
Hierarchical Coverage
Specifies whether to show hierarchical or local coverage numbers in the table. If it is checked, for each instance, functional group, or module, the numbers are aggregated for all objects hierarchically under the selected item. When you clear this check box, the coverage numbers are for the particular item and do not include the objects under them. When the Show field is set to Modules, there is no hierarchical display possibility and this check box disappears.
Detail Window
Displays coverage for each coverage type available. By default, the Detail Window shows the coverage for the metric corresponding to the clicked column for the object in the clicked row. Click a cell to view the Detail window.

4-146
Unified Coverage Reporting
The Coverage Summary Map Window
Use the Map window for a quick view of the overall coverage results. The map window tabs displays results in customizable color-coded ranges to help identify coverage areas of interest and overall progress. Figure 4-6 shows a coverage map and the default color key and range.
Figure 4-6
You can change the root of the map by dragging and dropping a functional group, instance, or module from any other window.
4-147
Unified Coverage Reporting
Drill down into the view by selecting a rectangle. Double-clicking the selected rectangle changes the view to display its children.
The Coverage Detail Window
The Coverage Detail Window displays:
• The source file with annotations indicating covered and uncovered lines or objects.
• The Coverage Detail tabs where you select the coverage type to view.

4-148
Unified Coverage Reporting
Figure 4-7 Covered Uncovered
Default coverage state
Ports, variables, and signals
Navigating in the Source Pane
Use the navigation bands in the Source pane to view coverage results for the source code. The bands are color coded to display the coverage range. To navigate to an area of interest, click on a band to display the color coded source line.

4-149
Unified Coverage Reporting
Note:When viewing annotated data, DVE requires the original source files to be unaltered since compilation.
Figure 4-8 Click a band to display corresponding code.
Creating User-Defined Groups
You can create and modify user-defined groups to organize and navigate to your functional coverage elements such as covergroups and assert/cover statements.
To create a user-defined covergroup
1. Click Edit > Create/Edit User Defined Groups.
The User Defined Group dialog box appears.
Covergroups and assertions in your project are listed in the left pane.
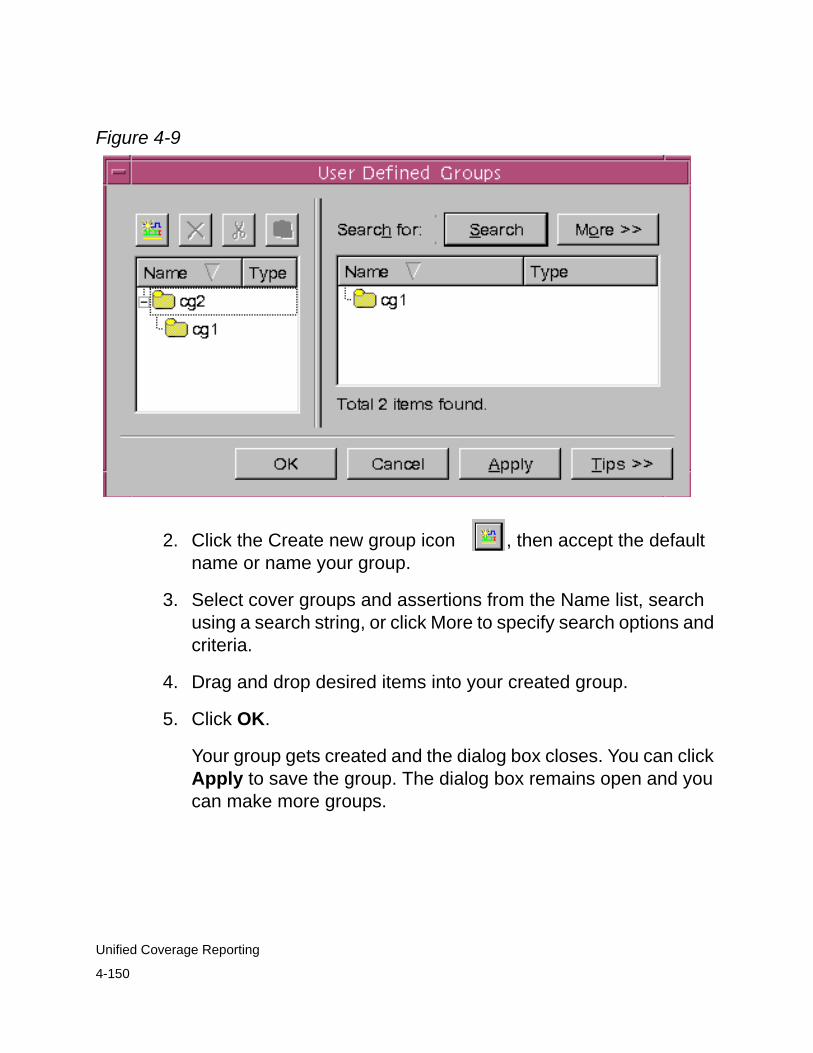
4-150
Unified Coverage Reporting
Figure 4-9
2. Click the Create new group icon , then accept the default name or name your group.
3. Select cover groups and assertions from the Name list, search using a search string, or click More to specify search options and criteria.
4. Drag and drop desired items into your created group.
5. Click OK.
Your group gets created and the dialog box closes. You can click Apply to save the group. The dialog box remains open and you can make more groups.

4-151
Unified Coverage Reporting
Displaying Code Coverage
Displaying Line Coverage
The Line Coverage Detail window displays annotated source code and coverage percentage for total block and statement coverage.
Figure 4-10
• The Annotated source window allows you to view the source files annotations that shows you which code has and has not been covered. The highlighted colors can be changed using the Colors tab in the Preferences dialog box as described in the section “Setting Display Preferences” . Color banding adjacent to the scroll bar aid in navigating the code. Figure 4-7 shows the Source Window with annotations, and the default annotation colors.

4-152
Unified Coverage Reporting
• The Detail Window for line coverage displays metrics for coverage of blocks and statements. A block of code is a group of statements that always will be executed together.
This display tells you how much of your code is actually executed by the tests. The number of covered and uncovered lines give you the information you need to write the tests to complete the coverage.
• Use the Shown for drop-down to look at the coverage of other instances or module variants corresponding to the current instance or module.
Displaying Toggle Coverage
This section describes toggle coverage and contains the following sections:
• “Nets and Registers”
• “Multi-Dimensional Arrays”
Nets and Registers
The Details Window Toggle tab, shown in Figure 4-11, displays results for each net and register for any value transition from 0 to 1 and 1 to 0.
The Annotated Source window displays nets and registers hightlighted in colors indicating their coverage range as shown in the figure.

4-153
Unified Coverage Reporting
Use the Shown for drop-down to look at the coverage of other instances or module variants corresponding to the current instance or module.
Metrics for total coverage of nets and registers tell you how much activity is occurring on all the elements, thus giving you a clear indication of how much testing is actually being performed at the gate. The Variable column identifies the nets and registers and expands to display each bit in a register.
An up arrow indicates the coverage of a toggle from 0 to 1, and a down arrow indicates coverage for a toggle from 1 to 0. The arrow is colored green if the toggle is covered and red if it is uncovered. The column displays the total number covered and uncovered in the design and the coverage percentage.
In the following example, the register S2(0:10)) has been expanded to display results for each of the bits. The Display column indicates covered possible transitions for the register with pairs of up-down arrows and each bit’s two transitions are shown.

4-154
Unified Coverage Reporting
Figure 4-11 Toggle Detail Window
Annotation ranges
Expanded register results
Total number and percentages covered and uncovered
Covered and uncovered transitions
Multi-Dimensional Arrays
Multi-dimensional arrays (MDAs) are displayed as toggle signals. The top level toggle signal is named with all its indices. Its value are

4-155
Unified Coverage Reporting
a contiguous string of values of all its leaf level words.
The top level MDA is expandable to its next level of indices just like a vector. Each of the MDA's layers will be expandable until the bit level. Just like that for a vector, the coverage information of each layer of the MDA consists of coverage for 0->1 and 1->0 transitions.
The cumulative score of each layer in MDA is determined by calculating the covered/total bits in that MDA layer.
Tooltip on the coverage graphic indicates the bit name on which the mouse is pointed.
• A green arrow indicates covered.
• A red arrow indicates uncovered.
• A grey arrow indicates excluded bit.
The top level MDA, any mda layer in the middle, the word and bits - any of these may be excluded.
In the Type column, identifier MDA indicates that it may be expanded into multiple layers.
Displaying Condition Coverage
The Condition Detail Window helps you monitor whether both true and false states of the conditional expressions and sub-expressions in your code are covered.

4-156
Unified Coverage Reporting
• The Condition list expands to show coverage by possible vectors or subconditions, percent coverage, and the line number of the expression. By default, condition coverage only lists sensitized vectors. For more information about sensitized vectors or how to monitor coverage of all vectors, see the Coverage Technology Reference Manual.
• The right pane displays the selected expression above with possible conditions and their coverage status below.
• Use the Show drop-down to look at the coverage of other instances or module variants corresponding to the current instance or module.
Figure 4-12 shows condition results for a simple expression.
Figure 4-12 Condition Detail Window
Selected conditional expressionExpression coverage totals and line numbers
Viewing Condition IDs
To view the condition IDs, select View > Show Condition IDs. The condition IDs are displayed in the Detail window as follows:

Condition IDs are displayed
4-157
Unified Coverage Reporting
The display of condition ID is supported only with the New Unified Database flow.
DVE Coverage with Condition Coverage Observability
The observability feature is used to find out the situations where a certain part of the combinational circuit is controlling (and hence observable) the primary output of the combinational circuit. Certain vector combination of a subexpression is marked as covered only if that combination is controlling the primary output in the context of the whole expression.
You can enable the observability based condition coverage using the -cm cond -cm_cond obs compile option.
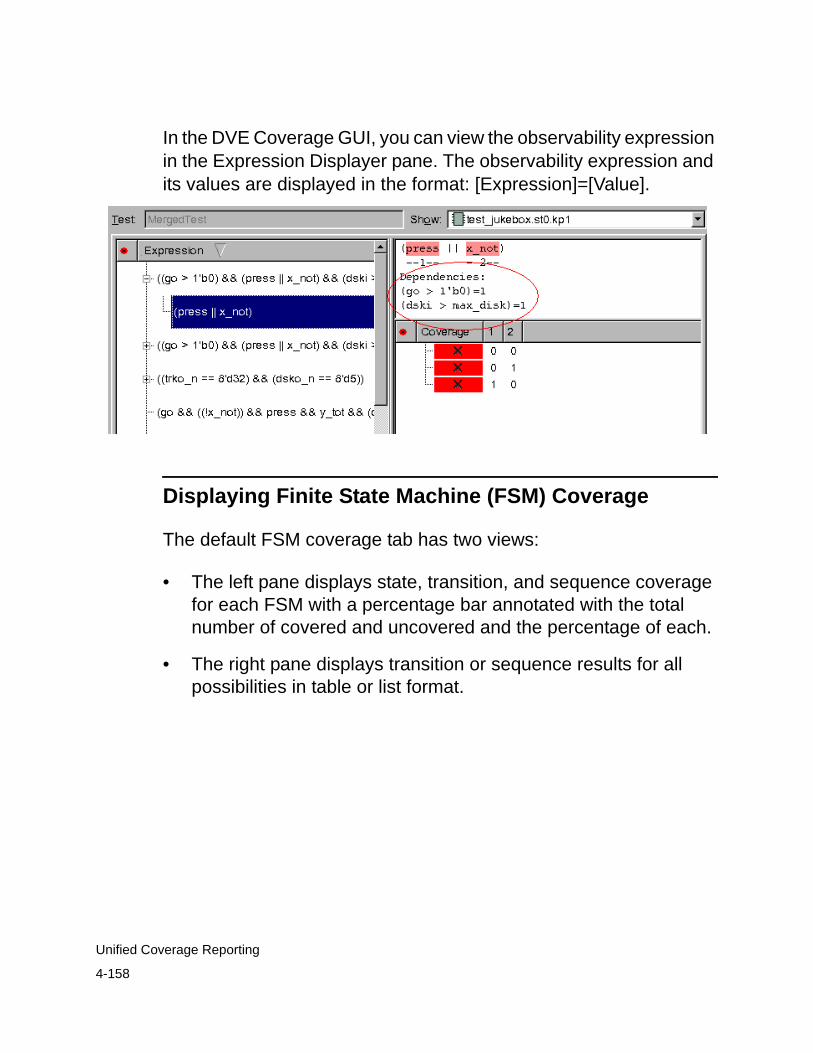
4-158
Unified Coverage Reporting
In the DVE Coverage GUI, you can view the observability expression in the Expression Displayer pane. The observability expression and its values are displayed in the format: [Expression]=[Value].
Displaying Finite State Machine (FSM) Coverage
The default FSM coverage tab has two views:
• The left pane displays state, transition, and sequence coverage for each FSM with a percentage bar annotated with the total number of covered and uncovered and the percentage of each.
• The right pane displays transition or sequence results for all possibilities in table or list format.

4-159
Unified Coverage Reporting
Figure 4-13 Default FSM Detail Display
Displaying Transition Details
The Transition Mode for the selected FSM displays all the possible transitions and whether the current state of the FSM made any of these transitions. You can display the results in table or list format. Figure 4-14 shows the table view with states and transitions displayed with covered transitions in green and uncovered transitions in red. Transitions that are not possible are white with a dash.

4-160
Unified Coverage Reporting
Figure 4-14 FSM Transition Detail Table
To view the transition details in list format with coverage ranges, select Shown in List. Figure 4-15 shows transitions with covered transitions displayed in green and uncovered in red. Not-possible transitions are not listed in the table.
Figure 4-15 FSM Transition List
Displaying Sequences
The Sequences view shows states and sequences and their possible coverage numbers that an FSM can follow to reach from one state to another state. Holding the cursor on a cell displays a tooltip showing the sequences and their coverage.

4-161
Unified Coverage Reporting
Figure 4-16 FSM Sequence Table
To view the state details in list format, select Shown in List. Figure 4-17 shows sequences with covered sequences displayed in green and uncovered in red.
Note: You must turn on the sequences at compile-time to view them in DVE by using -cm_fsmopt sequence switch.

4-162
Unified Coverage Reporting
Figure 4-17 FSM Sequence List
Displaying Branch Coverage
This section describes branch coverage. You can view the branch coverage information in the following windows:
• Summary Table - The branch coverage information is displayed in the Branch column.
• Treemap - The Branch tab is displayed in the Treemap view inline with other tabs.
• Application Preferences - A metric Branch is displayed in the Coverage Settings - Coverage Weights view.
• Detail View - The Branch tab is displayed inline with other tabs. Unlike other metrics, you can view the source code line numbers to see the branch coverage information.

4-163
Unified Coverage Reporting
The Branch Coverage Detail window
The Branch Coverage Detail window displays annotated source code and coverage percentage for branch coverage.
Figure 4-18
It consists of the following panes and options:
• Source pane - allows you to view the source files annotations that shows you which code has and has not been covered. The source code lines are color-annotated according to their coverage values. You can see only the line of branches as color-annotated and not the line of terms.
You can also see the missing Else/Default statements annotated in the Source pane.
• The Detail List View - allows you to view the items and branches on the left side and the branch path list on the right side. When you select the items, the Value column will be empty. When you select the branch, the value column gets populated with the branch’s value.
4-164
Unified Coverage Reporting
• Show drop-down - allows you to look at the coverage of other instances or module variants corresponding to the current instance or module.
Note: When there are more than 50 branches for an item, DVE changes the report from complete table format to just the related expression paths for a branch.
Displaying Implied Branches
The DVE Coverage GUI shows implied branches in the source window (when you use dve -cov) only when you view branch coverage or are analyzing the branch metric. The implied branches of case and if statements are indicated by MISSING_ELSE and MISSING_DEFAULT tags. You can exclude any branches tagged in this fashion.
Displaying Assertion Coverage
Currently, DVE can display limited information about SystemVerilog Assertion (SVA) and OpenVera Assertion (OVA) coverage.
SVA assert and cover statements and OVA assert and cover directives appear in the Navigation pane and in the Details Window Covers tab.
There is no coverage information in the database for assume statements.

4-165
Unified Coverage Reporting
• To monitor SystemVerilog assert statements, you must include the -cm assert compile-time and runtime option and keyword argument.
Figure 4-19 SVA assert and cover statements in the Navigation Pane
The statements appear in the Function Groups folder in the Navigation pane. In this example, the assert and cover statements are in top-level module test with the block identifiers assert1 to assert4 and cover1 to cover4.
DVE uses the following symbol to indicate an assert or cover statement or directive:
Note:DVE uses the same symbol for SystemVerilog and OpenVera assert or cover statements and directives.

4-166
Unified Coverage Reporting
SVA Naming Convention
DVE lists these statements by their hierarchical name, for example:
top. dev1.specdev1.cover1
Hierarchical name of the moduleinstance that contains theassert or cover statement
Block identifier of the statement
If you bound an SVA module to a design module, the hierarchical name would include the instance name of the SVA module, for example:
top.dev1.specdev1.checker1.assert1
Hierarchical name of themodule instance to whichthe SVA module is bound unit is bound
Block identifier Instance nameof the SVAmodule
The Detail Window Covers tab puts the block identifier in a separate column from the rest of the hierarchical name.
OVA Naming Convention
DVE lists these directives by their hierarchical name, for example:
top.dev1.specdev1.ova_unit_instance_name.directive_name
Hierarchical name of themodule instance to whichthe OpenVera assertion unit is bound
Name of the directive Instance name for theOpenVera assertionunit

4-167
Unified Coverage Reporting
If you do not specify an instance name in the bind module construct that binds the unit to the module, VCS generates an instance name for the unit and puts it in the hierarchical name, for example:
top.dev1.specdev1.assert1_inst00000000.directive_name
Hierarchical name of themodule instance to whichthe OpenVera assertion unit is bound
Generated instance namefor the OpenVera assertionunit
Name of the directive
The generated instance name begins with the name of the OpenVera assertion unit, followed by _inst and then an eight digit number that is unique to the instance.
The Detail Window Covers tab puts the name of the directive in a separate column from the rest of the hierarchical name.
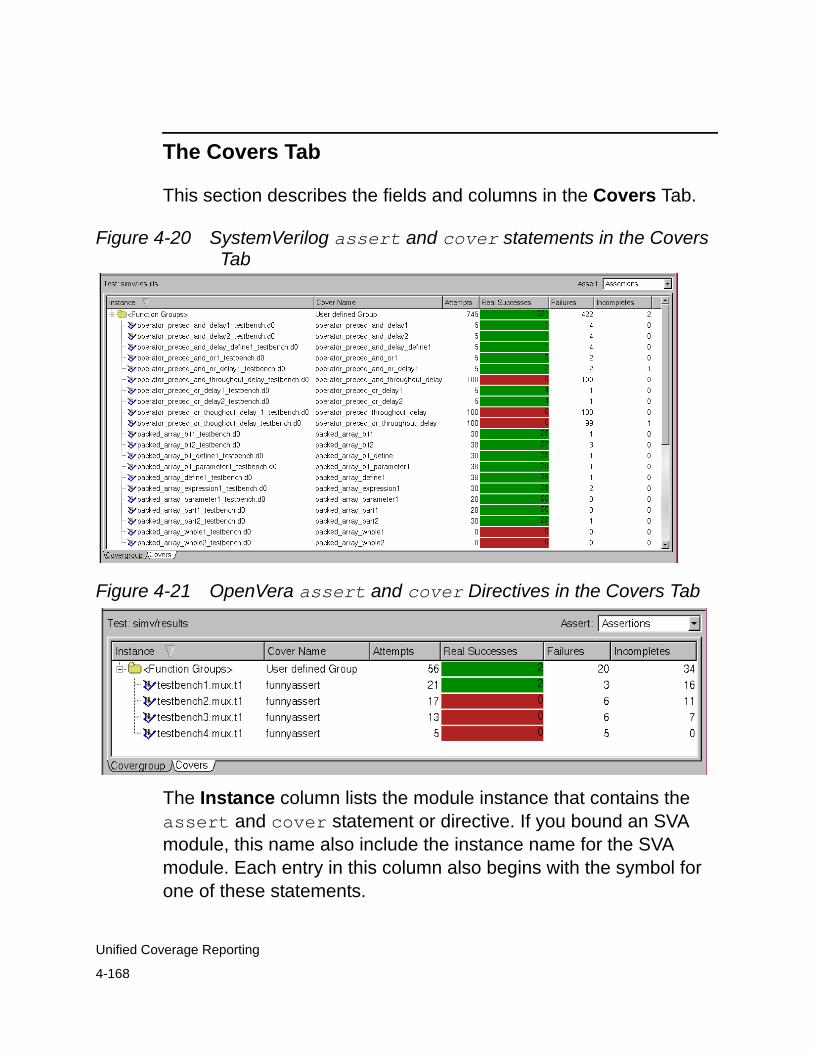
4-168
Unified Coverage Reporting
The Covers Tab
This section describes the fields and columns in the Covers Tab.
Figure 4-20 SystemVerilog assert and cover statements in the Covers Tab
Figure 4-21 OpenVera assert and cover Directives in the Covers Tab
The Instance column lists the module instance that contains the assert and cover statement or directive. If you bound an SVA module, this name also include the instance name for the SVA module. Each entry in this column also begins with the symbol for one of these statements.
4-169
Unified Coverage Reporting
The Cover Name column lists the block identifier for assert or cover.
The Attempts column lists the number of times VCS began looking to see if the assert statement or directive succeeded or the cover statement or directive matched.
The Real Successes column lists the number of times assert succeeded and the number of the cover matched. A real success is when the entire expression succeeds or matches without the vacuous successes.
The Real Successes column is color coded with a 0 considered uncovered and a non-0 considered covered. By default, covered is displayed in green and uncovered is red. You can change the colors in the Preferences dialog box.
The Failures column shows the number of times assert does not succeed. cover does not have failures, so the entry for cover statements in this column will always be 0.
The Incompletes column lists the number of times VCS started keeping track of the statement or directive, but simulation ended before the statement could succeed or match.
Displaying Testbench Coverage
DVE displays testbench coverage information as specified in SystemVerilog covergroup constructs in SystemVerilog program blocks and the OVA covergroup construct in the OpenVera code.

4-170
Unified Coverage Reporting
The SVA and OVA constructs specify the clocking event that defines the coverage data reported during simulation and specifies the coverage points monitored.
When you open a database, DVE displays the SVA covergroups and OVA covergorup in the Functional Groups folder in the Navigation pane.
The Covergroup tab lists covergroup items with coverage score, goal, weight, and a coverage map view. The Covergroup Items pane is shown in Figure 4-22. Double-clicking a covergroup displays the covergroup source code in the Source Window. Expanding the covergroup displays coverpoints, crosses, bins, and instances.
In the Covergroup detailed window, you can view the Covergroup Definition and Instances using the Show drop-down. You can also use the CSM to locate instance for covergroup definition, and definition for covergroup instance.

4-171
Unified Coverage Reporting
Figure 4-22 Covergroup Item Pane
Figure 4-23 shows the map view results for covergroup unit_uart_interface::cov_rx_transaction. The cumulative score for the cross below the mouse pointer in the map view is 20.83, as displayed in the tooltip.

4-172
Unified Coverage Reporting
Figure 4-23 The Covergroup Tab
To drill down for details of the cross or cover point results, you can double-click on a rectangle in the map view or drag and drop, or select a cross in the left pane.
Figure 4-24 Results for Crosses
To view results in table format, select Table. Figure 4-25 shows the tabular results for a cross listing bins and their coverage. Click the Size column header to sort and bring the holes to the top.

4-173
Unified Coverage Reporting
Figure 4-25 Coverpoint Table View
Working with HVP Files
You can use the DVE Coverage GUI to create HVP files. An HVP (Hierarchical Verification Plan) is a comprehensive model that allows you to hierarchically describe a verification plan. You can then annotate that plan with live verification data using the Unified Report Generator (URG) tool.
For more information about HVP files, see the LCA category in the VCS Online Documentation.
Working with Coverage Results
Running Scripts
You can do any DVE operation with Tcl commands, including using Tcl scripts to modify the display of your coverage data. For example, you can omit display of statement, instance, or module coverage.

4-174
Unified Coverage Reporting
To select and source a TCL script
1. Select File > Execute TCL Script.
The Execute TCL Script dialog box appears.
2. Browse to the script, select it, then click Execute.
The Tcl script is executed.
Figure 4-26
Filtering the Hierarchy Display
To filter the display in the Navigation pane
1. Select Edit > Filters > Add.
The Filter dialog box appears.
2. Enter a string or expression to filter.

4-175
Unified Coverage Reporting
3. Select any of the filtering options as follows:
- Match case
- Match whole word only
- Use regular expression
4. Click OK or Apply to filter according to the criteria you specified.
The Navigation pane displays the modified results.
Filters are applied cumulatively. A filter added to an already filtered result further filters the result display. If you want to apply the filter to the unfiltered results, first apply a * filter to display the unfiltered results.
Setting Display Preferences
To set your display preferences
1. Select Edit > Preferences.
The Application Preferences dialog box appears.

4-176
Unified Coverage Reporting
2. Select the Global category to set the font for menus or dialog boxes and other general settings.
3. Select the Coverage Colors category to customize the color display of Source Window cover states, Coverage Map window, and the number of coverage ranges and their associated colors.
4. Select the Metric Weight category to specify weight for each metric listed to be used for computing the score of each object in the Summary table or Map window.
The score is a weighted average of the coverage percentage of each metric. You can remove a metric from score computation by setting its weight to 0.
5. Select the Navigation Pane category to set display options for the Navigation pane.
4-177
Unified Coverage Reporting
6. Select the Summary Table category to display or hide the detail values in the table.
Generating URG Report from DVE Coverage GUI
You can now generate a URG report from the DVE coverage GUI. URG Window is the interface you use to generate the URG report. You need to set the configuration options in the URG Window and run URG to generate the report.
To generate a URG report
1. Load the coverage database in DVE.
2. Click Generate URG Report from the File menu.

4-178
Unified Coverage Reporting
The URG Window dialog box opens.
3. (Optional) Enter your command in the Append Options text box.
4. Click the Show/hide URG option tabs button “>>”.
The option tabs General and HVP are displayed below the Append Options text box.
5. Select the following options under the General tab. The options that you select in the configuration tabs appear in the URG Command Line text area.

4-179
Unified Coverage Reporting
- Database of Current Session — Specifies database of the current session.
- Report Directory(-report) — Generates report in the default directory (urgReport). Click the Set URG report directory button to select the directory where you want to save the generated report.
- Report Format(-format) — Specifies the report format, html, text, or both, in which you want to view the report.
- Uncovered Only (-show brief) — Specifies only the uncovered items.
- Exclusion of Current Design — Specifies the exclusion performed in the current session. You can select this check box if you want to include the current exclusion.
- Strict Exclusion (-excl_strict) — Specifies exclusion in strict mode.
6. Click the HVP tab and select the check box HVP Plan of Current Session to include the HVP plan of the current session.
7. Click Run to execute the URG report.
The URG report is generated. If there is an error in the report generation, the errors are printed in the Command Line Output text area.
8. Click the Browse Report button to view the generated URG report.
The report is displayed in a standard browser.

4-180
Unified Coverage Reporting
9. Click the Customized button to display additional configuration options and tabs (Grade and Advanced). The available customized configuration options are as follows:

4-181
Unified Coverage Reporting
• General tab
- Design Directory(-dir) — Specifies the base design/test directory. You can browse and select the desired base design/test directory.
- Test Directories(-dir) — Identifies the test directories for source data. Click the Edit button to display the Choose test directories dialog box. You can add or delete the directories, or move the selected directories up/down.
- Test Directory List File(s)(-f) — Specifies multiple directories for source data in a file.
- Test List File(s)(-tests) — Specifies a file containing names of tests to report from specified directories.
- Metrics — Specifies the metrics for Line, FSM, Condition, Toggle, Branch, and Assertion.
- You can select your own exclusion file in the customized mode.
• HVP tab
- Top Plan File(-plan) — Reports the Hierarchical Verification Plan (HVP) given in the specified file.
- Filter/Override(s)(-mod) — Reads filtered/overridden HVP data from the specified file. The -plan options must also be given.
- Userdata List File(s)(-userdatafile) — Specifies a file containing HVP data file names for annotation. The -plan option must also be given.
- Userdata File(s)(-userdata) — Reads HVP data from the given file for annotation. The -plan option must also be given.

4-182
Unified Coverage Reporting
- Show full HVP tree(-show hvpfullhier) — Lets you see the full hierarchy tree, including the plans and features which are filtered out.
- Show problem HVP tree(-show hvpprob) — Lets you see the failed plan that was set for one or more metrics.
• Grade tab
- Grade Algorithm(-grade) — Specifies which algorithm to use: quick, greedy, or score.
- Goal(-grade goal) — Stops grading when the cumulative score reaches the specified goal. It has no effect on the score algorithm.
- Timelimit(-grade timelimit) — Specifies the time limit for the report generator to run before exiting. Only those tests that are graded before the time limit is hit are included in the graded list.
- Maxtest(-grade maxtests) — Specifies the maximum number of tests to include in the report.
- Minincr(-grade minincr) — The score improvement for each metric that the test contributed to the cumulative value when it was merged.
- Reqtests(-grade requests) — Specifies reading a list of test names from file_name for inclusion in the grading report. (used only for greedy algorithm).
- Listonly(-grade listonly) — Generates only a grading report.
• Advanced tab — Lists various URG commands with description specified against each command.
To run URG and view the customized report, repeat Steps 7 and 8.

5-183
Unified Coverage Reporting
5Post-processing Coverage Data 1
This chapter contains the following sections:
• “Merging”
• “Grading and Coverage Analysis”
• “Mapping Coverage”
• “Exclusion”
• “Editing the Covergroup Coverage Database”
Merging
After running multiple simulation, you can merge all the coverage database to get an overall coverage report for all of your design files. You can also create a single set of merged data that contains all the

5-184
Unified Coverage Reporting
information from your simulation runs. After merging, you can load these files to see the overall coverage results instead of reloading all the original test data files.
You can create a merged coverage data file using the dbname flag to URG. For example:
% urg -dir simv.vdb -dbname merged_dir/merged_test -format text
This command creates merged_dir.vdb/snps/coverage/db/testdata/merged_test/
% urg -dir simv.vdb -dbname merged_dir2/ -format text
This command gives error because the testname after dirname is missing.
% urg -dir simv.vdb -dbname merged_dir3 -format text
This creates merged_dir3.vdb and testname is default (test).
%urg -dir simv.vdb -dbname simv.vdb/merged_test2 -format text
This creates a test subdir called merged_test2 inside simv.vdb (the original directory containing all the test data.
simv.vdb/snps/coverage/db/testdata/merged_test2

5-185
Unified Coverage Reporting
There are three techniques for merging:
• Serial Merging
• Parallel Merging
• Flexible Merging
Serial Merging
The default mechanism URG uses for merging test results is a serial technique where it merges the results from the first test with those from the second test. It then merges the merged results with the results from the third test, then merges the new merged results with the results from the fourth test, and so on. Continuing on, by adding the results from each test, one test at a time. In many cases, particularly with a large amount of coverage data in a large amount of tests, merging the results can take a considerable amount of time.
Parallel Merging
If you find that serial merging is consuming a large amount of time, URG has a parallel merging technology. This technology simultaneously merges the results from different tests.
You specify this technology by using the -parallel option on the urg command line.
In this technology, the results from different tests are merged together into different “mergings” or clumps. URG simultaneously creates more than one merging or clump. After URG creates the mergings, it then combines them together. Sometimes, this process may take more than one pass to combine all the mergings together.

5-186
Unified Coverage Reporting
When you enable parallel merging, urg_parallel.elog file gets created. The urg_parallel.elog file contains warnings and errors that occur during one of the sub-processes. If you specify the -verbose option, then the following message is generated in the log file created by the -log option:
Status: 13 Mergings, 1 remain (12 Done, 0 Running, 1 on queue, 0 waiting)Merging the Final OneThe error messages of sub-jobs are saved in urg_parallel.elog.Distributed Merging SUCCESSFUL!!!
Note:In this technology, this underlying mechanism is associating coverage data with each other, not creating new or different coverage data. Therefore, the coverage results in parallel merging are always the same as the default mechanism.
Figure 5-1 shows the parallel merging of 12 coverage databases. URG merges test0, test1, test2, and test3 into one merging; test4, test5, test6, and test7 into a second merging; and test8, test9, test10, and test11 into a third merging.
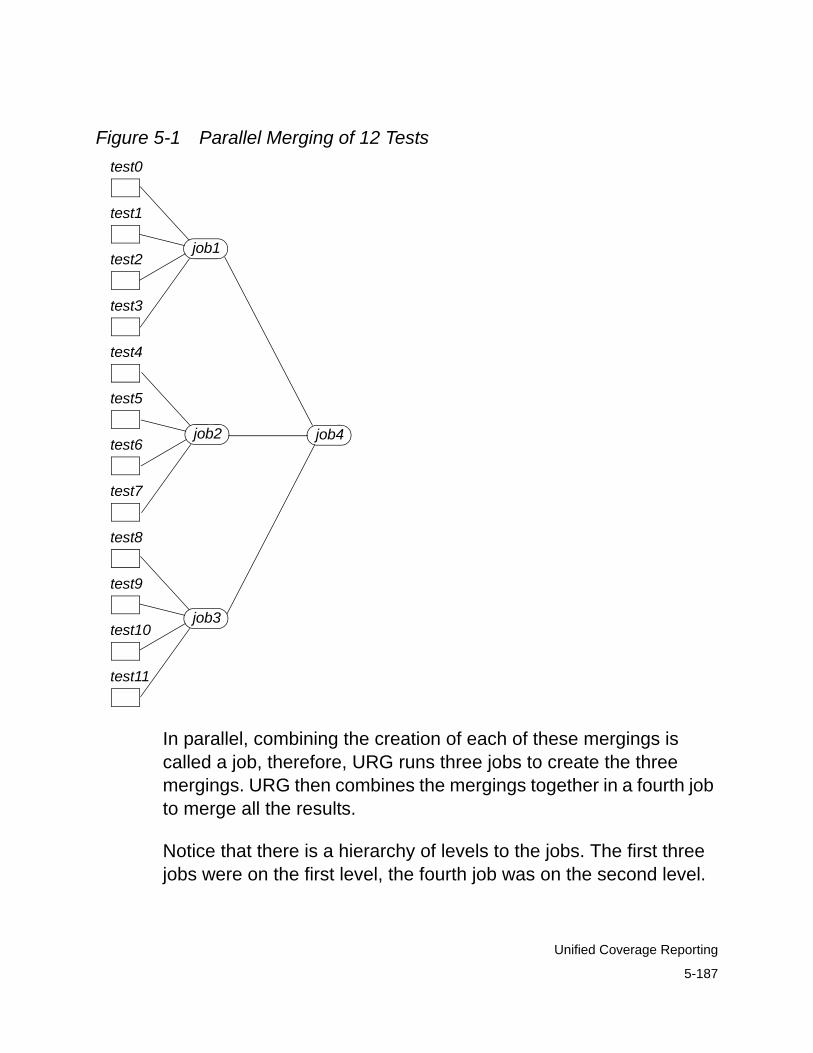
5-187
Unified Coverage Reporting
Figure 5-1 Parallel Merging of 12 Teststest0
test1
test2
test3
test4
test5
test6
test7
test8
test9
test10
test11
job1
job2
job3
job4
In parallel, combining the creation of each of these mergings is called a job, therefore, URG runs three jobs to create the three mergings. URG then combines the mergings together in a fourth job to merge all the results.
Notice that there is a hierarchy of levels to the jobs. The first three jobs were on the first level, the fourth job was on the second level.

5-188
Unified Coverage Reporting
You can control the number of tests that URG merges into a merging, and the number of lower level mergings that go into higher level mergings. The smaller the number of tests (and mergings) the more jobs and levels in the parallel merging. For additional information, see the section entitled, “Specifying the Number of Tests in a Merging” on page 190.
When using parallel merging, you can perform one of the following:
• Specify the machines that perform the jobs
• Use a GRID computing Engine
• Use LSF
Specifying the Machines that Perform the Jobs
You can specify which machines on your network perform the jobs in the parallel merging. To do so, enter the machines on separate lines in a text file and include the file name as an argument to the -parallel option.
The following is an example of a machine file:
linux_machine1linux_machine2linux_machine3linux_machine4
The following displays an example using this argument:
urg -dir test0.vdb test1.vdb test2.vdb test3.vdb test4.vdb test5.vdb test6.vdb test7.vdb test8.vdb test9.vdb test10.vdb test11.vdb -parallel machine_file
5-189
Unified Coverage Reporting
Using a GRID Computing Engine
You specify using a GRID computing engine and pass optional arguments to that engine with the -grid command-line option. You pass the optional arguments for the engine in quotation marks that follow the option.
Following the -grid option, you can also enter the secondary options -sub and -del to enter the GRID engine commands to run and clear the GRID engine. The following is an example of entering the -grid option:
urg -dir test0.vdb test1.vdb test2.vdb test3.vdb test4.vdb test5.vdb test6.vdb test7.vdb test8.vdb test9.vdb test10.vdb test11.vdb -parallel -grid "-l arch=1x24-amd64 -P bnormal" -sub qsub -del qdel
In this example, URG starts the GRID engine with the job throwing command, qsub. URG appends -l arch=1x24-amd64 -P bnormal to the qsub command line. After parallel merging, URG passes the qdel command to the engine to clear the engine.
Using LSF
Use the -lsf command-line option to specify the use of an LSF engine and pass optional arguments to that engine. Similar to the -grid option, you pass the optional arguments for the engine in quotation marks that follow the option.
With the -lsf option, you must enter the secondary options, -sub and -del, to enter the commands to throw and control jobs in the engine. The following is an example of entering the -lsf option:
urg -dir test0.vdb test1.vdb test2.vdb test3.vdb test4.vdb test5.vdb test6.vdb test7.vdb test8.vdb test9.vdb test10.vdb test11.vdb -parallel -lsf "-q queuename -R res_req" -sub

5-190
Unified Coverage Reporting
bsub -del bkill...
Specifying the Number of Tests in a Merging
You specify the number of tests in a merging, and the number of lower-level mergings in higher-level mergings, with the -parallel_split integer command-line option and argument.
If for 12 test, by default URG divides the process into four jobs on two levels (see Figure 5-1).
If you specify a lower number of tests and mergings, the number of jobs, and perhaps levels, increases. Therefore, for the 12 tests, specifying a value of 3 creates six jobs on three levels and specifying a value of 6 creates three jobs on two levels.
Flexible Merging
This type of merging technique is available only for covergroup coverage.
Flexible merging enables you to get a more accurate coverage report when the coverage model is still evolving and you are running tests repeatedly with minor changes in the coverage model between the test runs. URG facilitates flexible merging using a new merge database option. It follows a set of rules to merge databases depending on the functional coverage model.
To enable flexible merging, use the -group flex_merge_drop option on the URG command line, as follows:
urg -dir simv1.vdb -dir simv2.vdb -group flex_merge_drop

5-191
Unified Coverage Reporting
URG assumes the first specified coverage database as a reference for flexible merging.
Example
Consider two databases, first.vdb and second.vdb. Using the -group flex_merge_drop option and flexible merging database rules, URG generates a merged report. For example:
urg -dir first.vdb -dir second.vdb -group flex_merge_drop
In this example, URG considers the first.vdb coverage database directory as a reference to generate the flexible merged report.
Merge Equivalence
To merge two coverpoints or crosspoints, you should merge them equivalent to each other. The following section lists the requirements for merge equivalence.
Merge Equivalence Requirements for Autobin CoverpointsThe coverpoint P1 is said to be merge equivalent to a coverpoint P2 only if the name, auto_bin_max and the width of the coverpoints are the same, where P1 and P2 are autobin coverpoints.
Merge Equivalence Requirements for User-defined CoverpointsThe coverpoint P1 is said to be merge equivalent to a coverpoint P2 only if the coverpoint names and width are the same.

5-192
Unified Coverage Reporting
Merge Equivalence Requirements for CrosspointsThe crosspoint C1 is said to be merge equivalent to a crosspoint C2, if the crosspoints have the same number of coverpoints and their corresponding coverpoints are merge equivalent.
Rules for Flexible Merging Databases
The following sections list the rules to merge the database with flexible merge dropping semantics. With the dropping semantics, you can take advantage of the information available from the newer database to eliminate the redundant information from the older databases.
Rules for Merging Coverpoints The coverpoints P(T1) in first test run T1 and P(T2) in the second test run T2 are merged according to the following rules:
• If the coverpoints are merge equivalent. The merged coverpoints will contain a union of all the coverpoint bins in P(T1) and P(T2), but URG will drop the coverpoint bins that are defined only in the earlier coverage model.
• If the coverpoints are not merge equivalent. The merged coverpoint will contain all the coverpoint bins in the most recent test run and the older test run data is not considered and dropped.
Rules for Merging Crosspoints The crosspoint C(T1) in test T1 and C(T2) in test T2 are merged according to the following rules:

5-193
Unified Coverage Reporting
• If the crosspoints are merge equivalent. The merged crosspoints will contain a union of all the crosspoint bins in C(T1) and C(T2), but URG will drop the crosspoint bins that are defined only in the earlier coverage model.
• If the crosspoints are not merge equivalent. The merged crosspoint will contain all the crosspoint bins in the most recent test run and the older test run data is not considered and dropped.
Example
The example shows two tests with minor changes in the functional and assertion coverage models. The changes are marked in red.
Example 5-2 Test01cp1: coverpoint firstsig;
option.auto_bin_max = 64;cp2: coverpoint secondsig { bins first = {[0:63]}; bins mid = {[71:82]};}cp3: coverpoint thirdsig;bit[7:0]signal;cp4:coverpoint signal;cc1: cross cp1, cp2;cc2: cross cp2, cp3 { bins mybin = binsof(cp2) intersect [0:255];}cc3: cross cp2, cp3 { bins my_st = binsof(cp2) intersect [0:255];}
Example 5-3 Test02cp1: coverpoint firstsig;
option.auto_bin_max = 32;cp2: coverpoint secondsig { bins first = {[0:63]}; bins second = {[65:128]};

5-194
Unified Coverage Reporting
}cp3: coverpoint thirdsig;bit[15:0]signal;cp4:coverpoint signal;cc1: cross cp1, cp2;cc2: cross cp2, cp3 { bins mybin = binsof(cp2) intersect [0:255]; bins yourbin = binsof(cp2) intersect [256:511];}cc3: cross cp2, cp3 { bins my_st = binsof(cp2) intersect [0:8191];}cc4: cross cp1, cp2, cp3
Using the two coverage model examples let us analyze the flexible merged database. In this example test 02 is the latest test that is run and is the reference coverage database. URG considers the first database specified as the reference coverage database directory.
urg -dir test02.vdb -dir test01.vdb -group flex_merge_drop
Coverpoint Analysis• cp1, the auto_bin_max is changed to 32. Therefore they are
not merge equivalent and only cp1 data from test 02 is included in the generated report.
• The coverpoint cp2 is merge equivalent and the data from both the tests are merged. The new bin second, added in test02 is included in the generated report, but the bin mid from the previous test test01 is dropped from the generated report since it is removed from latest test test02 coverage model.
• The coverpoint cp3 is unchanged. The data from both the tests are merged to be included in the generated report.

5-195
Unified Coverage Reporting
• cp4, the signal width is changed. Therefore they are not merge equivalent and only test02 data is included in the generated report.
Crosspoint Analysis• cc1, the component pair of coverpoint cp1 is not merge
equivalent and therefore only data from the test02 is included in the generated report.
• cc2, a new bin yourbin is added, but the component pair of coverpoint cp2 and cp3 are merge equivalent and therefore the data from both the tests are merged to be included in the generated report.
• cc3, the component coverpoint cp2 intersect range is changed. They are not merge equivalent and user defined my_st will be considered only from the test02, but the autocrosses in test01 will be merged with the autocrosses in test02.
• The crosspoint cc4 is a new introduction in test02 and is included in the generated report.

5-196
Unified Coverage Reporting
Flexible Merge Database Coverage model for test01
Coverage model for test02
Flexible merge Database Profile for test01 and test02
cp1: coverpoint firstsig; option.auto_bin_max = 64;
cp1: coverpoint firstsig; option.auto_bin_max = 32;
//auto_bin_max differs and is not merge equivalent.
cp1: coverpoint firstsig;auto_bin_max = 32; // (From test02)
cp2: coverpoint secondsig{ bins first = {[0:63]}; bins mid = {[71:82]};}
cp2: coverpoint secondsig{ bins first = {[0:63]}; bins second = {[65:128]};}
// (cp2 is merged across test01 and test02)cp2: coverpoint secondsig { bins first = {[0:63]}; bins second = {[65:128]};}
cp3: coverpoint thirdsig;
cp3: coverpoint thirdsig;
//cp3 is merged across test01 and test02cp3: coverpoint thirdsig;
bit[7:0]signal;cp4: coverpoint signal;
bit[15:0]signal;cp4: coverpoint signal;
//width of signal has changed and not merge equivalentcp4: coverpoint signal; // (From test02)
cc1: cross cp1, cp2; cc1: cross cp1, cp2; // cc1 is not merged equivalent because cp1 is not merge equivalentcc1: cross cp1, cp2; // (From test02)
cc2: cross cp2, cp3 { bins mybin = binsof(cp2) intersect [0:255]; }
cc2: cross cp2, cp3 { bins mybin = binsof(cp2) intersect [0:255]; bins yourbin=binsof(cp2) intersect [256:511];}
// cc2 is merged across test01 and test02)cc2: cross cp2, cp3 { bins mybin = binsof(cp2) intersect [0:255]; bins yourbin = binsof(cp2) intersect [256:511];}

5-197
Unified Coverage Reporting
Correlation Report: Which Tests Covered Which Bins
For a group of tests that are being merged, the -show tests option of the urg command creates a report that shows the correlation between tests and the coverage achieved, by showing which tests covered which coverage bins.
By default, up to three tests that produced hits in a particular bin are listed for that bin. To remove this limit, you can use the command line argument -show maxtests N instead of -show tests. The N value is a positive integer that specifies the maximum number of tests you want to list as contributing to each bin.
A -tests file argument is required along with -show tests or -show maxtests N. The file is a regular text file that contains a list of the names of tests that are to be merged.
Following are examples of the usage of urg options -show tests and -show maxtests. The order of command line arguments does not matter.
urg -dir mydir.vdb -tests file -show testsurg -dir mydir.vdb -tests file -show maxtests N
cc3: cross cp2, cp3 { bins my_st = binsof(cp2) intersect [0:255];}
cc3: cross cp2, cp3 { bins my_st = binsof(cp2) intersect [0:8191];}
cc3: cross cp2, cp3 { bins my_st = binsof(cp2) intersect [0:8191];}The autocrosses in test01 will be merged with the autocrosses of test 02.
cc4: cross cp1, cp2, cp3;
cc4: cross cp1, cp2, cp3; // (From test02)
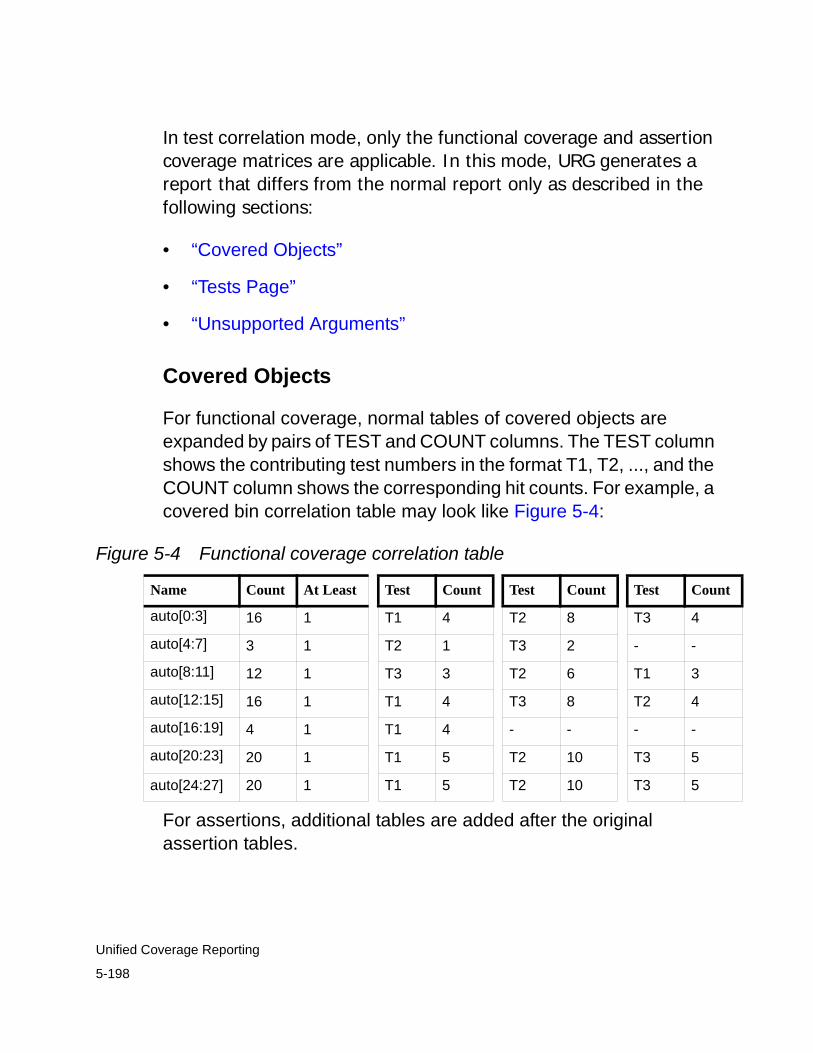
5-198
Unified Coverage Reporting
In test correlation mode, only the functional coverage and assertion coverage matrices are applicable. In this mode, URG generates a report that differs from the normal report only as described in the following sections:
• “Covered Objects”
• “Tests Page”
• “Unsupported Arguments”
Covered Objects
For functional coverage, normal tables of covered objects are expanded by pairs of TEST and COUNT columns. The TEST column shows the contributing test numbers in the format T1, T2, ..., and the COUNT column shows the corresponding hit counts. For example, a covered bin correlation table may look like Figure 5-4:
Figure 5-4 Functional coverage correlation table
Name Count At Least Test Count Test Count Test Count
auto[0:3] 16 1 T1 4 T2 8 T3 4
auto[4:7] 3 1 T2 1 T3 2 - -
auto[8:11] 12 1 T3 3 T2 6 T1 3
auto[12:15] 16 1 T1 4 T3 8 T2 4
auto[16:19] 4 1 T1 4 - - - -
auto[20:23] 20 1 T1 5 T2 10 T3 5
auto[24:27] 20 1 T1 5 T2 10 T3 5
For assertions, additional tables are added after the original assertion tables.

5-199
Unified Coverage Reporting
A separate table is created for every assertion with non-zero attempts, with the assertion name as the header. The first row of a detailed table is the total hit count, and it is followed by rows of contributing tests.
For example, an assertion correlation table may look like Figure 5-5:
Figure 5-5 Assertion coverage correlation table
Cover Directives for Properties: Details
Name
Attempts
Matches
Vacuous Matches
Incomplete
T1C1 40 36 0 4
T1C1
Name
Attempts
Matches
Vacuous Matches
Incomplete
Total 40 36 0 0
T1 20 18 0 0
T2 20 18 0 0
At most, the maxtests N number of tests is shown for every covered object. Empty table cells are indicated by "-".
When the cursor hovers over any test number, a hint of its test name pops up. The popup in Figure 5-6 shows that the test name for test T2 is simv2.vdb/test.

5-200
Unified Coverage Reporting
Figure 5-6 Popup showing the test name
Name Count At Least Test Count Test Count Test Count
auto[0:3] 16 1 T1 4 T2 8 T3 4
auto[4:7] 3 1 T2 1 T3 2 - -
auto[8:11] 12 1 T3 3 T2 6 T1 3
auto[12:15] 16 1 T1 4 T3 8 T2 4
auto[16:19] 4 1 T1 4 - - - -
auto[20:23] 20 1 T1 5 T2 10 T3 5
x
simv2.vdb/testxxxx
Tests Page
In test correlation mode, list of tests in the tests page (tests.html/txt) have two columns: TEST NO and TEST NAME, showing all the test numbers (T1, T2, ...) and their corresponding test names. For example, a tests page may contain data shown in Figure 5-7:

5-201
Unified Coverage Reporting
Figure 5-7 Tests page for test correlation
Total Coverage Summary
Score Group
30.73 30.73
Total tests in report: 3
Data from the following tests was used to generate this report
TEST NO TEST NAME
T1 simv2/test
T2 simv2/all
T3 simv/test
Unsupported Arguments
The -diff command line argument of the urg command is not compatible with test correlation mode. If -diff is entered along with -show tests or -show maxtests, an error is reported and URG exits.
Grading and Coverage Analysis
Grading, also known as autograding, means comparing the effectiveness of tests. Grading is useful, for example, when you want to eliminate redundant tests from a test suite. Use the -grade option to specify and run test grading and generate test grading reports.
To invoke grading in URG, use the following syntax:
urg -grade [quick|greedy|score] [goal R] [timelimit N] [maxtests N] [minincr R] [reqtests file_name]

5-202
Unified Coverage Reporting
For more information on options for grading, see the Coverage Technology Reference Manual.
Examples Using the Grading Option
Scoring
Use the -grade score option to generate a report which contains the individual absolute score of each test. Each column of the table is sortable by clicking any of the column headings: SCORE, LINE, COND, TOGGLE, and so on.
Note:A scoring report takes significant more time for URG to compute than the preceding default report.

5-203
Unified Coverage Reporting
Figure 5-8 Example of a Scoring Report
Quick Grading
Use the -grade quick option to generate a quick-grading report which describes the cumulative and incremental contribution of each metric for each test. Since the table displays the incremental value of each test in alphanumeric order, it is not sortable. The TOTAL boxes are color-coded according to the color legend of Synopsys Coverage Metrics, while INCR boxes are either green or white (white denotes no incremental value). In the following figure, mysimv/test1 and mysimv/test2 do not contribute additional condition coverage score to what is already scored by mysimv/test0, therefore, they are color-coded in white.

5-204
Unified Coverage Reporting
Figure 5-9 Example of a Quick-grading Report
Greedy Grading
Use the -grade greedy option to generate a full-grading report which includes cumulative (TOTAL), stand-alone (TEST), and incremental (INCR) scores of each metric for each test. This report is not sortable on any column heading. TOTAL is the cumulative coverage score after each test is merged with all previous tests in the graded list. TEST is the individual coverage score of each test. INCR is the improvement of coverage score for each test contributing to the cumulative value. The TEST boxes are color-coded like the

5-205
Unified Coverage Reporting
TOTAL boxes. Applying the greedy argument provides a thorough report, but it is more time-consuming than using the score or quick argument.
Figure 5-10 Example of a Full-grading Report
Grading and the -scorefile Option
You can use the -scorefile option to modify how the overall grading scores are computed for tests. By default, each metric is weighted the same. The -scorefile option enables you to specify a separate "score file" that allows you to give a different weight to each metric.
To instruct URG to use the score file, use the following syntax:

5-206
Unified Coverage Reporting
%urg -grade [grading options] -scorefile file_name
Note:You can use either the -scorefile or -metric option, but not both.
The score file has the following simple format:
metric1 weight1metric2 weight2…metricN weightN
In this file, each metric may only be specified one time. The metric names are the same as those used for the -metric option on the command line (for example, line, cond, assert). Each weight must be a non-negative integer.
When the -scorefile option is given along with the -grade option, grading is done only for the metrics as specified in the -scorefile file. You cannot give a -metric option with the -scorefile option, since the score file spells out which metrics are being used.
The following is an example score file. It indicates that line coverage is weighted normally, but that each group coverable object should be weighted double:
line 1group 2
In this case, the overall score and the score for each test will be computed as follows:
score = (linescore + (groupscore * 2)) / 3

5-207
Unified Coverage Reporting
The score file weights only affect the computation of the overall score and the overall score for each test; it does not affect the score reported for any individual metric. For example, the group score will be reported the same regardless of the weight put in the score file.
Mapping Coverage
Code coverage data is collected on a module and instance basis. If the design hierarchy changes, the list of modules or instances changes, and you can no longer directly merge code coverage data.
It is possible to merge coverage data from some non-identical designs using mapping. You can compile a design (or part of a design) with multiple different contexts, and still merge coverage data, but only for subtrees of the design that are identical across all versions of the design that you're merging. This is useful when some coverage data is collected at the block level and other data for that block is collected in system-level simulation, or when the verification process involves swapping out different top-level testbenches that each instantiate the design.
You can instantiate a subhierarchy (a module instance in your design and all the module instances hierarchically under this instance) in two different designs and see the combined coverage for the subhierarchy from the simulation of both designs.
Use the -map option to map subhierarchy coverage from one design to another. Full hierarchy should be generated in the hierachy.html file. This option is available in code coverage, but not supported in assert/group coverage.
The -map option syntax is as follows:

5-208
Unified Coverage Reporting
urg -dir <base_design>.vdb -dir <input_design>.vdb -map <module name>
Where:
<base_design>
The first directory mentioned is the base design and will report the design coverage directory after the merge.
<input_design>
The second directory provided to the URG command line is the Input design. The input design coverage is merged into the base design.
The cumulative coverage will be available with the base design coverage directory.
<module name>
Defines the top-level module name (identifier) of the subhierarchy. Do not put the hierarchical name of the top-level module instance in the subhierarchy.
Note: When you map coverage from one design to another, the source file names must be identical. For example, consider the following illustration:
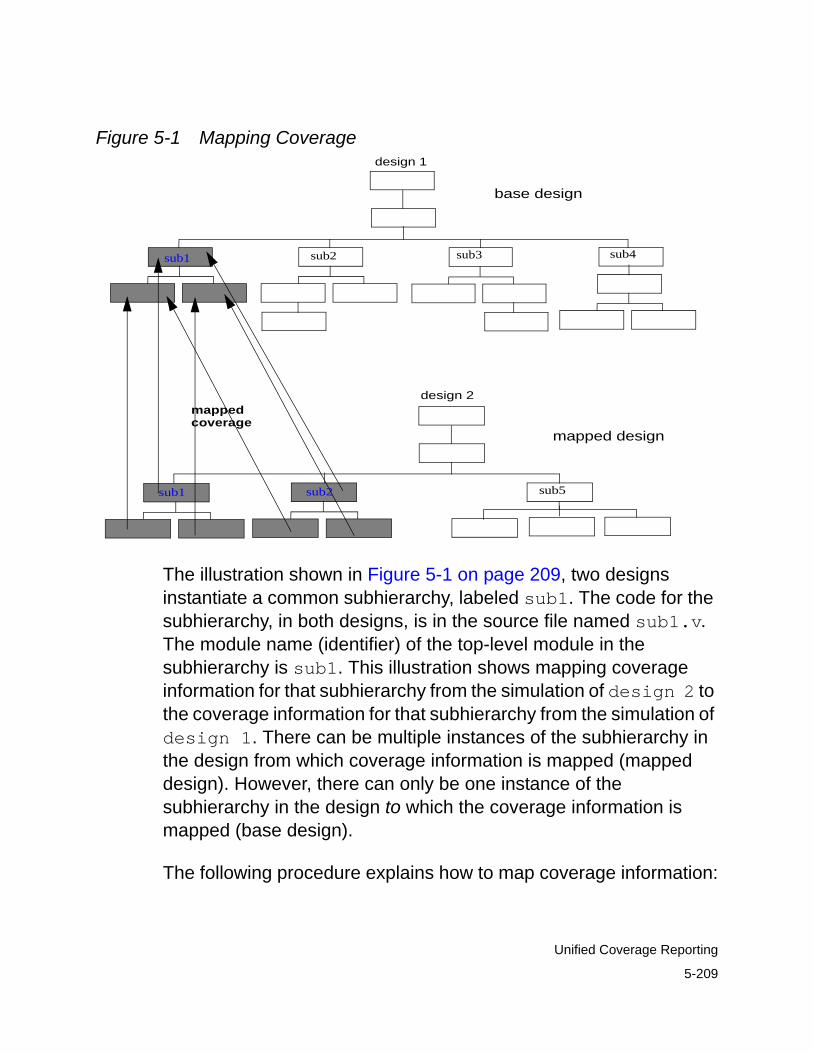
5-209
Unified Coverage Reporting
Figure 5-1 Mapping Coverage
sub1
sub2
design 1
design 2mappedcoverage
sub1
sub2 sub3 sub4
sub5
base design
mapped design
The illustration shown in Figure 5-1 on page 209, two designs instantiate a common subhierarchy, labeled sub1. The code for the subhierarchy, in both designs, is in the source file named sub1.v. The module name (identifier) of the top-level module in the subhierarchy is sub1. This illustration shows mapping coverage information for that subhierarchy from the simulation of design 2 to the coverage information for that subhierarchy from the simulation of design 1. There can be multiple instances of the subhierarchy in the design from which coverage information is mapped (mapped design). However, there can only be one instance of the subhierarchy in the design to which the coverage information is mapped (base design).
The following procedure explains how to map coverage information:

5-210
Unified Coverage Reporting
1. Compile the base design for coverage and then simulate that design while monitoring for coverage. For example:
cd /net/design1vcs -cm line sub1.v sub2.v sub3.v sub4.v main.v test.vsimv -cm line
2. Compile the mapped design for coverage and then simulate that design while monitoring for coverage. For example:
cd /net/design2vcs -cm line sub1.v sub5.v main.v test.vsimv -cm line
3. Run URG specifying the name of the top-level module in the subhierarchy. Also, specify the coverage directory for the base design, then specify the mapped design. For example:
urg -dir /net/design1/simv.vdb /net/design2/simv.vdb -map sub1
Using the above command, the generated report files only contain sections for the module instances in the subhierarchy. These module instances are identified by their hierarchical names in the first (or base) design. The coverage information in these sections is the coverage information from both designs.
If you also include the -hier compile-time option to specify a larger subhierarchy that includes the subhierarchy for which you want mapped coverage, the resulting report files contain sections for the module instances in this larger hierarchy, but the sections for the instances in the smaller subhierarchy, that is the subhierarchy with mapped coverage, also contain coverage information from the other design.
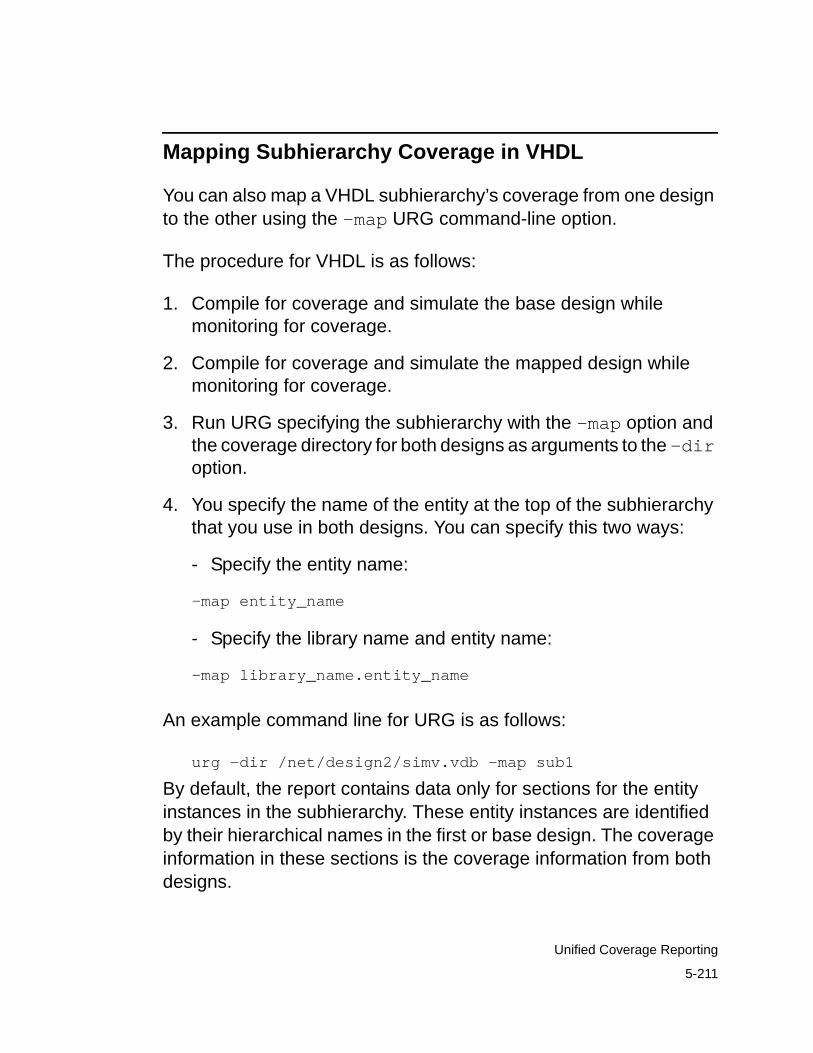
5-211
Unified Coverage Reporting
Mapping Subhierarchy Coverage in VHDL
You can also map a VHDL subhierarchy’s coverage from one design to the other using the -map URG command-line option.
The procedure for VHDL is as follows:
1. Compile for coverage and simulate the base design while monitoring for coverage.
2. Compile for coverage and simulate the mapped design while monitoring for coverage.
3. Run URG specifying the subhierarchy with the -map option and the coverage directory for both designs as arguments to the -dir option.
4. You specify the name of the entity at the top of the subhierarchy that you use in both designs. You can specify this two ways:
- Specify the entity name:
-map entity_name
- Specify the library name and entity name:
-map library_name.entity_name
An example command line for URG is as follows:
urg -dir /net/design2/simv.vdb -map sub1
By default, the report contains data only for sections for the entity instances in the subhierarchy. These entity instances are identified by their hierarchical names in the first or base design. The coverage information in these sections is the coverage information from both designs.

5-212
Unified Coverage Reporting
Understanding Instance-Based Mapping
Instance-based mapping allows you to specify an instance in your “base design” for which you want to merge coverage data for two different designs.
Assume that you have the same module instantiated in different places in two different designs. (For example, one of the designs could be a system-level design, and the other, an RTL design.)
Consider the following illustration:
My_Ip1
C
A B
B
My_Ip2
My_Ip1 My_Ip2My_Ip
Common module
Base design Input design
Here, you are able to map instances B.My_Ip1 and B.My_Ip2 to instance A.B.My_Ip1.
The mapping configuration file for the above illustration would contain the following information:
MODULE: My_IpINSTANCE:
SRC: B.My_Ip1, B.My_Ip2DST: A.B.My_Ip1
The syntax is composed of the following elements:
5-213
Unified Coverage Reporting
• MODULE: Specifies the name of the common module.
• INSTANCE: Provides source and destination information for MODULE.
• SRC: Represents the list of one or more module instances in the input design.
You can specify multiple instances in a comma-separated list after the SRC keyword. If an instance does not appear in the specified input design, VCS ignores that instance.
• DST: Represents a list of one or more module instances in the base design to which the source module instances are to be mapped.
Note:Both SRC and DST can contain either a full hierarchical path or the * wildcard.
You use the -mapfile option for instance-based mapping in URG.
The syntax is as follows:
urg -dir base.vdb -dir input.vdb -mapfile file_name
Where, file_name is the mapping configuration file.
Note the following guidelines:
• If instance name from input design matches to the pattern given in -mapfile file_name file, but if it doesn't corresponds to the module for which the pattern is given, the instance from the input design is ignored.
• Rules applied for mapping are applied on all directories given by the -dir option.

5-214
Unified Coverage Reporting
• You cannot use -mapfile and -map options together in URG.
Examples of Instance-Based Mapping
The following examples illustrate how to use the mapping configuration file syntax.
Example 1If you want to merge all instances of a specified module in the input design, use the * wildcard following SRC:
MODULE: My_IpINSTANCE:
SRC: *DST: A.B.My_Ip1
This syntax merges all the instances (B.My_Ip1, B.My_Ip2) of the input design into A.B.My_Ip1.
Example 2If you want to merge one instance of the input design into all the instances of the base design, use the * wildcard after DST:
MODULE: My_IpINSTANCE:
SRC: B.My_Ip1DST: *
This syntax merges the data from B.My_Ip1 into both A.B.My_Ip1 and A.C.My_Ip2.

5-215
Unified Coverage Reporting
Using Multiple -map Options
You can specify multiple -map options as long as you also specify the respective -dir options when using URG. For example:
urg -dir chip.vdb t1.vdb t2.vdb -map t1 -map t2
The first directory specified with -cm_dir must have both t1 and t2 instantiated.
In addition, you can use URG to merge intermediate coverage data files that were generated on different platforms. In other words, the intermediate information in the coverage directories is platform-independent.
Mapping Relocated Source File
URG determines the location of the source directory or source file using information built into the coverage database.
However, if you change the location of a source file, you can map the path to the relocated file using the -pathmap option.
By default, the source directory, which is provided at compile time, is assumed to be constant. Using this feature, you can change the location of the source file after compile time.
Syntax for relocating the source fileurg -pathmap <file>
where,
<file> — contains one or more mapping rules in the format of <from> : <to>

5-216
Unified Coverage Reporting
<from> — is an exact match of the path prefix of the original source directory.
<to> — refers to the path of the relocated directory.
For example:
urg -dir simv.vdb -pathmap pmap
The file “pmap” contains the following rule:
/home/work/src : local/files/source
Thus, for the source file /home/work/src/test1.v, URG will try local/files/source/test1.v first and then /home/work/src/test1.v.
Exclusion
Any complex design will probably have code or combinations that can never happen. For example, certain combinations of values may never occur together. When you're trying to verify the design, you want to exclude these impossible coverage targets, so you can focus testing on the parts of the design that can happen. This section explains some ways to remove impossible or uninteresting parts of the design from coverage monitoring.
There are two complementary types of exclusion. One is the exclusion of general areas that are not of interest - "don't care" exclusion. When you exclude a module, instance, covergroup, coverpoint, or cross you are saying that you don't want the scores

5-217
Unified Coverage Reporting
from those regions taken into account when computing your coverage score. From the point of view of your verification plan, it doesn't matter if they are covered or not.
The other type of exclusion is done when you are asserting that a given coverable object - for example, a signal bit, a cross bin, a line of code - cannot be covered, and therefore should not be counted when computing your coverage score. When you exclude at the object level, you are saying not to count that object because it can't be covered. In fact, it is not legal to exclude an object if it is covered, and if it becomes covered an error will be flagged.
You can exclude items interactively using DVE, and your exclusions can be saved to files that can be reloaded into a later DVE session, into the Unified Report Generator (URG), or into the Unified Coverage API (UCAPI).
Exclusion Using DVE Coverage GUI
Note:Exclusion for condition sop is not supported in DVE, because it is not supported in UCAPI.
This section contains the following topics:
• “Coverage Exclusion with DVE”
• “Excluding Covergroups”
Coverage Exclusion with DVE
In DVE, there are two steps required to exclude coverage items:

5-218
Unified Coverage Reporting
1. Marking the items to be excluded.
2. Recalculating the coverage scores.
Exclusion ModesThere are two modes available for exclusion:
Default mode - In Default mode, you can exclude anything, whether it is covered or not. Anything specified in the exclude file, including covergroups, covergroup instances, coverpoints, crosses, bins, modules, module instances, or any other coverable object will be excluded completely.
Strict mode - In Strict mode, you can exclude only uncovered objects. To enable Strict mode, you can use the DVE command line option -excl_strict, for example,
dve -dir simv.vdb -excl_strict
or choose the option "Do not allow Covered Objects to be excluded" in the DVE Application Preferences window accessed from the Edit > Preferences menu > Exclusion category. Using the preferences menu option will require that you reload the database to enable Strict mode.
In Strict mode, containers, such as vector signals in toggle coverage, conditions, control statement in branch coverage, and FSMs, may be excluded, but only the uncovered objects within those containers will actually be excluded. The covered objects will be marked as "Attempted", meaning that an attempt was made to exclude them, but they were already covered.
After you have excluded objects in DVE, you can save those exclusions to a file. The mode you are in (Default or Strict) when you create an exclude file is saved with the rest of that file's contents. If

5-219
Unified Coverage Reporting
you load an exclude file in a different mode than the mode in which it was created, a warning message will be printed, but the mode in which you are currently in will be in effect.
For example, if DVE is in Strict mode and you load an exclude file created in Default mode, you will get a warning, and only the uncovered objects specified in the exclude file will actually be excluded, since DVE is in Strict mode. In addition, a file "attempts.log" will be created listing all the covered objects that were in the exclude file but which could not be excluded.
Exclusion CommandsThe Edit > Exclusion menu commands are shown below:.
• Exclude - Marks the selected item for exclusion.
• Unexclude - Marks the selected excluded item for reinclusion.
• Recalculate - Reruns coverage calculations and displays results to include results of pending exclusion/inclusion items.
• Clear Marks - Reverts all pending exclusion/inclusion items to their original state.

5-220
Unified Coverage Reporting
Context Sensitive MenuRight-click in the Summary window to display the context-sensitive menu (CSM) and Exclude or include items:
Exclusion ToolbarThe exclusion toolbar has six buttons:
Exclude
Unexclude
Recalculate

5-221
Unified Coverage Reporting
Clear Exclusion
Load Exclusion
Save Exclusion
Excluding ItemsYou can mark the items by first selecting them and then exclude or include them either through the CSM or the main menus. You can select and mark multiple items simultaneously.
When all of the selected items are excluded, only the Include menus are enabled. When all of the selected items are included, then only the Exclude menus are enabled. If there is a mix of included and excluded items, both menus are enabled.
Adding Exclusion AnnotationYou can add an annotation to the excluded coverable objects, such as mentioning the reason behind the exclusion to an exclusion file. Upon loading the elfile, the annotation can be displayed in URG reports and the DVE coverage GUI. Consider the following exclusion file as an example:
MODULE : topANNOTATION: "Unreachable signal"Toggle a
In this example, you add the annotation "Unreachable signal" to signal a of module top, which you want to exclude. You can add, edit, and delete exclusion annotation to an excluded object or scope in DVE.

5-222
Unified Coverage Reporting
Note:The annotation is not added for the scope, container, or object that is not excluded/partially excluded, even if you have it in the elfile or edit it in the GUI before recalculation. The annotation will only be set for the fully excluded object, scope, or container after recalculation.
To add and delete exclusion annotation
1. Start DVE in coverage mode.
2. Load the coverage database.
3. Select the object or scope in the Hierarchy pane, Detail view, or Summary view.
4. Right-click on a object to mark for exclusion.

5-223
Unified Coverage Reporting
5. Right-click on the excluded object, scope, or container and select Edit Exclude Annotation.

5-224
Unified Coverage Reporting
The Add Exclude Annotation dialog box appears that contains the following fields.
- Exclude annotation — Identifies a text area where you can type your exclusion annotation.
- Available annotations — Lists all the annotations that you have created.
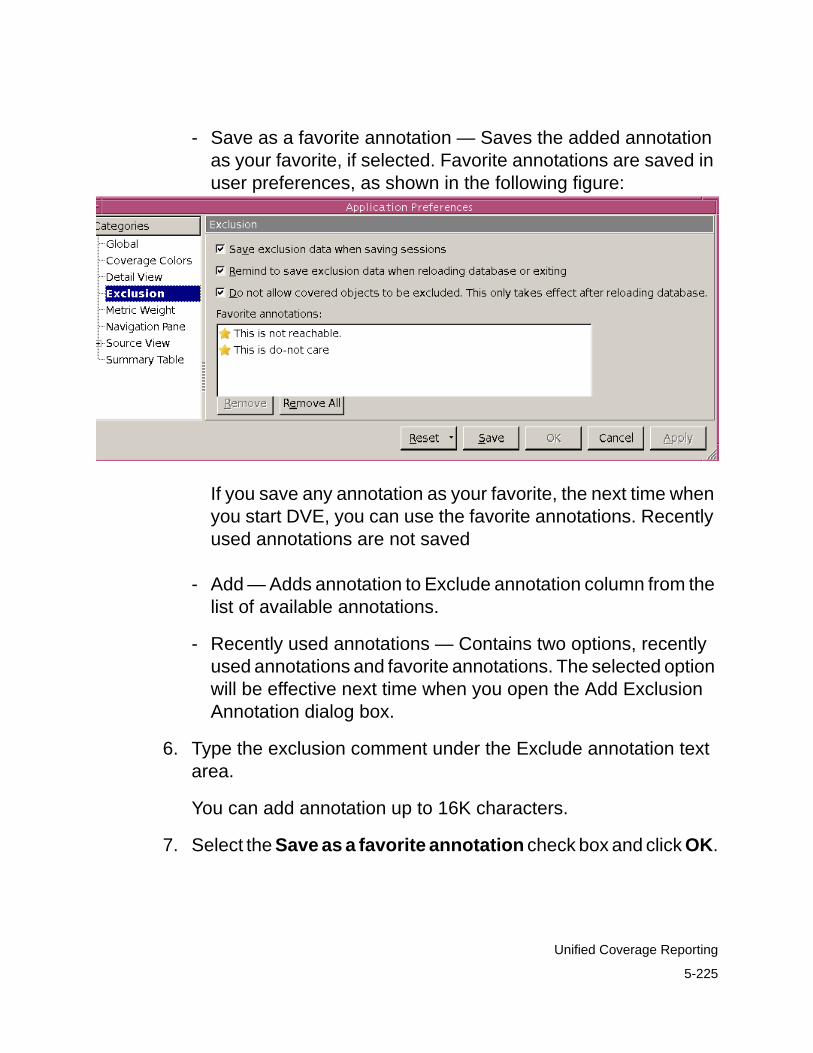
5-225
Unified Coverage Reporting
- Save as a favorite annotation — Saves the added annotation as your favorite, if selected. Favorite annotations are saved in user preferences, as shown in the following figure:
If you save any annotation as your favorite, the next time when you start DVE, you can use the favorite annotations. Recently used annotations are not saved
- Add — Adds annotation to Exclude annotation column from the list of available annotations.
- Recently used annotations — Contains two options, recently used annotations and favorite annotations. The selected option will be effective next time when you open the Add Exclusion Annotation dialog box.
6. Type the exclusion comment under the Exclude annotation text area.
You can add annotation up to 16K characters.
7. Select the Save as a favorite annotation check box and click OK.

5-226
Unified Coverage Reporting
The exclusion annotation is saved and is displayed in the tooltip, when you point your mouse over the object, container, or scope, in the Summary view.
The following icon indicates the item is annotated.
8. Select the object in the Hierarchy pane, right-click and select Delete Exclude Annotation.
The exclusion annotation is deleted.
Note:- You can select multiple objects to add the same annotation.
- The annotation on module is not propagated to its instances.
You cannot add annotations to unexcluded objects.
Recalculating Coverage ScoresOnce items are marked, the system needs to recalculate the
coverage scores. Select from the toolbar or Edit > Exclusion > Recalculate to view results with the excluded/included results.
The Recalculate command is disabled until an item is marked. After recalculation, it is once again disabled.
To save time, it is recommended that you mark multiple items before recalculating rather than recalculating after marking each item.
Exclusion StatesEvery coverable item has an exclusion state associated with it. The state can be:

5-227
Unified Coverage Reporting
• Included (default) - All items are included unless explicitly excluded.
• Excluded - Excluded items are those items which have been ignored for the purpose of calculating coverage metrics.
• Partially Excluded - Regions or items that contain multiple coverable objects will be marked "Partially Excluded" if some but not all of the contained objects are excluded. The objects that may be marked Partially Excluded include covergroups, covergroup instances, coverpoints, crosses, and code coverage objects such as signal vectors in toggle coverage, conditions, vectors, branch statements, or FSMs.
• Attempted - The Attempted state is only used in Strict mode. If an object or region is marked Attempted, it means that you, or an exclude file you loaded, tried to exclude items that were marked covered. You can only see the Attempted mark in the detailed view, where items marked as Attempted are shown in the "Attempted" column.
Exclusion State MarkersMarker icons in DVE are circles with symbols inside. You can view the exclusion markers in the Detail window and Source window.
• Pending items marked to be excluded are indicated by a minus sign in a green circle. Pending items marked to be included are indicated as a plus sign in a green circle. The following are the exclusion icons:
• Excluded items are indicated with an x in a red circle.

5-228
Unified Coverage Reporting
• When a line is partially marked or excluded with the Partial Exclusion symbol:
• The following is the exclusion marker for “Attempted” state:
Tooltips on these symbols indicate the statement or metric that is marked.
List view panes (summary and detail) have an additional column showing the exclusion markers.
For additional clarity, excluded items have their coverage bars grayed out and values removed. The bars will continue to display as they still impart useful information.

5-229
Unified Coverage Reporting
Setting PreferencesYou can set your exclusion preferences in the Application Preferences window.
To set exclusion preferences
1. Click Edit > Preferences.
The Application Preferences dialog appears.
2. Click the Exclusion category and select any of the following options:
- Save exclusion data when saving session – Select this option when you want the exclusion data to get saved automatically while saving the session.
- Remind to save exclusion data when reloading database or exiting – Select this option when you want DVE to remind you while reloading your database or you are exiting DVE.
- Do not allow covered objects to be excluded – Select this option when you do not want to exclude the covered objects. This option is to enable the Strict exclusion mode. You will need to reload the database after changing the exclusion mode.
3. Click Apply to save the settings or OK to close the Applications Preferences window.
Interactive Marking within Detail ViewsWithin the source windows, items can be marked in various ways:
• Menus - Select the item and use the CSM, Edit menu, or toolbar in the standard fashion.
5-230
Unified Coverage Reporting
• Margin - Click in the left hand column of the margin to toggle the mark. Depending upon the contents of the line being marked the system will mark all related items. All excludable items are initially marked with an empty green circle. Lines that do not contain this icon do not represent excludable items.
• Lines containing multiple excludable items are marked with a special icon when the items on the line are at different exclusion states. This line is referred to as being partially excluded.
Excludable items are marked with the .

5-231
Unified Coverage Reporting
Figure 5-11 Detail view showing markers in Source and List windows
Within the list views, you can toggle the exclusion markers by clicking them. The markers toggle as follows:
• Excluded -> Include Pending
• Included -> Exclude Pending
• Include Pending -> Excluded
• Exclude Pending -> Included

5-232
Unified Coverage Reporting
Exclusion BrowserUse the exclusion browser in the toolbar to navigate coverage items based on their exclusion status.
Saving and Loading Saved Exclusion StatesThere are two ways to save exclusion states:
• Using the File > Save Exclusions command.
• Using the Edit > Preferences > Exclusion, then select Save exclusion data when saving sessions.
To save an exclusion state
1. Select File > Save Exclusions.
The Save Exclusion File dialog box appears.

5-233
Unified Coverage Reporting
2. Enter a name for the exclude file.
3. Select the New Format radio button, if not already selected.
If you select the Old format radio button, a warning message appears.
4. Click OK.
The exclusion state is saved.
To load a previously saved exclusion state
1. Select File > Load Exclusions.
The Load Exclusion dialog box appears.
2. Select a previously saved exclude file.
3. Click OK.
The exclusion state is loaded.

5-234
Unified Coverage Reporting
Attempt to Load Excluded Covered ItemsIn Strict mode, covered items cannot be excluded. When you load an exclude file containing covered items in Strict mode, a warning is given, and you can either select continue, which will continue without excluding the covered items, you can view details of the covered items, or abort the exclude file loading operation and exit DVE.
Excluding Multiple Objects in a Single LineYou can exclude multiple objects in a single line of source code. This feature is supported in all metrics.
To exclude/include an object in a line
1. Select the line of code in the Source window.

5-235
Unified Coverage Reporting
2. Right-click the green exclusion marker beside a particular line number and select the exclude/include option.
The object is excluded/included.
Hierarchical ExclusionSome views display object hierarchy as trees. When marking tree branches, all child objects within that branch will also be marked. This is true whether or not the child items are visible in the navigation pane at the time the parent object was marked.
Marking an object in one view will automatically mark the same object in all other views in which it appears.

5-236
Unified Coverage Reporting
For hierarchical excludable items in toggle, condition, branch, FSM, or assertion coverage, you can mark a branch of the hierarchy simply by selecting the root of the branch. In such a case, all items in the branch are marked, not just the root. This makes the exclusion explicit.
Note that excluding an instance will only exclude that specific instance itself, not other instances within it. You can use the "Exclude Tree/Unexclude Tree" options in the CSM to mark the hierarchy for exclusion or re-inclusion.
Different object types have different exclusion rules associated with them. For example, if a module is excluded none of its instances can be included.
Note:If a module itself is excluded, coverable objects at the instance level can not be later included through DVE. However, if the module definition is not totally excluded, coverable objects at the instance level, which were excluded in the module can later be included in DVE.
Excluding Half Toggle TransitionsToggle Coverage for a bit is combination of two sequences 0 -> 1 and 1 -> 0, which gets counted in the final score of the toggle coverage. The total count of toggle coverable objects for signal is the number of bits in that signal times two, where two is number of sequence per bit.
You can exclude either sequence of a given bit in a signal. For example, you can exclude only the 0 to 1 transition for a bit.
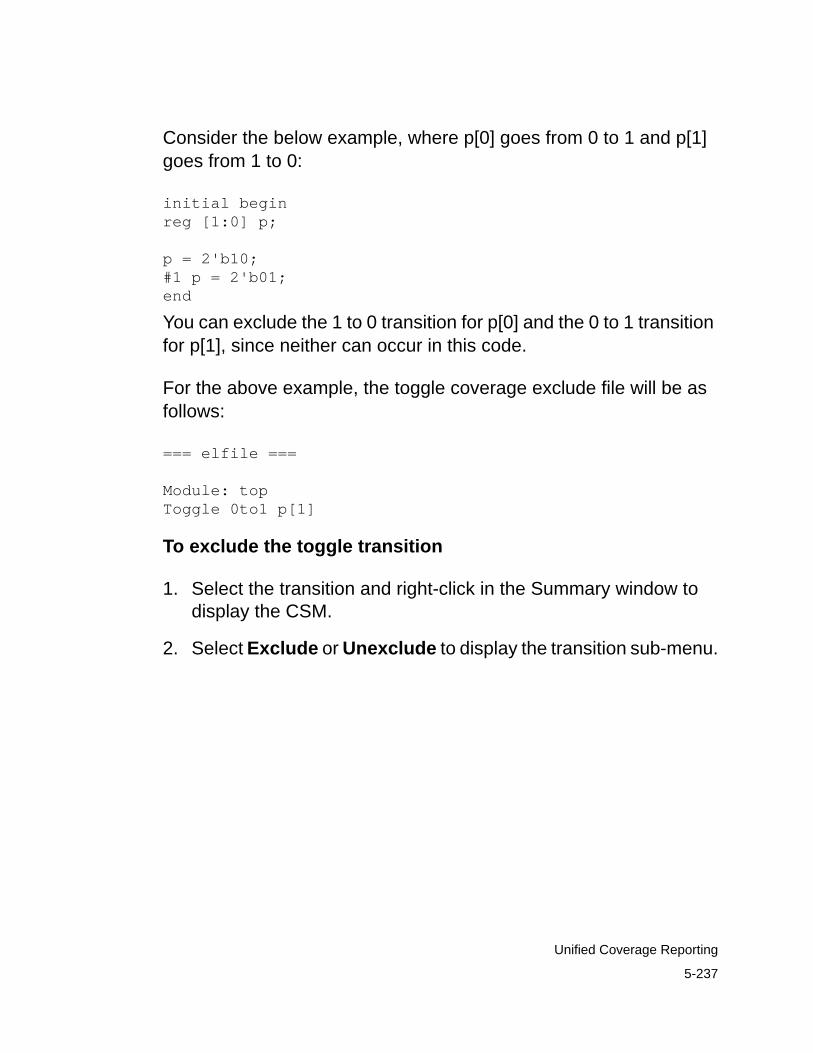
5-237
Unified Coverage Reporting
Consider the below example, where p[0] goes from 0 to 1 and p[1] goes from 1 to 0:
initial beginreg [1:0] p;
p = 2'b10;#1 p = 2'b01;end
You can exclude the 1 to 0 transition for p[0] and the 0 to 1 transition for p[1], since neither can occur in this code.
For the above example, the toggle coverage exclude file will be as follows:
=== elfile ===
Module: topToggle 0to1 p[1]
To exclude the toggle transition
1. Select the transition and right-click in the Summary window to display the CSM.
2. Select Exclude or Unexclude to display the transition sub-menu.

5-238
Unified Coverage Reporting
3. Select any of the following sub-menu as desired:
- All - Marks "Exclude/Unexclude" for the whole selected item (signal or vector).
- 0=>1 - Marks "Exclude/Unexclude" for all 0=>1 transitions in the selected item.
- 1=>0 - Marks "Exclude/Unexclude" for all 1=>0 transitions in the selected item.
Note:Verilog MDA's exclusion is not supported with URG, and DVE Coverage.
Excluding Covergroups
You can exclude covergroups, cover items, or the constituent bins in the DVE Coverage GUI.

5-239
Unified Coverage Reporting
To exclude covergroups in DVE
1. Start DVE in coverage mode.
2. Load the Coverage Database.
The DVE coverage windows are populated with the coverage data.
3. Select the covergroup in the Navigation pane.
The covergroup items (coverpoints and bins) are displayed in the Summary window.
4. Modify the covergroup data with the following steps:
- Select the coverpoints/crosses under the covergroup in the Summary window and exclude/include using the CSM.

5-240
Unified Coverage Reporting
- View the source file with annotations indicating covered and uncovered lines or objects in the Annotated Source window.
- View the excluded coverpoints/crosses in Table or Map view in the Detail window.
- Save the exclusion data as elfile.
- Load/Reload saved exclude files.
For more information about how to save/load the exclusion data, see “Saving and Loading Saved Exclusion States” on page 232.
Note:In Strict mode, you cannot exclude a cover point/cross once the score is 100%. When the score is greater than 0 and less than 100, its uncovered children are excluded and covered children are marked as attempted.
Exclusion PropagationCoverpoint and coverpoint bins exclusion are propagated to the crosses automatically. If you exclude coverpoint or coverpoint bins, cross or cross bins containing the coverpoints are excluded as well.

5-241
Unified Coverage Reporting
VariantsVariants are different shapes of the covergroup definition due to module instance or parameterized covergroup instance.
In the above illustration, the covergroup definition coin_fsm::Cvr defined in module coin_fsm has 5 different variants created for each instance of the module.
Excluding Auto Cross BinsYou can exclude the auto cross bins either directly in the Detail window or using the Edit Exclusion sub-menu.

5-242
Unified Coverage Reporting
To exclude auto cross bins
1. Select auto cross bins in the Summary window.
2. Right-click and select Expand.
The compressed bins are visible.
3. Select Exclude/Unexclude icons to exclude/include the sub-bins.
Generating URG Reports Using Exclude Files
This section describes how to use exclude file with URG to remove excluded items from URG-generated reports. The file created using DVE, or manually, is passed to URG using the command-line option -elfile. Excluded items are marked “excluded” in the generated reports, and not taken into account for computing coverage scores.
To pass the exclude file to URG, the switch elfile is used:
urg –dir … –elfile filename.el
The figure Figure 5-12 shows a normal URG report with the total coverage summary. This report displays the total coverage numbers for the line, condition, toggle, FSM and branch coverage. For example:
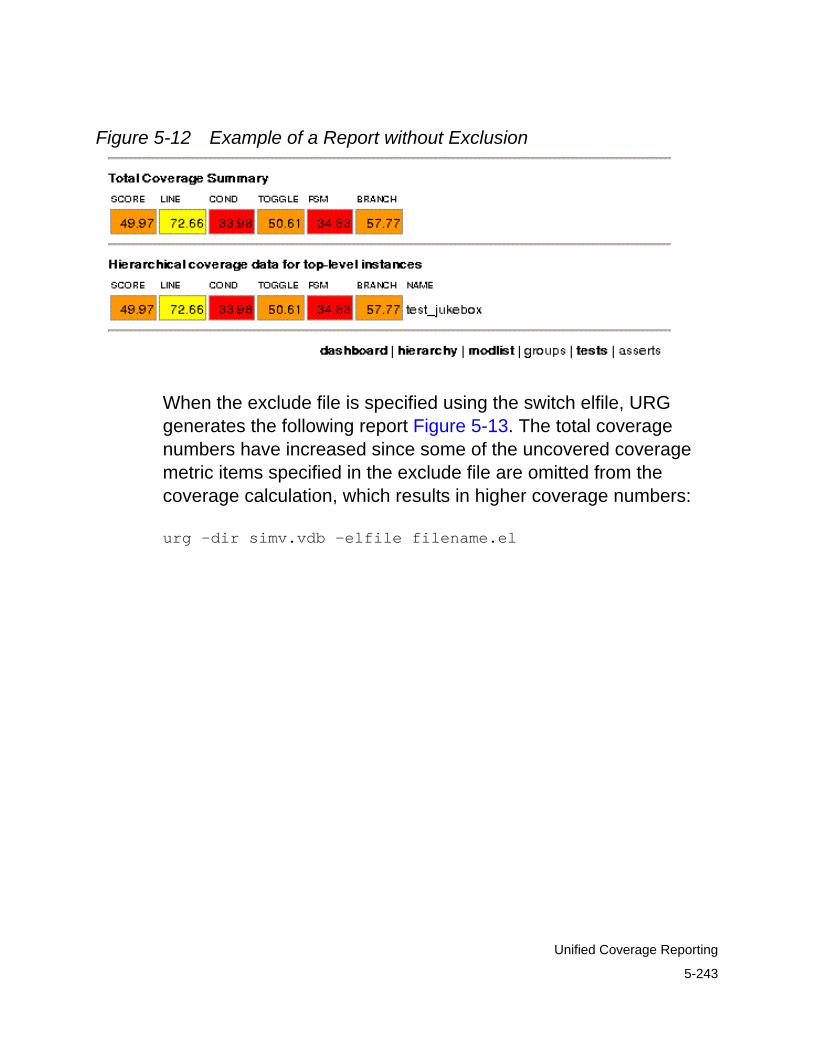
5-243
Unified Coverage Reporting
Figure 5-12 Example of a Report without Exclusion
When the exclude file is specified using the switch elfile, URG generates the following report Figure 5-13. The total coverage numbers have increased since some of the uncovered coverage metric items specified in the exclude file are omitted from the coverage calculation, which results in higher coverage numbers:
urg –dir simv.vdb –elfile filename.el

5-244
Unified Coverage Reporting
Figure 5-13 Example of a Report generated with an exclude file
Exclusion in Strict Mode
By default, URG allows any objects to be excluded with an exclude file. To disallow the exclusion of covered objects, use the -excl_strict switch:
urg -dir simv.vdb -elfile e2.el -excl_strict
If the exclude file you load contains any objects that are covered, those objects will not be excluded, and will be reported as “attempted” in the file “attempts.log.”
Covergroup Exclusion in URG
You can do the following things for covergroup exclusion in URG:
• You can specify a covergroup within the design hierarchy or a fully-qualified covergroup name as seen in URG report in the elfile. URG report includes the complete design hierarchy name also as a part of the covergroup name.

5-245
Unified Coverage Reporting
• You can specify the bins level exclusion in terms of its name.
• For a compact and easy specification especially for automatic bins, URG report prints an identifier (which is a number in an increasing order) for each of the bins in a cover point and a cross. This numbering scheme is generated for all bins in each of the coverpoint.
You can specify bins level exclusion in terms of list of these identifiers.
• You can specify automatic cross bins in terms of their identifiers or in terms of the bins identifiers of the constituent cover items of that particular cross.
Editing Exclude Files
You can use a text editor to modify exclude files created with DVE. This section describes the format to use when working with an exclude file. DVE saves the exclude files with a ".el" extension.
The Exclude File FormatWhen editing an exclude file, you must follow the format as described in this section.
Elfile ChecksumWhen exclusions are saved into a file, DVE generates a checksum for the exclusions and dumps it into the file. This checksum is obtained from the metric variant checksum information and names of the modules (or covergroups for testbench metric). The purpose of the checksum is to synchronize the checks.

5-246
Unified Coverage Reporting
It is better to create exclude files using DVE and, if desired, edit them. However, if you do create your own file from scratch without the check_sum, the synchronization checks are not done.
For code coverage metrics, one line per excluded module is dumped and this line consists of checksums of all the metrics of which objects are excluded. This line starts with the prefix \\ MOD_CHKSUM. Here is an example:
\\ MOD_CHKSUM: 3 mod v11 L1411939641 v11 T1074138296 v11 C2409237268 v10 B301527767
For covergroup metric, the checksum information starts with the prefix // Checksum and consists of the names of the excluded covergroups and its instances. An example is shown below:
// Checksum: 300200840 3953929699 cg4_i | 3562878031 3865826166 cg3_i | 1282958077 2393771040 cg2_i
Line Exclusion FormatThe line exclusion format example is shown below. It identifies the file, the instance, module, and the lines excluded. Note that lines 76 and 77 are if statements with two coverage possibilities.
Verilog FileINSTANCE: top3.D2MODULE: top.testFILE: /root/a/b.vLine 76.0:76.1Line 77.0:77.1Line 84
Example
71 always @ in

5-247
Unified Coverage Reporting
72 begin 73 next = state; // by default hold 74 case (state) 75 idle : if (in) next = first; 76 first : if (in) next = second; 77 second : if (in) next = third; 78 third : if (in) next = idle;URG Report76 excluded first : if (in) next = second; ==> MISSING_ELSE77 excluded second : if (in) next = third; ==> MISSING_ELSE78 2/2 third : if (in) next = idle; ==> MISSING_ELSE ==> MISSING_DEFAULT79 endcase
Toggle Exclusion FormatThe toggle exclusion format shown below identifies the instance, module, and toggle ID.
Verilog File
1 module top;2 reg [26:10] top_var1;3 reg [26:10] top_var2;4 reg top_var3;5 reg top_var4;6 reg top_var5;7 8 wire [26:10]top_net1, top_net2;9 wire top_net3, top_net4, top_net5;
… …endmodule
Exclusion FormatINSTANCE: topToggle top_net1Toggle 0to1 top_net2[26:10]

5-248
Unified Coverage Reporting
Toggle 1to0 top_net3
URG ReportNet Details
Toggle Toggle 1->0 Toggle 0->1 Direction
top_net1[26:10] Excluded Excluded Excludedtop_net2[14:10] No No Excludedtop_net2[20:15] Yes Yes Excludedtop_net2[23:21] No Yes Excludedtop_net2[25:24] No No Excludedtop_net2[26] No Yes Excludedtop_net3 No Excluded Yes
FSM Exclusion FormatThe FSM exclusion format below identifies the instance, module, and the FSM, and also an optional state and transition exclusion.
Verilog Filereg [1:0] state,next;parameter idle = 2'b00, first = 2'b01, second = 2'b10, third = 2'b11;... ...always @ inbeginnext = state; // by default holdcase (state)idle : if (in) next = first;first : if (in) next = second;second : if (in) next = third;third : if (in) next = idle;endcaseend
always @ (posedge clk)state=next;

5-249
Unified Coverage Reporting
Exclusion FormatINSTANCE: top1MODULE: devFSM stateState firstState secondState thirdTransition idle->firstTransition first->secondTransition second->thirdTransition third->idle
URG ReportState, Transition and Sequence Details for FSM :: statestates Coveredidle Coveredfirst Attemptedsecond Attemptedthird Excluded transitions Coveredidle->first Attemptedfirst->second Attemptedsecond->third Excludedthird->idle Excluded...
Condition Exclusion FormatThe excluded condition format shows the instance, module, condition, and condition vectors.
Verilog file56 input clk,in;57 output [1:0] state;
58 wire e; 59 assign e = clk ? 1'b0:1'b1; 60 reg [1:0] state,next;

5-250
Unified Coverage Reporting
Exclusion FormatINSTANCE: top3.D3Condition 1 (1)Condition 1 (2)
URG ReportLINE 59 EXPRESSION (clk ? 1'b0 : 1'b1) -1--1- Status0 Excluded1 Excluded
Branch Exclusion FormatThe excluded branch format shows the instance, the module, and the vector ID representing the excluded branches.
Verilog file24 always@(posedge clk) 25 begin 26 // nested if's 27 if ( e && f) 28 begin 29 $display("s3"); 30 if ( g && h) 31 $display("s4"); 32 end 33 end
Exclusion FormatMODULE: testBranch 2 (0)Branch 2 (1)
URG Report27 if ( e && f) -1-

5-251
Unified Coverage Reporting
28 begin29 $display("s3");30 if ( g && h) -2-31 $display("s4"); ==> MISSING_ELSE ==>32 end MISSING_ELSE ==>
Branches-1- -2- Status1 1 Excluded1 0 Excluded0 - Covered
Assertion Exclusion FormatThe excluded assertion format shows the instance, the module, and the assertion name that is excluded.
INSTANCE: tb.dutMODULE: top.testAssert a_one_yellow
Covergroup Exclusion FormatGiven below is a snapshot of covergroup code and various elfile examples:
module M; … bit [3:0] x; integer y; integer z;
covergroup cov1; cp1: coverpoint x;

5-252
Unified Coverage Reporting
cp2: coverpoint y { bins b1 = {100}; bins b2 = {200}; bins b3 = {300}; bins b4 = {400}; bins b5 = {500}; } cp3: coverpoint z {
bins zb1[] = {[10:18]}; bins zb2 = {4543}; } cc1: cross cp1, cp2, cp3 { bins cb1 = binsof(cp2.b2); } cc2: cross cp1, cp2, cp3;
endgroup
covergroup cov2; coverpoint cp1 { … } coverpoint cp2 { … } coverpoint cp3 { … } cc1: cross cp3, cp2; cc2: cross cp2, cp1;
endgroup
cov1 cov1_inst1 = new; cov2 cov2_inst1 = new;…endmodule
module top; M i1();

5-253
Unified Coverage Reporting
M i2();…endmodule
Example elfile1covergroup top.i1::cov1covergroup top.i2.cov2_inst1
The above elfile specifies that covergroup cov1 in design hierarchy top.i1 and instance cov2_inst1 of covergroup cov2 in design hierarchy top.i2 should be excluded. The hierarchy of an instance is same as that of its definition; In covergroup definitions,'::' serves as the resolution operator, while it is '.' in instances. For instance, covergroup cov2 in the above example is represented as top.i1::cov2, while its instance cov2_inst1 is specified as top.i1.cov2_inst1.
Example elfile2covergroup top.i1::cov1
coveritem cp2bins b1, b2 //Multiple bins grouped in a comma
separated listcoveritem cc2
covergroup top.i1::cov2coveritem cp1, cp2 //Multiple coverpoints/crosses
grouped in a comma-separated list covergroup top.i1::cov2, top.i1::cov3 //Multiple cover group
definitions grouped in a comma-separated list
coveritem cp2
Multiple covergroup instances having common exclusion items can similarly grouped in a single comma-separated list.

5-254
Unified Coverage Reporting
Example elfile3covergroup top.i1::cov1
coveritem cp1bins auto[8], auto[10], auto[11], auto[12], auto[13] coveritem cp2bins b3, b5coveritem cp3bins zb2coveritem cc1bins cb1coveritem cc2
bins {{auto[1], auto[4]}, {b2}, {zb1[13], zb1[14], zb2}}
covergroup top.i2.cov2_inst1coveritem cc1, cc2
In the above example, the five auto bins auto[8], auto[10], auto[11], auto[12], auto[13] can be specified in a compressed form: auto[8], auto[10-13] or auto[8], auto[10]-auto[13]. This representation is particularly useful to specify coverage holes, which are reported in compressed format by URG.
The auto cross bins specification {{auto[1], auto[4]}, {b2}, {zb1[13], zb1[14], zb2}} subsumes six auto bins of the cross cc2, corresponding to the following six combinations of coverpoint bins:
cp1 cp2 cp3auto[1] b2 zb1[13] auto[1] b2 zb1[14]auto[1] b2 zb2auto[4] b2 zb1[13]auto[4] b2 zb1[14]auto[4] b2 zb2

5-255
Unified Coverage Reporting
Example elfile4covergroup top.i1::cov1
coveritem cp2coveritem cc1
bins {{auto[1], auto[ 8]}, {}, {zb1[18]}} // {} - Consider all bins of cp2 in cross exclusion
coveritem cc2
bins {{},{},{}} //Equivalent to excluding all bins of the cross cc2
Example elfile5
Consider the uncovered bins printed for the cross cc1 in URG report as shown below:
cp1 cp2 cp3 COUNT AT LEAST NUMBER* [b5 , b4 , b3] * -- -- 1056
The above compressed representation of uncovered bins can be excluded as shown below:
covergroup top.i1::cov1coveritem cc1bins {{},{b3,b4,b5},{}}
Thus, URG will automatically exclude these uncovered bins while generating URG report.
Exclusion Annotations in URG
You can view the exclusion annotation in URG, in the last column of each coverable object, in the table for Condition, FSM, Toggle, and Branch. For Line coverage, you can see the annotation in the line below the excluded line in the Line Coverage Report.

5-256
Unified Coverage Reporting
Following is an example of exclusion annotation in a Branch coverage report:
Note:The existing annotation is overwritten when loading multiple exclusion files if there are annotations in each file for a scope/object.
Exclusion Annotation SyntaxThe annotation in the Exclude file is added before the coverable object.
The keywords - ANNOTATION, ANNOTATION_BEGIN, and ANNOTATIION_END are used to describe annotations.
The ANNOTATION keyword is used for adding annotation to a single scope/object.
The ANNOTATION_BEGIN/ANNOTATION_END keywords are used for adding annotations for scopes or containers.
Example 1MODULE: top

5-257
Unified Coverage Reporting
ANNOTATION: "it is unreachable." Signal asignal b
In the above example only signal "a" is excluded and annotated.
Example 2INSTANCE: TOP.CPU.ALU
ANNOTATION_BEGIN: "unreachable"Condition 1 (1)Condition 1 (2)Condition 1.1 (1)Condition 1.1 (2)
ANNOTATION_END
Exclusion in UCAPI
UCAPI allows you to mark some objects as excluded, which means they are ignored when computing the covdbCoverable and covdbCovered properties of handles - they are excluded from the computation of the coverage score. This section describes how objects and regions can be excluded.
Hierarchy Exclusion Files
UCAPI supports hierarchy exclusion files, which allow you to specify source regions, design hierarchies, and some individual objects for exclusion or explicit inclusion for coverage. For example, a hierarchy exclusion file with the following content would exclude the sub-hierarchy of the design rooted at the path top.d1:
-tree top.d1

5-258
Unified Coverage Reporting
See the VCS Coverage Metrics User Guide for the complete description of the hierarchy exclusion file syntax.
Hierarchy exclusion files are loaded using the covdb_loadmerge function with an already-loaded design handle:
covdb_loadmerge(covdbHierFile, designHdl, filename);
Exclusion by Object Handle
Applications may set the covdbExcludedAtReportTime flag using the covdb_set function:
status = covdb_get(obj, region, test, covdbCovStatus);status = status |= covdbStatusExcludedAtReportTime; covdb_set(obj, region, test, covdbCovStatus, status);
When an object is marked excluded, it no longer contributes its covdbCoverable (or covdbCovered) count to the count of any containing object or region. For example, if you exclude a statement in a basic block, it lowers the covdbCoverable count of the basic block by 1.
Exclusion bits set using the covdb_set function are not saved to the main UCAPI database or to test files – they are saved to a separate exclusion file. Exclusion is saved using the covdb_save_exclude_file function:
covdb_save_exclude_file(testHdl, “myexcludes.el”, “w”);
Either a design handle or a test handle must be given as the first argument. If the first argument is a test handle, then all exclusions of non-test-qualified objects are saved to the file, along with any exclusions of objects in test-qualified regions that appear in that test. If the first argument is a design handle, then only exclusions of non-test-qualified objects are saved.
5-259
Unified Coverage Reporting
Exclude files can be saved with mode “w” (write a new file, overwriting if the file already exists) or mode “a” (append the exclusion data onto an existing file).
You can load a previously-saved exclude file using covdb_load_exclude_file:
covdb_load_exclude_file(testHdl, “projectexcl.el”);
As for the covdb_save_exclude_file function, a design handle or a test handle may be given as the first argument. If a test handle is given, exclusions will apply to all non-test-qualified objects as well as to any test-qualified objects in the specified test. If a design handle is given, exclusions will be loaded only for non-test-qualified objects.
The covdb_unload_exclusion function removes all covdbExcludedAtReportTime bits from all coverable objects in the design.
covdb_unload_exclusion(designHdl);
Default vs. Strict Exclusion
UCAPI has two exclusion modes - default and strict. In default mode, any object may be excluded. The exclusion mode can be selected using the covdb_configure function. To change the mode from default to strict:
covdb_configure(designHdl, covdbExcludeMode, "strict");
In strict mode, excluding a covered object is illegal. If a container is excluded, then only the uncovered objects in that container will be excluded. If a region, such as a module, is excluded, then only the uncovered objects throughout that region will be excluded.

5-260
Unified Coverage Reporting
In strict mode, UCAPI keeps track of the covered objects that were in regions or containers that were excluded - it calls these "attempted exclude" objects. The list of such objects can be saved to a file using the covdb_save_attempted_file function. For example:
covdb_save_attempted_file(mytestHdl, "attempts.txt", "w");
The third argument specifies that the file should be overwritten. Applications can also use ‘a’ to append the attempts to the specified file.
Editing the Covergroup Coverage Database
A URG command option, -group db_edit_file, opens the coverage database for editing. An example of the URG command with the -group db_edit_file option is follows.
urg -dir first.vdb -format text -report hier_rep -group db_edit_file db-edit-filename -dbname save/edited
The db_edit_filename is a user-written file that contains funccov and assert statements in the format described in “db_edit_file Syntax” .
A funccov statement is used to reset or delete covergroup coverage data. An assert statement is used to reset or delete assertion coverage data. Examples of those statements are shown in “db_edit_file Syntax” .
Note:You cannot edit the code coverage database.
This section contains the following topics:

5-261
Unified Coverage Reporting
• “db_edit_file Syntax”
• “Resetting Covergroups or Coverpoints”
• “Removing Covergroups from the Database”
• “Editing the Assertion Coverage Database”
db_edit_file Syntax
The syntax for editing covergroups in the coverage database is:
begin funccov (reset|delete) (module|tree) (module-name|instance-name) covergroup-name [optional coverpoints or crosses]end
The module parameter can be a module, interface, or program.
The tree parameter can be a module instance, interface instance, or program instance. Pathnames in trees must use periods (“.”) as instance delimiters.
The syntax for editing assertions in the coverage database is:
begin assert (reset|delete) (module|tree) (module-name|instance-name) [optional assertions]end
Resetting Covergroups or Coverpoints
Example 5-1 resets the covergroup named gc in the top.i1 module instance.

5-262
Unified Coverage Reporting
Example 5-1 begin funccov reset tree top.i1 gc end
Example 5-2 resets the covergroup named gc under all instances of the my_mod module definition.
Example 5-2 begin funccov reset module my_mod gc end
Example 5-3 resets the coverpoint or crosspoint named ra under the covergroup named gc under all instances of the my_mod module definition.
Example 5-3 begin funccov reset module my_mod gc ra end
Example 5-4 resets the coverpoint or crosspoint named ra under the covergroup named gc under all instances of top.i1.
Example 5-4 begin funccov reset tree top.i1 gc ra end
Removing Covergroups from the Database
Example 5-5 deletes the covergroup named gc under all instances of the my_mod module definition.
Example 5-5 begin funccov delete module my_mod gc end
Example 5-6 deletes the covergroup named gc under all instances of top.i1.

5-263
Unified Coverage Reporting
Example 5-6 begin funccov delete tree top.i1 gc end
Editing the Assertion Coverage Database
The syntax is similar assertions is similar to the syntax for functional covergroups:
begin assert (reset|delete) (module|tree) (module_name|instance_name) [optional assertions] end
This section contains the following topics:
• “Resetting the Coverage Scores for Assertions”
• “Removing Assertions from the Coverage Database”
Resetting the Coverage Scores for Assertions
Example 5-7 resets the hit counts for the mid_first assertion in the top.i1 instance.
Example 5-7 begin assert reset tree top.i1 mid_first end
Example 5-8 resets hit counts of all assertions under the top.i1 instance.
Example 5-8 begin assert reset tree top.i1 end

5-264
Unified Coverage Reporting
Removing Assertions from the Coverage Database
Example 5-9 deletes the mid_first assertion from the top.i1 instance.
Example 5-9 begin assert delete tree top.i1 mid_first end
Example 5-10 deletes all assertions under the top.i1 instance.
Example 5-10 begin assert delete tree top.i1 end
Example 5-11 deletes the mid_first assertion from all instances of the mid module.
Example 5-11 begin assert delete module mid mid_first end
Example 5-12 deletes all assertions from all instances of the mid module.
Example 5-12 begin assert delete module mid end
6-265
Unified Coverage Reporting
6Unified Coverage API 1
This chapter contains the following sections:
• “Overview”
• “Data Model”
• “Predefined Coverage Metrics”
• “Loading a Design”
Overview
The Unified Coverage Application Programming Interface, or UCAPI, provides a single, consistent, and extensible interface to access coverage data generated by Synopsys tools. With this API, you can create custom reports and tools for displaying and analyzing coverage data.
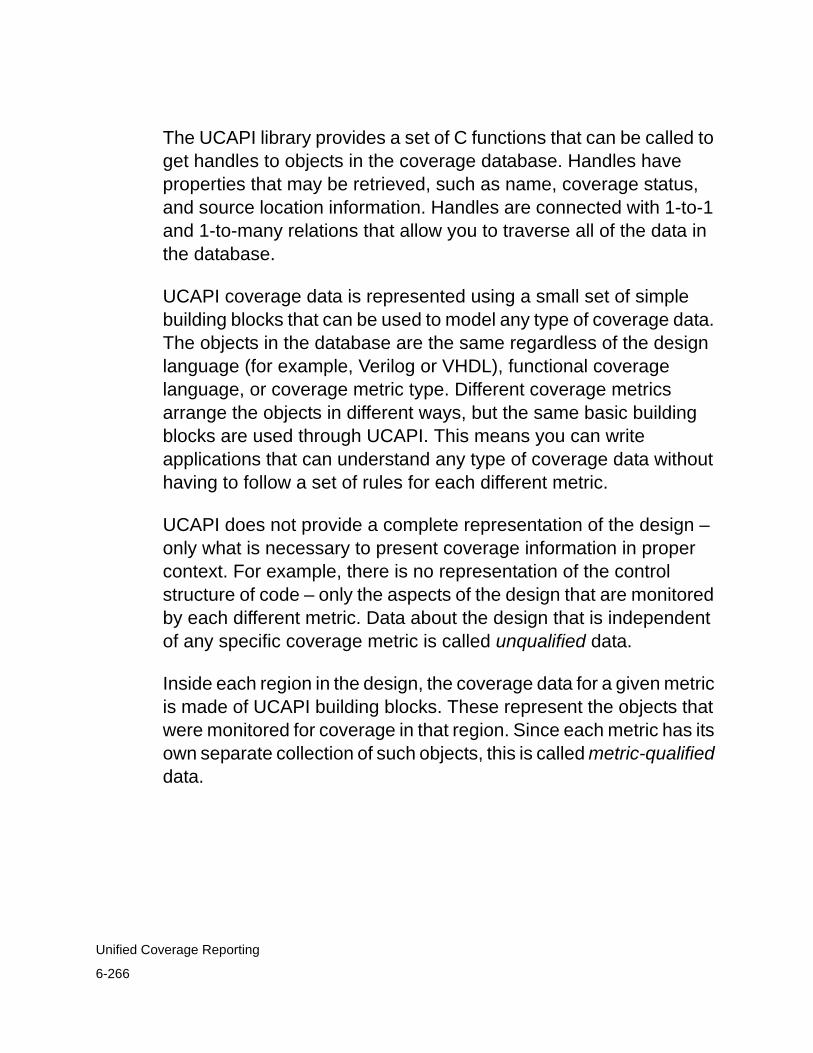
6-266
Unified Coverage Reporting
The UCAPI library provides a set of C functions that can be called to get handles to objects in the coverage database. Handles have properties that may be retrieved, such as name, coverage status, and source location information. Handles are connected with 1-to-1 and 1-to-many relations that allow you to traverse all of the data in the database.
UCAPI coverage data is represented using a small set of simple building blocks that can be used to model any type of coverage data. The objects in the database are the same regardless of the design language (for example, Verilog or VHDL), functional coverage language, or coverage metric type. Different coverage metrics arrange the objects in different ways, but the same basic building blocks are used through UCAPI. This means you can write applications that can understand any type of coverage data without having to follow a set of rules for each different metric.
UCAPI does not provide a complete representation of the design – only what is necessary to present coverage information in proper context. For example, there is no representation of the control structure of code – only the aspects of the design that are monitored by each different metric. Data about the design that is independent of any specific coverage metric is called unqualified data.
Inside each region in the design, the coverage data for a given metric is made of UCAPI building blocks. These represent the objects that were monitored for coverage in that region. Since each metric has its own separate collection of such objects, this is called metric-qualified data.

6-267
Unified Coverage Reporting
Whether or not an object is covered depends on which test or collection of tests you have loaded. For example, a cross bin may have been covered in one simulation run, but not in another. Data that depends on a particular test or set of tests is called test-qualified data.
UCAPI uses a series of diagrams to represent object relationships. The following is a summary of the relation types.

6-268
Unified Coverage Reporting
Database Contents
A UCAPI database is loaded from one or more directories. The first directory loaded must always contain the unqualified design information - this is typically the data directory created when the design was compiled. Subsequent directories can be full directories (containing unqualified data) or test-only directories (containing only information produced by one or more test runs).
Persistence
UCAPI handles are either volatile or persistent. A persistent handle is guaranteed to remain valid until the application explicitly releases it. Volatile handles are guaranteed to be valid only until the next UCAPI operation is performed.
Some UCAPI functions automatically create persistent handles. But for performance reasons, most UCAPI functions return volatile handles. This results in significantly faster performance since new handles are not allocated for each call - the previous handle is reused “in place”. Applications can get a persistent handle for any volatile handle on demand.
The following rules explain in which conditions handles are persistent or remain valid:
1. Handles returned by covdb_iterate and covdb_qualified iterate are persistent and must be freed using covdb_release_handle or memory leaks will occur.
2. A handle returned by covdb_scan on an iterator is guaranteed to be valid only until the next call of covdb_scan, covdb_iterate, or covdb_qualified_iterate.

6-269
Unified Coverage Reporting
3. Handles returned by covdb_load, covdb_merge, and covdb_loadmerge are persistent and should be freed using covdb_unload when the application is done with them.
4. Handles returned by covdb_get_handle and covdb_get_qualified_handle are not persistent and may be invalidated by the next call to either covdb_get_handle or covdb_get_qualified handle.
5. All test-qualified handles become invalid when the test is unloaded even if they have been made persistent by the application.
6. All handles associated with a design become invalid when the design in unloaded even if they have been made persistent by the application.
7. Handles passed to an error callback function are persistent and remain valid until released by the application using covdb_release_handle.
UCAPI Setup and Compilation Requirements
UCAPI is supported on RedHat, Solaris, and SuSE. Depending upon the OS, different compilation options will need to be passed to the compiler. We recommend that you use a setup script similar to the following:
#!/bin/csh ## Common env var setup script for UCAPI examples# if (-f /etc/SuSE-release) then #SuSE

6-270
Unified Coverage Reporting
set OTHER_FLAGS = -m32 set ARCH = suse9else if (-f /etc/redhat-release) then # REDHAT set ARCH = linux set OTHER_FLAGS = -m32else # Solaris set OTHER_FLAGS = "-lsocket -lnsl" set ARCH = sparcOS5endif # Make sure VCS_HOME is set to a directory if (! -d $VCS_HOME) then echo Error: VCS_HOME does not point to a valid directoryendif # Make sure the current ARCH subdirectory exists if (! -d $VCS_HOME/$ARCH) then echo Error: this is an $ARCH machine but there is no VCS installation for $ARCH at $VCS_HOMEendif
# Setup the LD_LIBRARY_PATH if(! $?LD_LIBRARY_PATH) then setenv LD_LIBRARY_PATH ${VCS_HOME}/${ARCH}/libelse setenv LD_LIBRARY_PATH ${LD_LIBRARY_PATH}:${VCS_HOME}/${ARCH}/libendif # A Summary echo UCAPI Setup Completeecho " VCS_HOME : " $VCS_HOMEecho " ARCH : " $ARCHecho " LD_LIBRARY_PATH : " $LD_LIBRARY_PATH
As shown in the script, Redhat and SuSE require the -m32 option to be passed to the C compiler, while Solaris requires the -lsocket and -lnsl libraries to be included. The script also verifies that

6-271
Unified Coverage Reporting
VCS_HOME and the OS specific install of VCS is present on the system before attempting to compile. This is required as the UCAPI library is precompiled for different OS's and included within the VCS install.
Once the setup is complete, the c compiler, cc, is called with the following arguments:
cc -g -I${VCS_HOME}/include -o ucapi_example ucapi_example.c \ $VCS_HOME/$ARCH/lib/libucapi.a -ldl -lm $OTHER_FLAGS |& tee compile.out
Note that $VCS_HOME/include will include necessary UCAPI include files and $VCS_HOME/$ARCH/lib includes the precompiled UCAPI library file. Any operating system specific flags will be supplied by the setup script.
Enabling Error Reporting
By default, UCAPI will not print error messages to stdout. However, this option can be enabled using the covdb_configure call:
covdb_configure(covdbDisplayErrors, "true"); // setting to "false" disables / default
It is recommended that the above line of code be added to the beginning of your UCAPI program.
Data Model
This section describes the UCAPI objects used to model the contents of a coverage database.

6-272
Unified Coverage Reporting
The basic concept of UCAPI is that any coverage metric's objects can be represented using a small set of building blocks. By defining relations between these objects and setting properties (such as name, relative weight, covered/not-covered) on them, the full set of coverage data can be represented, while keeping the interface simple, and the same for all metrics.
UCAPI Object
This section describes properties and relations that apply to all UCAPI handles.
The covdbType property can be read from any UCAPI object handle, and it gives the UCAPI type of the object. The covdbTypeStr property gives the UCAPI type as a string, for example, type covdbTypeStr property of a handles of type covdbBlock.
Any UCAPI object may have string annotations on it, which can be iterated over using the covdbAnnotations 1-to-many relation. Annotations may also be retrieved by using the covdb_get_annotation and covdb_get_qualified_annotation functions described in the “Reading Annotations” section of the Coverage Technology Reference Manual.
The covdbAnnotations relation is not yet supported. All annotations must currently be accessed by name using covdb_get_annotation or covdb_get_qualified_annotation. The covdbTypeStr property is also not yet supported.
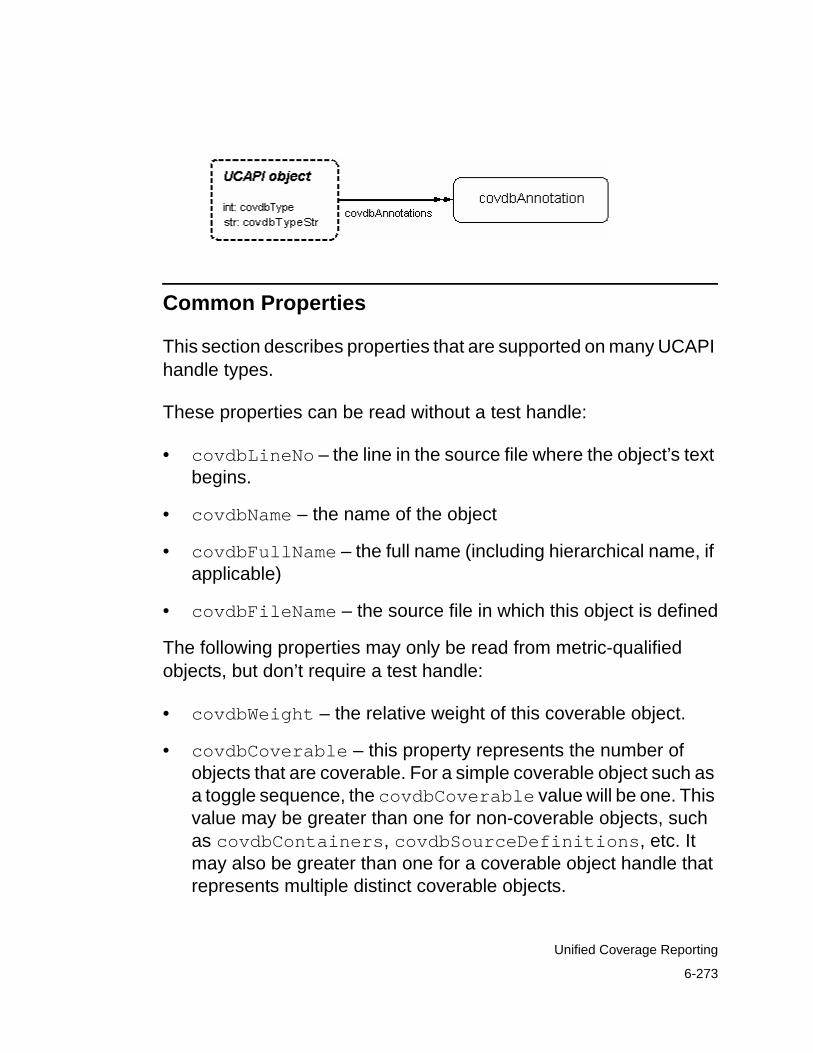
6-273
Unified Coverage Reporting
Common Properties
This section describes properties that are supported on many UCAPI handle types.
These properties can be read without a test handle:
• covdbLineNo – the line in the source file where the object’s text begins.
• covdbName – the name of the object
• covdbFullName – the full name (including hierarchical name, if applicable)
• covdbFileName – the source file in which this object is defined
The following properties may only be read from metric-qualified objects, but don’t require a test handle:
• covdbWeight – the relative weight of this coverable object.
• covdbCoverable – this property represents the number of objects that are coverable. For a simple coverable object such as a toggle sequence, the covdbCoverable value will be one. This value may be greater than one for non-coverable objects, such as covdbContainers, covdbSourceDefinitions, etc. It may also be greater than one for a coverable object handle that represents multiple distinct coverable objects.

6-274
Unified Coverage Reporting
• covdbCovGoal – the coverage percentage to be reached for this coverable object. By default, this is 100.0.
• covdbCovCountGoal – the number of times an object must be hit to count it as covered. By default, this is 1.
• covdbAutomatic – non-zero if the object contains only automatically-created sub-objects (for containers, crosses, and sequences)
The following properties require a test handle to specify for which test the data is being queried:
• covdbCovered – if the value of the covdbCovered property is equal to the value of the covdbCoverable property, the handle's contents are fully covered.
• covdbCovCount – the number of times the object has been covered.
Note that covdbCovCount property can only be read if the coverage tool that monitored the data had counting enabled.
The covdbCovStatus property may be read from metric-qualified objects with or without a test handle. If it is read without a test handle, then the covdbStatusCovered flag will never be set, since only a test can mark an object covered.
The value of covdbCovStatus can be any combination of the following:
• covdbStatusCovered – covered
• covdbStatusUnreachable – can never be covered, as when a formal tool has proven it is impossible to cover

6-275
Unified Coverage Reporting
• covdbStatusIllegal – should be considered an error if the object was covered
• covdbStatusExcludedAtCompileTime – the object was marked excluded at compile time
• covdbStatusExcludedAtReportTime – the object was marked excluded at report time
• covdbStatusExcluded – the object was marked excluded either at report time or compile time – can be checked by applications when it doesn't matter when the object was marked excluded
Coverable objects with covdbStatusExcluded set (or covdbStatusExcludedAtReportTime or covdbStatusExcludedAtCompileTime) are ignored when computing coverage scores – the covdbCoverable property will not include them in its count, for example. However, they may still be useful information. For example, some coverage tools will collect expression coverage information for debugging or verification analysis purposes that is not counted against a project’s coverage goals. When coverable objects inside a container (or cross, or sequence) are marked covdbStatusExcluded, they will be excluded from the covdbCovered and covdbCoverable values for that container (or cross or sequence).
Note that, while all of these properties may be retrieved from any coverable object handle, all objects may not have useful information. For example, a container object may have no associated file name or line number, but that information may be retrieved from the objects it contains. Whether or not this information is present for a given object depends on the metric and the coverage tool that created that object.

6-276
Unified Coverage Reporting
Coverable Objects
Coverable objects are entities in the database that can be covered or not covered. This small set of object types is sufficient to model any type of coverage. All coverable objects are metric-qualified. That means that each coverable object is associated with exactly one metric.
Coverable objects are assigned names that are unique within the region or container in which they are defined. Named objects, such as signal bits, may contain a list of lower-level objects - for example, a signal bit "x[1]" can have toggle objects representing the toggle from 0 to 1 and the toggle from 1 to 0. In this example, the names of those objects in UCAPI are "0 > 1" and "1 > 0".
Variant names are assigned by UCAPI using the name of the module plus a parenthesized list of its parameter/generic values. For example, if a module M has two variants for a given metric, its variant names might be "M(p = 1)" and another variant "M(p = 2)". The name of the unqualified module is "M". See the section titled “Source Definition and Source Instance” for more information on variants.
In the diagrams for coverable objects in this section, only the special properties and relations for each type are shown below.
Block
A block represents an atomic coverable object. The covdbType property for a block object is covdbBlock. Block objects have no additional relations on them. Depending on the metric, they may

6-277
Unified Coverage Reporting
have covdbFileName, covdbLineNo, and covdbName properties.
Value Set
A value set represents a set of values taken on by an expression. The value may be represented as an exact value, an interval (range) of values, a Binary-Decision Diagram (BDD), or a set of values that is any combination of these values. These coverable object handle types are collectively called "value sets".
The covdbType property of a value set object is one of covdbIntervalValue, covdbIntegerValue, covdbScalarValue, covdbVectorValue, covdbBDDValue, or covdbValueSet. The following diagram shows their structures. This section explains how the properties and value(s) for each type of handle are retrieved.
All value set objects support these properties:
• covdbName - a string representation of the value. This may be simply the value as a string, or it could be a name for the value, such as the name of an enumerated type.
• covdbWidth - the bit-width of the expression.

6-278
Unified Coverage Reporting
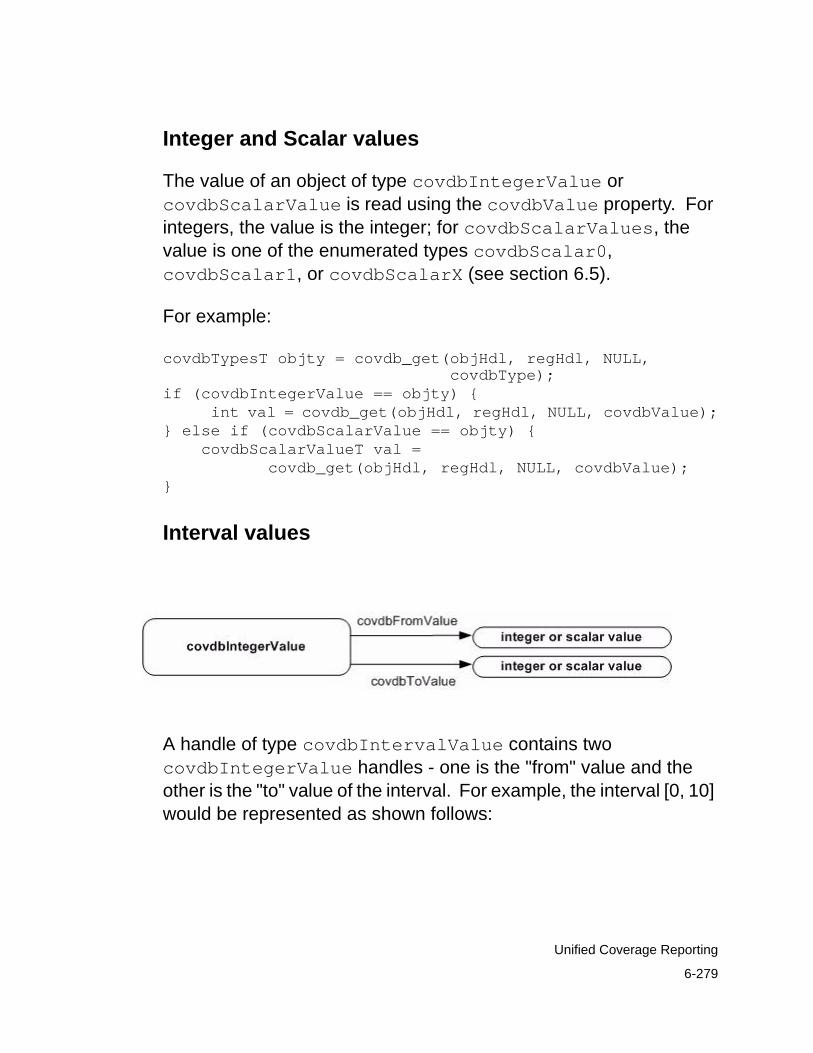
6-279
Unified Coverage Reporting
Integer and Scalar values
The value of an object of type covdbIntegerValue or covdbScalarValue is read using the covdbValue property. For integers, the value is the integer; for covdbScalarValues, the value is one of the enumerated types covdbScalar0, covdbScalar1, or covdbScalarX (see section 6.5).
For example:
covdbTypesT objty = covdb_get(objHdl, regHdl, NULL, covdbType);if (covdbIntegerValue == objty) { int val = covdb_get(objHdl, regHdl, NULL, covdbValue);} else if (covdbScalarValue == objty) { covdbScalarValueT val = covdb_get(objHdl, regHdl, NULL, covdbValue);}
Interval values
A handle of type covdbIntervalValue contains two covdbIntegerValue handles - one is the "from" value and the other is the "to" value of the interval. For example, the interval [0, 10] would be represented as shown follows:

covdbIntervalValue
covdbToValue covdbIntegerValue covdbValue: 10
covdbFromValue
covdbIntegerValue covdbValue: 0
6-280
Unified Coverage Reporting
BDD values
The covdbBDD type is used to represent BDD values - ordered decision diagrams. Whether a BDD object is a terminal or not can be determined from the covdbScalarValue property. This property will return:
covdbValue0: for 0 valued terminalscovdbValue1: for 1 valued terminalscovdbValueX: for non-terminal objects
covdbBDD int: covdbScalarValue
covdbBDD
covdbBDD
covdbBDDTrue
covdbBDDFalse
BDD values are currently not supported.
Vector values
An object of type covdbVectorValue has two properties:
• covdbSigned - non-zero if the vector value is a signed value.

6-281
Unified Coverage Reporting
• covdbTwoState - non-zero if the vector value is in two-state representation. If zero, the value is in four-state representation.
• covdbWidth - the width of the value in bits.
If the vector value's covdbTwoState property is non-zero, the values will be represented as an array of unsigned ints. The value is retrieved with the function covdb_get_vec_2state_value.
If covdbTwoState is zero, the values will be represented as an array of covdbVec32ValueT structs. Each struct has a 32-bit control word and a 32-bit data word. Each bit of the control word and each corresponding bit of the data word represents a single scalar value (0, 1, X, or Z). The value for each combination is shown follows:
Table 6-1
control data value
For example, the following is the declaration of covdbVec32ValueT from the covdb_user.h header file:
typedef struct covdbVec32Value_s { unsigned int c; unsigned int d;} covdbVec32ValueT;
Also, the following is an example of code that reads and prints out covdbVectorValueT handles:
if (covdbVectorValue == objty) { int signp = covdb_get(objHdl, regHdl, NULL, covdbSigned);
0 0 0
0 1 1
1 0 Z
1 1 X

6-282
Unified Coverage Reporting
int width = covdb_get(objHdl, regHdl, NULL, covdbWidth);
if (covdb_get(objHdl, regHdl, NULL, covdbTwoState)) { unsigned *vals = covdb_get_vec_2state_value(objHdl, regHdl);
for(i = 0; i < width; ) { unsigned wd = vals[i / 32]; for(j = 0; j < 32 && i < width; i++, j++) { printf("%d", (wd >> j) & 0x1); } } printf("\n"); } else { covdb4stateValT *vals = covdb_get_vec_4state_value(objHdl, regHdl);
for(i = 0; i < width; ) { unsigned wd = vals[i / 32]; for(j = 0; j < 32 && i < width; i++, j++) { int c = vals[i].c; int d = vals[i].d; char rep;
if (!c && !d) rep = '0'; else if (!c && d) rep = '1'; else if (!d) rep = 'Z'; else rep = 'X';
printf("%c", rep); } } printf("\n"); }}

6-283
Unified Coverage Reporting
Value Set
A covdbValueSet handle is a collection of value sets or sequences. It represents a given expression taking on one of the values in the value sets or going through one of the sequences of values specified by the sequence objects.
A covdbValueSet handle is itself a coverable object. It is either covered or not covered. The objects inside it are there only to describe its structure. For example, the covdbCovCount of the covdbValueSet handle tells how many times any one of the values or sequences occurred - applications cannot query each object inside the bin to get their individual covdbCovCount values.
covdbObjects
covdbValueSet
int: covdbNumObjects value
For example, a coverable object that represented an expression taking a value between 0 and 10 (inclusive), the value 15, or the value of the expression changing from 0 to 1 would be represented as follows:

covdbIntervalValue
covdbToValue covdbIntegerValue covdbValue: 10
covdbFromValue covdbIntegerValue
covdbValue: 0
covdbValueSet
covdbIntegerValue covdbValue: 15
covdbSequence
covdbIntegerValuecovdbValue: 0
covdbIntegerValue covdbValue: 1
covdbObjects
6-284
Unified Coverage Reporting
Sequence
An object of type covdbSequence contains an ordered collection of other coverable objects and represents the sequential coverage of each member object. For example, a sequence of value sets might represent a signal taking on the specified sequence of values.
Note that a covdbSequence object itself is either covered or not covered. The coverage statuses of its contents do not contribute to its coverage status, because the sequence itself is an atomic coverable object.

6-285
Unified Coverage Reporting
A coverable object in a covdbSequence's objects list has an optional repeat count. This indicates that the object is repeated the specified number of times in the sequence. The repeat count may be a single integer or it may be a set of values, indicating the repetition may be any of the specified numbers.
For example, if a testbench coverage transition bin is defined as:
coverpoint a bin t1 : 1 -> 3 * (2..3)
This indicates that the value of a should transition from '1' to '3', then from '3' to '3' again 1 or 2 additional times. In UCAPI, this is represented using the covdbRepeat relation, as follows:

”t1”
covdbSequence
covdbIntegerValue covdbValue: 1
covdbIntegerValue covdbValue: 3
covdbIntervalValue
covdbInterval
covdbIntegerValue covdbValue: 2 covdbFromValue
covdbToValue
covdbRepeat
covdbIntegerValue covdbValue: 3
covdbObjects
covdbObjects
optional covdbRepeat relation goes from sequence member to repeat count
6-286
Unified Coverage Reporting
When a value set is used as a repeat, it will have a value for covdbRepeatType that is one of:
• covdbGoto
• covdbConsecutive
• covdbNonsecutive
When the value set is not a repeat value, the value of covdbRepeatType will be -1.
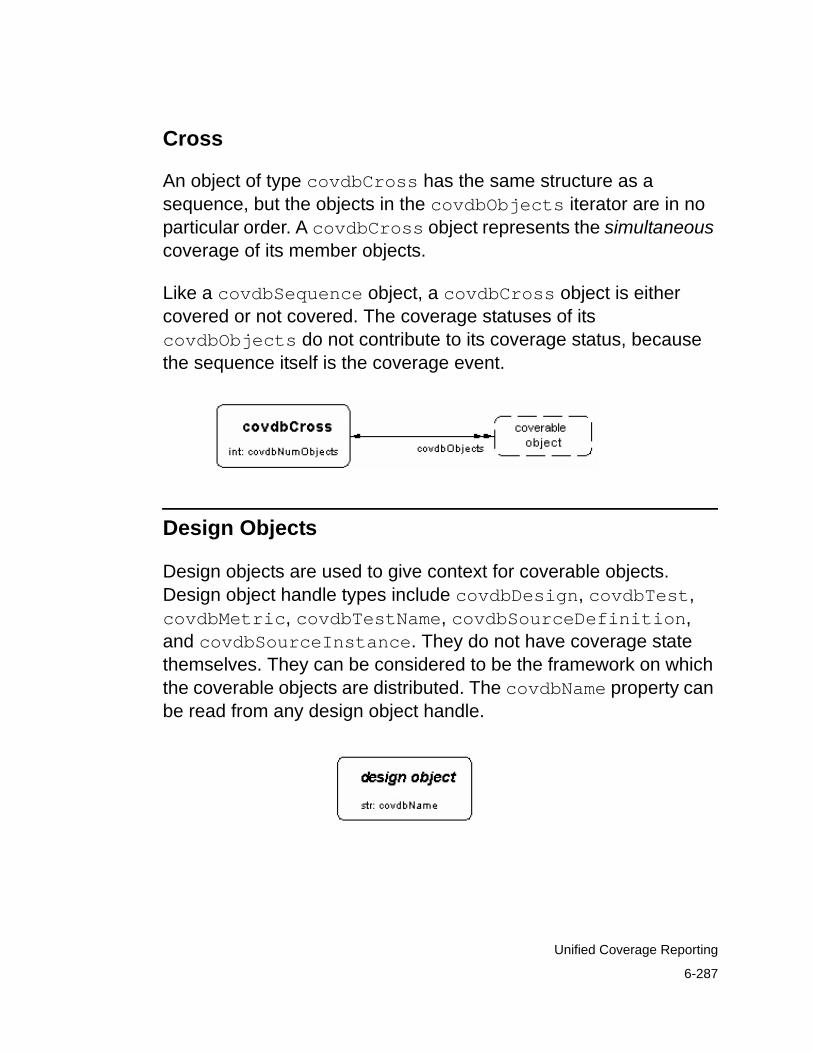
6-287
Unified Coverage Reporting
Cross
An object of type covdbCross has the same structure as a sequence, but the objects in the covdbObjects iterator are in no particular order. A covdbCross object represents the simultaneous coverage of its member objects.
Like a covdbSequence object, a covdbCross object is either covered or not covered. The coverage statuses of its covdbObjects do not contribute to its coverage status, because the sequence itself is the coverage event.
Design Objects
Design objects are used to give context for coverable objects. Design object handle types include covdbDesign, covdbTest, covdbMetric, covdbTestName, covdbSourceDefinition, and covdbSourceInstance. They do not have coverage state themselves. They can be considered to be the framework on which the coverable objects are distributed. The covdbName property can be read from any design object handle.

6-288
Unified Coverage Reporting
Design and Test Name
A covdbDesign handle indicates a specific design in the coverage database. A design contains a list of test names for which coverage data exists.
The covdbTestName handles you get from covdbAvailableTests are not the same as covdbTest handles – applications cannot use them to get coverage data. But applications can use their covdbName properties to load real covdbTest handles.
Tests and Metrics
A covdbTest handle is a test whose data has been loaded into the UCAPI interface. A test is the result of a single execution of a tool, or the merged results of two or more executions.
Test handles are used to get test-qualified handles and data as described in the introduction to this section. Handles to covdbTest objects are accessed using the covdb_load, covdb_merge, and covdb_loadmerge functions.
Metric handles have the covdbType covdbMetric. The only property that can be read from a covdbMetric handle is its name, using covdbName.
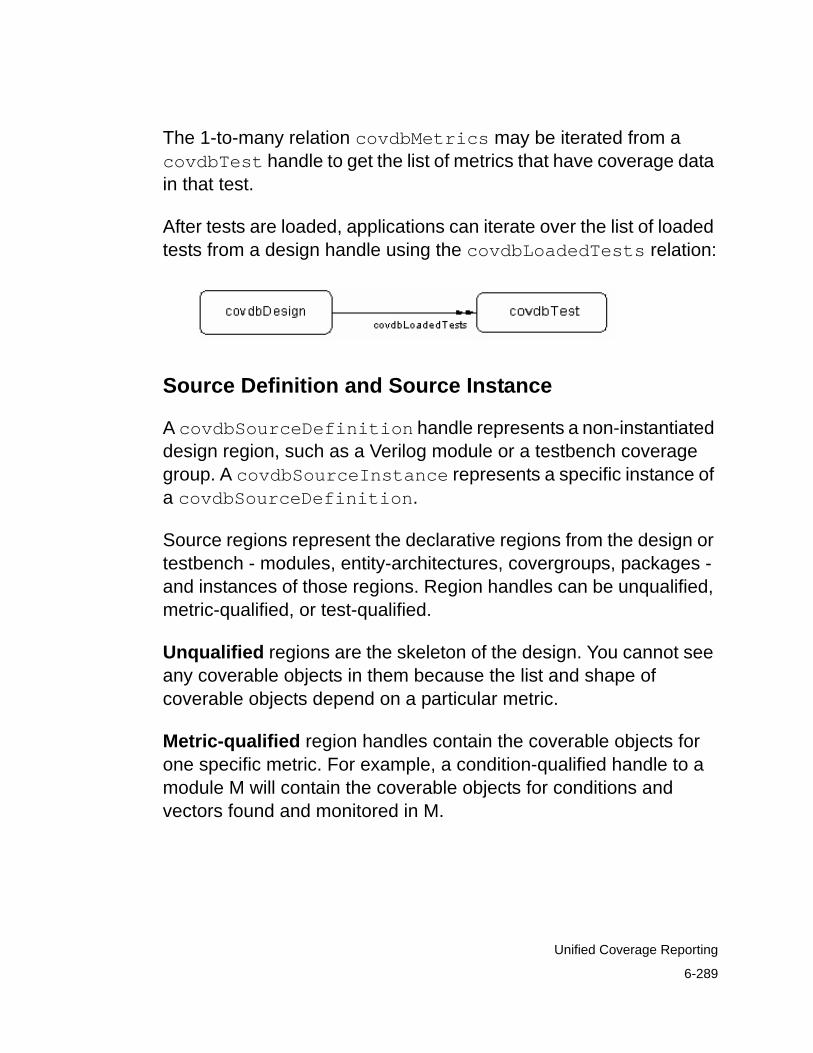
6-289
Unified Coverage Reporting
The 1-to-many relation covdbMetrics may be iterated from a covdbTest handle to get the list of metrics that have coverage data in that test.
After tests are loaded, applications can iterate over the list of loaded tests from a design handle using the covdbLoadedTests relation:
Source Definition and Source Instance
A covdbSourceDefinition handle represents a non-instantiated design region, such as a Verilog module or a testbench coverage group. A covdbSourceInstance represents a specific instance of a covdbSourceDefinition.
Source regions represent the declarative regions from the design or testbench - modules, entity-architectures, covergroups, packages - and instances of those regions. Region handles can be unqualified, metric-qualified, or test-qualified.
Unqualified regions are the skeleton of the design. You cannot see any coverable objects in them because the list and shape of coverable objects depend on a particular metric.
Metric-qualified region handles contain the coverable objects for one specific metric. For example, a condition-qualified handle to a module M will contain the coverable objects for conditions and vectors found and monitored in M.

6-290
Unified Coverage Reporting
Test-qualified region handles are used for regions that only exist within a specific test. For example, covergroup handles are always test-qualified, since covergroups are used on a per-test basis - they don’t necessarily exist in every test.
The following properties may be read from any source definition or instance:
• covdbFileName – the source file name of this definition or instance.
• covdbLineNo – the line number where this definition or instance is defined in its source file.
• covdbIsVerilog – non-zero if the definition or instance was defined in Verilog.
• covdbIsVhdl – non-zero if the definition or instance was defined in VHDL.
Source definitions may represent modules, entity-architectures, or testbench coverage groups. Source instances may be instances of any of these objects.
source instance or definition
str: covdbFileName int: covdbLineNo int: covdbIsVerilog int: covdbIsVhdl
Source definitions have a 1-to-many relation covdbInstances to get an iterator of all instances of that definition. Similarly, source instances have a 1-to-1 relation covdbDefinition to get the corresponding definition of an instance. Source instances also have

6-291
Unified Coverage Reporting
a covdbInstances relation from them; each instance in this list is a child instance in the design hierarchy. The covdbParent relation is the instance’s parent in the design hierarchy.
Properties such as covdbCovered and covdbCoverable may be read directly from metric-qualified source region handles (covdbCovered requires that a test handle be given) to compute the coverage score for that metric. Any property that can be read from an unqualified source definition or instance (such as covdbFileName) can also be read from a metric-qualified source definition or instance handle.
The covdbDefinitions and covdbInstances 1-to-many relations may be used from a design handle to iterate over all definitions or over the top-level instances in the design, respectively. When these are qualified with a metric, the list of metric-qualified definitions and top-level instances for that specified metric are obtained.
The figures below examine different subsets of the relations between different design region handles. First, is the structure of the unqualified design. Without using any metric handles, an application can walk through the base design – all definitions and all instances of those definitions. Note that the covdbInstances relation from a source definition gives its list of self-instances, whereas the covdbInstances relation from a source instance gives its instance children in the design hierarchy.

6-292
Unified Coverage Reporting
To get coverage information about a given metric in a given region, an application must get a metric-qualified handle for that region. For example, to get the list of FSMs in a module M, applications first get the FSM metric-qualified handle to M.
There may be more than one FSM-qualified handle for M in a design, due to parameter/generic values. In other words, the module M may have been split by the FSM metric. Therefore, there is not necessarily only a single FSM-qualified handle for M, and applications use the metric-qualified 1-to-many relation covdbDefinitions to walk through those handles, as shown in the following figure:

6-293
Unified Coverage Reporting
Similarly, unqualified covdbSourceInstance handles have metric-qualified versions. However, since each instance is unique in the design – it does not potentially represent multiple versions, like covdbSourceDefinitions – there is always only one metric-qualified source instance for each unqualified source instance handle for a given metric. The metric-qualified source instance handle is accessed using the metric-qualified 1-to-1 relation covdbIdentity, and the unqualified instance handle is accessed from the metric-qualified instance handle using covdbIdentity with no qualifier:

covdbSourceInstance
covdbSourceInstance
metric-qualified
covdbInstances
metricHdl, covdbIdentity
unqualified
covd
bPar
ent
covdbInstances
covd
bPar
ent
covdbIdentity
6-294
Unified Coverage Reporting
There may be metric-qualified source instances or definitions with no corresponding unqualified handle. For example, some instances exist only for the assertions metric (bound-in OVA units, for example). An application traversing only over the unqualified design will not see these source regions. To distinguish them from metric-qualified handles of unqualified source regions, we call these regions metric-only regions.
If a metric-only region is attached to the unqualified design, it will be visible only when iterating over the covdbInstances children of the appropriate metric-qualified instance parent.

6-295
Unified Coverage Reporting
For example, the following figure shows the unqualified and metric qualified design hierarchies for an example design. The source instances D and E are only visible in the metric-qualified design and may not be directly accessed from any unqualified source handle.
If a metric-only region is separate from the design (such as a testbench coverage covergroup declared outside of any module), applications must use the metric-qualified 1-to-many relations covdbDefinitions or covdbInstances from a test or design handle – this will give access to the complete list of definitions or the list of metric-qualified top-level instances. For example, in the following figure, L, M, and N are Vera covergroups, accessed from a test handle.

6-296
Unified Coverage Reporting
The following figure shows the complete set of relations used to traverse the design.
covdbSourceDefinition
metricH
dl, covdbD
efinitions
covdbSourceDefinition
metricHdl, covdbDefinitions
covd
bDef
initi
ons covdbSourceInstance
covdbInstances
covdbInstances
covdbSourceInstance
covdbDefinition
covdbInstances
covdbIdentity
covdbDefinition
unqualified design
metric-qualified design
covdbInstances
covdbInstances
metricH
dl, covdbIdentity
covd
bPar
ent
covd
bIde
ntity
covd
bPar
ent
covdbDesign

6-297
Unified Coverage Reporting
There is no metric-qualified covdbObjects list off of source definitions or instances. All coverable objects are accessed from the metric-qualified source definitions and instances. For example, to get to the coverable objects list for a source definition:
Similarly, to get to the metric-qualified objects from a covdbSourceInstance handle:

6-298
Unified Coverage Reporting
The covdbDeepCoverable and covdbDeepCovered properties apply only to metric-qualified SourceInstance handles, and return the coverable (covered) counts for the source instance and its entire design subtree.
Test-qualified Source Regions
Some metrics create test-qualified source regions that only exist within a given test. For example, testbench coverage groups do not exist in the unqualified design or even in the metric-qualified design - they only exist in the test-qualified data.
Test-qualified regions are accessed in two ways:
• Directly from a test handle using the metric handle as a qualifier

6-299
Unified Coverage Reporting
• From within metric-qualified source definitions and instances in the main design
Like unqualified source definitions, test-qualified source definitions may have multiple versions, due to variations between instances of the groups. These versions are accessed with the test-qualified covdbDefinitions relation. As for HDL source definitions, coverable objects are only accessed from the versions of definitions, not from the master definition.
The following figure shows how test-qualified definitions are accessed. Access is either from a testbench-qualified module definition to the list of its test-qualified definitions, or from a test handle giving the list of all test-qualified definitions in the design.
Test-qualified instances may occur inside any HDL module instance, or entirely outside the design hierarchy. They may occur inside an HDL module instance even if they are not defined within the corresponding HDL module1.
Test-qualified instances that are inside HDL module instances are accessed by the test-qualified covdbObjects relation from the metric-qualified HDL module instance handle.
Test-qualified instances that are not within the HDL design hierarchy are accessed from a covdbTest handle, using the metric-qualified covdbInstances relation. The following figure shows how test-qualified instances are accessed in UCAPI.
1. Such as an SVTB covergroup defined in one module but instanced by another module - UCAPI supports a covergroup defined in $root and instanced in the design, for example.

6-300
Unified Coverage Reporting
Covergroup definitions and instances have the same covdbInstances/covdbParent relationship as HDL definitions and instances.
Other Objects
Container
Objects of type covdbContainer are abstractions that represent a collection of coverable objects that logically belong together. Containers may have two different lists in them:
• covdbObjects – a list of coverable objects or more covdbContainers. The covered/coverable numbers for the container is the sum of the covered/coverable numbers for all of the contained objects.
• covdbComponents – a list of objects making up the structure of the container. For example, a container representing a cross declaration will have the list of coverpoints being crossed in its covdbComponents list.

6-301
Unified Coverage Reporting
Containers whose objects are covdbCrosses or covdbSequences may also have a covdbComponents list. If a container has a covdbComponents list, it means that:
• Each cross or sequence in the container’s covdbObjects list has the same number of objects in it.
• The container will have the same number of items in its covdbComponents list as are in each item in its covdbObjects list.
• Each item in each cross or sequence will correspond to the same numbered item in the covdbComponents list.
The objects in the covdbComponents list do not contribute to the coverage values for the container – they are provided only for reference.
Containers are themselves not coverable objects – they contain coverable objects in their covdbObjects lists. This is distinct from Sequences and Crosses, each of which represent a single coverable object.
In general, objects in containers are in source declaration order. This is tool-dependent and metric-dependent.

6-302
Unified Coverage Reporting
Predefined Coverage Metrics
This section describes how UCAPI models each of the predefined coverage metrics. Note that while the various metrics described below use terms such as “basic block”, “condition” and “signal,” these are not UCAPI object types, they are just describing what the UCAPI types are being used to model. All object types are defined in “Data Model” on page 271– there are no special object types for any metric.
Line Coverage
Line or Statement coverage tracks which statements in the design code were executed during simulation.
Statement coverage is organized in two levels, with always blocks/processes at the top level. The type of an always block or process is covdbContainer.
Within each always block/process container, statements are organized into basic blocks, which are straight-line sections of code. Basic blocks are also covdbContainer objects.
Within the basic block containers, each statement is modeled as a covdbBlock object.
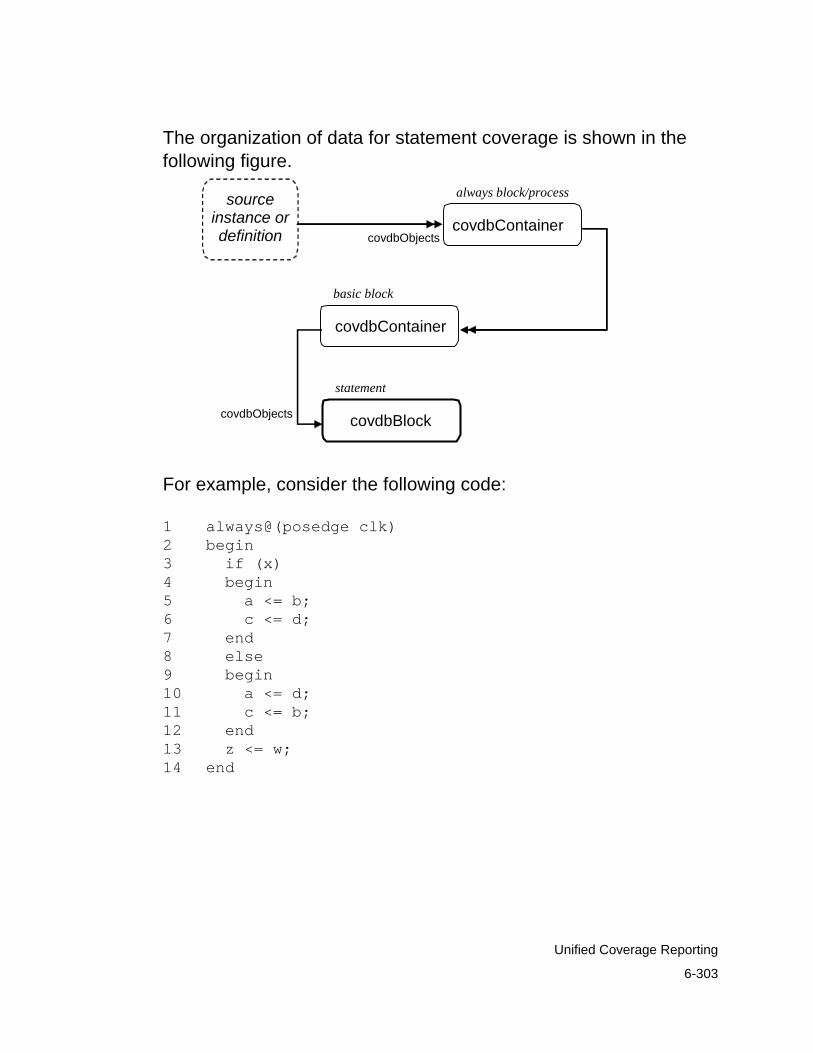
6-303
Unified Coverage Reporting
The organization of data for statement coverage is shown in the following figure.
source instance or definition covdbObjects
always block/process
covdbContainer
statement
covdbBlock covdbObjects
basic block
covdbContainer
For example, consider the following code:
1 always@(posedge clk)2 begin3 if (x)4 begin5 a <= b;6 c <= d;7 end8 else9 begin10 a <= d;11 c <= b;12 end13 z <= w;14 end

6-304
Unified Coverage Reporting
This is represented in UCAPI as follows:
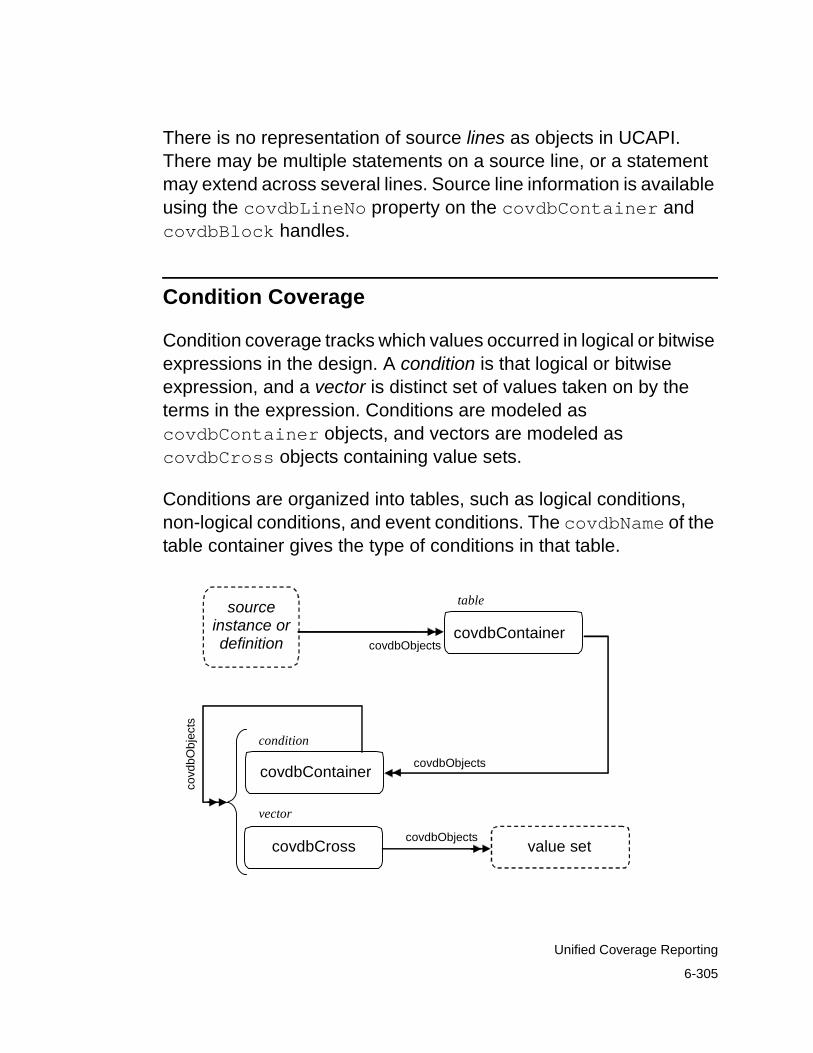
6-305
Unified Coverage Reporting
There is no representation of source lines as objects in UCAPI. There may be multiple statements on a source line, or a statement may extend across several lines. Source line information is available using the covdbLineNo property on the covdbContainer and covdbBlock handles.
Condition Coverage
Condition coverage tracks which values occurred in logical or bitwise expressions in the design. A condition is that logical or bitwise expression, and a vector is distinct set of values taken on by the terms in the expression. Conditions are modeled as covdbContainer objects, and vectors are modeled as covdbCross objects containing value sets.
Conditions are organized into tables, such as logical conditions, non-logical conditions, and event conditions. The covdbName of the table container gives the type of conditions in that table.
source
instance or definition covdbObjects
table
covdbContainer
vector
covdbCross value set
condition
covdbContainer covdbObjects
covd
bObj
ects
covdbObjects

6-306
Unified Coverage Reporting
The exact vectors in a given database depend on the compile-time options used with VCS. For example, using the -cm_cond full flag results in full truth tables (vectors) for every condition, and using -cm_cond sop results in sum-of-products-style vectors.
Note that there is no representation of which conditions are nested textually within other conditions (such as the condition for an “if” statement that is nested inside a “case” statement). However, conditions can have sub-conditions within the same expression, and in this case, the sub-condition will be in the list of objects for the parent condition.
For example, if the following code is compiled in default condition coverage in VCS:
if (a && (b || c))
The parent condition consists of two terms in a “&&” expression, “a” and “(b || c)”. The sub-condition is the expression “b || c”, which has two terms in a “||” expression, “b” and “c”. In this case, UCAPI would represent the condition coverage objects as shown in the following diagram (these conditions would be in the “logical” conditions table, which is not shown in the diagram).

“a && (b || c)”
covdbContainer
“0 1”
covdbCross
“1 0”
covdbCross
“b || c”
covdbContainer
“0 0”
covdbCross
“0 1”
covdbCross
covdbObjects
covdbObjects
vectors for condition “a && (b || c)”
subcondition “b || c” covdbCoverable = 3
vectors for condition “b || c”
top-level condition covdbCoverable = 6
“1 1”
covdbCross
“1 0”
covdbCross
6-307
Unified Coverage Reporting
Some conditions are expanded into multiple conditions. A bitwise expression such as:
x = y & z;

6-308
Unified Coverage Reporting
If x, y and z are 4-bit vectors, this represents four different conditions:
y(0) & z(0)y(1) & z(1)y(2) & z(2)y(3) & z(3)
This is represented in UCAPI as additional conditions inside the main condition, as shown in the following figure. Note that these “non-logical” conditions themselves do not have any vectors of their own – only the single-bit conditions have vectors.
Note that “BIT 0 of y(2:5) & z(2:5)” is the expression for “y(2) & z(2)”, but UCAPI does not provide the original indices.

6-309
Unified Coverage Reporting
Another type of condition coverage, called “sum-of-products” or SOP condition coverage, is modeled similarly. For example, consider the expression:
((a == 2) || b && c) || (d && e)
The SOP format of this expression is the disjunction of the following minterms:
(a == 2) ||(b && c) ||(d && e)
Similarly, the product-of-sums (POS) format of this expression is the conjunction of the following maxterms:
((a == 2) || c || e) &&((a == 2) || b || e) &&((a == 2) || c || d) &&((a == 2) || b || d)
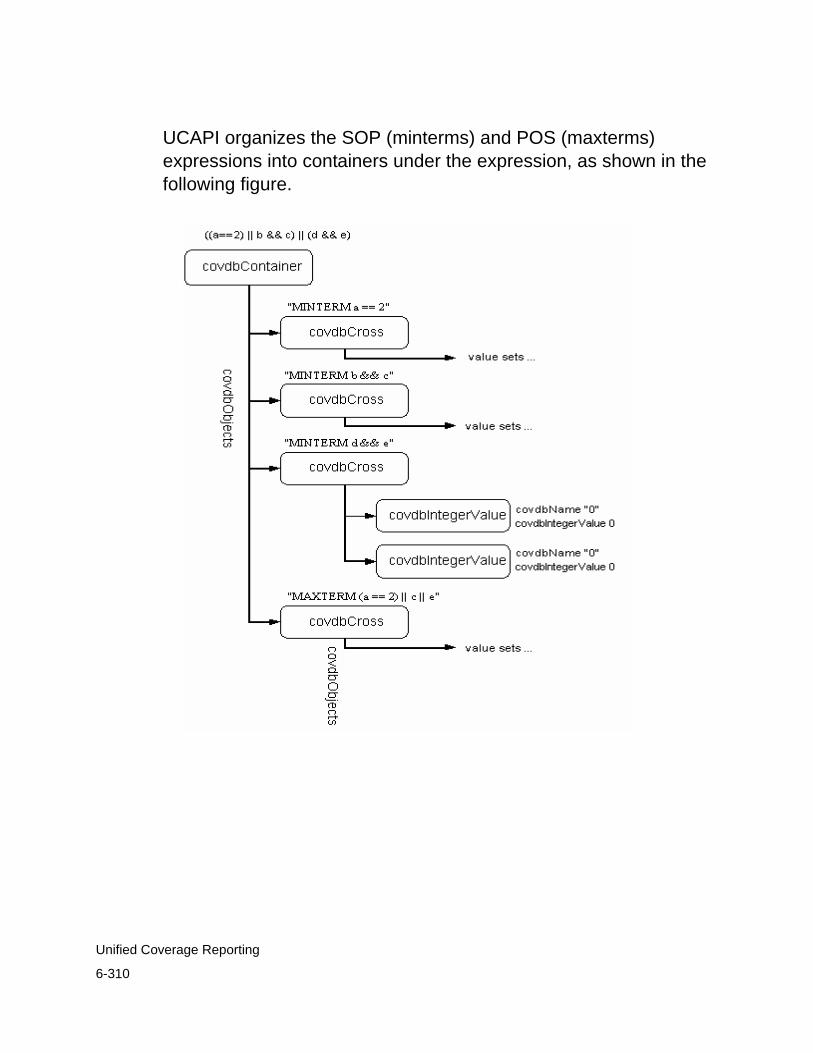
6-310
Unified Coverage Reporting
UCAPI organizes the SOP (minterms) and POS (maxterms) expressions into containers under the expression, as shown in the following figure.

6-311
Unified Coverage Reporting
As described in “Value Set” on page 277, values are not always integers. In condition coverage, “don’t care” values may be present in vectors, and will have the value type covdbScalarValue and a covdbValue of covdbValueX.
branch-qualified instance or
variant covdbObjects
covdbContainerint: covdbWidth
covdbObjects
branch vector
covdbCross
value set or covdbBlock
term value
top-level branch statement
branch term
covdbBlock
covdbCom
ponentswidth is number of branch terms
Branch Coverage
Branch coverage monitors the execution of conditional statements in your design. Conditional statements include if/else statements, case statements, and the ternary operator “?:”
Branch coverage differs from condition coverage in that branch coverage does not track all the ways in which a Boolean condition can be true or false – it only tracks whether it is true or false. Branch coverage also tracks all conditions, rather than the subset of

6-312
Unified Coverage Reporting
complex conditions that condition coverage monitors. Branch coverage also tracks case statements, which condition coverage ignores.
The coverable objects for branch coverage are all crosses of value sets. For example, consider a branch that is covered when the following expression is true:
(r1 == 1’b1) && (r2 && r3) && (r5 && r6)
That branch would be modeled as a cross of these three terms, each of which is a covdbIntegerValue value set:
covdbIntegerValue
covdbIntegerValue
covdbIntegerValue
covdbCross
covdbValue = 1 covdbName = “1’b1”
cross for (r1 == 1’b1) && (r2 && r3) && (r5 && r6)
covdbValue = 1 covdbName = “1”
covdbValue = 1 covdbName = “1”
Branch coverage is organized into disjoint sections of each always/initial block or process by the top-level branch statements. For example, the following code has two top-level branch statements:
1 initial 2 begin 3 case (r1) First top-level statement 4 1'b1 : if (r2 && r3) 5 r4 = 1'b1; 6 1'b0 : if (r7 && r8) 7 r9 = r10 ? 1'b0 : 1'b1;

6-313
Unified Coverage Reporting
8 1'bx : $display("x"); 9 default : $display("no op");10 endcase1112 r9 = (r10 && r11) ? 1'b0 : 1'b1; Second top-level statement13 end
Since the branches in each top-level statement do not interact, UCAPI collects their branches into separate containers underneath the source region handle. The model for objects inside a branch coverage region is as follows:
For the sample code shown above, the UCAPI model is:

6-314
Unified Coverage Reporting
.

6-315
Unified Coverage Reporting
Note that in Verilog, case alternatives do not have to be constant values. For example, the following is legal:
case(1) vec[0]: … vec[1]: … vec[2]: …endcase
In this example, the case alternatives are not constant values, and therefore cannot be modeled as value sets. In this case, we use covdbBlock handles for the case alternatives. Note that the argument to the case conditional (“1”) is when possible modeled as a value set:
branch-qualified
instance or variant
covdbContainer
covdbBlock
covdbCross
covdbIntegerValue covdbName = “1”covdbValue = 1
covd
bCom
pone
nts
covdbObjects
covdbName = “vec[0]”
cross for 1 == vec[0]
covdbCross cross for 1 == vec[1]
covdbCross cross for 1 == vec[2]
covdbBlock covdbName = “vec[1]”
covdbBlock covdbName = “vec[2]”
covdbObjects

6-316
Unified Coverage Reporting
Ternary operators are also monitored by branch coverage. In UCAPI, a ternary conditional is treated the same as an “if/else” condition. For example:
9 if (z)10 x <= a ? b : c;11 else12 x <= 1’b0;
Turns into this in UCAPI:
branch-qualified instance or variant
covdbContainer
covdbIntegerValue
covdbIntegerValue
covdbCross
covdbBlock
covdbBlock
“z”
“a”
covd
bCom
pone
nts
covdbObjects
covdbValue = 1 covdbName = “1”
cross for z && a covdbLineNo = 10
covdbValue = 1 covdbName = “1”
covdbCross cross for z && !a covdbLineNo = 10
covdbCross cross for !z covdbLineNo = 12
covdbIntegerValue
covdbIntegerValue
covdbValue = 1 covdbName = “1”covdbValue = 0 covdbName = “0”
covdbIntegerValue
covdbScalarValue
covdbValue = 0 covdbName = “0”covdbValue = covdbValueXcovdbName = “-”
covdbObjects

6-317
Unified Coverage Reporting
Finite State Machine Coverage
Finite State Machine (FSM) coverage models three distinct types of coverable objects.
Whether the FSM:
- entered each possible state (state coverage)
- state followed each possible state transition (transition coverage)
- went through all possible sequences of states from the initial state(s) (sequence coverage)
In UCAPI, state coverage is modeled with value sets, and transition and sequence coverage are modeled with covdbSequence objects containing value sets. The covdbCoverable property of the FSM container is the total number of states, transitions, and sequences for that FSM.
The covdbFileName and covdbLineNo properties may be read from the FSM handles (of type covdbContainer), state value sets, and transition covdbSequence handles. No other FSM objects have source information.
State and sequence objects are all considered to be used for information only and do not count for covdbCoverable and covdbCovered numbers for FSM coverage. Each coverable object for states and sequences will have covdbExcluded set in its covdbCovStatus property.

source
instance or definition covdbObjects
FSM
covdbContainer
states
covdbContainer
covdbObjects
transitions
covdbContainer
sequences
covdbContainer
state
value set covdbObjects
transition
covdbSequence covdbObjects
sequence
covdbSequence covdbObjects
covd
bObj
ects
6-318
Unified Coverage Reporting
For example, consider an FSM encoded as:
always @(posedge clk) begincase (state)
`IDLE: if (go) next = `READ else next = `IDLE;`READ: if (go) next = `DLY else next = `IDLE;`DLY: if (!go) next = `IDLE;
else if (ws) next = `READ; else next = `DONE;
`DONE: next = `IDLE;endcase
end
The FSM has four states and seven possible transitions:
States:IDLEREADDLYDONE
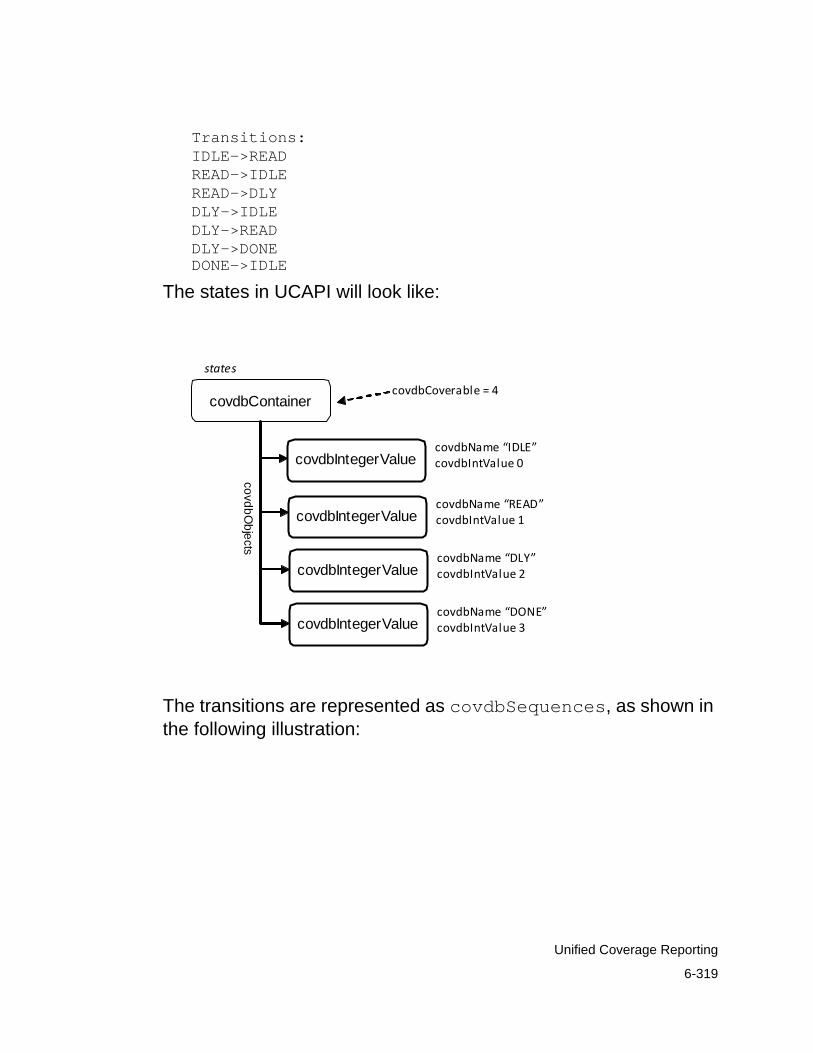
6-319
Unified Coverage Reporting
Transitions:IDLE->READREAD->IDLEREAD->DLYDLY->IDLEDLY->READDLY->DONE DONE->IDLE
The states in UCAPI will look like:
states
covdbContainer
covdbIntegerValue covdbName “IDLE” covdbIntValue 0
covdbIntegerValue covdbName “READ” covdbIntValue 1
covdbIntegerValue covdbName “DLY” covdbIntValue 2
covdbIntegerValue covdbName “DONE” covdbIntValue 3
covdbObjects
covdbCoverable = 4
The transitions are represented as covdbSequences, as shown in the following illustration:

transitions
covdbContainer
covdbSequence covdbName “IDLE ‐> READ”
covdbIntegerValue covdbName “IDLE” covdbIntValue 0
covdbIntegerValue covdbName “READ” covdbIntValue 1
covdbSequence covdbName “READ ‐> IDLE”
covdbIntegerValue covdbName “READ” covdbIntValue 1
covdbIntegerValue covdbName “IDLE” covdbIntValue 0
covdbCoverable = 7 (not all are shown here)
other five transitions …
6-320
Unified Coverage Reporting
The FSM’s sequences are covdbSequence objects, but with potentially more than two objects. For example, the sequence READ -> DLY > IDLE looks like this:

sequences
covdbContainer
covdbSequence covdbName “READ ‐> DLY ‐> IDLE”
covdbIntegerValue covdbName “READ” covdbIntValue 1
covdbIntegerValue covdbName “DLY” covdbIntValue 2
other sequences …
covdbIntegerValue covdbName “IDLE” covdbIntValue 0
6-321
Unified Coverage Reporting
Toggle Coverage
Toggle coverage in UCAPI is organized into tables, each of which contain signals, which are modeled as covdbContainers.
The tables are groupings of signals by category, such as “signal” and “port”. The covdbName property of the table container is the category of all signals in that table (e.g, “ports”).
Each signal’s container has a list of sub-containers in it, representing bits of that signal. Each sub-container has two covdbSequences in it, one representing the transition from 0 to 1, and one representing the transition from 1 to 0.

6-322
Unified Coverage Reporting
Signals and MDA dimension container objects for toggle coverage have the annotations “lsb” and “msb” set on them. These return a string given the least-significant bit and most-significant bit indices, respectively, as strings.
The covdbCoverable of a given signal for toggle coverage is twice the number of distinct bits for that signal – that is, the covdbCoverable is the number of covdbSequences under the container for the signal. The covdbWidth property is the total number of bits.
source instance or definition covdbObjects
signal table
covdbContainer
bit
covdbContainer
toggle 0->1 or 1->0
covdbSequence
value 0 or 1
value set
covdbContainer
covdbObjects
signal
contains signals
contains bit- & part-selects
dimension
covdbContainer
word
covdbBlock
covd
bObj
ects
dimension has either containers for next innermost dimension or words

6-323
Unified Coverage Reporting
For example, consider a module “M” with these signals:
reg x[3:0];input y;wire y;
Now assume the toggle coverage data is as shown in the following table:
Table 6-2 Signals 0->1 1->0x[3] Y Nx[2:1] Y Yx[0] N Yy Y N
The toggle coverage structure would look like the following diagram. (In this figure, only some of the covdbSequence and value set children are shown.)
Now consider a case with a multiple-dimension array signal:
reg [2:0] mda[3:0][1:0];
Then the data would look like the following (only the handles containing mda[1][0][2] are shown):

module M
port signals
covdbContainer
covdbTable
“y”
covdbContainer
“y[0]”
covdbObjects
covdbSequence
“0 ‐> 1”
“1 ‐> 0”
covdbIntegerValue “0”
covdbIntegerValue “1”
covdbObjects
local signals table is not shown
compressed container represents three signal bits
covdbSequence
covdbCoverable = 2
covdbCoverable = 1
covdbCoverable = 1
covdbCoverable = 6
covdbContainer
“y[1]”
covdbCoverable = 2
…
covdbContainer
“y[2]”
covdbCoverable = 2
…
…
6-324
Unified Coverage Reporting

6-325
Unified Coverage Reporting
Assertion Coverage
Assertion coverage includes coverage information about assertions, cover properties and sequences. The covdbName of the assertion coverage metric handle is Assert.
Assertion coverage objects may appear directly in source definitions and instances (inlined assertions) or in special source regions called units, which are test-qualified source regions (see “Test-qualified Source Regions” on page 298). Inlined assertions are metric-qualified but not test-qualified, and they may be read without loading any test. Assertions in units (and the list of units itself) are not available except with respect to a given test handle.
In the current version, inlined assertions are accessible through the interface as described, but will only appear in the design as tests are loaded.
There are three types of assertion coverage objects: assertions, cover properties, and cover sequences. The handles for these different assertion coverage objects are organized into covdbContainers in each source definition and instance.
Assertions are modeled in UCAPI as covdbContainers. The covdbBlock objects in these containers represent the different type of information collected. For example, there is a covdbBlock representing success, a covdbBlock for failures, and another for attempts. The covdbName of each covdbBlock indicates what it represents.
All but one of the covdbBlock objects will have the covdbStatusExcluded flag set, indicating they should be ignored for coverage. For example, for assertions there will be a block for

6-326
Unified Coverage Reporting
attempts. The number of attempts is not used to compute the coverage score, so this block is marked excluded. The assertion is covered if its non-excluded covdbBlock object is covered.
The covdbCovCount may be read from each of these covdbBlock objects to get the number of times each type of thing occurred. Non-excluded covdbBlocks are covered if their covdbCovCount is greater than or equal to the assertion’s covdbCovCountGoal.
SystemVerilog assertions and cover directives will always be in the assert-qualified module definitions and instances in the covdbObjects list. OpenVera Assertions are contained in test-qualified source regions, as discussed in “Test-qualified Source Regions” on page 298.
The covdbFileName and covdbLineNo properties may be read from handles of type covdbContainer for assertion coverage. There is no source information for covdbBlock handles in assertion coverage.

6-327
Unified Coverage Reporting
The following diagram shows the model for assertion coverage:
For example, consider the following assertion:
clock posedge clk { event fevent : data[0] *[1..] data[2] #1 data[3]; } assert fassert : check(fevent);

6-328
Unified Coverage Reporting
The following diagram shows the UCAPI structure for this assertion with basic coverage. Note that there are five covdbBlocks under the assertion, but that only the realsuccesses block counts for coverage, since the other blocks are all marked excluded. These other blocks (e.g., attempts, incompletes) are in the database, but are never considered for coverage.

6-329
Unified Coverage Reporting
In this example that only the paths where the first range (#[1..]) had value 1 or 2 was the assertion covered. It was covered one time for the value 1 and three times for the value 2. You can see this as the covdbCovCount of the individual covdbCross bin handles.

6-330
Unified Coverage Reporting
Now consider another example, a cover property with multiple time intervals in it:
property p; int var_l; @clk a ##[2:4] b or (a, var_l=ex) ##1 c[*1:$] ##1 !a && (ex==var_l)[*1:8] ##1 a; endproperty
Since this property has a top-level or, it will have two containers for paths under the assertion container. Also, since the second term has two time intervals in it, the crosses contains two values each.

6-331
Unified Coverage Reporting
You can read the category and severity failures for a given assertion handle using the covdb_get_annotation function:
char *category = covdb_get_annotation(assertionHdl, “FCOV_ASSERT_CATEGORY”); char *severity = covdb_get_annotation(assertionHdl,

6-332
Unified Coverage Reporting
“FCOV_ASSERT_SEVERITY”);
For cover properties, there are four blocks under the property, namely, "attempts", "failures", "allsuccesses" and "incompletes". Additionally, if vacuous passes are monitored at runtime using the

6-333
Unified Coverage Reporting
switch -assert vacuous, a fifth block, named "vacuoussuccesses" will be added to the container (as shown in the blue rectangle in the figure) as follows:

6-334
Unified Coverage Reporting
Testbench Coverage
Testbench coverage monitors user-specified expressions during simulation. Testbench coverage data may be monitored through coverage constructs in Vera, Native Testbench (NTB), or System Verilog. The covdbName of the testbench coverage metric handle is Testbench.
Testbench coverage monitors three different types of coverable objects: states (value sets), transitions (modeled as covdbSequence objects), and crosses (covdbCross objects). For testbench coverage, the containers of these coverable objects are called bin tables.
As for assertion coverage, many of the coverable objects in testbench coverage may be marked covdbStatusExcluded. Such objects are not used when computing coverage information such as the covdbCovered or covdbCoverable properties.
The covdbFileName and covdbLineNo properties may be read from group, group instance, point and cross declaration handles for testbench coverage. No other handles types for testbench coverage have source information.
When testbench covergroups are defined within HDL modules (for example, inside a SystemVerilog module), they are accessed as the covdbObjects list from the testbench-qualified HDL module handle.
The following figure shows the structure of testbench coverage within a test-qualified group or instance definition. The top-level list is containers representing point or cross declarations within the group. Each point or cross declaration has one or more bin tables, and each bin table has its list of bins.

6-335
Unified Coverage Reporting
For cross declarations, there may be a covdbComponents list, which will contain the list of point declarations that are being crossed.
The bin handle can be different depending on the type of bin table. The types of bin tables are user-defined bin table, auto bin table, user-defined cross table, and auto cross table. The type of the table is given by its covdbName property.
Currently there is no representation in UCAPI of the containing program for covergroups declared in programs.
Setting Hit Count on Bins
You can set hit count on user bins, compressed and uncompressed auto bins for coverpoint and cross.

6-336
Unified Coverage Reporting
Usage
covdb_set(binHandle, coverGroupHandle, testHandle, covdbCovCount, hitCount)
covdb_get(binHandle, coverGroupHandle, testHandle, covdbCovCount)
Hit count can be set on bin handles at definition or instance level.
It's allowed at definition level only when per_instance is off. Because, definition level hit count should be equal to the sum of hit counts of the bin in all instances. If it's set at definition level, you can't distribute it among instances. So, you get an error when you try to set the hit count on definition level bin handles keeping per_instance ON.
You can set hit count on instance level bin handles. The increase or decrease in hit count is populated to the corresponding bin at the definition level.
Set covdbStatusCovered
To mark a bin as covered, increment the hit count of that bin to the coverpoint's least value.
Usagecovdb_set(binHandle, coverGroupHandle, testHandle, covdbCovStatus,covdbStatusCovered)
covdb_get(binHandle, coverGroupHandle, testHandle, covdbCovStatus)

6-337
Unified Coverage Reporting
Contents of the Bin Tables
For user-defined and auto bin tables, the bins will all be value sets. For example, a bin X with the value 5 would be:
And a bin Bin Y = [0:32] will be represented by the following:

6-338
Unified Coverage Reporting
Crosses contain handles to the bins being crossed, so a cross of X = 5 and Y in [11'h000 : 11'h020] would be:

6-339
Unified Coverage Reporting
User-defined cross bins are defined by the (what would otherwise be) auto-cross bins they contain. The user-defined cross bins (in the user-defined cross bins table), therefore have an extra level of structure:
The covdbName string property of a point container gives the name of the expression being sampled. For example, a coverpoint on variable "myvar" would have covdbName = "myvar". A cross container has the relation covdbComponents, which is an iterator over the coverpoint containers that were crossed to create the cross

6-340
Unified Coverage Reporting
itself. Using these two methods (names for points and covdbComponents for crosses), applications can determine the meaning of the values given in the bins.
For example, if a coverpoint's name is "myvar", then each of its value set bins will refer to a value of "myvar" that was observed. If a cross's components are points x and y, then the value set bins in each cross bin are bins from coverpoints x and y, respectively.
Compressed Bins Each bin handle will have the string annotation "COVERPOINT_BIN" set to 1 or 0. If it is set to 1, it means the bin is a regular bin. If it is set to 0, it means the bin is a compressed bin. Compressed bins have covdbCoverable greater than 1 (the value is the number of bins that were compressed).
The property 'covdbObjects' gives an iterator over individual coverpoint bins of compressed coverpoint bin handle. In case of compressed cross bins, there are two kinds of iterators:
• iterating over individual uncompressed auto-cross bins. The property 'covdbObjects' returns this iterator.
• iterating over constituent coverpoint bins. The property 'covdbComponents' returns this iterator.

6-341
Unified Coverage Reporting
For example, the following bin, auto[1:3], is a compressed bin made up of three bins, one each for the values 1, 2 and 3. The compressed bin is a covdbBlock, and its covdbObjects list is the list of bins that make it up:

6-342
Unified Coverage Reporting
Limitations
Currently, only automatically-generated cross bins are represented as covdbCross objects. User-defined cross bins are represented as covdbBlock objects. All transitions are currently represented as covdbBlock objects.
The covdbComponents list is currently only available for automatically generated crosses, not for user-defined crosses.
Loading a Design
Note that when using VCS, designs are loaded with the covdb_load() function. The following function, loadDesign, accepts a string argument representing the path to the design and then loads the design.
covdbHandle loadDesign(char *design){ covdbHandle designHandle = covdb_load(covdbDesign, NULL, design);if(!designHandle) printf("Error: could not load design %s\n", design); else printf("Info: loaded design %s\n", design); return designHandle;}// example of calling the function:covdbHandle designHandle = loadDesign("simv"); //
Note:A handle returned by covdb_load is persistent until unloaded by covdb_unload.

6-343
Unified Coverage Reporting
Available Tests
Loading a design does not load the test(s) associated with a design. Given a valid design handle, the available tests can be accessed.
Calling covdb_iterate() with covdbAvailableTests returns an iterator to a list of the testnames associated with the design. These tests are not automatically loaded; they must be loaded with one of the API functions. The following C function shows the available tests associated with a design handle.
void showAvailableTests(covdbHandle designHandle){ covdbHandle availableTestName availableTestNameIterator; availableTestNameIterator = covdb_iterate(designHandle, covdbAvailableTests); printf("Design: %s has the following tests:\n", covdb_get_str(designHandle, covdbName)); while(availableTestName = covdb_scan(availableTestNameIterator)) printf("\ttest: %s\n", covdb_get_str(availableTestName, covdbName)); covdb_release_handle(availableTestNameIterator);}
Loading Tests
Tests are not automatically loaded with a design. Once a design handle has been obtained, the handle is used to access the list of test names and then load one or more of the tests. A single test is loaded with covdb_load while two or more tests can be loaded with successive calls to covdb_loadmerge.
Loading a single test requires that a valid design handle and test name string be available:

6-344
Unified Coverage Reporting
/* load a single test from a design */covdbHandle testHandle;testHandle = covdb_load(covdbTest, designHandle, testName);if(!testHandle) { printf("UCAPI Error: could not load test %s\n", testName); exit(1);}
Loading and merging two or more tests first requires the loading of a single test with covdb_load followed by multiple calls to covdb_loadmerge to load and merge the additional tests' data. The following example shows a function used to load all the available tests related to a design. It is assumed that all of the test data is contained in one location with the design data.
covdbHandle loadTests(covdbHandle designHandle){ covdbHandle availableTestName; availableTestNameIterator; covdbHandle mergedTest;
// get an iterator to the list of availableTests availableTestNameIterator = covdb_iterate(designHandle, covdbAvailableTests);
// Using the iterator get the first available test availableTestName = covdb_scan(availableTestNameIterator);
// load the first test mergedTest = covdb_load(covdbTest, designHandle, , availableTestName); if(mergedTest) printf("Successfully loaded test %0s\n", covdb_get_str(availableTestName, covdbName); else { printf("Unable to load test\n"); return NULL; }
// using loadmerge load and merge the remaining tests

6-345
Unified Coverage Reporting
while((availableTestName = covdb_scan(availableTestNameIterator))) { mergedTest = covdb_loadmerge(covdbTest, mergedTest, availableTestName); if(!mergedTest) printf("Could not load test %s\n", covdb_get_str(availableTestName, covdbName)); else printf("Successfully loaded and merged test %s\n", covdb_get_str(availableTestName, covdbName); } covdb_release_handle(availableTestNameIterator); return mergedTest;}
The UCAPI method covdb_release_handle() function is called to release the iterator availableTestNameIterator. This is done because a handle returned from a covdb_iterate() call is persistent. Releasing the handle frees the associated memory and prevents a memory leak.
Determining Which Test Covered an Object
This section describes how to use UCAPI to find which test covered a given coverable object. When you merge two or more tests in UCAPI, the information about which test covered which object is retained. You can recover it by using the covdbTests relation from a coverable object handle.
For example:
design = covdb_load(covdbDesign, NULL, “mysimv”);test = covdb_load(covdbTest, design, “mysimv/test1”);test = covdb_loadmerge(covdbTest, test, “mysimv/test2”);…tstsIter = covdb_qualified_object_iterate(binHdl, groupHdl, testHdl,covdbTests);
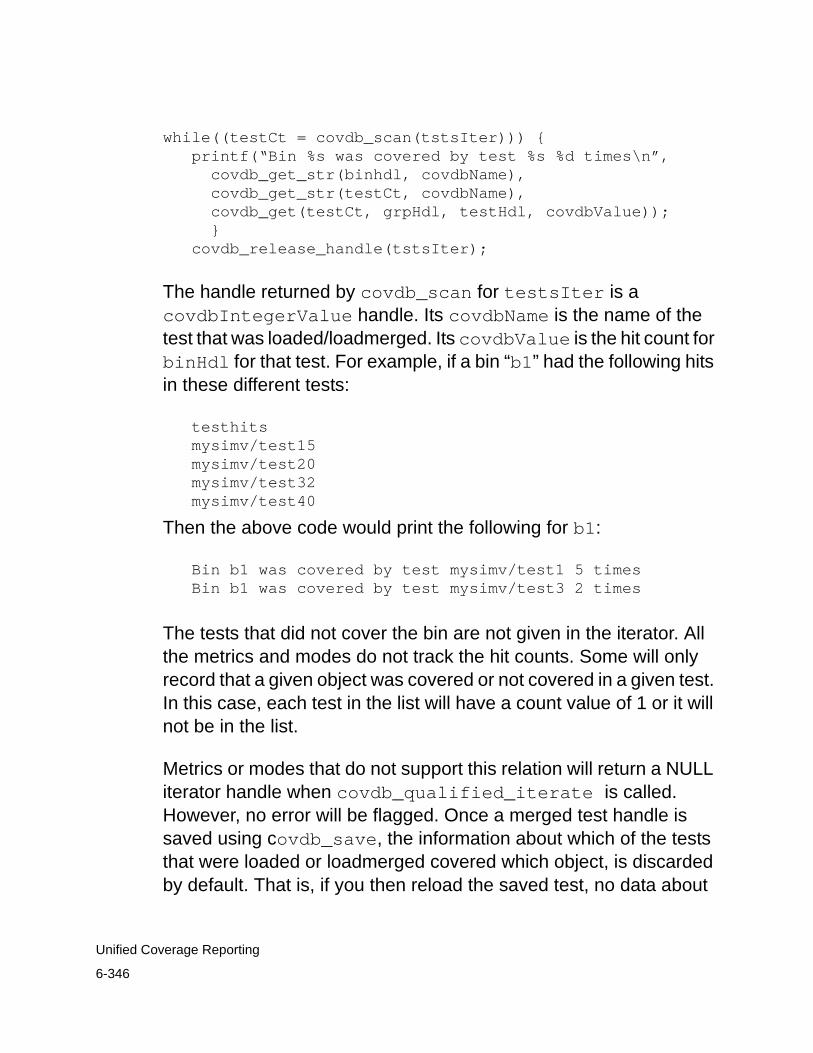
6-346
Unified Coverage Reporting
while((testCt = covdb_scan(tstsIter))) {printf(“Bin %s was covered by test %s %d times\n”,covdb_get_str(binhdl, covdbName),covdb_get_str(testCt, covdbName),covdb_get(testCt, grpHdl, testHdl, covdbValue));}
covdb_release_handle(tstsIter);
The handle returned by covdb_scan for testsIter is a covdbIntegerValue handle. Its covdbName is the name of the test that was loaded/loadmerged. Its covdbValue is the hit count for binHdl for that test. For example, if a bin “b1” had the following hits in these different tests:
testhitsmysimv/test15mysimv/test20mysimv/test32mysimv/test40
Then the above code would print the following for b1:
Bin b1 was covered by test mysimv/test1 5 timesBin b1 was covered by test mysimv/test3 2 times
The tests that did not cover the bin are not given in the iterator. All the metrics and modes do not track the hit counts. Some will only record that a given object was covered or not covered in a given test. In this case, each test in the list will have a count value of 1 or it will not be in the list.
Metrics or modes that do not support this relation will return a NULL iterator handle when covdb_qualified_iterate is called. However, no error will be flagged. Once a merged test handle is saved using covdb_save, the information about which of the tests that were loaded or loadmerged covered which object, is discarded by default. That is, if you then reload the saved test, no data about

6-347
Unified Coverage Reporting
the individual tests that were merged to create it will have been retained. You can change this behavior by using covdb_configure to set covdbKeepTestInfo to true before you load the initial design as follows:
covdb_configure(design, covdbKeepTestInfo, “true”);

6-348
Unified Coverage Reporting
IN-1
Index
Symbols-cm_line contassign 1-12&&
in condition coverage 1-17
Aannotated source code 4-151, 4-163assertion argument to the -cm option 2-38assertion coverage 3-68
specifying 2-38
Bblocks
code blocks in line coverage 1-8–??in line coverage 1-6, 1-13
branch argument to the -cm option 2-38Branch Coverage 4-163branch coverage
specifying 2-38
Ccase statement
in line coverage 1-12Chart Linkage 3-116-cm_line contassign 1-12Code coverage, metrics reported 3-44
color display, source window 4-176compiling for coverage 2-35cond argument to the -cm option 2-38condition coverage 3-55
defined 1-15, 1-15–??specifying 2-38
Condition Coverage Detail Window 4-155conditional expression
in condition coverage 1-16conditional operator
in condition coverage 1-16continuous assignment statements
in condition coverage 1-17coverage database, open 4-130Coverage Detail Window 4-147coverage information, summary 3-98Coverage Map Window 4-146coverage report, FSM 3-59Coverage Table Window 4-143coverage type representation 3-90coverage, assertion 3-68coverage, condition 3-55coverage, toggle report 3-53coverage, viewing results 4-142Customizing URG Charts 3-109
Ddashboard.html 3-92

IN-2
DVE 5-222starting 4-130
Eelfile 5-221environment variable
URG_FAKE_TIME 3-111environment variables
URG_NO_SESSION_XML 3-111exclusion, commands 5-219
Ffilter coveragedisplay 4-174forever statement
in line coverage 1-11fsm argument to the -cm option 2-38FSM coverage 3-59
criteria for an FSM 1-22specifying 2-38
FSM transition mode 4-159
GGenerating Trend Charts 3-106groups, creating coverage 4-149groups.html 3-97
HHierarchical Linkage 3-125hierarchy.html 3-94
Iif statement
in line coverage 1-6, 1-11if-else statement
in line coverage 1-11invokingDVE 4-130
Lline argument to the -cm option 2-38
line coveragedefined 1-5difference from statement coverage 1-9
line coverage, displaying 4-151load coverage session 4-138load exclusion state 5-233Loading and Saving Sessions 4-138
Mmap window, coverage 4-146mapping coverage for subhierarchies also used in another design ??–5-211Metric-wide Breakdown Linkage 3-120modN.html 3-98module, , displaying coverage results by 4-145monitoring for coverage 2-36
NNavigating Trend Reports 3-114navigation menu 3-91net and register coverage results 4-152
Oobjects tables 3-48Older Session URG Links 3-128Organization of Trend Charts 3-117
Ppages, report generated 3-44procedural assignment statement
in condition coverage 1-16procedural assignment statements
in condition coverage 1-17
Rrecalculate the coverage 5-226report pages 3-44reported code coverage metrics 3-44reports

IN-3
generating 2-36Running a Quick Start Example 4-130
Ssave exclusion state 5-232sequences view, FSM 4-160session.xml file
suppressing the generation of 3-111simulating while monitoring for coverage 2-36source code, displaying 4-151, 4-163-srcmap 5-215start coverage mode 4-130starting DVE 4-130statement coverage
difference from line coverage 1-9statistics table, formatting 3-47summary coverage information 3-98SVA coverage 4-164
Ttask definition
in line coverage 1-10TCL scripts 4-173tgl argument to the -cm option 2-38The 3-48timestamp, manipulating 3-111
toggle coverage 3-53specifying 2-38
Toggle tab 4-152Top Level Chart 3-117-trend option 3-105Trend Plot 3-107type, coverage representation 3-90
UURG
annotating exclusion 5-255URG_FAKE_TIME environment variable 3-111URG_NO_SESSION_XML environment vari-able 3-111user-defined coverage groups 4-149
VViewing Coverage Results 4-142
Wwait statement
procedural delay is interpreted as 1-9while statement
in line coverage 1-6, 1-11

IN-4