COVERAGE Sector: Dixon Technologies (India) Ltd
29
BUY CMP Rs 9,401 Target Rs 11,056 Upside 17.6% For important information about YES Securities (India) Ltd. and other disclosures, refer to the end of this material. 1 Dixon Technologies (India) Ltd INITIATING COVERAGE | Sector: Consumer Durables September 18, 2020 Emerging as a domestic champion in the EMS space DIXON Technologies (DIXON), India’s largest EMS player is currently in a sweet spot given a confluence of rising demand, import substitution and favorable regulatory support at the same time. The company is preparing for aggressive scale‐up across product segments by investing in increasing management bandwidth, adding export markets as a key growth engine and continuously increasing the value addition in products like lighting, washing machines and now televisions. Fungible capacities, backward integration, focus on ODM solutions vs OEM and continued addition of MNC clients have been key growth enablers behind driving a 30% revenue and 56% PAT growth over FY15‐20. Further, an asset‐light balance sheet, low WC cycle, disciplined capital investments with 18 months payback make it an attractive and scalable business. After establishing a dominant presence in lighting, company is eyeing a similar positioning in TVs, WMs and mobiles. High asset turns and low capex requirement should take ROCE above 40% despite an expected revenue and PAT CAGR of 35%/39% over FY20‐25E. Given the sharp run‐up, further upside is dependent on the company getting one or two mobile PLI licenses, which can be transformational. We initiate coverage with BUY with a PT of Rs 11,056 based on 32x FY23E earnings (factoring in one PLI license), which would increase to Rs 13,763 in case the company gets both. Market leadership, timely expansion & import restrictions driving industry‐leading growth DIXON is the market leader in LED lights, semi‐automatic washing machines and LED TVs and continues to attract more clients in those segments given its scale economies. Its success in lighting can now play out in other categories as it gets into fully automatic washing machines and smart TVs. Contribution from mobiles (which is 70% of industry and only 12% for DIXON’s revenues) is likely to increase significantly once the PLI licenses come and DIXON establishes a dominant capacity there as well. Import restrictions on LED panels and a favorable tax structure have also enabled DIXON to gain market share across segments. PLI scheme for mobiles – management is hopeful of two licenses; we build in one for now The company has made two out of seven applications for domestic manufacturers to participate in the Government’s Production Linked Incentive (PLI) scheme for mobile manufacturing. It has a strong chance of selection given five applicants will be selected, and it could be a windfall if both licenses come through. The company has already concluded an agreement with a global brand to make smartphones for the domestic and smartphone market and targets to start production from 4QFY21 if the approval comes through. We build in a revenue of Rs 7bn in FY21 and Rs 90bn in FY25E at an EBITDA margin of 3.2% assuming one license is approved. PLI in other products like STBs and lighting are also under discussion. Diversifying across clients, geographies and product segments DIXON has steadily added new product segments to its portfolio and has also seen success in getting into more ODM solutions vs plain vanilla OEM business. Its MNC client base has also been increasing with current key clients being Philips, Panasonic, Samsung and Xiaomi, where it has focused on cross selling opportunities to diversified OEMs. After reaching a dominant position and scale in lighting and WM, export opportunities have now opened up in both. Key growth drivers going forward would be higher value‐added products like fully automatic washing machines, smartphones under the PLI scheme and otherwise and set top boxes. Increased scale, better mix and backward integration to drive margins Increased automation in lighting will improve efficiencies and reduce employee costs, driving up margins. Entry into fully automatic washing machines would also be margin driver while increased backward integration through SMT lines and ODM solutions in TVs could also improve margins. New segments like set top boxes and medical devices are high margin segments as well. Mobile is the only business which will have lower margins but very high asset turns given the OEM nature of business. Strong balance sheet and astute capital allocation give confidence on sustainability The company should be able to fund an estimated Rs 900mn annual capex comfortably (excluding Rs 2bn per PLI license over four years) given its strong balance sheet. In addition, management’s high hurdle rate for new projects at 25‐30% will ensure solid return ratios. Stock data (as on Sep 18, 2020) Nifty 11,505 52 Week h/l (Rs) 10,290 / 2,480 Market cap (Rs/USD mn) 108766 / 1481 Outstanding Shares (mn) 12 6m Avg t/o (Rs mn): 439 Div yield (%): 0.0 Bloomberg code: DIXON IN NSE code: DIXON Stock performance 1M 3M 1Y Absolute return 19.3% 68.9% 269.4% Shareholding pattern (As of Jun’20 end) Promoter 36.1% FII+DII 34.2% Others 29.7% Financial Summary FY21E FY22E FY23E Revenues 55,910 102,361 131,449 Yoy growth (%) 27.1 83.1 28.4 OPM (%) 5.2 4.8 4.8 EPS (Rs) 148.9 262.2 345.5 EPS growth 43.0 76.1 31.8 P/E (x) 63.1 35.8 27.2 Price/Book (x) 15.4 11.0 8.0 EV/EBITDA (x) 37.1 21.9 17.0 Debt/Equity (x) 0.1 0.1 0.1 RoE (%) 27.7 35.9 34.2 RoCE (%) 36.4 48.1 45.3 HIMANSHU NAYYAR Lead Analyst [email protected] +91 9920915754 HARISH ADVANI, Associate [email protected] AMAR AMBANI, Sr. President, Head of Research [email protected] 0 200 400 600 Sep‐19 Jan‐20 May‐20 Sep‐20 DIXON Nifty
Transcript of COVERAGE Sector: Dixon Technologies (India) Ltd

BUY CMP Rs 9,401 Target Rs 11,056 Upside 17.6%
For important information about YES Securities (India) Ltd. and other disclosures, refer to the end of this material. 1
Dixon Technologies (India) Ltd INITIATING COVERAGE | Sector: Consumer Durables
September 18, 2020
Emerging as a domestic champion in the EMS space DIXON Technologies (DIXON), India’s largest EMS player is currently in a sweet spot given a confluence of rising demand, import substitution and favorable regulatory support at the same time. The company is preparing for aggressive scale‐up across product segments by investing in increasing management bandwidth, adding export markets as a key growth engine and continuously increasing the value addition in products like lighting, washing machines and now televisions. Fungible capacities, backward integration, focus on ODM solutions vs OEM and continued addition of MNC clients have been key growth enablers behind driving a 30% revenue and 56% PAT growth over FY15‐20. Further, an asset‐light balance sheet, low WC cycle, disciplined capital investments with 18 months payback make it an attractive and scalable business. After establishing a dominant presence in lighting, company is eyeing a similar positioning in TVs, WMs and mobiles. High asset turns and low capex requirement should take ROCE above 40% despite an expected revenue and PAT CAGR of 35%/39% over FY20‐25E. Given the sharp run‐up, further upside is dependent on the company getting one or two mobile PLI licenses, which can be transformational. We initiate coverage with BUY with a PT of Rs 11,056 based on 32x FY23E earnings (factoring in one PLI license), which would increase to Rs 13,763 in case the company gets both.
Market leadership, timely expansion & import restrictions driving industry‐leading growth DIXON is the market leader in LED lights, semi‐automatic washing machines and LED TVs and continues to attract more clients in those segments given its scale economies. Its success in lighting can now play out in other categories as it gets into fully automatic washing machines and smart TVs. Contribution from mobiles (which is 70% of industry and only 12% for DIXON’s revenues) is likely to increase significantly once the PLI licenses come and DIXON establishes a dominant capacity there as well. Import restrictions on LED panels and a favorable tax structure have also enabled DIXON to gain market share across segments.
PLI scheme for mobiles – management is hopeful of two licenses; we build in one for now The company has made two out of seven applications for domestic manufacturers to participate in the Government’s Production Linked Incentive (PLI) scheme for mobile manufacturing. It has a strong chance of selection given five applicants will be selected, and it could be a windfall if both licenses come through. The company has already concluded an agreement with a global brand to make smartphones for the domestic and smartphone market and targets to start production from 4QFY21 if the approval comes through. We build in a revenue of Rs 7bn in FY21 and Rs 90bn in FY25E at an EBITDA margin of 3.2% assuming one license is approved. PLI in other products like STBs and lighting are also under discussion.
Diversifying across clients, geographies and product segments DIXON has steadily added new product segments to its portfolio and has also seen success in getting into more ODM solutions vs plain vanilla OEM business. Its MNC client base has also been increasing with current key clients being Philips, Panasonic, Samsung and Xiaomi, where it has focused on cross selling opportunities to diversified OEMs. After reaching a dominant position and scale in lighting and WM, export opportunities have now opened up in both. Key growth drivers going forward would be higher value‐added products like fully automatic washing machines, smartphones under the PLI scheme and otherwise and set top boxes.
Increased scale, better mix and backward integration to drive margins Increased automation in lighting will improve efficiencies and reduce employee costs, driving up margins. Entry into fully automatic washing machines would also be margin driver while increased backward integration through SMT lines and ODM solutions in TVs could also improve margins. New segments like set top boxes and medical devices are high margin segments as well. Mobile is the only business which will have lower margins but very high asset turns given the OEM nature of business.
Strong balance sheet and astute capital allocation give confidence on sustainability The company should be able to fund an estimated Rs 900mn annual capex comfortably (excluding Rs 2bn per PLI license over four years) given its strong balance sheet. In addition, management’s high hurdle rate for new projects at 25‐30% will ensure solid return ratios.
Stock data (as on Sep 18, 2020) Nifty 11,505 52 Week h/l (Rs) 10,290 / 2,480 Market cap (Rs/USD mn) 108766 / 1481 Outstanding Shares (mn) 12 6m Avg t/o (Rs mn): 439 Div yield (%): 0.0 Bloomberg code: DIXON IN NSE code: DIXON Stock performance
1M 3M 1Y
Absolute return 19.3% 68.9% 269.4% Shareholding pattern (As of Jun’20 end) Promoter 36.1% FII+DII 34.2% Others 29.7% Financial Summary FY21E FY22E FY23E Revenues 55,910 102,361 131,449 Yoy growth (%) 27.1 83.1 28.4 OPM (%) 5.2 4.8 4.8 EPS (Rs) 148.9 262.2 345.5 EPS growth 43.0 76.1 31.8 P/E (x) 63.1 35.8 27.2 Price/Book (x) 15.4 11.0 8.0 EV/EBITDA (x) 37.1 21.9 17.0 Debt/Equity (x) 0.1 0.1 0.1 RoE (%) 27.7 35.9 34.2 RoCE (%) 36.4 48.1 45.3
HIMANSHU NAYYAR Lead Analyst
[email protected] +91 9920915754
HARISH ADVANI, Associate
AMAR AMBANI, Sr. President, Head of Research
0
200
400
600
Sep‐19 Jan‐20 May‐20 Sep‐20
DIXON Nifty

For important information about YES Securities (India) Ltd. and other disclosures, refer to the end of this material. 2
Dixon Technologies (India) Ltd
STORY IN CHARTS
Well set to gain market share across segments Strong marquee client addition in past three years
Year FY18 FY19 FY20
Lighting
Wipro, Panasonic,
Anchor, Bajaj, Crompton Usha
Syska, Orient, Ajanta, RR
Kabel, Polycab
Control & Switchgear, Looper, Plunt, Havells, HPL
Electric
Washing Machines
Samsung, Lloyd, Micromax
MarQ (Flipkart) Voltas Beko
TVs MarQ (Flipkart), Skyworth, TCL
Xaiomi, Lloyd, BPL, Kory, Philips
Samsung
Mobiles Panasonic, Blaupunkt, Tambo
Micromax, Mobistar, Intex
Samsung
Source: Company, YES Sec – Research Source: Company, YES Sec – Research
Revenue CAGR of 30% over FY15‐20 can pick up further
EBITDA CAGR of 47% given higher ODM share has helped gradually increase ROCE
Source: Company, YES Sec – Research Source: Company, YES Sec – Research
32% CAGR in the Indian EMS/ODM market (US$ bn)
Mobiles and TVs are the largest segments by far
Source: Industry, YES Sec – Research Source: Industry, YES Sec – Research
7% 6%
30%
0.2%
12%14%
42%
0.4%
19%
30%
49%
2%
0.0%
15.0%
30.0%
45.0%
60.0%
Washingmachines
TV Lighting Mobiles
FY17 FY20 FY23E
0
10,000
20,000
30,000
40,000
50,000
FY15 FY16 FY17 FY18 FY19 FY20
(Rs mn) Segmental Revenue Performance
Lighting TV WM Mobiles Others
0%
10%
20%
30%
40%
FY15 FY16 FY17 FY18 FY19 FY20
Margin and ROCE profile
EBITDA margin (%) ROCE (%) ODM share (%)
1.4 1.61.9
2.2
3
3.8
4.7
6.1
8.1
0
1
2
3
4
5
6
7
8
9
FY13 FY14 FY15 FY16 FY17 FY18 FY19 FY20 FY21
15%
6%
3%3%
70%
Television
Refrigerator
Washing Machine
Air Conditioner
Mobiles

For important information about YES Securities (India) Ltd. and other disclosures, refer to the end of this material. 3
Dixon Technologies (India) Ltd
India strongly placed to gain market share from China
Indian cos to benefit from import substitution
Source: Industry, YES Sec – Research Source: Industry, YES Sec – Research
Strong 19% projected CAGR in Indian EMS manufacturing should help players like DIXON
Significant room for increasing domestic sourcing given high import dependence
Source: Industry, YES Sec – Research Source: Industry, YES Sec – Research
51%
19%
10%
6%
4%2%2%
6% China
US
Japan
South Korea
Germany
France
India
Others
29
37
49
60
70
38 41 43
53 57
6.2 5.9 5.9 6.4 8.8
0
20
40
60
80
2014‐15 2015‐16 2016‐17 2017‐18 2018‐19
Production Imports Exports
764
322
1,480
799
0
400
800
1,200
1,600
Appliance market Domestic manufacturing
FY19 FY25E
45%
70%
45%
80%
65%
0%
25%
50%
75%
100%
Lighting(driver chip)
TVs (opencell)
WMs (motor,gearbox)
Mobiles(display,assembly)
Overall

For important information about YES Securities (India) Ltd. and other disclosures, refer to the end of this material. 4
Dixon Technologies (India) Ltd
LONG TERM POTENTIAL
Earnings
Past 8yr Past 5yr 3yr fwd
cagr
Revenue CAGR 29% 30% 44%
Earnings CAGR 66% 56% 49%
Mobile PLI scheme would be the biggest growth driver for next five years coupled with share gains in other categories like TV and washing machines and entry into new high potential segments; margins will remain improving with higher ODM business (ex‐mobiles) and continued value addition
Multiple
Past 8yr
Past 5yr
Next 3 yrs
Next 5 yrs
ROCE (%) 25.3 31.9 43.3 42.3
FCF (Rs bn) 1.5 0.8 2.5 9.3
Leverage 0.6 0.3 0.1 0.1
Industry growth 25% 32% 18% 19%
FCF generation will increase sharply given strong growth in mobile PLI business where asset turns are significantly higher which will push up return ratios much higher than historical levels; industry tailwinds will also support premium multiples for leading players like DIXON
Historical Valuation bands
P/E (x) EV/EBITDA (x)
Entry level price range Bear P/E Base P/E
(DIXON share price Rs) 27x 32x
EPS FY22 7,080 8,391
Exit level price range Base P/E Bull P/E
(DIXON share price Rs) 32x 37x
EPS FY25 17,185 19,870
CMP Rs 9,401
+ Cumulative Dividends Rs 129
+ Bull exit level Rs 19,870
= 113% Potential Returns (in 3.5 years)

For important information about YES Securities (India) Ltd. and other disclosures, refer to the end of this material. 5
Dixon Technologies (India) Ltd
Proforma financials for one mobile PLI license FY21E FY22E FY23E FY24E FY25E
Revenue (Rs bn) 7,000 30,000 45,000 70,000 90,000
EBITDA margin (%) 2.5% 3.2% 3.2% 3.2% 3.2%
EBITDA (Rs bn)
175 960 1,440
2,240
2,880
Depreciation + Interest 11
90
135 180 180
PBT
164 870 1,305
2,060
2,700
Tax @ 25% 41 218
326 515 675
PAT
123 653
979
1,545
2,025
Capital Employed (Rs mn)
500 1,000 1,500
2,000
2,000
ROCE 32.8% 87.0% 87.0% 103.0% 135.0%
No. of shares 11.6 11.6 11.6 11.6 11.6
EPS 10.6 56.4 84.6 133.5 175.0
Value per share @ 32x 2,707
Current TP (assuming one PLI)
11,056
TP assuming both PLI's approved 13,763
Source: YES Sec – Research
COMPANY BASICS Started in 1993 by promoter Sunil Vachani with its first product offering of colour television,
DIXON has developed into a fully integrated product and solution provider in the EMS industry with an overall market share of about 8%.
It currently manufactures under six verticals – consumer electronics, home appliances, mobile phones, lighting products, reverse logistics and security systems. It has recently entered two new segments – set top boxes and medical electronics.
DIXON works with clients under two business models – OEM where product designs and raw materials are provided by the OEM brand DIXON does assembly as per client specifications and the ODM model where product development, designing, raw material sourcing and manufacturing is done in‐house by the company. ODM is a much more profitable model given the larger scope of work.
Currently, DIXON manufactures lighting products and semi‐automatic washing machines under the ODM model. The company has built strong volume share in 3 segments – lighting (50%), LED TVs (40%) and semi‐automatic washing machines (30%).
DIXON has nine manufacturing units located in Dehradun, Noida and Tirupati.
Company has posted a strong revenue/EBITDA/PAT CAGR of 30%/47%/56% over FY15‐20.

For important information about YES Securities (India) Ltd. and other disclosures, refer to the end of this material. 6
Dixon Technologies (India) Ltd
EMS industry size for various segments and DIXON’s fortifying position
Current volume share (FY21E) Expected industry volume CAGR (FY20‐25E) Value (bn) Industry volume DIXON's volume DIXON's volume share
Light bulbs 200 548 242 44% 15%
‐Bulbs 160 500 130 50% 15%
‐Battens 40 48 12 25% 15%
TVs 900 18 3.4 19% 10%
Washing machines 150 8 1.7 21% 12%
‐Semi‐automatic 60 4 1.1 28% 12%
‐Fully‐automatic 90 4 0.6 15% 12%
Mobiles 4500 1050 30 3% 11%
‐Feature phones 500 550 28 5% ‐3%
‐Smart phones 4000 500 1.5 0% 22%
Security systems 55 25 6 24% 15%
‐CCTVs 25 6 24% 15% Source: Company, Industry, YES Sec – Research
Revenue mix (FY21E) Revenue mix (FY25E)
Source: Company, YES Sec – Research Source: Company, YES Sec – Research
EBITDA mix (FY21E) EBITDA mix (FY25E)
Source: Company, YES Sec – Research Source: Company, YES Sec – Research
19%
43%
8%0%
24%
3%3%
Lighting
Consumer Electronics
Washing Machine
Servicing
Mobiles
Camera
STB/Medical
12%
25%
5%0%
50%
2%7% Lighting
Consumer Electronics
Washing Machine
Servicing
Mobiles
Camera
STB/Medical
31%
20%16%
1%
25%
1%7% Lighting
Consumer Electronics
Washing Machine
Servicing
Mobiles
Camera
STB/Medical
25%
15%
11%1%
40%
1%7% Lighting
Consumer Electronics
Washing Machine
Servicing
Mobiles
Camera
STB/Medical

For important information about YES Securities (India) Ltd. and other disclosures, refer to the end of this material. 7
Dixon Technologies (India) Ltd
Strong positioning for DIXON across key segments
Segment Backward Integration DIXON's positioning
Home Appliances
Plastic moulding, panels,
Post capacity increase, will cater to 30% of market,
Washing machines
Control table, twin tubs, motors
higher value addition in fully automatic machines
Lighting Sheet metal, plastic Moulding,
ODM share increased to about 94%, cater to 45% of India demand,
LED bulbs, battens
wound components now ramping up battens, downlighters and commercial lighting
Consumer Electronics
Backlight unit, plastic moulding,
Post expansion, will cater to 40% of India's demand,
LED TVs circuits, LCM, SMT margin improvement given backward integration
Mobile Phones PCB manufacturing If it gets one PLI license, can increase capacity to cater to 17% of India's demand;
Feature & Smartphones
moving to smartphones from feature phones
Source: Company, YES Sec – Research
Four phases in DIXON’s journey Mid to Late 90s 2000‐2008 2008‐2010 Last 9 Years
Assembly Capability
CTV and VCR assembly started
Added assembly of PCBs, DVDs, CFL bulbs and STBs
Added ODM for CTV, DVD and CFL bulbs
Started LCD/LED TVs, Mobile phones, CCTVs
Achievements
Joined hands with the Global Consumer Electronics Giants
Acquired leading Indian Consumer Durable brands as customers
1st Indian company to develop STB‐ODM solution
Reverse Logistics operations with multi location presence
Manufacturing
First manufacturing faciliity operational at Noida
Established Multi location footprint
Started sheet metal and plastic moulding
Washing Machine & LED Lighting, Magnetic and power supplies, Security Cameras
Source: Company, YES Sec – Research
FAVORABLE INDUSTRY TAILWINDS
Atmanirbhar Bharat program shows strong commitment from the government to incentivize electronics manufacturing The Government of India during the last decade has implemented various reforms/policies to increase manufacturing of electronics in the domestic market. Rising imports in this segment prompted the government to launch the National Policy of Electronics (NPE) in 2012. Under this scheme the Government created an ecosystem for globally competitive ESDM (Electronic System and Design and Manufacturing) sector in India. This policy laid the foundation for the domestic ESDM sector. India has been incentivising domestic assembly and manufacturers by imposing duties on imported mobiles. India has been using a differential duty structure since 2015‐16, which has been extended to the component level via its Phased Manufacturing Programme (PMP). The Ministry of Electronics and Information Technology (MeitY) in April 2017 introduced a Phased Manufacturing Programme (PMP) with the objective of reducing India's import dependency and increase domestic value addition. The approach was for import substitution by putting custom duties on parts and components to incentivize first assembly and progressively increase component localization. The measures implemented aided in improving India’s share in global electronics manufacturing from 1.3% (2012) to 3.0% (2018). However, this was well short of its targeted revenues due to limited value addition in the domestic market in products like mobile and LED TVs.

For important information about YES Securities (India) Ltd. and other disclosures, refer to the end of this material. 8
Dixon Technologies (India) Ltd
Massive 25% CAGR witnessed in Indian EMS manufacturng over FY15‐19
Rs bn FY15 FY16 FY17 FY18 FY19 CAGR (%)
Consumer electronics 558 558 647 735 770 8
Industrial electronics 394 451 622 691 809 20
Computer hardware 187 199 204 214 212 3
Mobile phones 189 540 900 1320 1700 73
Strategic electronics 157 181 208 236 283 16
Electronic components 397 454 521 591 677 14
LED Products 22 51 71 96 130 56
Total 1904 2433 3173 3883 4580 25
Source: Industry, YES Sec – Research
Domestic manufacturing expected to more than double over next 5‐6 years
Source: Industry, YES Sec – Research
Key growth drivers for various segments
TV Market LED Lighting Washing Machines Security Systems
Demand for smart TV due to increased digital penetration
Rising awareness of energy efficiency and cost awareness of LED lighting
Growing working population
Increase in organized real estate sector
Higher & cheaper content consumption
Innovative and differentiated products
Growing nuclear families
Rise in threat perception
Falling prices of entry‐level TVs
Rising domestic
home labour costs Growing crime
rates
Increasing multi‐TV homes in the urban market
Data thefts
Replacement from CRT & Plasma TV to LED
Remote
monitoring
6. Reduction in replacement cycle
Growth in public infrastructure
Source: YES Sec – Research
764
322
1,480
799
0
400
800
1,200
1,600
Appliance market Domestic manufacturing
FY19 FY25E

For important information about YES Securities (India) Ltd. and other disclosures, refer to the end of this material. 9
Dixon Technologies (India) Ltd
The various policies implemented in the mobile phone manufacturing sector only aided in reducing imports of fully built‐in products. These policies were not able to develop the component value system in the domestic market. As per a government report, the domestic electronics hardware manufacturing sector faces lack of a level playing field vis‐à‐vis competing nations. The sector suffers disability of around 8.5% to 11% on account of lack of adequate infrastructure, domestic supply chain and logistics; high cost of finance; inadequate availability of quality power; limited design capabilities and focus on R&D by the industry; and inadequacies in skill development.
China +1 strategy to gain prominence for more global majors Recent issues between US and China are set to increase the adoption of China +1 as many global majors might look at diversifying away from China. Although China remains the world’s largest manufacturer with more than 50% share and has strong supply chain advantages, global manufacturers are looking at other alternatives given the rising labor costs in China which are 2‐3x of India. In addition, India has a large underpenetrated domestic market which would work in its favor vs other competing countries.
Mobile PLI scheme
PLI scheme incentive details – DIXON to fall in the second bracket requiring Rs 2bn investment over 4 years
Segment Incentive rate (%)
Incremental investments over Base year (Rs bn)
Min incremental production over bear year (Rs bn)
Year Threshold Ceiling
Mobile Phone Investment of Rs 10 bn over 4 years (Rs bn) Year 1 Rs. 40 bn Rs. 160 bn
(invoice value > 15k) Year 1: 2.5 Year 2 Rs. 80 bn Rs. 240 bn
Year 2: 5 Year 3 Rs. 150 bn Rs. 300 bn
Year 3: 7.5 Year 4 Rs. 200 bn Rs. 400 bn
Year 4: 10 Year 5 Rs. 250 bn Rs. 500 bn
Mobile Phone for all domestic companies
Year 1 ‐ 6% Investment of Rs 2 bn over 4 years (Rs bn) Year 1 Rs. 5 bn Rs. 20 bn
Year 2 ‐ 6% Year 1: 0.5 Year 2 Rs. 10 bn Rs. 30 bn
Year 3 ‐ 5% Year 2: 1 Year 3 Rs. 20 bn Rs. 40 bn
Year 4 ‐ 5% Year 3: 1.5 Year 4 Rs. 35 bn Rs. 70 bn
Year 5 ‐ 4% Year 4: 2 Year 5 Rs. 50 bn Rs. 100 bn
Specified Electronic Components
Investment of Rs 1 bn over 4 years (Rs bn) Year 1 Rs. 1 bn Rs. 7 bn
Year 1: 0.25 Year 2 Rs. 2 bn Rs. 12 bn
Year 2: 0.5 Year 3 Rs. 3 bn Rs. 15 bn
Year 3: 0.75 Year 4 Rs. 4.5 bn Rs. 22.5 bn
Year 4: 1 Year 5 Rs. 5 bn Rs. 30 bn
Source: Industry, YES Sec – Research
To promote local manufacturing of components and the complete value chain to make India a global manufacturing hub for mobile manufacturing the government has announced the Production‐linked incentive scheme (PLI). The scheme shall extend an incentive of 4% to 6% on incremental sales (over base year) of goods manufactured in India and covered under target segments, to eligible companies, for a period of five (5) years subsequent to the base year as defined. According to the scheme, companies that make mobile phones which sell for Rs15,000 or more will get an incentive of up to 6% on incremental sales of all such mobile phones made in

For important information about YES Securities (India) Ltd. and other disclosures, refer to the end of this material. 10
Dixon Technologies (India) Ltd
India. The PLI scheme will be active for five years. It will take FY 2019‐20 as the base year for calculation of incentives. Any additional expenditure incurred by companies on plant, machinery, equipment, research and development and transfer of technology for manufacture of mobile phones and related electronic items will be eligible for the incentive scheme. However, all investment done by companies on land and buildings for the project will not be considered for any incentives or determine eligibility of the scheme.
The proposed scheme is likely to benefit global & domestic players in the field of mobile manufacturing and specified electronics components and bring large‐scale electronics manufacturing into India. As per media reports at least 22 companies including tech giants Samsung, Apple and Flex have applied for the incentive‐based scheme.
Proforma financials for one mobile PLI license FY21E FY22E FY23E FY24E FY25E
Revenue (Rs bn) 7,000 30,000 45,000 70,000 90,000
EBITDA margin (%) 2.5% 3.2% 3.2% 3.2% 3.2%
EBITDA (Rs bn) 175 960 1,440 2,240 2,880
Depreciation + Interest 11 90 135 180 180
PBT 164 870 1,305 2,060 2,700
Tax @ 25% 41 218 326 515 675
PAT 123 653 979 1,545 2,025
Capital Employed (Rs mn) 500 1,000 1,500 2,000 2,000
ROCE 32.8% 87.0% 87.0% 103.0% 135.0%
No. of shares 11.6 11.6 11.6 11.6 11.6
EPS 10.6 56.4 84.6 133.5 175.0
Value per share @ 32x 2,707
Current TP 11,056
TP assuming both PLI's approved 13,763
Source: YES Sec – Research
DIXON has made two applications in the domestic players category for mobile phones under the Rs15,000 price bracket. We believe DIXON is a major contender under these scheme as it there is a different application for domestic manufacturers and DIXON is amongst the largest EMS players in the country. Since ~75% of the mobile phones sold in India are under Rs15,000, these provides huge scope for the company to ramp up over the next five years. DIXON has already started identifying a fully constructed facility in Noida which it plans to lease out if its gets approvals under the scheme. It has already finalized an agreement with a client for both domestic and export markets and is also under discussion with another client in case both its applications get approved. Given the size of smartphone market in India at 180mn units annually, DIXON is targeting a capacity of ~45mn units, which will be about 25% of this demand. The company already has a capacity of 11mn, which can be ramped up to 45mn if both licenses are approved.
Why we believe strong growth can continue even beyond FY25?
Given the large Indian domestic electronics demand of US$ 106bn which is growing at 22% CAGR and should reach US$ 400bn by 2025, we do expect the supply deficit to remain which should continue to drive import substitution even beyond 2025, which should keep opening up more opportunities for leading players like DIXON.
Given India’s lower labor and overhead costs compared to China and a few other markets, a number of companies would look at India as a manufacturing destination for supply to global markets, which we believe is another key long term growth driver for DIXON as it continues to strengthen its engagement with large global brands.

For important information about YES Securities (India) Ltd. and other disclosures, refer to the end of this material. 11
Dixon Technologies (India) Ltd
The government’s thrust on developing a strong supply chain ecosystem in India and DIXON’s continued focus on increasing value addition should help DIXON drive strong market share in large categories like smartphones and TVs.
New schemes like the recent mobile PLI scheme should be able to attract high value added manufacturing. Seeing the strong response to the scheme from both domestic and global players, there are talks of extending similar PLI schemes in other product segments like lighting, set top boxes and other white goods as well which can open up more opportunities for DIXON.
DIXON has already started to venture into other high potential segments like set top boxes, medical electronics and refrigerators which can open up further growth levers in the medium term. Another high potential area in the future could be personal computers where no Indian company has ventured into so far.
INVESTMENT RATIONALE
India set to gain significant share from China in the EMS industry given low penetration levels, rising affordability, favorable government policies and rising labor cost in China
GDP per capita has risen faster than price increase in white goods over FY10‐19 (% CAGR) which has improved affordability
Source: Industry, YES Sec – Research
6.7
5.0 5.6
9.5
11.1
0
3
6
9
12
Refrigerator Washing machine Air conditioner Television GDP per capita
GDP vs ASP

For important information about YES Securities (India) Ltd. and other disclosures, refer to the end of this material. 12
Dixon Technologies (India) Ltd
India’s labor and overhead costs much lower than China making it competitive (as % of sales for mobiles)
India’s penetration levels much lower than global peers in all white goods categories
Source: Industry, YES Sec – Research Source: Industry, YES Sec – Research
Market leading position in multiple categories to drive above industry growth
Dixon well placed to gain significant market share in key categories
Source: Company, YES Sec – Research
Increasing revenue coming from ODM model bodes well for margins
ODM % share in revenue
Years Consumer Electronics (%) Lighting Products (%) Home Appliances (%)
FY20 6 87 100
FY19 9 71 100
FY18 6 40 100
FY17 12 45 100
FY16 4 40 100
Source: Company, YES Sec – Research
12 13 13 13
17
19
0
2
4
6
8
10
12
14
16
18
20
FY14 FY17 FY21E
India China
10%
60%
4%
17% 20%
70%
90%
30%25%
85%
0%
25%
50%
75%
100%
WM LED TV Room AC Air Cooler Refrigerator
India Global
7% 6%
30%
0.2%
12%14%
42%
0.4%
19%
30%
49%
2%
0.0%
15.0%
30.0%
45.0%
60.0%
Washing machines TV Lighting Mobiles
FY17 FY20 FY23E

For important information about YES Securities (India) Ltd. and other disclosures, refer to the end of this material. 13
Dixon Technologies (India) Ltd
High import dependence means significant scope for domestic sourcing and more backward integration possibilities (% of import content highest in mobiles and TVs)
Source: Industry, YES Sec – Research
Strong addition of marquee clients increases cross‐selling and export opportunities
Client additions have picked up pace over the past three years
Year Lighting Washing Machines TVs Reverse Logistics
Mobiles
FY10 Philips
FY14 Panasonic Panasonic Panasonic
FY16 Intex Intex Intex
FY17 Haier Reliance Retail, Haier Reliance Retail Gionee
FY18 Wipro, Panasonic, Anchor, Bajaj, Crompton Usha
Samsung, Lloyd, Micromax
MarQ (Flipkart), Skyworth, TCL
Panasonic, Blaupunkt, Tambo
FY19 Syska, Orient, Ajanta, RR Kabel, Polycab
MarQ (Flipkart) Xaiomi, Lloyd, BPL, Kory, Philips
Micromax, Mobistar, Intex
FY20 Control & Switchgear, Looper, Plunt, Havells, HPL Electric
Voltas Beko Samsung Jio Samsung
Source: Company, YES Sec – Research
Aggressive and timely capacity expansion across verticals has driven share gains
Capacity utilization rates across segments Capacity (mn units) FY20 volumes utilization (%)
TV 3.6 2.1 58%
Bulbs 240 178 74%
Batons 24 14 58%
Downlighters 6 4.8 80%
Mobile phones 32 1.1 3%
Washing machines 1.2 0.8 67%
CCTV 8.4 3 36%
Source: Company, YES Sec – Research
45%
70%
45%
80%
65%
0%
25%
50%
75%
100%
Lighting (driver chip) TVs (open cell) WMs (motor,gearbox)
Mobiles (display,assembly)
Overall

For important information about YES Securities (India) Ltd. and other disclosures, refer to the end of this material. 14
Dixon Technologies (India) Ltd
Tirupati has become the third manufacturing hub after Noida and Dehradun
Manufacturing locations for DIXON – Dehradun, Noida and Tirupati
Source: Company, YES Sec – Research
SEGMENTAL ANALYSIS
Mobiles and TVs set to become the largest segments for the company Revenue contribution
FY14 FY15 FY16 FY17 FY18 FY19 FY20 FY21E FY22E FY23E FY24E FY25E
Lighting 28% 25% 31% 22% 27% 31% 26% 19% 13% 13% 12% 12%
Consumer Electronics 64% 65% 55% 34% 38% 40% 48% 43% 33% 31% 27% 25%
Washing Machine 8% 9% 9% 8% 9% 13% 9% 8% 6% 6% 5% 5%
Servicing 0% 2% 3% 3% 3% 1% 0% 0% 0% 0% 0% 0%
Mobiles 0% 0% 1% 33% 24% 12% 12% 24% 36% 41% 47% 50%
Camera 0% 0% 0% 0% 0% 4% 5% 3% 2% 2% 2% 2%
STB/Medical 0% 0% 0% 0% 0% 0% 0% 3% 10% 8% 7% 7% Source: Company, YES Sec – Research
While lighting and washing machines would still be important from a margin perspective EBITDA Contribution
FY14 FY15 FY16 FY17 FY18 FY19 FY20 FY21E FY22E FY23E FY24E FY25E
Lighting 33.6% 28.1% 37.7% 19.6% 41.9% 48.9% 43.8% 31.3% 23.8% 24.5% 24.0% 24.7%
Consumer Electronics 43.7% 41.8% 27.1% 27.4% 20.6% 18.5% 22.6% 19.8% 18.0% 17.5% 15.6% 14.5%
Washing Machine 20.4% 19.2% 23.8% 33.6% 27.4% 27.4% 20.7% 15.6% 14.2% 13.9% 12.4% 11.5%
Servicing 1.6% 11.0% 12.0% 13.5% 5.1% ‐1.3% 1.2% 0.9% 0.7% 0.6% 0.6% 0.5%
Mobiles 0.0% 0.0% ‐0.7% 5.5% 5.8% 5.5% 8.6% 24.7% 31.9% 33.7% 38.7% 40.4%
Camera 0.0% 0.0% 0.0% 0.0% ‐0.8% 0.9% 3.2% 1.1% 1.2% 1.2% 1.1% 1.1%
STB/Medical 0.0% 0.0% 0.0% 0.0% 0.0% 0.0% 0.0% 6.7% 10.0% 8.6% 7.7% 7.2%
Source: Company, YES Sec – Research
Consumer Electronics This segment accounts for 48% of the company’s overall revenues and consists manufacturing of LED TV and PCBs used in invertor ACs. Segment growth has been slower than its peers as large players preferred to import TV directly under the FTA agreements. The segment’s revenues received a major boost in FY20 led by the strong acceptance of Xiaomi brand TVs and the

For important information about YES Securities (India) Ltd. and other disclosures, refer to the end of this material. 15
Dixon Technologies (India) Ltd
government’s move to remove import duty on open cells from 5% earlier (60% of cost). Adding to the strong demand from Xiaomi, the company’s growth was also boosted by addition of new customers and commissioning of new SMT line for manufacturing PCBs for invertor ACs. In FY20, the segment registered 76% yoy growth largely led by LED TVs. PCB revenues grew 65.6% yoy to Rs1.3bn as the company ramped up production for its anchor customer Daikin.
Consumer electronics (TV) revenue and margin expectations
Source: Company, YES Sec – Research
Over the last one year, the company has added new customers in this segment as duty on open cell was removed and more restrictions were put on imports. With the addition of Samsung to its client list the company now has India’s top 2 players as its customers. New customers include Nokia, Toshiba, Hisense and private label of Flipkart apart from the anchor customer of Xiaomi and Samsung. To meet the rising demand from anchor customers, the company increased its manufacturing capacity from 3.6mn units to 4.4mn units in August 2020, accounting for 33% of the domestic demand. Demand in this segment would be further boosted by the Government’s move to include TVs in restricted list, as 25‐30% of TVs were imported from China and Vietnam which would not need DGFT approval. This would reduce imports and increase demand for domestic products. With the strong orderbook from anchor customers, at the end of Q1 FY20 the company is further increasing its capacity to 5.5mn units, accounting for 40% of domestic demand. In addition to meeting the strong domestic demand the company is also in talks with major players to start exporting. We expect this segment to witness revenue CAGR of 25% over FY20‐23E led by shift to domestic production and higher orderbook from Samsung.
Samsung’s contribution to DIXON’s TV revenues should increase going ahead as the company shifts its manufacturing base from Vietnam due to the new licensing regime which will reduce the dependence on Xiaomi from 70% currently to ~40% by FY22. Xiaomi continues to do well in the TV segment given its strong online presence despite the anti‐China sentiment.
DIXON is the largest integrated TV manufacturer in India. The company provides end to end solution including auto insertion, SMT and LCM module assembly. The company also has backward integration capability into LED panel assembly with clean room. Further capacity of SMT lines have been increased to 1.8mn/annum from 1mn earlier. The company is also building up its R&D and offering smart solutions to customers. Share of ODM business in FY20 stood at 6% (vs 9% in FY19) as the share of large OEM anchor customer increased sharply. The company would be offering its ODM products under its smart solutions to large brands. Shift to large TV sizes and expansion of PCB lines are aiding margin improvements. Increase in share of ODM solutions and improvement in backward integration would lead to 60bps margin expansion in this segment from 2.4% in FY20 to 2.7% in FY23E.
Home appliances This segment comprises of semi‐automatic washing machines and accounts for 9% of overall revenues. The company currently has 140 models from 6Kg to 10Kg & has the largest capacity in India at 1.2mn/annum which is almost 28% of the domestic market of semi‐automatic washing
6,983 7,756 7,701 8,445 10,735 11,938
20,952 23,916
33,917
40,600 44,730
49,283
1.6% 1.7%
2.1%
3.0%
2.2% 2.1%
2.4% 2.4%2.6% 2.7% 2.7% 2.7%
0.0%
0.5%
1.0%
1.5%
2.0%
2.5%
3.0%
3.5%
0
10,000
20,000
30,000
40,000
50,000
60,000
FY14 FY15 FY16 FY17 FY18 FY19 FY20 FY21E FY22E FY23E FY24E FY25E
Consumer Electronics EBITDA Margin

For important information about YES Securities (India) Ltd. and other disclosures, refer to the end of this material. 16
Dixon Technologies (India) Ltd
machines. Of the overall washing machine market, semi‐automatic WM accounts for 60% of the total industry volumes. In this segment, majority of the companies prefer to outsource production due to no technological edge. The focus is largely on reduction of costs for the SWM machines. Leveraging the strong R&D capabilities in the segment, the company is able to design and produce technologically advanced washing machine for its customers. DIXON derives 100% revenues from Washing Machines on an ODM basis and offers the largest bouquet of ODM models in SWM segment. Samsung remains the largest customer with a share of 45%.
Washing machine revenue and margin expectations
Source: Company, YES Sec – Research
The company has majority of the brands present in the SWM category as its customers. With Panasonic as its anchor customer from FY14, the company has added Samsung as a major brand in addition to the small players like Godrej, Llyods, Haier, MarQ from Flipkart, Micromax over the last five years. The company has recently added Voltas Beko and Reliance Retail (Kelvinator + BPL brands) as its new customer. To meet the strong orderbook from its anchor customers and addition of new large players the company has expanded its capacity from 1.2mn units to 1.45mn units at its existing plants. In this segment, the company would grow faster than the market on the back of addition of new players to its portfolio.
To cater to the rising demand of Fully automatic washing machine (FAWM) the company is setting up a plant in Tirupati for a top loading WM with a capacity of 0.6mn units/annum for 40‐45 variants. The new plant is expected to be ready by the end of Q3 FY21. The company has already closed an agreement with a large brand and ~3/4th of the capacity is already tied up.
We expect revenue growth to be muted in FY21 due to loss of production during Q1 and the new top loading WM plant would start contributing from Q4 FY21. From FY22, revenue growth would accelerate with both greenfield and brownfield capacities functional for the full year. Revenue growth is expected to remain high at 40% in FY22 and 25% in FY23. Margins in this segment are high as the company completely operates on an ODM basis. With improvement in scale and commissioning of high margin TLWM, we expect margins to improve from 9.9% in FY19 to 11.5% in FY23.
The company has also decided to foray into the refrigerator segment with a capacity of 0.8mn at a capex of Rs 1bn with a payback period of 24‐30 months. Work is expected to commence by 4QFy21 and production is expected to begin from FY23.
Lighting DIXON has become a significant player in the domestic lighting market. The company caters to majority of the large players in the lighting space. The company is the largest producer of LED bulbs in the domestic market and is amongst the top 5 players in the global market. With a capacity of 20mn units per month, it accounts for ~45% of the total domestic demand. The company also has 1.5mn units of batons and 0.6mn units of downlighters capacity. The company has registered 28% revenue CAGR over FY16‐20 led by huge capacity expansion and addition of new customers. The company has transformed itself into a lower cost producer in the domestic
849 1,067 1,306 1,880
2,503
3,731 3,963 4,324
6,054
7,567 8,324
9,156
6.3% 5.8%
10.7%
16.3%
12.3%
9.9%
11.6%10.5%
11.5% 11.5% 11.5% 11.5%
0.0%
4.5%
9.0%
13.5%
18.0%
0
2,000
4,000
6,000
8,000
10,000
FY14 FY15 FY16 FY17 FY18 FY19 FY20 FY21E FY22E FY23E FY24E FY25E
Washing Machine EBITDA Margin
For important information about YES Securities (India) Ltd. and other disclosures, refer to the end of this material. 17
Dixon Technologies (India) Ltd
market and competes with low cost manufacturing capacities of China. The company has strong R&D capabilities enabling it to develop new lost cost innovative products & has backward integration capabilities in sheet metal, plastic moulding & wound components. Stringent quality norms have tilted the balance towards large EMS players. Share of ODM business in lighting increased significantly to 87% in FY20 from 71% in FY19.
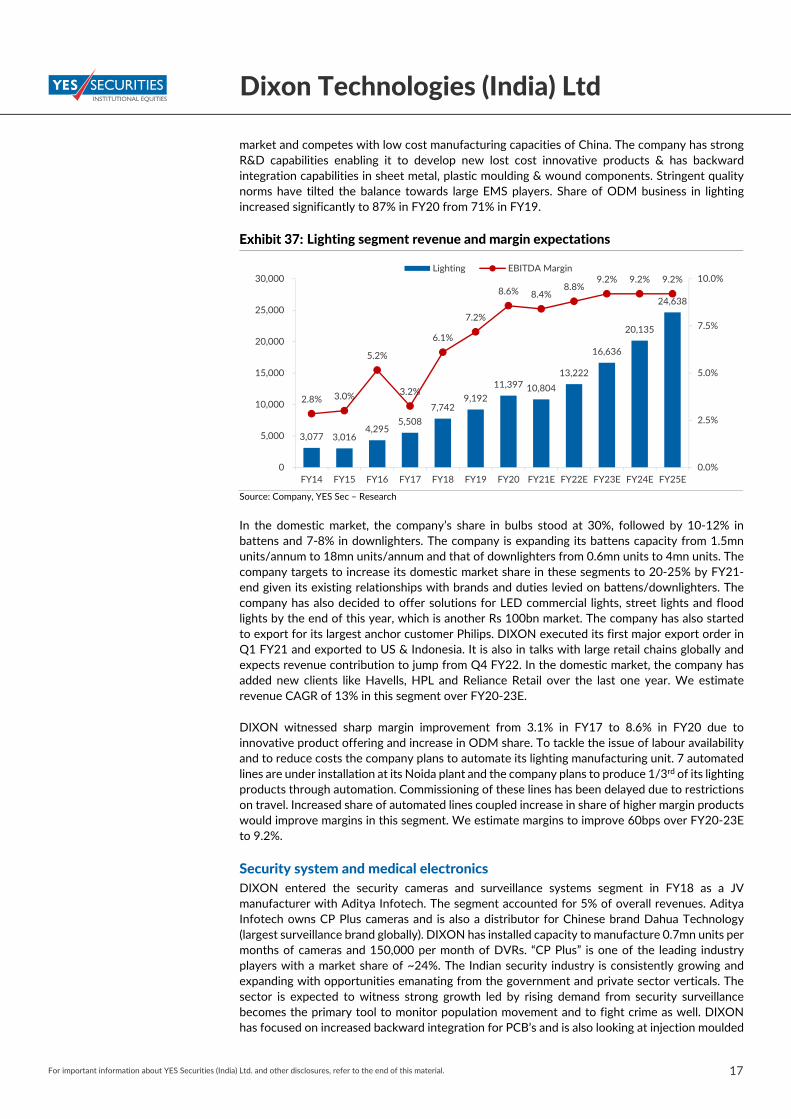
Lighting segment revenue and margin expectations
Source: Company, YES Sec – Research
In the domestic market, the company’s share in bulbs stood at 30%, followed by 10‐12% in battens and 7‐8% in downlighters. The company is expanding its battens capacity from 1.5mn units/annum to 18mn units/annum and that of downlighters from 0.6mn units to 4mn units. The company targets to increase its domestic market share in these segments to 20‐25% by FY21‐end given its existing relationships with brands and duties levied on battens/downlighters. The company has also decided to offer solutions for LED commercial lights, street lights and flood lights by the end of this year, which is another Rs 100bn market. The company has also started to export for its largest anchor customer Philips. DIXON executed its first major export order in Q1 FY21 and exported to US & Indonesia. It is also in talks with large retail chains globally and expects revenue contribution to jump from Q4 FY22. In the domestic market, the company has added new clients like Havells, HPL and Reliance Retail over the last one year. We estimate revenue CAGR of 13% in this segment over FY20‐23E.
DIXON witnessed sharp margin improvement from 3.1% in FY17 to 8.6% in FY20 due to innovative product offering and increase in ODM share. To tackle the issue of labour availability and to reduce costs the company plans to automate its lighting manufacturing unit. 7 automated lines are under installation at its Noida plant and the company plans to produce 1/3rd of its lighting products through automation. Commissioning of these lines has been delayed due to restrictions on travel. Increased share of automated lines coupled increase in share of higher margin products would improve margins in this segment. We estimate margins to improve 60bps over FY20‐23E to 9.2%.
Security system and medical electronics DIXON entered the security cameras and surveillance systems segment in FY18 as a JV manufacturer with Aditya Infotech. The segment accounted for 5% of overall revenues. Aditya Infotech owns CP Plus cameras and is also a distributor for Chinese brand Dahua Technology (largest surveillance brand globally). DIXON has installed capacity to manufacture 0.7mn units per months of cameras and 150,000 per month of DVRs. “CP Plus” is one of the leading industry players with a market share of ~24%. The Indian security industry is consistently growing and expanding with opportunities emanating from the government and private sector verticals. The sector is expected to witness strong growth led by rising demand from security surveillance becomes the primary tool to monitor population movement and to fight crime as well. DIXON has focused on increased backward integration for PCB’s and is also looking at injection moulded
3,077 3,016 4,295
5,508
7,742 9,192
11,397 10,804
13,222
16,636
20,135
24,638
2.8% 3.0%
5.2%
3.2%
6.1%
7.2%
8.6% 8.4%8.8%
9.2% 9.2% 9.2%
0.0%
2.5%
5.0%
7.5%
10.0%
0
5,000
10,000
15,000
20,000
25,000
30,000
FY14 FY15 FY16 FY17 FY18 FY19 FY20 FY21E FY22E FY23E FY24E FY25E
Lighting EBITDA Margin

For important information about YES Securities (India) Ltd. and other disclosures, refer to the end of this material. 18
Dixon Technologies (India) Ltd
components. Improvement in utilization coupled with increase in backward integration would aid margin expansion over the next three years.
During the last two quarters utilization levels have been weak due to lower demand from both, B2B and B2C segments. The company is utilizing this capacity for the manufacture of medical equipment. DIXON has entered into a contract with Bangalore‐based Molbio Diagnostics to manufacture a disruptive RT‐PCR COVID‐19 testing machine. The company has received an order of Rs300mn to manufacture 1,000 Qattros, a viral testing machine that can bring down COVID‐19 testing time to just 1 hour from 24‐36 hours at present. Quattro is part of Molbio’s TrueNat RT‐PCR solution that can be used to detect dozens of different infectious diseases, including COVID‐19, and has several advantages over conventional RT‐PCR models. There is a strong demand for these machines from Government hospitals, private diagnostic laboratories and global markets, although exports are banned currently. The management expects this segment to grow exponentially over the next two years and would be growth driver over the next two years.
While security systems demand could remain weak for the next couple of years given its discretionary nature, medical equipment could be a Rs 1bn annual business for the company. Margins too would improve given increase in share of higher margin (20% plus) medical electronics business.
Reverse logistics This business segment of the company involves repair & refurbishment of set top boxes, LED TV panels & mobile phones. It is one of the few companies to have Panel Repairing and LED TV refurbishment facilities. This business is more strategic in nature as it enhances the stickiness with the customers & provide them end‐to‐end solution. DIXON’s reverse logistics is catered to by its Noida III facility and 17 other service centres across the country. The segment performance is expected to remain subdued as refurbishing business in India has not taken off as was expected.
Set Top box This is the new line of business for DIXON and will start contributing significantly to the company revenues and profitability starting H2 FY21. The company is manufacturing set top boxes at its mobile plant which witnessed lower utilization due to lower offtake from Gionee and Karbonn. The company currently has order book of 0.5mn units and the business has potential to grow to 800K‐1mn units per month of production, translating into ~Rs10bn of revenue potential in FY22. The current order is from Jio and the company is expected orders to increase as it has onboarded new clients like Siti Cable, Dish TV and a leading cable operator in East India over the last six months. Execution for the Jio order is expected to start commercial production from Q2 FY21 and would ramp up in H2. The company has also started to manufacture hybrid set top boxes and that would be major growth driver going forward. Margins in this business would be similar to that of mobile phones and would be around 4%.

For important information about YES Securities (India) Ltd. and other disclosures, refer to the end of this material. 19
Dixon Technologies (India) Ltd
Set top boxes and medical electronics revenue and margin expectations
Source: Company, YES Sec – Research
Mobile phones This segment was a non‐starter for the company till FY19 as majority of its customers had small market share and import component remained high. The company’s 50:50 JV with Padget Electronics was not able to rampup due to sharp decline in sales of mobiles for brands like Gionee and Karbonn. DIXON, at the beginning of FY20 bought out its JV partner’s stake at Rs270mn and converted it into a wholly owned subsidiary. With lower than expected penetration in the mobile EMS market the company focused on manufacturing feature phones. In addition to this, the company expanded its PCBA backward integration capacity to 350K per month for smart phones and 700k per month for feature phones. During Q1 FY20, the company managed to acquire Samsung, the 2nd largest player, for the manufacture of feature phones for domestic and export markets. To meet the strong orderbook from its anchor customer, DIXON setup its mobile manufacturing plant with capacity to 2.3mn units per month. Commercial production from the new facility started in November 2019 and the company achieved its rated capacity by January 2020. The company also added LG, Foxconn and Samsung during Q4 FY20 for manufacturing of smartphones. A combination of above aided the company reporting revenue growth of 51.3% yoy which accounted for 12.2% of overall revenues. The company at the end of FY20 had ~32mn units of combined annual production capacity. The share of company’s production capacity of the domestic market for feature phones stood at 25% and that for smartphones was quite minimal.
Mobile segment revenue and margin expectations
Source: Company, YES Sec – Research
This segment would largely remain OEM based as technology would be largely provided by the large OEMs. Import component in this segment is quite high and value addition by domestic
1,800
9,880 10,868
11,955
13,161 10.8%
5.0% 5.0% 5.0% 5.0%
0.0%
2.0%
4.0%
6.0%
8.0%
10.0%
12.0%
0
2,000
4,000
6,000
8,000
10,000
12,000
14,000
FY21E FY22E FY23E FY24E FY25E
STB/Medical EBITDA Margin
200 8,107 6,698
3,551 5,369
13,362
37,239
53,332
79,577
101,014
‐2.2%
0.6%1.0%
2.1%
3.6%
5.4%
4.2% 3.9% 3.8% 3.7%
‐3.0%
‐2.0%
‐1.0%
0.0%
1.0%
2.0%
3.0%
4.0%
5.0%
6.0%
0
20,000
40,000
60,000
80,000
100,000
120,000
FY16 FY17 FY18 FY19 FY20 FY21E FY22E FY23E FY24E FY25E
Mobiles EBITDA Margin

For important information about YES Securities (India) Ltd. and other disclosures, refer to the end of this material. 20
Dixon Technologies (India) Ltd
players is low. Margins in this segment are expected to remain low in the range of 3‐3.5%. In FY21, this segment is expected to register strong revenue growth led by full year contribution from feature phone segment and addition of LG and Samsung in the smartphone category. The company has increased its manufacturing capacity to ~40mn units per annum to meet the rising demand from LG and other customers. Growth in this segment would be further boosted if the company manages to obtain applications under the government’s PLI scheme.
FINANCIAL ANALYSIS
Expect 35% revenue, 33% EBITDA and 39% PAT CAGR over FY20‐25E Over the past five years from FY15‐20, DIXON has posted industry leading revenue CAGR of 30% given a combination of solid execution ramp‐up and industry tailwinds. We expect those tailwinds to increase further and led by the company’s solid positioning and execution to drive a 35% CAGR In revenue over FY20‐25E. The topline growth is expected to be driven by mobile (80% CAGR led by one PLI scheme approval), TVs (19% CAGR), washing machines and new segments like STBs and medical electronics. Along with operating leverage, rising capacity utilization, backward integration, cost optimization and increasing ODM share, margins ex‐mobile should increase as well. Overall, assuming around 3.3% margins for the mobile PLI business, margins are expected to remain in the 4.5‐5% band through FY21‐25. This translates into an 33% EBITDA CAGR and 39% PAT CAGR over FY20‐25E.
Next three years to witness a solid 44% revenue and 47% EBITDA CAGR
Source: Company, YES Sec – Research
Healthy return ratios to continue given strong asset turns DIXON enjoys a high fixed asset turnover of 15x in FY20, up from 12x in FY15 led by an increase in the mobile phone business which is predominantly OEM. While the company has grown revenue at 30% CAGR over FY15‐20, gross block has grown at a CAGR of 26%. We expect the turnover to improve further by FY25E led by a significant increase in share of the mobile business, in case the mobile PLI license gets approved.
28,416 29,844
44,001 55,910
102,361
131,449
4.0%
4.5%
5.1% 5.2% 4.8%4.8%
0.0%
2.0%
4.0%
6.0%
0
35,000
70,000
105,000
140,000
FY18 FY19 FY20 FY21E FY22E FY23E
Revenues EBITDA %

For important information about YES Securities (India) Ltd. and other disclosures, refer to the end of this material. 21
Dixon Technologies (India) Ltd
Asset turnover set to increase further given addition to mobile OEM business
Source: Company, YES Sec – Research
Return ratio profile to get even better helped by the PLI scheme
Source: Company, YES Sec – Research
DIXON has generated positive operating cash flow of Rs 4bn and free cash flow of Rs 819mn over the past five years. We expect the company to generate Rs 16.6bn of OCF and Rs 9.3bn of FCF over the next five years driven by the significant increase in scale of operations.
While the margins appear low around 4.5‐5%, it is not the correct indicator of profitability as the OEM business earns only a conversion charge. Therefore, return ratios is a relevant indicator where DIXON has seen average ROEs and ROCEs of 26% and 32% over the past five years. We expect ROE and ROCE to increase to an average of 32% and 42% over FY21‐25E.
Working capital cycle to remain lean The net working capital cycle of the company has improved from 6 days in FY15 to a negative 5 days in FY20 mainly due to the lower working capital requirement in the OEM business. The company is focused on bringing down the inventory and debtor days further especially in lighting and washing machines led by improved operational efficiency, as both those ODM businesses were in a ramp‐up phase. Over FY20‐25E, we expect the WC cycle to remain at a negative 7 days despite a 35% revenue CAGR and new product development investments. Leverage position is expected to remain comfortable with sufficient internal accruals and possibilities of fund raising.
17
13 15 15
23 25
9 7 8 8
11 10
31
22 25
23
26
20
0
5
10
15
20
25
30
35
FY18 FY19 FY20 FY21E FY22E FY23E
Fixed Asset Turnover Capital Employed Turnover WC Turnover
19.3 18.3
26.2 27.7
35.9 34.2
28.3 27.0
33.5 36.4
48.1 45.3
0.0
12.5
25.0
37.5
50.0
FY18 FY19 FY20 FY21E FY22E FY23E
ROE (%) ROCE (%)

For important information about YES Securities (India) Ltd. and other disclosures, refer to the end of this material. 22
Dixon Technologies (India) Ltd
Expect working capital cycle to stabilize around current levels
Source: Company, YES Sec – Research
Manageable capex requirements While capex ex‐PLI should remain in the range of Rs 850‐900mn annually, in case the company gets one or two mobile PLI licenses, capex requirement annually would increase by Rs 500mn per annum per license. The company has already taken an enabling provision to raise Rs 2bn by way of either debt or equity which can be used in case it gets both licenses. Given it sharp focus on return ratios, we do not expect the company to take up any new ventures with return ratios below 25‐30% threshold.
Cash generation has picked up sharply from FY20 which should pick up further
Source: Company, YES Sec – Research
41 50
41 41 37 37 38
63
43 45 43 45
76
103
89 93 90 89
4 10
(5) (7) (10) (7)
(30)
0
30
60
90
120
FY18 FY19 FY20 FY21E FY22E FY23E
Inventory days Receivable days Payable days NWC days
(78)
(837)
1,388
708 563
1,230
680
(31)
2,403 2,073 1,978
2,695
0.0
0.3
‐0.0
‐0.1 ‐0.1 ‐0.1
‐0.2
‐0.1
‐
0.1
0.2
0.3
(1,500)
0
1,500
3,000
FY18 FY19 FY20 FY21E FY22E FY23E
FCF OCF Net debt/equity

For important information about YES Securities (India) Ltd. and other disclosures, refer to the end of this material. 23
Dixon Technologies (India) Ltd
OUTLOOK AND VALUATION DIXON is a proven growth story with a strong track record of growth and market share gains. With healthy return ratios, lean working capital cycle, healthy cash flows and strong fixed asset turnover, DIXON has consistently delivered across financial metrics. We initiate coverage with a BUY rating and a target price of Rs 11,056 based on 32x FY23E earnings factoring a 44% revenue and 49% PAT CAGR over FY20‐23E. Return ratios are likely to improve further to 34% ROE and 45% ROCE in FY23E from 26%/34% in FY20. We are currently factoring in one mobile PLI license approval in our estimates out of the two that the company has bid for. In case the company gets both licenses, our FY23 EPS would increase by Rs 85 and therefore, out target price would move up to Rs 13,763. In the rarest case that it does not get any license, our FY23 EPS would come down by Rs 85 and target price would fall to Rs 8,349. Our DCF assumptions also indicate a fair value of Rs 11,445 for the stock discounting next 15 years of cash flows at 10.2% and a terminal growth rate of 4%.
Given its successful track record till now, we are ascribing a strong multiple to the company’s expected earnings which factors in that DIXON will be able to maintain and improve its relations with marquee clients and keep bringing in new MNC brands which do not have manufacturing presence in India. In addition, continued strengthening of management bandwidth given entry into multiple new categories and capital allocation strategy would be key monitorables from a valuation perspective.
Currently trading at 47x one‐yr fwd P/E And 28x one‐yr fwd EV/EBITDA
Source: Bloomberg, YES Sec – Research Source: Bloomberg, YES Sec – Research
0
30
60
90
Sep‐17
Nov‐17
Jan‐18
Mar‐18
May‐18
Jul‐18
Sep‐18
Nov‐18
Jan‐19
Mar‐19
May‐19
Jul‐19
Sep‐19
Nov‐19
Jan‐20
Mar‐20
May‐20
Jul‐20
Sep‐20
1 Yr Fwd PE Avg PE
0
15
30
45
Sep‐17
Nov‐17
Jan‐18
Mar‐18
May‐18
Jul‐18
Sep‐18
Nov‐18
Jan‐19
Mar‐19
May‐19
Jul‐19
Sep‐19
Nov‐19
Jan‐20
Mar‐20
May‐20
Jul‐20
Sep‐20
EV/EBITDA Avg EV/EBITDA

For important information about YES Securities (India) Ltd. and other disclosures, refer to the end of this material. 24
Dixon Technologies (India) Ltd
Peer comparison
Company Mktcp (INR bn)
Revenue (INR bn)
P/E (x) EV/EBITDA (x) ROE (%)
FY21E FY22E FY23E FY21E FY22E FY23E FY21E FY22E FY23E FY21E FY22E FY23E
Dixon Technologies
109 56.0 102.3 131.4 63.1 35.8 27.2 37.1 21.9 17.0 27.7 35.9 34.2
Amber Enterprises
68 34.5 47.1 55.7 74.1 32.2 26.5 28.6 17.5 14.8 7.7 15.2 16.1
Havells 426 86.0 104.8 120.9 75.6 50.3 43.2 46.3 32.5 28.3 13.1 17.6 18.5
Whirpool India
283 54.0 67.8 76.1 70.8 46.0 39.8 48.1 32.1 28.6 14.7 19.7 20.5
Voltas 227 66.5 84.6 98.1 50.8 33.5 28.9 45.2 28.8 24.0 10.1 14.0 14.7
Johnson Controls
63 19.2 23.9 NA 90.1 46.4 NA 42.3 27.1 NA 11.5 16.7 NA
IFB Industries
27 24.0 30.4 35.5 NA 42.7 28.7 23.1 12.9 10.4 (2.2) 9.8 13.1
Blue Star 65 45.1 55.0 62.5 78.6 36.5 28.6 30.5 19.3 16.2 10.5 21.2 24.9
Source: Bloomberg, YES Sec – Research
DCF assumptions Assumptions WACC 10.2% Terminal growth rate of cashflow 4.0% Terminal value (Rs mn) 252,485 PV of terminal value (Rs mn) 71,459 Enterprise value (Rs mn) 58,249 TV as % of Total 55% Net debt (Rs mn) 87 Equity value (Rs mn) 129,621 Equity Value per share (Rs) 11,445
Source: YES Sec – Research
Key risks Client concentration as 4 large clients Xiaomi, Samsung, Panasonic and Phillips contribute
about 50‐55% of revenue, although we believe that would be manageable given DIXON’s total contribution to the large MNCs is not much and export opportunities are also opening up.
Risk of technology obsolescence is always a risk in EMS manufacturing, but the risk is mitigated as most of the facilities are fungible across verticals and DIXON is also aggressively moving towards higher value ‐added items across segments.
While the mobile PLI scheme can be completely transformational for the company, execution remains a risk as the company has not been very successful in that vertical till now.
Given the high import dependence on China, any significant supply disruptions due to any government actions or otherwise remains a key risk, although the company is trying to increase the proportion of local sourcing.
An unexpected demand in consumer demand for electronics can impact the capacity utilization and growth outlook, while the company is trying to open up export markets to reduce that risk.
An unexpected increase in competition from global contract manufacturers like Foxconn and Holitech remains a risk, although OEMs preference to keep a diversified vendor base should help DIXON.

For important information about YES Securities (India) Ltd. and other disclosures, refer to the end of this material. 25
Dixon Technologies (India) Ltd
FINANCIALS
Balance sheet
Y/e 31 Mar (Rs mn) FY20 FY21E FY22E FY23E FY24E FY25E
Equity capital 116 116 116 116 116 116
Reserves 5,298 6,928 9,731 13,424 18,098 23,838
Net worth 5,413 7,044 9,847 13,539 18,214 23,953
Debt 828 528 828 828 828 828
Other non current liabilities
894 896 907 913 922 929
Deferred tax liab (net) 150 150 150 150 150 150
Long term Provision 65 86 135 167 212 254
Total liabilities 7,350 8,704 11,867 15,598 20,326 26,115
Fixed Asset 3,335 4,211 5,010 5,725 6,353 6,888
Other Non‐current Assets
1,176 1,339 1,626 1,805 2,029 2,233
Net Working Capital 1,526 1,664 2,914 4,729 5,919 7,040
Inventories 4,978 6,280 10,376 13,325 16,994 20,349
Sundry debtors 5,151 6,893 12,059 16,206 20,668 24,749
Other current assets
1,018
1,289
2,344
3,006
3,828
4,580
Sundry creditors 9,391 12,508 21,343 27,140 34,722 41,624
Other current liabilities 176 223 409 525 669 802
Provision 56 67 114 143 179 212
Cash & equivalents 1,314 1,490 2,317 3,339 6,026 9,955
Total Assets 7,350 8,704 11,867 15,598 20,326 26,115
Income statement
Y/e 31 Mar (Rs m) FY20 FY21E FY22E FY23E FY24E FY25E
Revenue 44,001 55,910 102,361 131,449 167,639 200,738
Operating profit 2,231 2,902 4,888 6,254 7,728 9,164
Depreciation 365 488 617 750 887 1,029
Interest expense 350 211 331 331 331 331
Other income 52 100 115 169 254 500
Profit before tax 1,568 2,303 4,055 5,342 6,763 8,303
Taxes 363 580 1,021 1,345 1,702 2,090
Adj. PAT 1,205 1,723 3,034 3,998 5,061 6,213
Exceptional loss ‐ ‐ ‐ ‐ ‐ ‐
Net profit 1,205 1,723 3,034 3,998 5,061 6,213

For important information about YES Securities (India) Ltd. and other disclosures, refer to the end of this material. 26
Dixon Technologies (India) Ltd
Cash flow statement
Y/e 31 Mar (Rs mn) FY20 FY21E FY22E FY23E FY24E FY25E
PBIT 1,917 2,514 4,386 5,673 7,094 8,635
Depreciation 365 488 617 750 887 1,029
Tax paid (363) (580) (1,021) (1,345) (1,702) (2,090)
Working capital ∆ 659 (138) (1,251) (1,814) (1,190) (1,120)
Other operating items
Operating cashflow 2,579 2,285 2,731 3,264 5,089 6,453
Capital expenditure (1,103) (1,365) (1,415) (1,465) (1,515) (1,565)
Free cash flow 1,477 920 1,316 1,799 3,574 4,888
Equity raised 510 ‐ 0 (0) (0) 0
Investments ‐ ‐ ‐ ‐ ‐ ‐
Debt financing/disposal (584) (300) 300 ‐ ‐ ‐
Interest Paid (350) (211) (331) (331) (331) (331)
Dividends paid (83) (93) (231) (305) (386) (474)
Other items (224) (140) (226) (142) (169) (155)
Net ∆ in cash 745 176 827 1,021 2,687 3,929
Du‐pont analysis
Y/e 31 Mar (Rs mn) FY20 FY21E FY22E FY23E FY24E FY25E
Tax burden (x) 0.77 0.75 0.75 0.75 0.75 0.75
Interest burden (x) 0.82 0.92 0.92 0.94 0.95 0.96
EBIT margin (x) 0.04 0.04 0.04 0.04 0.04 0.04
Asset turnover (x) 2.76 2.91 3.71 3.41 3.38 3.22
Financial leverage (x) 3.47 3.09 3.27 3.30 3.13 2.96
RoE (%) 26.2 27.7 35.9 34.2 31.9 29.5

For important information about YES Securities (India) Ltd. and other disclosures, refer to the end of this material. 27
Dixon Technologies (India) Ltd
Ratio analysis
Y/e 31 Mar FY20 FY21E FY22E FY23E FY24E FY25E
Growth matrix (%)
Revenue growth 47 27 83 28 28 20
Op profit growth 65 30 68 28 24 19
EBIT growth 61 31 74 29 25 22
Net profit growth 90 43 76 32 27 23
Profitability ratios (%)
OPM 5.1 5.2 4.8 4.8 4.6 4.6
EBIT margin 4.4 4.5 4.3 4.3 4.2 4.3
Net profit margin 2.7 3.1 3.0 3.0 3.0 3.1
RoCE 33.5 36.4 48.1 45.3 42.5 39.4
RoNW 26.2 27.7 35.9 34.2 31.9 29.5
RoA 7.6 9.0 11.0 10.4 10.2 10.0
Per share ratios
EPS 104.1 148.9 262.2 345.5 437.4 537.0
Dividend per share 6.0 8.0 20.0 26.4 33.4 41.0
Cash EPS 135.7 191.1 315.5 410.3 514.1 626.0
Book value per share 467.9 608.8 851.1 1,170.2 1,574.2 2,070.3
Payout (%)
Dividend payout 7 5 8 8 8 8
Tax payout 23 25 25 25 25 25
Liquidity ratios
Debtor days 43 45 43 45 45 45
Inventory days 41 41 37 37 37 37
Creditor days 78 82 76 75 76 76
Recommendation Tracker
7,000
8,000
9,000
10,000
11,000
12,000
13,000
100
2,100
4,100
6,100
8,100
10,100
12,100
Sep‐19 Oct‐19 Nov‐19 Dec‐19 Jan‐20 Feb‐20 Mar‐20 Apr‐20 May‐20 Jun‐20 Jul‐20 Aug‐20 Sep‐20
DIXON Reco Nifty (RHS)

For important information about YES Securities (India) Ltd. and other disclosures, refer to the end of this material. 28
Dixon Technologies (India) Ltd
DISCLAIMER
Investments in securities market are subject to market risks, read all the related documents carefully before investing.
The information and opinions in this report have been prepared by YSL and are subject to change without any notice. The report and information contained herein are strictly confidential and meant solely for the intended recipient and may not be altered in any way, transmitted to, copied or redistributed, in part or in whole, to any other person or to the media or reproduced in any form, without prior written consent of YSL.
The information and opinions contained in the research report have been compiled or arrived at from sources believed to be reliable and have not been independently verified and no guarantee, representation of warranty, express or implied, is made as to their accuracy, completeness, authenticity or validity. No information or opinions expressed constitute an offer, or an invitation to make an offer, to buy or sell any securities or any derivative instruments related to such securities. Investments in securities are subject to market risk. The value and return on investment may vary because of changes in interest rates, foreign exchange rates or any other reason. Investors should note that each security's price or value may rise or fall and, accordingly, investors may even receive amounts which are less than originally invested. The investor is advised to take into consideration all risk factors including their own financial condition, suitability to risk return profile and the like, and take independent professional and/or tax advice before investing. Opinions expressed are our current opinions as of the date appearing on this report. Investor should understand that statements regarding future prospects may not materialize and are of general nature which may not be specifically suitable to any particular investor. Past performance may not necessarily be an indicator of future performance. Actual results may differ materially from those set forth in projections.
Technical Analysis reports focus on studying the price movement and trading turnover charts of securities or its derivatives, as opposed to focussing on a company’s fundamentals and opinions, as such, may not match with reports published on a company’s fundamentals.
YSL, its research analysts, directors, officers, employees and associates accept no liabilities for any loss or damage of any kind arising out of the use of this report. This report is not directed or intended for distribution to, or use by, any person or entity who is a citizen or resident of or located in any locality, state, country or other jurisdiction, where such distribution, publication, availability or use would be contrary to law, regulation or which would subject YSL and associates to any registration or licensing requirement within such jurisdiction. The securities described herein may or may not be eligible for sale in all jurisdictions or to certain category of investors. Persons in whose possession this document may come are required to inform themselves of and to observe such restriction.
DISCLOSURE OF INTEREST
Name of the Research Analyst : Himanshu Nayyar, Harish Advani
The analyst hereby certifies that opinion expressed in this research report accurately reflect his or her personal opinion about the subject securities and no part of his or her compensation was, is or will be directly or indirectly related to the specific recommendation and opinion expressed in this research report.
Sr. No. Particulars Yes/No
1 Research Analyst or his/her relative’s or YSL’s financial interest in the subject company(ies) No
2
Research Analyst or his/her relative or YSL’s actual/beneficial ownership of 1% or more securities of the subject company(ies) at the end of the month immediately preceding the date of publication of the Research Report
No
3 Research Analyst or his/her relative or YSL has any other material conflict of interest at the time of publication of the Research Report
No
4 Research Analyst has served as an officer, director or employee of the subject company(ies) No
5 YSL has received any compensation from the subject company in the past twelve months No
6 YSL has received any compensation for investment banking or merchant banking or brokerage services from the subject company in the past twelve months
No
7
YSL has received any compensation for products or services other than investment banking or merchant banking or brokerage services from the subject company in the past twelve months
No
8 YSL has received any compensation or other benefits from the subject company or third party in connection with the research report
No
9 YSL has managed or co‐managed public offering of securities for the subject company in the past twelve months
No
10 Research Analyst or YSL has been engaged in market making activity for the subject company(ies) No
Since YSL and its associates are engaged in various businesses in the financial services industry, they may have financial interest or may have received compensation for investment banking or merchant banking or brokerage services or for any other product or services of whatsoever nature from the subject company(ies) in the past twelve months or associates of YSL may have managed or co‐managed public offering of securities in the past twelve months of the subject company(ies) whose securities are discussed herein.
Associates of YSL may have actual/beneficial ownership of 1% or more and/or other material conflict of interest in the securities discussed herein.
YES Securities (India) Limited
Registered Office: Unit No. 602 A, 6th Floor, Tower 1 & 2, Indiabulls Finance Centre, Senapati Bapat Marg, Elphinstone Road,
Mumbai – 400013, Maharashtra, India.
Tel: +91‐22‐71123123 | Email: [email protected] | Website: www.yesinvest.in
Registration Nos.: CIN: U74992MH2013PLC240971 | SEBI Single
Registration No.: NSE, BSE, MCX & NCDEX : INZ000185632 | Member Code: BSE – 6538, NSE – 14914, MCX – 56355 & NCDEX ‐ 1289 | MERCHANT BANKER: INM000012227 | RESEARCH ANALYST: INH000002376 | INVESTMENT ADVISER: INA000007331 |
AMFI ARN Code – 94338
Details of Compliance Officer: Name: Vaibhav Purohit, Email id: [email protected], Contact No‐+91‐22‐33479208

For important information about YES Securities (India) Ltd. and other disclosures, refer to the end of this material.
RECOMMENDATION PARAMETERS FOR FUNDAMENTAL REPORTS
Analysts assign ratings to the stocks according to the expected upside/downside relative to the current market price and the estimated target price. Depending on the expected returns, the recommendations are categorized as mentioned below. The performance horizon is 12 to 18 months unless specified and the target price is defined as the analysts’ valuation for a stock. No benchmark is applicable to the ratings mentioned in this report.
BUY: Potential return >15% over 12 months
ADD: Potential return +5% to +15% over 12 months
REDUCE: Potential return ‐10% to +5% over 12 months
SELL: Potential return <‐10% over 12 months
NOT RATED / UNDER REVIEW
ABOUT YES SECURITIES (INDIA) LIMITED
YES Securities (India) Limited (‘‘YSL’’) is a wholly owned subsidiary of YES BANK LIMITED. YSL is a SEBI registered stock broker holding membership of NSE, BSE, MCX & NCDEX. YSL is also a SEBI registered Category I Merchant Banker, Investment Adviser and a Research Analyst. YSL offers, inter alia, trading/investment in equity and other financial products along with various value added services. We hereby declare that there are no disciplinary actions taken against YSL by SEBI/Stock Exchanges.