Coverage Is Not Strongly Correlated with Test Suite … Is Not Strongly Correlated with Test Suite...
11
Coverage Is Not Strongly Correlated with Test Suite Effectiveness Laura Inozemtseva and Reid Holmes School of Computer Science University of Waterloo Waterloo, ON, Canada {lminozem,rtholmes}@uwaterloo.ca ABSTRACT The coverage of a test suite is often used as a proxy for its ability to detect faults. However, previous studies that investigated the correlation between code coverage and test suite effectiveness have failed to reach a consensus about the nature and strength of the relationship between these test suite characteristics. Moreover, many of the studies were done with small or synthetic programs, making it unclear whether their results generalize to larger programs, and some of the studies did not account for the confounding influence of test suite size. In addition, most of the studies were done with adequate suites, which are are rare in practice, so the results may not generalize to typical test suites. We have extended these studies by evaluating the relation- ship between test suite size, coverage, and effectiveness for large Java programs. Our study is the largest to date in the literature: we generated 31,000 test suites for five systems consisting of up to 724,000 lines of source code. We measured the statement coverage, decision coverage, and modified con- dition coverage of these suites and used mutation testing to evaluate their fault detection effectiveness. We found that there is a low to moderate correlation between coverage and effectiveness when the number of test cases in the suite is controlled for. In addition, we found that stronger forms of coverage do not provide greater insight into the effectiveness of the suite. Our results suggest that coverage, while useful for identifying under-tested parts of a program, should not be used as a quality target because it is not a good indicator of test suite effectiveness. Categories and Subject Descriptors D.2.5 [Software Engineering]: Testing and Debugging; D.2.8 [Software Engineering]: Metrics—product metrics General Terms Measurement Keywords Coverage, test suite effectiveness, test suite quality 1. INTRODUCTION Testing is an important part of producing high quality software, but its effectiveness depends on the quality of the test suite: some suites are better at detecting faults than others. Naturally, developers want their test suites to be good at exposing faults, necessitating a method for measuring the fault detection effectiveness of a test suite. Testing textbooks often recommend coverage as one of the metrics that can be used for this purpose (e.g., [29, 34]). This is intuitively appealing, since it is clear that a test suite cannot find bugs in code it never executes; it is also supported by studies that have found a relationship between code coverage and fault detection effectiveness [3, 6, 14–17, 24, 31, 39]. Unfortunately, these studies do not agree on the strength of the relationship between these test suite characteristics. In addition, three issues with the studies make it difficult to generalize their results. First, some of the studies did not control for the size of the suite. Since coverage is increased by adding code to existing test cases or by adding new test cases to the suite, the coverage of a test suite is correlated with its size. It is therefore not clear that coverage is related to effectiveness independently of the number of test cases in the suite. Second, all but one of the studies used small or synthetic programs, making it unclear that their results hold for the large programs typical of industry. Third, many of the studies only compared adequate suites; that is, suites that fully satisfied a particular coverage criterion. Since adequate test suites are rare in practice, the results of these studies may not generalize to more realistic test suites. This paper presents a new study of the relationship between test suite size, coverage and effectiveness. We answer the following research questions for large Java programs: Research Question 1. Is the effectiveness of a test suite correlated with the number of test cases in the suite? Research Question 2. Is the effectiveness of a test suite correlated with its statement coverage, decision coverage and/or modified condition coverage when the number of test cases in the suite is ignored? Research Question 3. Is the effectiveness of a test suite correlated with its statement coverage, decision coverage and/or modified condition coverage when the number of test cases in the suite is held constant? The paper makes the following contributions: • A comprehensive survey of previous studies that inves- tigated the relationship between coverage and effective- ness (Section 2 and accompanying online material). Permission to make digital or hard copies of all or part of this work for personal or classroom use is granted without fee provided that copies are not made or distributed for profit or commercial advantage and that copies bear this notice and the full citation on the first page. Copyrights for components of this work owned by others than ACM must be honored. Abstracting with credit is permitted. To copy otherwise, or republish, to post on servers or to redistribute to lists, requires prior specific permission and/or a fee. Request permissions from [email protected]. Copyright is held by the author/owner(s). Publication rights licensed to ACM. ICSE’14, May 31 – June 7, 2014, Hyderabad, India ACM 978-1-4503-2756-5/14/05 http://dx.doi.org/10.1145/2568225.2568271 435
Transcript of Coverage Is Not Strongly Correlated with Test Suite … Is Not Strongly Correlated with Test Suite...

Coverage Is Not Strongly Correlatedwith Test Suite Effectiveness
Laura Inozemtseva and Reid HolmesSchool of Computer Science
University of WaterlooWaterloo, ON, Canada
{lminozem,rtholmes}@uwaterloo.ca
ABSTRACTThe coverage of a test suite is often used as a proxy forits ability to detect faults. However, previous studies thatinvestigated the correlation between code coverage and testsuite effectiveness have failed to reach a consensus about thenature and strength of the relationship between these testsuite characteristics. Moreover, many of the studies weredone with small or synthetic programs, making it unclearwhether their results generalize to larger programs, and someof the studies did not account for the confounding influenceof test suite size. In addition, most of the studies were donewith adequate suites, which are are rare in practice, so theresults may not generalize to typical test suites.
We have extended these studies by evaluating the relation-ship between test suite size, coverage, and effectiveness forlarge Java programs. Our study is the largest to date in theliterature: we generated 31,000 test suites for five systemsconsisting of up to 724,000 lines of source code. We measuredthe statement coverage, decision coverage, and modified con-dition coverage of these suites and used mutation testing toevaluate their fault detection effectiveness.We found that there is a low to moderate correlation
between coverage and effectiveness when the number of testcases in the suite is controlled for. In addition, we found thatstronger forms of coverage do not provide greater insightinto the effectiveness of the suite. Our results suggest thatcoverage, while useful for identifying under-tested parts of aprogram, should not be used as a quality target because it isnot a good indicator of test suite effectiveness.
Categories and Subject DescriptorsD.2.5 [Software Engineering]: Testing and Debugging;D.2.8 [Software Engineering]: Metrics—product metrics
General TermsMeasurement
KeywordsCoverage, test suite effectiveness, test suite quality
Permission to make digital or hard copies of all or part of this work forpersonal or classroom use is granted without fee provided that copies arenot made or distributed for profit or commercial advantage and that copiesbear this notice and the full citation on the first page. To copy otherwise, torepublish, to post on servers or to redistribute to lists, requires prior specificpermission and/or a fee.ICSE ’14, May 31–June 7, 2014, Hyderabad, IndiaCopyright 14 ACM 978-1-4503-2756-5/14/05 ...$15.00.
1. INTRODUCTIONTesting is an important part of producing high quality
software, but its effectiveness depends on the quality of thetest suite: some suites are better at detecting faults thanothers. Naturally, developers want their test suites to be goodat exposing faults, necessitating a method for measuring thefault detection effectiveness of a test suite. Testing textbooksoften recommend coverage as one of the metrics that canbe used for this purpose (e.g., [29, 34]). This is intuitivelyappealing, since it is clear that a test suite cannot find bugsin code it never executes; it is also supported by studies thathave found a relationship between code coverage and faultdetection effectiveness [3, 6, 14–17,24,31,39].
Unfortunately, these studies do not agree on the strengthof the relationship between these test suite characteristics.In addition, three issues with the studies make it difficult togeneralize their results. First, some of the studies did notcontrol for the size of the suite. Since coverage is increasedby adding code to existing test cases or by adding new testcases to the suite, the coverage of a test suite is correlatedwith its size. It is therefore not clear that coverage is relatedto effectiveness independently of the number of test cases inthe suite. Second, all but one of the studies used small orsynthetic programs, making it unclear that their results holdfor the large programs typical of industry. Third, many of thestudies only compared adequate suites; that is, suites thatfully satisfied a particular coverage criterion. Since adequatetest suites are rare in practice, the results of these studiesmay not generalize to more realistic test suites.
This paper presents a new study of the relationship betweentest suite size, coverage and effectiveness. We answer thefollowing research questions for large Java programs:
Research Question 1. Is the effectiveness of a test suitecorrelated with the number of test cases in the suite?
Research Question 2. Is the effectiveness of a test suitecorrelated with its statement coverage, decision coverageand/or modified condition coverage when the number of testcases in the suite is ignored?
Research Question 3. Is the effectiveness of a test suitecorrelated with its statement coverage, decision coverageand/or modified condition coverage when the number of testcases in the suite is held constant?
The paper makes the following contributions:
• A comprehensive survey of previous studies that inves-tigated the relationship between coverage and effective-ness (Section 2 and accompanying online material).
Permission to make digital or hard copies of all or part of this work for personal orclassroom use is granted without fee provided that copies are not made or distributedfor profit or commercial advantage and that copies bear this notice and the full citationon the first page. Copyrights for components of this work owned by others than ACMmust be honored. Abstracting with credit is permitted. To copy otherwise, or republish,to post on servers or to redistribute to lists, requires prior specific permission and/or afee. Request permissions from [email protected] is held by the author/owner(s). Publication rights licensed to ACM.
ICSE’14, May 31 – June 7, 2014, Hyderabad, IndiaACM 978-1-4503-2756-5/14/05http://dx.doi.org/10.1145/2568225.2568271
435

Table 1: Summary of the findings from previous studies.
Citation Languages Largest Program Coverage Types Findings
[15, 16] Pascal 78 SLOC All-use, decision All-use related to effectiveness independently ofsize; decision is not; relationship is highly non-linear
[17] FortranPascal
78 SLOC All-use, mutation Effectiveness improves with coverage but not untilcoverage reaches 80%; even then increase is small
[14] C 5,905 SLOC All-use, decision Effectiveness is correlated with both all-use anddecision coverage; increase is small until high levelsof coverage are reached
[39] C <2,310 SLOC Block Effectiveness is more highly correlated with blockcoverage than with size
[24] C 512 SLOC All-use, decision Effectiveness is correlated with both all-use and de-cision coverage; effectiveness increases more rapidlyat high levels of coverage
[6] C 4,512 SLOC Block, c-use,decision, p-use
Effectiveness is moderately correlated with all fourcoverage types; magnitude of the correlation de-pends on the nature of the tests
[3] C 5,000 SLOC Block, c-use,decision, p-use
Effectiveness is correlated with all four coveragetypes; effectiveness rises steadily with coverage
[31] CC++
5,680 SLOC Block, c-use,decision, p-use
Effectiveness is correlated with all four coveragetypes but the correlations are not always strong
[19,37] CJava
72,490 SLOC AIMP, DBB,decision, IMP,PCC, statement
Effectiveness correlated with coverage; effective-ness correlated with size for large projects
[5] C 4,000 SLOC Block, c-use,decision, p-use
None of the four coverage types are related toeffectiveness independently of size
[20] Java O(100, 000)SLOC
Block, decision,path, statement
Effectiveness correlated with coverage across manyprojects; influence of project size unclear
• Empirical evidence demonstrating that there is a lowto moderate correlation between coverage and effective-ness when suite size is controlled for and that the typeof coverage used has little effect on the strength of therelationship (Section 4).
• A discussion of the implications of these results for de-velopers, researchers and standards bodies (Section 5).
2. RELATED WORKMost of the previous studies that investigated the link
between test suite coverage and test suite effectiveness usedthe following general procedure:
1. Created faulty versions of one or more programs bymanually seeding faults, reintroducing previously fixedfaults, or using a mutation tool.
2. Created a large number of test suites by selecting froma pool of available test cases, either randomly or accord-ing to some algorithm, until the suite reached either apre-specified size or a pre-specified coverage level.
3. Measured the coverage of each suite in one or moreways, if suite size was fixed; measured the suite’s sizeif its coverage was fixed.
4. Determined the effectiveness of each suite as the frac-tion of faulty versions of the program that were detectedby the suite.
Table 1 summarizes twelve studies that considered the
relationship between the coverage and the effectiveness ofa test suite, ten of which used the general procedure justdescribed. Eight of them found that at least one type of cov-erage has some correlation with effectiveness independentlyof size; however, not all studies found a strong correlation,and most found that the relationship was highly non-linear.In addition, some found that the relationship only appearedat very high levels of coverage. For brevity, the older stud-ies from Table 1 are described more fully in accompanyingmaterials1. In the remainder of this section, we discuss thethree most recent studies.At the time of writing, no other study considered any
subject program larger than 5,905 SLOC2. However, a recentstudy by Gligoric et al. [19] and a subsequent master’s the-sis [37] partially addressed this issue by studying two largeJava programs (JFreeChart and Joda Time) and two large Cprograms (SQLITE and YAFFS2) in addition to a numberof small programs. The authors created test suites by sam-pling from the pool of test cases for each program. For thelarge programs, these test cases were manually written bydevelopers; for the small programs, these test cases were auto-matically generated using various tools. Suites were created
1http://linozemtseva.com/research/2014/icse/coverage/2In this paper, source lines of code (SLOC) refers to exe-cutable lines of code, while lines of code (LOC) includeswhitespace and comments.
436

in two ways. First, the authors specified a coverage level andselected tests until it was met; next, the authors specified asuite size and selected tests until it was met. They measureda number of coverage types: statement coverage, decisioncoverage, and more exotic measurements based on equivalentclasses of covered statements (dynamic basic block coverage),program paths (intra-method and acyclic intra-method pathcoverage), and predicate states (predicate complete cover-age). They evaluated the effectiveness of each suite usingmutation testing. They found that the Kendall τ correla-tion (see Section 4.2) between coverage and mutation scoreranged from 0.452 to 0.757 for the various coverage typesand suite types when the size of the suite was not considered.When they tried to predict the mutation score using suitesize alone, they found high correlations (between 0.585 and0.958) for the four large programs with manually writtentest suites but fairly low correlations for the small programswith artificially generated test suites. This suggests that thecorrelation between coverage and effectiveness in real systemsis largely due to the correlation between coverage and size; italso suggests that results from automatically generated andmanually generated suites do not generalize to each other.
A study by Gopinath et al. [20] accepted to the same con-ference as the current paper did not use the aforementionedgeneral procedure. The authors instead measured coverageand test suite effectiveness for a large number of open-sourceJava programs and computed a correlation across all pro-grams. Specifically, they measured statement, block, decisionand path coverage and used mutation testing to measureeffectiveness. The authors measured these values for approx-imately 200 developer-generated test suites – the numbervaries by measurement – then generated a suite for eachproject with the Randoop tool [36] and repeated the mea-surements. The authors found that coverage is correlatedwith effectiveness across projects for all coverage types andfor both developer-generated and automatically-generatedsuites, though the correlation was stronger for developer-written suites. The authors found that including test suitesize in their regression model did not improve the results;however, since coverage was already included in the model,it is not clear whether this is an accurate finding or a resultof multicollinearity3.As the above discussion shows, it is still not clear how
test suite size, coverage and effectiveness are related. Moststudies conclude that effectiveness is related to coverage, butthere is little agreement about the strength and nature ofthe relationship.
3. METHODOLOGYTo answer our research questions, we followed the general
procedure outlined in Section 2. This required us to select:
1. A set of subject programs (Section 3.2);
2. A method of generating faulty versions of the programs(Section 3.3);
3. A method of creating test suites (Section 3.4);
4. Coverage metrics (Section 3.5); and
5. An effectiveness metric (Section 3.6).
We then measured the coverage and effectiveness of the suitesto evaluate the relationship between these characteristics.
3The amount of variation ‘explained’ by a variable will beless if it is correlated with a variable already included in themodel than it would be otherwise.
3.1 TerminologyBefore describing the methodology in detail, we precisely
define three terms that will be used throughout the paper.
• Test case: one test in a suite of tests. A test caseexecutes as a unit; it is either executed or not executed.In the JUnit testing framework, each method that startswith the word test (JUnit 3) or that is annotated with@Test (JUnit 4) is a test case. For this reason, we willuse the terms test method and test case interchangeably.
• Test suite: a collection of test cases.
• Master suite: the whole test suite that was writtenby the developers of a subject program. For example,the master suite for Apache POI contains 1,415 testcases (test methods). The test suites that we createand evaluate are strict subsets of the master suite.
3.2 Subject ProgramsWe selected five subjects from a variety of application
domains. The first, Apache POI [4], is an open source APIfor manipulating Microsoft documents. The second, ClosureCompiler [7], is an open source JavaScript optimizing com-piler. The third, HSQLDB [23], is an open source relationaldatabase management system. The fourth, JFreeChart [25],is an open source library for producing charts. The fifth,Joda Time [26], is an open source replacement for the JavaDate and Time classes.We used a number of criteria to select these projects.
First, to help ensure the novelty and generalizability of ourstudy, we required that the projects be reasonably large (onthe order of 100,000 SLOC), written in Java, and activelydeveloped. We also required that the projects have a fairlylarge number of test methods (on the order of 1,000) so thatwe would be able to generate reasonably sized random testsuites. Finally, we required that the projects use Ant asa build system and JUnit as a test harness, allowing us toautomate data collection.
The salient characteristics of our programs are summarizedin Table 2. Program size was measured with SLOCCount [38].Rows seven through ten provide information related to mu-tation testing and will be explained in Section 3.3.
3.3 Generating Faulty ProgramsWe used the open source tool PIT [35] to generate faulty
versions of our programs. To describe PIT’s operation, wemust first give a brief description of mutation testing.A mutant is a new version of a program that is created
by making a small syntactic change to the original program.For example, a mutant could be created by modifying aconstant, negating a branch condition, or removing a methodcall. The resulting mutant may produce the same output asthe original program, in which case it is called an equivalentmutant. For example, if the equality test in the code snippetin Figure 1 were changed to if (index >= 10), the newprogram would be an equivalent mutant.
Mutation testing tools such as PIT generate a large numberof mutants and run the program’s test suite on each one.If the test suite fails when it is run on a given mutant, wesay that the suite kills that mutant. A test suite’s mutantcoverage is then the fraction of non-equivalent mutantsthat it kills. Equivalent mutants are excluded because theycannot, by definition, be detected by a unit test.If a mutant is not killed by a test suite, manual inspec-
437

Table 2: Salient characteristics of our subject programs.
Property Apache POI Closure HSQLDB JFreeChart Joda Time
Total Java SLOC 283,845 724,089 178,018 125,659 80,462Test SLOC 68,932 93,528 18,425 44,297 51,444Number of test methods 1,415 7,947 628 1,764 3,857Statement coverage (%) 67 76 27 54 91Decision coverage (%) 60 77 17 45 82MC coverage (%) 49 67 9 27 70
Number of mutants 27,565 30,779 50,302 29,699 9,552Number of detected mutants 17,935 27,325 50,125 23,585 8,483Number of equivalent mutants 9,630 3,454 177 6,114 1,069Equivalent mutants (%) 35 11 0.4 21 11
int index = 0;
while (true) {
index++;
if (index == 10) {
break;
}
}
Figure 1: An example of how an equivalent mutantcan be generated. Changing the operator == to >=will result in a mutant that cannot be detected byan automated test case.
tion is required to determine if it is equivalent or if it wassimply missed by the suite4. This is a time-consuming anderror-prone process, so studies that compare subsets of atest suite to the master suite often use a different approach:they assume that any mutant that cannot be detected bythe master suite is equivalent. While this technique tendsto overestimate the number of equivalent mutants, it is com-monly applied because it allows the study of much largerprograms.Although the mutants generated by PIT simulate real
faults, it is not self-evident that a suite’s ability to kill mu-tants is a valid measurement of its ability to detect real faults.However, several previous and current studies support theuse of this measurement [2, 3, 10, 27]. Previous work has alsoshown that if a test suite detects a large number of simplefaults, caused by a single incorrect line of source code, itwill detect a large number of harder, multi-line faults [28,32].This implies that if a test suite can kill a large proportion ofmutants, it can also detect a large proportion of the moredifficult faults in the software. The literature thus suggeststhat the mutant detection rate of a suite is a fairly goodmeasurement of its fault detection ability. We will return tothis issue in Sections 6 and 7.
We can now describe the remaining rows of Table 2. Theseventh row shows how many mutants PIT generated for eachproject. The eighth row shows how many of those mutantscould be detected by the suite. The ninth row shows howmany of those mutants could not be detected by the entiretest suite and were therefore assumed to be equivalent (i.e.,row 7 is the sum of rows 8 and 9). The last row gives theequivalent mutants as a percentage of the total.
4Manual inspection is required because automatically deter-mining whether a mutant is equivalent is undecidable [33].
3.4 Generating Test SuitesFor each subject program, we used Java’s reflection API to
identify all of the test methods in the program’s master suite.We then generated new test suites of fixed size by randomlyselecting a subset of these methods without replacement.More concretely, we created a JUnit suite by repeatedlyusing the TestSuite.addTest(Test t) method. Each suitewas created as a JUnit suite so that the necessary set-up andtear-down code was run for each test method. Given thisprocedure for creating suites, in this paper the size of ourrandom suites should always be understood as the number oftest methods they contain, i.e., the number of times addTestwas called.
We made 1,000 suites of each of the following sizes: 3methods, 10 methods, 30 methods, 100 methods, and so on,up to the largest number following this pattern that was lessthan the total number of test methods. This resulted in atotal of 31,000 test suites across the five subject systems.Comparing a large number of suites from the same projectallows us to control for size; it also allows us to apply ourresults to the common research practice of comparing testsuites generated for the same subject program using differenttest generation methodologies.
3.5 Measuring CoverageWe used the open source tool CodeCover [8] to measure
three types of coverage: statement, decision, and modifiedcondition coverage. Statement coverage refers to the fractionof the executable statements in the program that are runby the test suite. It is relatively easy to satisfy, easy tounderstand and can be measured quickly, making it popularwith developers. However, it is one of the weaker forms ofcoverage, since executing a line does not necessarily revealan error in that line.Decision coverage refers to the fraction of decisions (i.e.,
branches) in the program that are executed by its test suite.Decision coverage is somewhat harder to satisfy and measurethan statement coverage.Modified condition coverage (MCC) is the most difficult
of these three to satisfy. For a test suite to be modifiedcondition adequate, i.e., to have 100% modified conditioncoverage, the suite must include 2n test cases for every deci-sion with n conditions5 in it [22]. This form of coverage is notcommonly used in practice; however, it is very similar to mod-
5A condition is a boolean expression that cannot be de-composed into a simpler boolean expression. Decisions arecomposed of conditions and one or more boolean operators.
438

ified condition/decision coverage (MC/DC), which is widelyused in the avionics industry. Specifically, Federal AviationAdministration standard DO-178B states that the most criti-cal software in the aircraft must be tested with a suite that ismodified condition/decision coverage adequate [22]. MC/DCis therefore one of the most stringent forms of coverage thatis widely and regularly used in practice. Measuring modifiedcondition coverage provides insight into whether strongercoverage types such as MCC and MC/DC provide practicalbenefits that outweigh the extra cost associated with writingenough tests to satisfy them.We did not measure any type of dataflow coverage, since
very few tools for Java can measure these types of coverage.One exception is Coverlipse [9], which can measure all-usecoverage but can only be used as an Eclipse plugin. To thebest of our knowledge, there are no open source coverage toolsfor Java that can measure other data flow coverage criteriaor that can be used from the command line. Since developersuse the tools they have, they are unlikely to use dataflowcoverage metrics. Using the measurements that developersuse, whether due to tool availability or legal requirements,means that our results will more accurately reflect currentdevelopment practice. However, we plan to explore dataflowcoverage in future work to determine if developers wouldbenefit from using these coverage types instead.
3.6 Measuring EffectivenessWe used two effectiveness measurements in this study:
the raw effectiveness measurement and the normalized effec-tiveness measurement. The raw kill score is the number ofmutants a test suite detected divided by the total number ofnon-equivalent mutants that were generated for the subjectprogram under test. The normalized effectiveness measure-ment is the number of mutants a test suite detected dividedby the number of non-equivalent mutants it covers. A testsuite covers a mutant if the mutant was made by altering aline of code that is executed by the test suite, implying thatthe test suite can potentially detect the mutant.
We included the normalized effectiveness measurement inorder to compare test suites on a more even footing. Supposewe are comparing suite A, with 50% coverage, to suite B, with60% coverage. Suite B will almost certainly have a higherraw effectiveness measurement, since it covers more code andwill therefore almost certainly kill more mutants. However,if suite A kills 80% of the mutants that it covers, while suiteB kills only 70% of the mutants that it covers, suite A isin some sense a better suite. The normalized effectivenessmeasurement captures this difference. Note that it is possiblefor the normalized effectiveness measurement to drop whena new test case is added to the suite if the test case covers alot of code but kills few mutants.
It may be helpful to think of the normalized effectivenessmeasurement as a measure of depth: how thoroughly does thetest suite exercise the code that it runs? The raw effectivenessmeasurement is a measure of breadth: how much code doesthe suite exercise?Note that the number of non-equivalent mutants covered
by a suite is the maximum number of mutants the suite couldpossibly detect, so the normalized effectiveness measurementranges from 0 to 1. The raw effectiveness measurement,in general, does not reach 1, since most suites kill a smallpercentage of the non-equivalent mutants. However, notethat the full test suite has both a normalized effectiveness
measurement of 1 and a raw effectiveness measurement of1, since we decided that any mutants it did not kill areequivalent.
4. RESULTSIn this section, we quantitatively answer the three research
questions posed in Section 1. As Section 3 explained, wecollected the data to answer these questions by generatingtest suites of fixed size via random sampling; measuring theirstatement, decision and MCC coverage with CodeCover; andmeasuring their effectiveness with the mutation testing toolPIT.
4.1 Is Size Correlated With Effectiveness?Research Question 1 asked if the effectiveness of a test suite
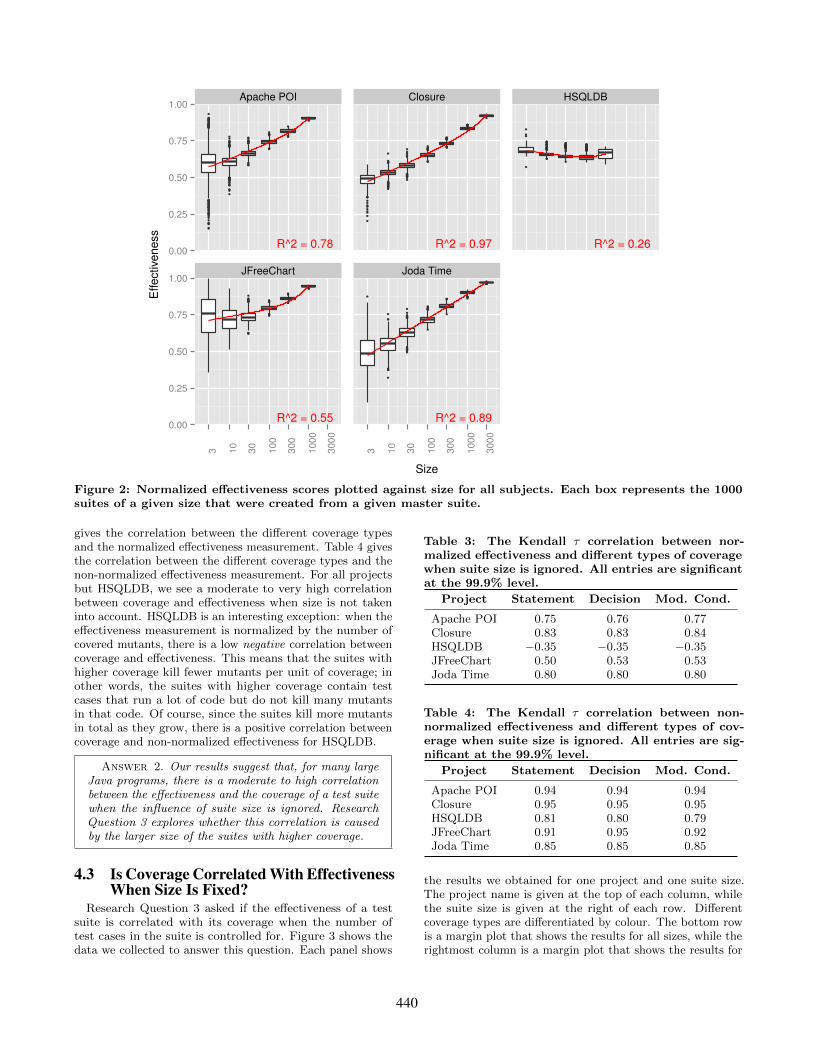
is influenced by the number of test methods it contains. Thisresearch question provides a “sanity check” that supports theuse of the effectiveness metric. Figure 2 shows some of thedata we collected to answer this question. In each subfigure,the x axis indicates suite size on a logarithmic scale while they axis shows the range of normalized effectiveness values wecomputed. The red line on each plot was fit to the data withR’s lm function6. The adjusted r2 value for each regressionline is shown in the bottom right corner of each plot. Thesevalues range from 0.26 to 0.97, implying that the correlationcoefficient r ranges from 0.51 to 0.98. This indicates thatthere is a moderate to very high correlation between normal-ized effectiveness and size for these projects7. The results forthe non-normalized effectiveness measurement are similar,with the r2 values ranging from 0.69 to 0.99, implying a highto very high correlation between non-normalized effective-ness and size. The figure for this measurement can be foundonline8.
Answer 1. Our results suggest that, for large Javaprograms, there is a moderate to very high correlationbetween the effectiveness of a test suite and the numberof test methods it contains.
4.2 Is Coverage Correlated With EffectivenessWhen Size Is Ignored?
Research Question 2 asked if the effectiveness of a test suiteis correlated with the coverage of the suite when we ignorethe influence of suite size. Tables 3 and 4 show the Kendall τcorrelation coefficients we computed to answer this question;all coefficients are significant at the 99.9% level9. Table 3
6Size and the logarithm of size were used as the inputs.7Here we use the Guildford scale [21] for verbal description,in which correlations with absolute value less than 0.4 aredescribed as “low”, 0.4 to 0.7 as “moderate”, 0.7 to 0.9 as“high”, and over 0.9 as “very high”.8http://linozemtseva.com/research/2014/icse/coverage/9Kendall’s τ is similar to the more common Pearson coef-ficient but does not assume that the variables are linearlyrelated or that they are normally distributed. Rather, itmeasures how well an arbitrary monotonic function could fitthe data. A high correlation therefore means that we canpredict the rank order of the suites’ effectiveness values giventhe rank order of their coverage values, which in practiceis nearly as useful as predicting an absolute effectivenessscore. We used it instead of the Pearson coefficient to avoidintroducing unnecessary assumptions about the distributionof the data.
439
●
●
●
●
●
●
●
●●
●
●
●●●●
●
●●
●
●●●●
●
●
●
●
●
●
●
●
●
●
●
●
●
●
●
●
●●
●●
●
●
●●
●
●
●
●
●●
●
●
●
●
●
●
●
●●
●
●
●●
●
●
●
●●
●
●
●
●
●
●
●
●
●
●
●
●●
●●
●●
●●●
●
●
●
●
●●●
●
●
●
●
●
●
●
●●●●
●●
●●
●●●
●
●
●●
●
●
●
●
●
●●
●●
●
●●●●●●
●
●
●
●●●●●
●●●●●●
●
●●●
●●
●●
●
●●●
●
●●
●●●
R^2 = 0.78
●
●
●
●
●
●
●
●
●
●
●
●
●
●
●
●
●●●
●
●●●
●
●
●
●
●●●
●
●
●●
●
●
●
●●●●●●
●
●
●●
●●
●
●
●●●●
●
●
●●●●●●●●●●
●
●
●
●
●
●
●●
●
●
●●●●●●
●
●●●●●●●
●
●●●●●●
●
●●●●●●●●
●
●●●●●
●
●●●
●●
●●●
●
●
●●●●●●●●●●●●●●●●●
●
R^2 = 0.97
●●
●
●
●
●
●●●●●
●
●
●●●●
●
●
●
●●
●
●●
●●●
●
●●●
●
●●●●
●●
●
●●●●
●
●●●
●
●●●●●●●
●●●●●●●●●●●●●
●
●●●●●●●
●
●●●●●●●●●●●●●●●●●
●
●●●●
●●●●●●●●●●●●●●●●●●●●●●●●●●●●
●
●●●●●●●●●●●●●●●●●●●●●●●●●●●●●●●●●●●●●●●●●●●●●●●●●●
●●●●●●●●●●
●●
●●●●●●●●●●●●●●●●●●●●●●●●●●●●●●●●●●●●●●
●●●●●●●●●●●●●●●●●●●●●●●●●●●●●●●●●●
●
R^2 = 0.26
●●●●●●
●●●
●
●
●
●
●
●● ●●●●
●●●
●
●●
●
●
●
●●
●●
●
●●●
R^2 = 0.55
●
●
●●●●●
●
●
●
●
●●
●
●●●●●
●
●
●
●
●
●
●●●●
●
●●●
●
●
●
●●●●●●●●●
●
●
●
●
●●●●●●●●
●●●●●●●●●
R^2 = 0.89
Apache POI Closure HSQLDB
JFreeChart Joda Time
0.00
0.25
0.50
0.75
1.00
0.00
0.25
0.50
0.75
1.00
3 10 30 100
300
1000
3000
3 10 30 100
300
1000
3000
Size
Effe
ctiv
enes
s
Figure 2: Normalized effectiveness scores plotted against size for all subjects. Each box represents the 1000suites of a given size that were created from a given master suite.
gives the correlation between the different coverage typesand the normalized effectiveness measurement. Table 4 givesthe correlation between the different coverage types and thenon-normalized effectiveness measurement. For all projectsbut HSQLDB, we see a moderate to very high correlationbetween coverage and effectiveness when size is not takeninto account. HSQLDB is an interesting exception: when theeffectiveness measurement is normalized by the number ofcovered mutants, there is a low negative correlation betweencoverage and effectiveness. This means that the suites withhigher coverage kill fewer mutants per unit of coverage; inother words, the suites with higher coverage contain testcases that run a lot of code but do not kill many mutantsin that code. Of course, since the suites kill more mutantsin total as they grow, there is a positive correlation betweencoverage and non-normalized effectiveness for HSQLDB.
Answer 2. Our results suggest that, for many largeJava programs, there is a moderate to high correlationbetween the effectiveness and the coverage of a test suitewhen the influence of suite size is ignored. ResearchQuestion 3 explores whether this correlation is causedby the larger size of the suites with higher coverage.
4.3 Is Coverage Correlated With EffectivenessWhen Size Is Fixed?
Research Question 3 asked if the effectiveness of a testsuite is correlated with its coverage when the number oftest cases in the suite is controlled for. Figure 3 shows thedata we collected to answer this question. Each panel shows
Table 3: The Kendall τ correlation between nor-malized effectiveness and different types of coveragewhen suite size is ignored. All entries are significantat the 99.9% level.
Project Statement Decision Mod. Cond.
Apache POI 0.75 0.76 0.77Closure 0.83 0.83 0.84HSQLDB −0.35 −0.35 −0.35JFreeChart 0.50 0.53 0.53Joda Time 0.80 0.80 0.80
Table 4: The Kendall τ correlation between non-normalized effectiveness and different types of cov-erage when suite size is ignored. All entries are sig-nificant at the 99.9% level.
Project Statement Decision Mod. Cond.
Apache POI 0.94 0.94 0.94Closure 0.95 0.95 0.95HSQLDB 0.81 0.80 0.79JFreeChart 0.91 0.95 0.92Joda Time 0.85 0.85 0.85
the results we obtained for one project and one suite size.The project name is given at the top of each column, whilethe suite size is given at the right of each row. Differentcoverage types are differentiated by colour. The bottom rowis a margin plot that shows the results for all sizes, while therightmost column is a margin plot that shows the results for
440

Apache POI Closure HSQLDB JFreeChart Joda Time (all)
0.000.250.500.751.00
0.000.250.500.751.00
0.000.250.500.751.00
0.000.250.500.751.00
0.000.250.500.751.00
0.000.250.500.751.00
0.000.250.500.751.00
0.000.250.500.751.00
310
30100
3001000
3000(all)
0.00
0.25
0.50
0.75
1.00
0.00
0.25
0.50
0.75
1.00
0.00
0.25
0.50
0.75
1.00
0.00
0.25
0.50
0.75
1.00
0.00
0.25
0.50
0.75
1.00
0.00
0.25
0.50
0.75
1.00
Coverage
Effe
ctiv
enes
s
Coverage Type ● ● ●Decision coverage Modified condition coverage Statement coverage
N/A
N/AN/AN/A
Figure 3: Normalized effectiveness scores (left axis) plotted against coverage (bottom axis) for all subjects.Rows show the results for one suite size; columns show the results for one project. N/A indicates that theproject did not have enough test cases to fill in that frame.
all projects. The figure shows the results for the normalizedeffectiveness measurement; the non-normalized effectivenessmeasurements tend to be small and difficult to see at this size.The figure for the non-normalized effectiveness measurementcan be found online with the other supplementary material.
We computed the Kendall τ correlation coefficient betweeneffectiveness and coverage for each project, each suite size,each coverage type, and both effectiveness measures. Sincethis resulted in a great deal of data, we summarize the resultshere; the full dataset can be found on the same website asthe figures.Our results were mixed. Controlling for suite size always
lowered the correlation between coverage and effectiveness.However, the magnitude of the change depended on the ef-fectiveness measurement used. In general, the normalizedeffectiveness measurements had low correlations with cover-
age once size was controlled for while the non-normalizedeffectiveness measurements had moderate correlations withcoverage once size was controlled for.That said, the results varied by project. Joda Time was
at one extreme: the correlation between coverage and ef-fectiveness ranged from 0.80 to 0.85 when suite size wasignored, but dropped to essentially zero when suite size wascontrolled for. The same effect was seen for Closure whenthe normalized effectiveness measurement was used.Apache POI fell at the other extreme. For this project,
the correlation between coverage and the non-normalizedeffectiveness measurement was 0.94 when suite size was ig-nored, but dropped to a range of 0.46 to 0.85 when suite sizewas controlled for. While this is in some cases a large drop,a correlation in this range can provide useful informationabout the quality of a test suite.
441

A very interesting result is that, in general, the coveragetype used did not have a strong impact on the results. Thisis true even though the effectiveness scores (y values) for eachsuite are the same for all three coverage types (x values).To clarify this, consider Figure 4. The figure shows twohypothetical graphs of effectiveness against coverage. Inthe top graph, coverage type 1 is not strongly correlatedwith effectiveness. In the bottom graph, coverage type 2 isstrongly correlated with effectiveness even though the y-valueof each point has not changed (e.g., the triangle is at y = 0.8in both graphs). We do not see this difference betweenstatement, decision, and MCC coverage, suggesting that thedifferent types of coverage are measuring the same thing.We can confirm this intuition by measuring the correlationbetween different coverage types for each suite (Table 5).Given these high correlations, and given that the shape ofthe point clouds are similar for all three coverage measures(see Figure 3), we can conclude that the coverage type usedhas little effect on the relationship between coverage andeffectiveness in this study.
Table 5: The Kendall τ and Pearson correlations be-tween different types of coverage for all suites fromall projects.
Coverage Types Tau Pearson
Statement/Decision 0.92 0.99Decision/MCC 0.91 0.98Statement/MCC 0.92 0.97
Answer 3. Our results suggest that, for large Javaprograms, the correlation between coverage and effec-tiveness drops when suite size is controlled for. Afterthis drop, the correlation typically ranges from low tomoderate, meaning it is not generally safe to assumethat effectiveness is correlated with coverage. The corre-lation is stronger when the non-normalized effectivenessmeasurement is used. Additionally, the type of cov-erage used had little influence on the strength of therelationship.
5. DISCUSSIONThe goal of this work was to determine if a test suite’s
coverage is correlated with its fault detection effectivenesswhen suite size is controlled for. We found that there istypically a moderate to high correlation between coverageand effectiveness when suite size is ignored, and that thisdrops to a low to moderate correlation when size is con-trolled. This result suggests that coverage alone is not agood predictor of test suite effectiveness; in many cases, theapparent relationship is largely due to the fact that highcoverage suites contain more test cases. The results for JodaTime and Closure, in particular, demonstrate that it is notsafe in general to assume that coverage is correlated witheffectiveness. Interestingly, the suites for Joda Time andClosure are the largest and most comprehensive of the fivesuites we studied, which might indicate that the correlationbecomes weaker as the suite improves.
In addition, we found that the type of coverage measuredhad little impact on the correlation between coverage andeffectiveness. This is reinforced by the shape of the pointclouds in Figure 3: for any one project and suite size, the
●
0
0.2
0.4
0.6
0.8
1
0 0.2
0.4
0.6
0.8
1
Coverage type 1
Effe
ctiv
enes
s
●
0
0.2
0.4
0.6
0.8
1
0 0.2
0.4
0.6
0.8
1
Coverage type 2
Effe
ctiv
enes
s
Figure 4: Hypothetical graphs of effectivenessagainst two coverage types for four test suites. Thetop graph shows a coverage type that is not corre-lated with effectiveness; the bottom graph shows acoverage type that is correlated with effectiveness.
clouds corresponding to the three coverage types are similarin shape and size. This, in combination with the high cor-relation between different coverage measurements, suggeststhat stronger coverage types provide little extra informationabout the quality of the suite.
Our findings have implications for developers, researchers,and standards bodies. Developers may wish to use thisinformation to guide their use of coverage. While coveragemeasures are useful for identifying under-tested parts of aprogram, and low coverage may indicate that a test suite isinadequate, high coverage does not indicate that a test suiteis effective. This means that using a fixed coverage value asa quality target is unlikely to produce an effective test suite.While members of the testing community have previouslymade this point [13,30], it has been difficult to evaluate theirsuggestions due to a lack of studies that considered systems ofthe scale that we investigated. Additionally, it may be in thedeveloper’s best interest to use simpler coverage measures.These measures provide a similar amount of informationabout the suite’s effectiveness but introduce less measurementoverhead.
442
Researchers may wish to use this information to guidetheir tool-building. In particular, test generation techniquesoften attempt to maximize the coverage of the resulting suite;our results suggest that this may not be the best approach.
Finally, our results are pertinent to standards bodies thatset requirements for software testing. The FAA standardDO-178B, mentioned earlier in this paper, requires the use ofMC/DC adequate suites to ensure the quality of the resultingsoftware; however, our results suggest that this requirementmay increase expenses without necessarily increasing quality.Of course, developers still want to measure the quality
of their test suites, meaning they need a metric that doescorrelate with fault detection ability. While this is still anopen problem, we currently feel that mutation score may bea good substitute for coverage in this context [27].
6. THREATS TO VALIDITYIn this section, we discuss the threats to the construct
validity, internal validity, and external validity of our study.
6.1 Construct ValidityIn our study we measured the size, coverage and effective-
ness of random test suites. Size and coverage are straight-forward to measure, but effectiveness is more nebulous, aswe are attempting to predict the fault-detection ability of asuite that has never been used in practice. As we describedin Section 3.3, previous and current work suggests that asuite’s ability to kill mutants is a fairly good measurementof its ability to detect real faults [2, 3, 10, 27]. This sug-gests that, in the absence of equivalent mutants, this metrichas high construct validity. Unfortunately, our treatmentof equivalent mutants introduces a threat to the validity ofthis measurement. Recall that we assumed that any mutantthat could not be detected by the program’s entire test suiteis equivalent. This means that we classified up to 35% ofthe generated mutants as equivalent (see the final row ofTable 2). In theory, these mutants are a random subset ofthe entire set of mutants, so ignoring them should not affectour results. However, this may not be true. For example, ifthe developers frequently test for off-by-one errors, mutantsthat simulate this error will be detected more often and willbe less likely to be classified as equivalent.
6.2 Internal ValidityOur conclusions about the relationship between size, cov-
erage and effectiveness depend on our calculations of theKendall τ correlation coefficient. This introduces a threat tothe internal validity of the study. Kendall’s original formulafor τ assumes that there are no tied ranks in the data; thatis, if the data were sorted, no two rows could be exchangedwithout destroying the sorted order. When ties do exist,two issues arise. First, since the original formula does nothandle ties, a modified one must be used. We used the ver-sion proposed by Adler [1]. Second, ties make it difficult tocompute the statistical significance of the correlation coef-ficient. It it possible to show that, in the absence of ties,τ is normally distributed, meaning we can use Z-scores toevaluate significance in the usual way. However, when tiesare present, the distribution of τ changes in a way that de-pends on the number and nature of the ties. This can resultin a non-normal distribution [18]. To determine the impactof ties on our calculations, we counted both the number ofties that occurred and the total number of comparisons done
to compute each τ . We found that ties rarely occurred: forthe worst calculation, 4.6% of the comparisons resulted in atie, but for most calculations this percentage was smaller byseveral orders of magnitude. Since there were so few ties, wehave assumed that they had a negligible effect on the normaldistribution.Another threat to internal validity stems from the possi-
bility of duplicate test suites: our results might be skewed iftwo or more suites contain the same subset of test methods.Fortunately, we can evaluate this threat using the informa-tion we collected about ties: since duplicate suites wouldnaturally have identical coverage and effectiveness scores,the number of tied comparisons provides an upper boundon how many identical suites were compared. Since thenumber of ties was so low, the number of duplicate suitesmust be similarly low, and so we have ignored the small skewthey may have introduced to avoid increasing the memoryrequirements of our study unnecessarily.Since we have studied correlations, we cannot make any
claims about the direction of causality.
6.3 External ValidityThere are six main threats to the external validity of our
study. First, previous work suggests that the relationshipbetween size, coverage and effectiveness depends on the dif-ficulty of detecting faults in the program [3]. Furthermore,some of the previous work was done with hand-seeded faults,which have been shown to be harder to detect than bothmutants and real faults [2]. While this does not affect ourresults, it does make it harder to compare them with thoseof earlier studies.Second, some of the previous studies found that a rela-
tionship between coverage and effectiveness did not appearuntil very high coverage levels were reached [14,17,24]. Sincethe coverage of our generated suites rarely reached very highvalues, it is possible that we missed the existence of sucha relationship. That said, it is not clear that such a rela-tionship would be useful in practice. It is very difficult toreach extremely high levels of coverage, so a relationship thatdoes not appear until 90% coverage is reached is functionallyequivalent to no relationship at all for most developers.Third, in object-oriented systems, most faults are usu-
ally found in just a few of the system’s components [12].This means that the relationship between size, coverage andeffectiveness may vary by class within the system. It is there-fore possible that coverage is correlated with effectivenessin classes with specific characteristics, such as high churn.However, our conclusions still hold for the common practiceof measuring the coverage of a program’s entire test suite.
Fourth, there may be other features of a program or a suitethat affect the relationship between coverage and effective-ness. For example, previous work suggests that the size of aclass can affect the validity of object-oriented metrics [11].While we controlled for the size of each test suite in thisstudy, we did not control for the size of the class that eachtest method came from.Fifth, as discussed in Section 3.2, our subjects had to
meet certain inclusion criteria. This means that they arefairly similar, so our results may not generalize to programsthat do not meet these criteria. We attempted to mitigatethis threat by selecting programs from different applicationdomains, thereby ensuring a certain amount of variety in thesubjects. Unfortunately, it was difficult to find acceptable
443
subjects; in particular, the requirement that the subjectshave 1,000 test cases proved to be very difficult to satisfy. Inpractice, it seems that most open source projects do not havecomprehensive test suites. This is supported by Gopinath etal.’s study [20], where only 729 of the 1,254 open source Javaprojects they initially considered, or 58%, had test suites atall, much less comprehensive suites.Finally, while our subjects were considerably larger than
the programs used in previous studies, they are still not largeby industrial standards. Additionally, all of the projectswere open source, so our results may not generalize to closedsource systems.
7. FUTURE WORKOur next step is to confirm our findings using real faults
to eliminate this threat to validity. We will also exploredataflow coverage to determine if these coverage types arecorrelated with effectiveness.
It may also be helpful to perform a longitudinal study thatconsiders how the coverage and effectiveness of a program’stest suite change over time. By cross-referencing coverageinformation with bug reports, it might be possible to isolatethose bugs that were covered by the test suite but werenot immediately detected by it. Examining these bugs mayprovide insight into which bugs are the most difficult todetect and how we can improve our chances of detectingthem.
8. CONCLUSIONIn this paper, we studied the relationship between the
number of methods in a program’s test suite, the suite’sstatement, decision, and modified condition coverage, and thesuite’s mutant effectiveness measurement, both normalizedand non-normalized. From the five large Java programs westudied, we drew the following conclusions:
• In general, there is a low to moderate correlation be-tween the coverage of a test suite and its effectivenesswhen its size is controlled for.
• The strength of the relationship varies between softwaresystems; it is therefore not generally safe to assumethat effectiveness is strongly correlated with coverage.
• The type of coverage used had little impact on thestrength of the correlation.
These results imply that high levels of coverage do notindicate that a test suite is effective. Consequently, using afixed coverage value as a quality target is unlikely to producean effective test suite. In addition, complex coverage mea-surements may not provide enough additional informationabout the suite to justify the higher cost of measuring andsatisfying them.
9. REFERENCES[1] L. M. Adler. A modification of Kendall’s tau for the
case of arbitrary ties in both rankings. Journal of theAmerican Statistical Association, 52(277), 1957.
[2] J. H. Andrews, L. C. Briand, and Y. Labiche. Ismutation an appropriate tool for testing experiments?In Proc. of the Int’l Conf. on Soft. Eng., 2005.
[3] J. H. Andrews, L. C. Briand, Y. Labiche, and A. S.Namin. Using mutation analysis for assessing andcomparing testing coverage criteria. IEEE Transactionson Soft. Eng., 32(8), 2006.
[4] Apache POI. http://poi.apache.org.
[5] L. Briand and D. Pfahl. Using simulation for assessingthe real impact of test coverage on defect coverage. InProc. of the Int’l Symposium on Software ReliabilityEngineering, 1999.
[6] X. Cai and M. R. Lyu. The effect of code coverage onfault detection under different testing profiles. In Proc.of the Int’l Workshop on Advances in Model-BasedTesting, 2005.
[7] Closure Compiler.https://code.google.com/p/closure-compiler/.
[8] CodeCover. http://codecover.org/.
[9] Coverlipse. http://coverlipse.sourceforge.net/.
[10] M. Daran and P. Thevenod-Fosse. Software erroranalysis: a real case study involving real faults andmutations. In Proc. of the Int’l Symposium on SoftwareTesting and Analysis, 1996.
[11] K. El Emam, S. Benlarbi, N. Goel, and S. N. Rai. Theconfounding effect of class size on the validity ofobject-oriented metrics. IEEE Transactions on Soft.Eng., 27(7), 2001.
[12] N. E. Fenton and N. Ohlsson. Quantitative analysis offaults and failures in a complex software system. IEEETransactions on Soft. Eng., 26(8), 2000.
[13] M. Fowler. Test coverage. http://martinfowler.com/bliki/TestCoverage.html,2012.
[14] P. G. Frankl and O. Iakounenko. Further empiricalstudies of test effectiveness. In Proc. of the Int’lSymposium on Foundations of Soft. Eng., 1998.
[15] P. G. Frankl and S. N. Weiss. An experimentalcomparison of the effectiveness of the all-uses andall-edges adequacy criteria. In Proc. of the Symposiumon Testing, Analysis, and Verification, 1991.
[16] P. G. Frankl and S. N. Weiss. An experimentalcomparison of the effectiveness of branch testing anddata flow testing. IEEE Transactions on Soft. Eng.,19(8), 1993.
[17] P. G. Frankl, S. N. Weiss, and C. Hu. All-uses vsmutation testing: an experimental comparison ofeffectiveness. Journal of Systems and Software, 38(3),1997.
[18] J. D. Gibbons. Nonparametric Measures of Association.Sage Publications, 1993.
[19] M. Gligoric, A. Groce, C. Zhang, R. Sharma, M. A.Alipour, and D. Marinov. Comparing non-adequate testsuites using coverage criteria. In Proc. of the Int’lSymp. on Soft. Testing and Analysis, 2013.
[20] R. Gopinath, C. Jenson, and A. Groce. Code coveragefor suite evaluation by developers. In Proc. of the Int’lConf. on Soft. Eng., 2014.
[21] J. P. Guilford. Fundamental Statistics in Psychologyand Education. McGraw-Hill, 1942.
[22] K. Hayhurst, D. Veerhusen, J. Chilenski, andL. Rierson. A practical tutorial on modifiedcondition/decision coverage. Technical report, NASALangley Research Center, 2001.
[23] HSQLDB. http://hsqldb.org.
[24] M. Hutchins, H. Foster, T. Goradia, and T. Ostrand.Experiments of the effectiveness of dataflow- andcontrolflow-based test adequacy criteria. In Proc. of the
444

Int’l Conf. on Soft. Eng., 1994.
[25] JFreeChart. http://jfree.org/jfreechart.
[26] Joda Time. http://joda-time.sourceforge.net.
[27] R. Just, D. Jalali, L. Inozemtseva, M. D. Ernst,R. Holmes, and G. Fraser. Are mutants a validsubstitute for real faults in software testing? TechnicalReport UW-CSE-14-02-02, University of Washington,March 2014.
[28] K. Kapoor. Formal analysis of coupling hypothesis forlogical faults. Innovations in Systems and Soft. Eng.,2(2), 2006.
[29] E. Kit. Software Testing in the Real World: Improvingthe Process. ACM Press, 1995.
[30] B. Marick. How to misuse code coverage. http://www.exampler.com/testing-com/writings/coverage.pdf,1997.
[31] A. S. Namin and J. H. Andrews. The influence of sizeand coverage on test suite effectiveness. In Proc. of theInt’l Symposium on Software Testing and Analysis,2009.
[32] A. J. Offutt. Investigations of the software testingcoupling effect. ACM Transactions on Soft. Eng. andMethodology, 1(1), 1992.
[33] A. J. Offutt and J. Pan. Detecting equivalent mutantsand the feasible path problem. In Proc. of the Conf. onComputer Assurance, 1996.
[34] W. Perry. Effective Methods for Software Testing.Wiley Publishing, 2006.
[35] PIT. http://pitest.org/.
[36] Randoop. https://code.google.com/p/randoop/.
[37] R. Sharma. Guidelines for coverage-based comparisonsof non-adequate test suites. Master’s thesis, Universityof Illinois at Urbana-Champaign, 2013.
[38] SLOCCount. http://dwheeler.com/sloccount.
[39] W. E. Wong, J. R. Horgan, S. London, and A. P.Mathur. Effect of test set size and block coverage onthe fault detection effectiveness. In Proc. of the Int’lSymposium on Software Reliability Engineering, 1994.
445