Covenant Journal of Physical & Life Sciences
79
Covenant Journal of Physical & Life Sciences (CJPL) Vol. 6 No. 1, June, 2018 An Open Access Journal available online Covenant Journal of Physical & Life Sciences Vol. 6 No. 1, June, 2018 A Publication of Covenant University Editor-in-Chief: Prof. Louis Egwari [email protected] Managing Editor: Edwin O. Agbaike [email protected] Website: http//journals.covenantuniversity.edu.ng/cjpl/
Transcript of Covenant Journal of Physical & Life Sciences
Covenant Journal of Physical & Life Sciences (CJPL) Vol. 6 No. 1, June, 2018
An Open Access Journal available online
Covenant Journal of Physical & Life
Sciences
Vol. 6 No. 1, June, 2018
A Publication of Covenant University
Editor-in-Chief: Prof. Louis Egwari
Managing Editor: Edwin O. Agbaike
Website: http//journals.covenantuniversity.edu.ng/cjpl/

Covenant Journal of Physical & Life Sciences (CJPL) Vol. 6 No.1,June 2018
© 2018, Covenant University Journals
All rights reserved. No part of this publication may be reproduced,
stored in a retrieval system or transmitted in any form or by any
meams, electronic, electrostatic, magnetic tape, mechanical,
photocopying, recording or otherwise, without the prior written
permission of the publisher.
It is a condition of publication in this journal that manuscripts have
not been published or submitted for publication and will not be
submitted or published elsewhere.
Upon the acceptance of articles to be published in this journal,the
author(s) are required to transfer copyright of the article to the
publisher.
ISSN: Print 2354 – 3574
Electronics 2354 – 3485
Published by Covenant University Journals,
Covenant University, Canaanland, Km 10, Idiroko Road,
P.M.B. 1023, Ota, Ogun State, Nigeria
Printed by Covenant University Press
ii

Covenant Journal of Physical & Life Sciences (CJPL) Vol. 6 No.1,June 2018
Articles
First Birth Interval: Cox Regression Model with Time Varying
Covariates
Adeniyi O.I. & Akinrefon A.A. 1
Hepatoprotective Potential and Histological Studies of Effects
of Celosia Argentea L. on Paracetamol-Induced
Liver Damage
Dokunmu T. M. Oyelade I. F., Ogunlana O. O.,
Bello, O. A., Ezekiel O. M. & Oladele F. W. 8
Itaconic Acid Production from Date Palm (Phoenix Dactylifera L)
Using Fungi in Solid State Fermentation
Ajiboye A. E., Adedayo M. R., Babatunde S. K.,
Odaibo D. A., Ajuwon I. B. & Ekanem, H. I. 20
Ciprofloxacin Susceptibility Pattern in a Secondary Health Care
Facility in Kebbi State, Nigeria
Ajibola, O., Aliyu, B. & Usman, K. 36
A Mathematical Model on Cholera Dynamics with Prevention
and Control
Ayoade A. A., Ibrahim M. O., Peter O. J. & Oguntolu F. A. 46
Phytochemical and Antimicrobial Properties of Mangifera indica Leaf Extracts Olasehinde G. I.,
Sholotan K. J.,
Openibo J. O.,
Taiwo O. S., Bello O. A.,
Ajayi J. B., Ayepola O. O.
& Ajayi A. A. 55
Theoretical Investigation of Temperature and Grain Size
Dependence of Thermal Properties of alpha-Silicon Crystal
Nenuwe O.N. 64
iii

Covenant Journal of Physical & Life Sciences (CJPL) Vol. 6 No.1,June 2018
Covenant Journal of Physical & Life Sciences (CJPL) Vol. 6 No. 1, June, 2018
An Open Access Journal available online
First Birth Interval: Cox Regression Model with Time
Varying Covariates
Adeniyi O.I.1*
& Akinrefon A.A.2
1University of Ilorin, Kwara State,
2Modibbo Adama University of Technology, Yola, Adamawa State
* E-mail: [email protected]
Abstract: The Cox regression model has been widely used for the analysis of
time to event data with their associated risk factors, it assumes a constant
hazard ratio over time and that the risk factors are independent of time. When
the assumptions are violated, the estimates of the hazard ratio of the Cox
regression estimates of the hazard ratios becomes misleading. In this study,
we use a modified Cox regression model that incorporates time dependent
covariate which measures the interaction of exposure with time.
Birth interval between marriage and first birth for the ever married women
after marriage, taken from NDHS 2013 women data is fitted using the Cox
regression model with time varying covariates due to the failure of existence
of proportionality assumption. This model performs better compared to Cox
regression model.
Keywords: Time to event, Hazard Ratio, Time-varying covariates,
proportionality assumption
Introduction
The Cox Proportional hazard models
requires that the hazard ratio is
constant over time, which implies that
the hazard for an individual is
proportional to the hazard for any
other individual, where the
proportionality constant is independent
of time. However, the Cox
Proportional hazard model gives a
misleading conclusions when the
assumption is violated particularly in
the presence of long follow-up period.
In order to avoid misleading estimates
of the hazard ratio due to the presence
of time-dependent variables, checking
the proportionality of the hazards
assumptions should be an integral part
1

Covenant Journal of Physical & Life Sciences (CJPL) Vol. 6 No.1,June 2018
of a survival analysis by a Cox
regression model. Even though the
Cox regression model has been widely
used recent publications [1, 2 &3]
suggest that the test of the validity of
the assumptions must be verified
before its use.
To evaluate the proportional hazard
assumption, we use the residuals
measures like Schoenfeld residuals [4]
to whether the individual covariates
pass the proportional hazard
assumption and whether the model as a
whole (global test) passes the
assumption. Non-proportional hazards
can arise if some covariate only affects
survival up to sometime t or if the size
of its effect changes over time. For this
time varying covariates, the Cox
regression model with time varying
covariate is used instead of the
traditional one. We illustrate our
discussion with a study on birth
interval between marriage and first
birth for ever-married women
extracted from women data, NDHS
2013.
Methodology
Cox Proportional Hazard Model
The proportional hazards model is a
regression model with time to event as
dependent variable. It allows inclusion
of information about known
(observed) covariates in models of
survival analysis and is the most
applied model in this area. To
investigate the relation between the
survival time and some risk factors
called covariates, the Cox proportional
hazards model is used. In this model,
the relative risk is described
parametrically and the hazard function
is described non-parametrically. The
hazard function for individual i is
written as:
)exp()(h ),( 0 ii XtXth 1
h0(t) is a baseline hazard function, left
unspecified; exp(βXi) is the relative
risk of individual i with Xi as the
covariate vector. In this model,
covariates act multiplicatively on the
baseline hazard, adding additional
risks on an individual basis.
Coefficient vectors of the covariates
are estimated by maximizing a partial
likelihood function [5]. The model
parameter β are interpreted by the
hazard ratio assumed to be constant
over time which is given as;
),(ˆ
),(ˆ *
Xth
XthHR 2
Where X* is the set of predictors for
one individual and X is the set of
predictors for the other individual.
Regression models for time to event
data have been based on the Cox
regression model, which assumes that
the underlying hazard function for any
two levels of some covariates is
proportional over the time. If hazard
ratios vary with time, then the
assumption of proportional hazards is
violated, therefore methods that do not
assume proportionality must be used to
investigate the effects of covariates on
survival time. The significance of the
estimated parameter of the Cox
regression model does not implies that
the model is well fitted and satisfies
the proportional hazard assumption
and vice versa, thus, Cox proportional
hazards with time varying covariates is
used.
Cox Proportional Hazard Model
with Time Varying Covariate
In the Cox regression model, when
time-dependent variables are used to
assess the proportional hazard
assumption for time- independent
variables, the Cox regression model
2

Covenant Journal of Physical & Life Sciences (CJPL) Vol. 6 No.1,June 2018
cannot be used because it can no
longer satisfy the proportional hazards
assumption. Therefore, Cox regression
model that incorporate time-varying
covariates should be used instead. A
time-dependent variable is defined as
any variable whose value for a given
subject may differ over time (t) [6].
Given a survival analysis situation
involving both time-independent and
time-dependent predictor variables, the
Cox proportional hazard model that
incorporate both type of variables is
given as
2
0
1 1
, expip p
i i j j j
i j
h t t h t X X g t
3
Where 1 2 1, ,..., pt X X X are
the time-independent and
1 2 2, ,..., pX t X t X t time-
dependent variables. The term X t
is an interaction term between the
covariate X and some function t of
time. The hazard ratio for Cox model
with time varying covariates is given
as
1 2
*
* *
1 1
,exp
,
p p
i i i j j j
i j
h t X tHR t X X X t X t
h t X t
4
This model allows the hazard ratio to
change over time giving greater
flexibility than proportional hazards
assumption in Eq. (2).
Likelihood estimation
Like the Cox regression model,
parameters of the Cox regression
model with time varying covariates
can also be estimated by maximizing
the partial likelihood of the model.
1
exp
expj
nj
j i jl R t
X tL
X t
5
Application to data on birth interval
Dataset from the 2013 Nigeria
Demographic and Health Survey
(NDHS) were analysed. Data on
interval of marriage to first birth were
available for 26738 women aged 15-
49. The survey was designed to
provide these information at national,
regional, and state or district levels, for
both urban and rural areas. If a woman
is married but has not given birth, the
difference between her current age and
age at marriage is used and is recorded
as censored observation. We applied
the methodology of Cox regression
model to dataset on marriage to first
birth interval (which is recorded in
months).
The geopolitical zone, location of
residence, religion, highest educational
qualification, economic status,
respondent age at marriage and
working status were considered as
explanatory variables. Three categories
were created for Economic Status
variable which comes from wealth
index in NDHS data by combining
„poorest‟ and „poorer‟ as „poor‟,
„middle‟ are same as „middle‟ and
„richer‟ and „richest‟ are combined as
rich. Also, the women‟s age at
marriage was categorized into three
arbitrary group as less than 18 years
old women, 18-24 years old women
and above 24 years old women. The
two major religion being practiced
were considered as Christianity and
Islam while the highest educational
qualification are categorised as No
education, Primary, Secondary and
Higher. The geopolitical zone in the
country are North-central, North-east,
North-west, South-east, South-south
and South-west respectively while
location of residence is classified as
Urban and Rural. The working status
3

Covenant Journal of Physical & Life Sciences (CJPL) Vol. 6 No.1,June 2018
of the women as categories into
employed and nit employed.
Checking the Proportional Hazard
Assumption
To test the hypothesis that the
proportion hazard assumption is the
valid, the following statement of
hypothesis is given;
0 1 2 2: ... pH (Assumption is
valid) '
1 : at least one of the is not equal to zeroiH s
(Assumption not valid)
We use residual measures to
investigate the departure from
proportionality assumption.
Schoenfeld residuals was used to test
the assumption of proportional
hazards. Schoenfeld residuals are
usually calculated at every failure of
time under the proportional hazard
assumption, and usually not defined
for censored observation [7, 8 & 9].
The overall significance test named as
„global test‟ of the model in Eq. (3)
was performed from Schoenfeld
residual shown in Table 1. The
columns are the explanatory variables,
categories of the explanatory variables,
the Pearson correlation (rho) of scaled
Schoenfeld residual and time (Scaled
Schoenfeld residual means that it
normalizes with mean from the fitted
Cox regression model). The chisq is
the Chi-square test of scaled
Schoenfeld residual as defined by
Schoenfeld in 1982 and the
corresponding p-value are shown for
the null-hypothesis of proportionality.
Table 1: Test of Proportional Hazard Assumption
Explanatory
Variable Categories rho Chisq. p-value
Zone North-central
North-east 0.0128 3.95 0.0468
North-west 0.0725 126.84 <0.0001
South-east -0.0202 9.88 0.0017
South-south 0.0006 0.01 0.9198
South-west -0.0245 14.57 0.0001
Location of
Residence Urban
Rural 0.0025 0.15 0.6951
Highest
Educational
Qualification
No Education
Primary -0.0023 0.12 0.728
Secondary -0.008 1.59 0.2017
Higher -0.0167 6.71 0.096
Religion Islam
Christianity 0.0111 3.11 0.0778
Economic
Status Poor
Middle -0.0104 2.63 0.1047
Rich 0.0014 0.05 0.8219
4
Covenant Journal of Physical & Life Sciences (CJPL) Vol. 6 No.1,June 2018
From the p-values reported in Table 1,
it was revealed that covariates zone,
highest educational qualification,
working status and age ta marriage
showed non-proportionality character
and also the global test suggested
strong evidence of non-proportionality
(p-value <0.0001). These numerical
findings suggest a non-constant hazard
ratio for these variables. Therefore, for
the violation of proportional hazard
assumption, a Cox regression with
time varying covariate is used.
Cox Regression with time-varying
covariates
We assume that jg t t , which
implies that for each j in the model
as main effect, there is a corresponding
time dependent variable in the model
of the form *j t . The Cox
proportional hazard model with time
varying covariate is of the form
1 2
0
1 1
, exp *p p
i i j j
i j
h t X t h t X X t
6
Results
Table 2 presents the parameter
estimates of Cox proportional Hazard
model and Cox Model with time-
varying covariates. The Akaike
information criterion (AIC) [10] and
2LogL was used to select the preferred
model between the Cox proportional
hazard model and Cox Model with
time-varying covariates. The values of
the selection criteria shows that Cox
model with time-varying covariates is
preferred. Therefore, discussion of
results is upheld for the parameter
estimates from Cox model with time-
varying covariates.
Table 2: Parameter Estimates for Cox PH Model and Cox with Time-varying Covariates
Cox PH Cox with time-varying covariates
Explanator
y Variable Categories Hazard Ratio β p-value
Hazard
Ratio β p-value Hazard Ratio δ p-value
Zone
North-central
North-east 0.8614 -0.1492 <0.001 0.8434 -0.1703 <0.001 1.0012 0.0012 0.228
North-west 0.7567 -0.2788 0.001 0.6147 -0.4866 <0.001 1.0072 0.0072 <0.001
South-east 1.0628 0.0609 0.038 1.1882 0.1724 <0.001 0.9945 -0.0055 <0.001
South-south 1.0104 0.0104 0.699 1.037 0.0363 0.343 0.9985 -0.0015
0.255
Working Status Not Employed
Employed 0.0142 4.88 0.0272
Age at
Marriage
less than 18
years
18 to 24 years -0.0322 24.73 <0.0001
Above 24 years -0.0491 56.57 <0.0001
Global Test 909.4 <0.0001
5

Covenant Journal of Physical & Life Sciences (CJPL) Vol. 6 No.1,June 2018
South-west 1.2832 0.2494 <0.001 1.4023 0.3381 <0.001 0.9941 0.0059 <0.001
Location of
Residence Urban
Rural 0.9631 -0.0376 0.03 0.9623 -0.0384 0.027
Highest
Educational
Qualification No Education
Primary 1.1462 0.1365 <0.001 1.1993 0.1817 <0.001 0.9985 -0.0015 0.061
Secondary 1.1373 0.1287 <0.001 1.2151 0.9148 <0.001 0.9968 -0.0032 0.001
Higher 1.0706 0.0682 0.038 1.1858 0.1704 <0.001 0.9955 -0.0045 0.004
Religion
Islam
Christianity 0.9103 -0.094 <0.001 0.9074 -0.0972 <0.001
Economic
Status Poor
Middle 1.1123 0.1064 <0.001 1.1215 0.1147 <0.001
Rich 1.0263 0.026 0.256 1.0392 0.03845 0.093
Working
Status Not Employed
Employed 0.9941 -0.0059 0.704 0.9602 -0.0406 0.058 1.0016 0.0016 0.005
Age at
Marriage less than 18 years
18 to 24 years 1.1959 0.1789 <0.001 1.3711 0.3156 <0.001 0.9938 -0.0062 <0.001
Above 24 years 0.9696 -0.0309 0.267 1.3497 0.2999 <0.001 0.9841 -0.016 <0.001
-2LogL 441976.52 441202.68
AIC 442051.52 441232.68
From Table 2, the results for the time
varying covariates has it that the
estimated hazard ratio for women for
North-east
is exp 0.1703 0.0012HR t ,
which implies that the estimated
hazard ratio will increase
exponentially by 0.0012 as the time
increases compare to women form the
North-central zone. Also, the hazard
ratio for North-west women increases
by 0.0072 as time increases while it
decreases by 0.0015 and 0.0059 for
women for South-south and South-
west as time increases compare to
women from the North-central. The
hazard ratio decreases with time as the
educational qualification improves by
0.0015, 0.0032 and 0.0045 for
primary, secondary and higher
educational qualification respectively
compared to women with no formal
education. The hazard ratio for
employed women increases by 0.0016
as time increases compare to women
who are unemployed while the hazard
decreases with time by 0.0062 and
0.016 for women whose age at
marriage are between 18 to 24 years
and above 24 years respectively.
For the covariates that are not time
varying, the hazard ratio decreases by
0.0377 for women living in the rural
areas compare to women living in the
urban areas. The hazard ratio
decreased by 0.0926 for Christian
women compare to Muslim women
while the hazard increase by 0.2115
and 0.3922 for the middle and rich
6

Covenant Journal of Physical & Life Sciences (CJPL) Vol. 6 No.1,June 2018
economic status compare to the poor
status.
Conclusion
Cox regression model been the most
popular approach in analysing survival
data may give misleading estimates if
the underlying assumptions are
validated. The power of the tests is
reduced for the covariates which are
not satisfying the proportionality
assumption. Once it is established that
the assumptions are not valid, a Cox
model that incorporate time-varying
covariates will give a better estimate of
the parameter. From the study carried
out on birth interval between marriage
using dataset from 2013 Nigeria
Demographic and Health Survey
(NDHS), it was revealed that factors
like geopolitical zone, highest
educational qualification, working
status and age at marriage were time-
varying among other factors that were
considered to affect the interval of
marriage time to first birth of women.
The interest of the study is to found
out the covariate that are time-
dependent and fit an appropriate
survival model to predict the hazard
ratios
References
Ata, N. A. (2007). Cox regression
models with non-proportional
hazards applied to lung cancer
survival data. Hacettepe Journal
of Mathematics and Statistics
36, 157-167.
Bellera, C. A. P. (2010). Variables
with time-varying effects and the
Cox model: some statistical
concepts illustrated with a
prognostic factor study in breast
cancer. BMC Medical Research
Methodology 10: 20.
Rahman, A and Hosque, R (2015).
Fitting Time to First Birth Using
Extended Cox Regression Model
in Presence of Non-proportional
Hazard. Dhaka University.
Journal of Science 63(1): 25-30
Schoenfeld, D. (1982). Partial
residuals for the proportional
hazards regression model.
Biometrika 69, 239-241.
Cox, D. R. (1972). Regression models
and life-tables. Journal of the
Royal Statistical Society. Series
B (Methodological), 187-220.
Kleinbaum, D.G. and Klein, M.
(2005). Survival Analysis: A
Self-Learning Text. Springer.
Stablein, D., Carter, W., and Novak, J.
(1981). Analysis of survival data
with non-proportional hazard
functions. Control Clinical
Trials 2: 149–159.
Grambsch, P. M. (1994). Proportional
hazards tests and diagnostics
based on weighted residuals.
Biometrika 81, 515-526.
Schoenfeld, D. (1980). Chi-squared
goodness-of-fit tests for the
proportional hazards regression
model. Biometrika 67, 145-153.
Akaike, H. (1974). A new look at the
statistical model identification.
IEEE Transactions on Automatic
Control 19: 716-723.
7

Covenant Journal of Physical & Life Sciences (CJPL) Vol. 6 No.1,June 2018
Covenant Journal of Physical & Life Sciences (CJPL) Vol. 6 No. 1, June, 2018
An Open Access Journal available online
Hepatoprotective Potential and Histological Studies of
Effects of Celosia Argentea L. on Paracetamol-Induced
Liver Damage
Dokunmu T. M.1* Oyelade I. F.,
2 Ogunlana O. O.,
1 Bello, O. A.,
2
Ezekiel O. M.1 & Oladele F. W.
1
1Department of Biochemistry, Covenant University,
Ota, Ogun State, Nigeria 2Department of Biological Sciences, Covenant University,
Ota, Ogun State, Nigeria
Abstract: Celosia argentea L. is a common vegetable known to possess
anti-oxidative and other therapeutic properties. This study evaluates the
hepatoprotective activities and histological effects of aqueous extract of
Celosia argentea L. on acetaminophen-induced liver damage in rats,
compared to the effects of a standard drug –silymarin. Twenty-five male
rats were used in this study. These were divided into five groups of five
animals each. Animals in group 1 were given 1ml/kg body weight (b.w)
distilled water (control [C]), group 2 were given 100mg/kg b.w silymarin
for 4 days plus acetaminophen for 3 days [SL], groups 3 and 4 were given
250 and 500mg/kg b.w aqueous extract of C. argentea for 4 days plus
acetaminophen for 3 days (CA1 and CA2, respectively) and group 5 were
given 1 ml/kg b.w. distilled water for 4 days and 1g/kg b.w acetaminophen
(PCM) for 3 days. Serum alanine aminotransferase (ALT), aspartate
aminotransferase (AST), alkaline phosphatase (ALP) and total bilirubin
activities were assessed on day 8, values of mean and standard error were
compared at significance level of p < 0.05. Overall, mean ALT, AST and
ALP levels in CA2 (21.8 ± 1.4, 84.2 ± 8.2 and 175.9 ± 36.9 U/L,
respectively) was lower than PCM group and similar to SL group (37.6 ±
3.9, 97.2 ± 5.2 and 151.1 ± 21.91, respectively, p > 0.05). Mean values in
control group were similar to CA2 but significantly lower than PCM and
CA1. Total bilirubin was higher but not significantly different compared to
8

Covenant Journal of Physical & Life Sciences (CJPL) Vol. 6 No.1,June 2018
C group, suggesting a lack of effect on total bilirubin. C. argentea
ameliorates and protects against acetaminophen-induced liver damage in
rats, with a comparable effect with silymarin at a dose of 500mg/kg b.w. A
regular consumption of the vegetable can play a role in sustaining health
and can be used in place of long term therapy in individuals with
compromised liver or actively exposed to chemotherapeutic drugs with
adverse effects on liver.
Keywords: Celosia argentea, liver damage, silymarin, hepatoprotective
Introduction
Liver diseases which include liver
cirrhosis, fibrosis, liver cancer,
hepatitis etc. are common causes of
death worldwide [1] and have been
linked to a number of factors which
include excess alcohol intake,
metabolic syndromes, hepatitis B and
C infection, free radicals, overdose of
non- steroidal anti-inflammatory
drugs, chemicals such as carbon
tetrachloride (CCl4), halothane etc.
Liver injury caused by chemicals and
drugs is a major toxicological issue
due to limited therapeutics for this
condition without side effects.
Medicinal plants have been
acknowledged as a rich source of bio-
actives for prevention and treatment of
ailments [2]. They serve as alternative
for medicines with little side effects
and are good sources for development
of new drugs for safe treatment of
diseases.
Treatment of diseases with high doses
of some drugs e.g. antibiotics,
acetaminophen, methotrexate, is often
associated with toxicity causing
hepatic damage [3]. As a result of this
shortcoming, research is directed
towards discovery and use of active
chemicals from medicinal plants which
are commonly consumed foods that
produce protective and therapeutic
effects, demonstrating comparable
outcomes with standard drugs and
showing minimal side effects [4].
Studies are required to screen
commonly consumed indigenous
vegetables for their antioxidative and
protective properties to serve as
natural remedies for many ailing
individuals. Medicinal plants have
made significant contributions to the
prevention and treatment of
hepatotoxicity [5] one of which is
Celosia argentea.
Celosia argentea L. is a vigorous,
broad leaf, edible annual vegetable
belonging to the family
Amaranthaceae. It is popularly called
silver cock‟s comb in English, shoko
in Yoruba, Lagos spinach in Lagos,
Nigeria. It is grown as edible vegetable
and also for medicinal uses in Africa,
Southeast Asia and other regions of the
world [6]. Many bioactive compounds
such as flavonoids, carotenoids,
polyphenols and vitamins have been
identified in C. argentea, which confer
many biological properties due to their
free radical scavenging activities [7].
Hepatoprotective properties have been
reported from other regions using
ethanolic extracts on CCl4 or
paracetamol-induced liver damage [7-
9]. Root, stem and leaves of C.
argentea have also been reportedly
used for rapid healing of wounds,
immune-stimulating, curing of kidney
stones, antipyretic, antioxidant,
anticancer, diuretic and antibacterial
and anti-hepatotoxic effects, [10].
The aim of this study is to investigate
the hepatoprotective effects of C.
argentea L. in its edible form (aqueous
9

Covenant Journal of Physical & Life Sciences (CJPL) Vol. 6 No.1,June 2018
extract) on paracetamol-induced liver
damage in rats and compare these
effects with a standard drug –
silymarin.
Materials and Methods
Plant materials: Celosia argentea
fresh leaves were acquired from the
local market at Ota in Ogun State.
Plant identification was carried out by
a botanist in the Department of
Biological Sciences, Covenant
University. The fresh leaves were
washed to remove dust particles and
air dried for three weeks after which
they were blended into fine powder
using a blender. Forty grams of the
powdered leaves was put in a 500ml
conical flask and 320ml of distilled
water was added, and the mixture was
left for 24hours and was filtered using
a whatman No. 1 filter paper to obtain
the filtrate. The mash obtained was
again reconstituted in 320ml of
distilled water and the maceration was
repeated. The combined filtrate was
then evaporated under reduced
pressure at 80oC in a rotary evaporator
and the crude extract was obtained
with a yield of 5g.
Experimental animals: Male albino
rats with a mean weight of 140g were
obtained from a commercial animal
house and kept in clean cages and
placed in a well- ventilated room at the
animal house of the Department of
Biological Sciences, Covenant
University, Ogun State, Nigeria at
optimum temperature and relative
humidity. They were acclimatized to
the laboratory condition for one week
and were given food and water ad
libitum. All animals were treated in
accordance with the recommendations
of National Institute of Health (NIH)
guidelines for the care and use of
laboratory animals [11].
Study groups: The rats (n = 25) were
divided into 5 groups of five animals
in each group. The animals in group
1(C) served as normal control group
and were given only vehicle (distilled
water, 1ml/kg b.w.) for 7 days, animals
in group 2(SL) served as positive
control and were given Silymarin
(100mg/kg b.w.) for 4 days and PCM
for 3 days, group 3(CA1) and 4(CA2)
received 250 and 500mg/kg b.w
aqueous extract of C. argentea
respectively for 4 days plus
paracetamol on days 5 – 7. Group 5
(PCM) served as the negative control
and were administered with only
vehicle (1ml/kg b.w.) for 4 days plus
paracetamol (1g/kg b.w.) on days 5 –
7.
Blood collection and preparation of
tissue sample: Animals were
anaesthetized 24hours after the last
treatment on the 7th day with diethyl
ether prior to dissection and blood
samples were collected through
cardiac puncture into lithium
heparinized bottles for aspartate
aminotransferase (AST), alkaline
phosphatase (ALP), alanine
aminotransferase (ALT) and total
bilirubin (TB) assays. Serum was
obtained by centrifuging the blood at
4000 rpm for 15 minutes into 2ml
tubes and stored at -20oC until required
for the assays. The liver was excised
and washed in normal saline (0.9%
NaCl) and a portion fixed in 10%
formaldehyde for histopathological
examination.
Analysis of biochemical parameters:
Commercial test kits for AST, ALT,
ALP and total bilirubin (Randox®
Laboratories, United Kingdom) were
purchased and used for liver function
tests following the protocol from the
10
Covenant Journal of Physical & Life Sciences (CJPL) Vol. 6 No.1,June 2018
supplier‟s specifications from the
standard kits.
Histological analysis: A section of the
liver was fixed in 10 % formalin
immediately after sacrifice. The fixed
liver sections were embedded in
paraffin, 5-6µm thick liver section was
stained in hematoxylin-eosin; this was
examined under compound
microscope for determination of
histopathological changes
Statistical analysis
Data is presented as mean ± standard
error of mean (SEM) for continuous
data and was compared using one way
ANOVA followed by Least square
difference (LSD) post hoc test, all test
of significance was taken at p˂0.05.
Results
Twenty five healthy animals with
mean weight of 140g on day 0 were
used for the experiment. There was no
significant difference in the weight of
the animals after treatment on day 7
(p˃0.05). There was also no change in
the physical appearance of the animals.
Effects of treatment on liver
function tests
The mean values of 2 doses of Celosia
argentea on serum alkaline
phosphatase, aspartate
aminotransferase, alanine
aminotransferase and total bilirubin in
the experimental animals are shown in
figures 1 - 4. There was a significantly
higher serum AST level in group CA1
105.18±7.26 U/L, this was similar to
group PCM with mean value of
113.11±6.20 compared to control
group with a mean value of
84.58±11.22 (p˂0.05). The
corresponding mean and SEM values
in group CA2 (84.21±8.25) was
similar to SL (97.24±5.23) and control.
Figure 1 shows the serum AST levels
in all groups after treatment.
There was also a significantly higher
serum ALP level in group PCM with a
mean value of 385.02±38.62 compared
to the control group with a mean value
of 128.34±20.7 U/L, indicating liver
damage. Animals in group SL, CA1
and CA2 had significantly lower mean
values of 151.11±29.92, 226.32±33.67
and 175.95±36.94U/L respectively.
Mean values of groups SL and CA2
were similar (p>0.05). Figure 2 shows
the ALP levels in all groups after
treatment.
Similarly, there was a significantly
higher serum ALT level in group PCM
with a mean value of 55.40±3.48 U/L.
The corresponding values in Groups
SL, CA1 and CA2 are 37.60±3.93,
30.00±5.69 and 21.80±1.49 U/L
respectively. The result is shown in
figure 3. There was no significant
change in the total bilirubin of the
animals in groups CA1 and CA2
suggesting that the plant has no
significant effect on total bilirubin
(figure 4).
Histological analysis
The liver of control rats (figure 5)
showed hepatocytes arranged in plates,
a fibrocollagenous connective tissue
stroma without necrosis or any area of
infiltration by lymphocytes. This is in
contrast with the features observed in
the animals in group PCM (figure 6)
that shows infiltration of the portal
tracts and interface by lymphocytes
(Portal & Interface Hepatitis),
presence of necrosis within which are
cellular debris, extensive bile
regurgitation i.e. cholestasis and bile
ductular proliferation. However, the
animals in groups CA1 (figure 7)
showed infiltration of portal tracts with
small areas of necrosis while animals
in groups CA2 (figure 8) and SL
(figure 9) showed similar features of
11

Covenant Journal of Physical & Life Sciences (CJPL) Vol. 6 No.1,June 2018
infiltration of portal tracts without any areas of necrosis.
0
25
50
75
100
125C
CA1
CA2
SL
PCM
AS
T(U
/L)
Figure 1: Histogram showing changes in AST mean values (with SEM) in the experimental
animals after treatment
0
50
100
150
200
250
300
350
400
450C
CA1
CA2
SL
PCM
AL
P(U
/L)
Figure 2: Histogram showing changes in ALP mean values (with SEM) in the experimental
animals after treatment
12

Covenant Journal of Physical & Life Sciences (CJPL) Vol. 6 No.1,June 2018
0
10
20
30
40
50
60C
CA1
CA2
SL
PCM
AL
T (
U/L
)
Figure 3: Histogram showing changes in ALT mean values (with SEM) in the experimental
animals after treatment
0
10
20
C
CA1CA2
SL
PCM
tota
l b
ilir
ub
in (
µm
ol/
l)
Figure 4: Histogram showing changes in total bilirubin mean values (with SEM) in the
experimental animals after treatment.
13

Covenant Journal of Physical & Life Sciences (CJPL) Vol. 6 No.1,June 2018
Figure 5: Control group showing hepatocytes (light arrow) arranged in plates within a
fibrocollagenous connective tissue stroma (Haematoxylin & Eosin stain, x 40
magnification).
Figure 6: PCM group showing bile ductular proliferation (light arrows) within the portal
tract (Haematoxylin & Eosin stain, x 100 magnification)
14

Covenant Journal of Physical & Life Sciences (CJPL) Vol. 6 No.1,June 2018
Figure 7: CA1 showing lymphocyte aggregation (light arrow) in the interface
(Haematoxylin & Eosin stain, x 100 magnification).
15

Covenant Journal of Physical & Life Sciences (CJPL) Vol. 6 No.1,June 2018
Figure 8: CA2 showing florid lymphocyte infiltration (light arrow) within the interface
{interface hepatitis} (Haematoxylin & Eosin stain, x 100 magnification).
Figure 9: Silymarin group showing infiltration of lymphocytes (light arrow) within the
interface {interface hepatitis} (Heamatoxylin & Eosin stain, x 100 magnification).
Discussion
Medicinal plants have been
acknowledged as a rich source of bio-
actives for prevention and treatment of
ailments [2]. The ability of any
medicinal plant to ameliorate harmful
effects or restore physiologic state of
hepatocytes after exposure to a
hepatotoxic agent makes it a
hepatoprotective plant. The results
obtained from this study is in
conformity with induced liver damage
previous literatures with overdose of
acetaminophen [12-13] as evidenced
by the increased activities of serum
ALT, ALP, AST and total bilirubin
compared to animals that were not
treated with the toxic doses of the
drug. Acetaminophen-induced liver
damage is marked by hepatocellular
necrosis and leads to an increase in the
activities of serum ALT, AST, ALP
and total bilirubin [14]. The increased
level of serum ASP and ALT indicates
loss of functional integrity of liver cell
membrane and cell leakage and ALP is
related to functioning of the
hepatocytes and its increased level in
the serum indicates obstructive
jaundice and intra-hepatic cholestasis
[15].
Liver is a vital organ of the body that
plays important roles in metabolism of
xenobiotics, endogenous compounds,
and is involved in many biochemical
processes thus receives the most
toxicological assault resulting from
oxidative stress. Necrosis of the liver
cells is one of the most common
effects of paracetamol toxicity [16].
The pathogenesis of liver damaged has
been shown to be due to highly
16

Covenant Journal of Physical & Life Sciences (CJPL) Vol. 6 No.1,June 2018
reactive metabolite, N-acetyl-p-
benzoquinone imine (NAPQ1) formed
in excess as well as other oxidants e.g.
nitric oxide which covalently binds to
cysteine residues of proteins to form
adducts, in hepatic centrilobular cells
that develop into necrosis [17]. This
occurs in the presence of oxidative
stress.
Oxidative stress, a condition in which
there is an imbalance between the
concentrations of reactive oxygen
species (ROS) and physiological
antioxidants, resulting in oxidative
damage to many biomolecules within
the cell. It is well established as a
major risk factor for the development
of several diseases including
atherosclerosis, liver diseases,
cardiovascular disease, cancer, etc.
The histology results of the liver in
acetaminophen treated animals showed
necrosis, infiltration of portal tracts by
inflammatory cells, cholestasis.
However animals pre-treated with
500mg/kg aqueous extract of C.
argentea were protected against
necrosis by acetaminophen. The
biochemical assays also corroborate
this finding showing reduced serum
ALT, AST and ALP activities in CA2
group. The results are in agreement
with previous studies which reported
that ethanolic extracts of Celosia
argentea seeds or plant exhibited
similar hepatoprotective activity
against carbon tetrachloride-induced
and paracetamol-induced
hepatotoxicity in rats [8-9].
Silymarin, a flavonoid containing drug
is known to protect against liver
diseases [13, 18] at a dose range of 25
to 200mg/kg b.w. The
hepatoprotective effect of C. argentea
was demonstrable at a dose of
500mg/kg b.w and this was similar to
effects observed in silymarin group,
however there was very limited effect
when administered at 250mg/kg b.w.
Leaf extract of C. argentea contains
phytochemicals such as alkaloids,
saponins, flavonoids and tanins [9, 19].
These hepatoprotective potentials are
indeed due to abundant
phytochemicals in the plant but studies
are needed to determine the actual or
combination of phytochemicals
responsible for the hepatoprotective
activity observed.
This in turn can be increased in newly
developed drugs to enhance their
activities.
It can be concluded from our studies
that Celosia argentea has
hepatoprotective property in a dose-
dependent manner and with
comparable effect with silymarin, a
standard drug for treating liver
diseases. It is highly recommended
that Celosia argentea should be
included regularly in diets for
prevention of liver diseases and
toxicity of the liver because of the
proven health benefits. It is also
readily available as an indigenous
vegetable that is relatively cheap and
shows no toxic effects compared to
treatment with standard drugs.
References 1. World Health Organisation (2016).
Global health estimates 2015:
Deaths by cause, age, sex, by
country and by region, 2000-
2015. Geneva, Switzerland:
World Health Organisation.
2. Varsha, K., Amit, K. N. and
Abhinav, A. (2011).
Hepatoprotective prospective of
herbal drugs and their vesicular
carriers– a review.
International Journal of
17
Covenant Journal of Physical & Life Sciences (CJPL) Vol. 6 No.1,June 2018
Research in Pharmaceutical
and Biomedical Sciences 2:
360-374.
3. Mehta, N., Ozick, L. A. and
Gbadehan, E. (2016). Drug-
induced hepatotoxicity. (Ed)
Pinsky, M. R. Available at
http://emedicine.medscape.com
/article/169814-overview
4. Salama, S. M., Abdulla, M. A.,
Alrashdi, A. S., Alkiyumi, S. S.
and Golbabapou, S. (2013).
Hepatoprotective effect of
ethanolic extract of Curcuma
longa on thioacetamide induced
liver cirrhosis in rats. BMC
Complementary and Alternative
Medicine 13(1): 56.
5. Manoj, S., Mohanty, P. K. and
Jaliwala, Y. A. (2011).
Hepatoprotective activity of
fruits of Prunus domestica.
International Journal of
Pharmacy and Biological
Science 2: 439–453.
6. Yarger, L. (2007). Lagos Spinach.
ECHO Technical Note.
Available at www.echonet.org.
Retrieved 29th May 2017
7. Surse, S. N., Shrivastava, B.,
Sharma, P., Gide, P. S. and
Sana, A. (2014). Celosia
cristata: Potent
pharmacotherapeutic herb – A
review. International Journal
of Pharmaceutical and
Phytopharmacological
Research 3: 444-446
8. Jain, G. C. (2005). Hepatoprotective
activity of ethanolic extract
Celosia argentea Linn. Seeds in
rats. Journal of Phytochemical
Research 18: 87-90.
9. Haribabu, S. and kumaAdupa, S.
(2014). Phytochemical
screening and hepatoprotective
activity of Celosia argentea
Linn. Journal of Pharmacy
Research 8(3): 405-409
10. Rajni, B. R. and Deokule, S. S.
(2013). Pharmacognostic and
phytochemical investigation of
Celosia argentea Linn.
International Research Journal
of Pharmacy 4(6): 138-144.
11. National Institute of Health (1985).
Guide for the care and use of
laboratory animals. US.
Department of Health
Education and Welfare. NIH
Publication No. 85-123.
12. Arumugam, A., Gunasekaran, N.
and Perumal, S. (2015).
Hepatoprotective effect of leaf
extracts from Citrus hystrix and
C. maxima against paracetamol
induced liver injury in rats.
Food Science and Human
Wellness 4: 35–41.
13. Sabiu, S., Sunmonu, T. O., Ajani,
E. O. and Ajiboye, T. O.
(2015). Combined
administration of silymarin and
vitamin C stalls
acetaminophen-mediated
hepatic oxidative insults in
Wistar rats. Revista Brasileira
de Farmacognosia 25: 29–34.
14. Yousef, M. I., Omar, A. M., El-
Guendi, M. I. and Abdelmegid,
L. A. (2010). Potential
protective effects of quercetin
and curcumin on paracetamol-
induced histological changes,
oxidative stress, impaired liver
and kidney functions and
haematotoxicity in rat. Food
and Chemical Toxicology
48(11): 3246–3261.
15. Adebayo, A. H., Abolaji, A. O.,
Kela, R., Oluremi, S. O.,
Owolabi, O. O. and Ogungbe,
18

Covenant Journal of Physical & Life Sciences (CJPL) Vol. 6 No.1,June 2018
O. A. (2011). Hepatoprotective
activity of Chrysophyllum
albidum against carbon
tetrachloride induced hepatic
damage in rats. Canadian
Journal of Pure and Applied
Sciences 5(3): 1597-1602.
16. Bessems, J. G. and Vermeulen, N.
P. (2001). Paracetamol
(acetaminophen)-induced
toxicity: molecular and
biochemical mechanisms,
analogues and protective
approaches. Critical Review in
Toxicology 31(1): 55-138.
17. Roberts, D. W., Bucci, T. J. and
Benson, R. W. (1991).
immunohistochemical
localization and quantification
of the 3-(cysteine-s-yl)-
acetaminophen protein adduct
in acetaminophen toxicity.
American Journal of Pathology
138: 359-371.
18. Feher, J. and Lengvel, G. (2012).
Silymarin in the prevention and
treatment of liver diseases and
primary liver cancer. Current
Pharmaceutical Biotechnology
13: 210–217.
19. Okpako, E. and Ajibesin, K.
(2015). Antimicrobial Activity
of Celosia argentea L.
Amaranthaceae. American
Journal of Research
Communication 3(5): 123-133.
19
Covenant Journal of Physical & Life Sciences (CJPL) Vol. 6 No.1,June 2018
Covenant Journal of Physical & Life Sciences (CJPL) Vol. 6 No. 1, June, 2018
An Open Access Journal available online
Itaconic Acid Production from Date Palm (Phoenix
Dactylifera L) Using Fungi in Solid State Fermentation
Ajiboye A. E.,1* Adedayo M. R.,
1 Babatunde S. K.,
1
Odaibo D. A.,2 Ajuwon I. B.
1 & Ekanem, H. I.
1
1College of Pure and Applied Sciences,
Department of Biosciences and Biotechnology,
Kwara State University, Malete, P.M.B. 1530, Ilorin,
Kwara State, Nigeria. 2University of Ilorin Teaching Hospital,
Ilorin, Kwara State. Nigeria
*[email protected]; [email protected]
Abstract: This study evaluates the potentials of Phoenix dactylifera L (Date
fruits) as possible alternative raw materials for itaconic acid production
using naturally occurring fungi. Date fruit (pulp) was used as a substrate in
solid state fermentation for the production of itaconic acid using naturally
occurring fungus.The date fruit (pulp) was de-capped from its seed
manually with the aid of a knife and dried in an oven at 60 0C and was
grounded using an Excella Mixer grinder. The fungus used was naturally
isolated by fermentation of substrate (date pulp) and was identified as
Aspergillus niger. Proximate analysis was carried out on the substrate using
standard methods. Parameters such as substrate concentration, inoculum
size and fermentation period were varied using standard methods to
determine its effect on itaconic acid production. Assay for itaconic acid
production was carried out using standard methods at a wavelength of
385nm. Amount of itaconic acid produced was derived by translation of
absorbance values on the itaconic acid curve. The substrate had a high
carbohydrate content of 72.29%. The fermentation results showed
maximum production of itaconic acid of 20.75±0.25mg/ml using 40g
substrate, 15.13±1.13mg/ml using 2 ml inoculums size of spore suspension
(2×10⁵
spores/ml) and a maximum yield of 16.88±0.13mg/ml at day 1 of
20

Covenant Journal of Physical & Life Sciences (CJPL) Vol. 6 No.1,June 2018
fermentation period. On optimization with 40g substrate and 2 ml
inoculums for 3 days a maximum yield was observed at day 2 of
fermentation with a maximum yield of 25.00±1.00mg/ml. The highest
acidic level throughout the fermentation period was observed to be at pH
4.2. From the study it was concluded that date pulp is a promising substrate
and could be utilized by Aspergillus niger for the production of itaconic
acid.
Keywords: Phoenix dactylifera L solid state fermentation, itaconic acid,
Aspergillus niger
Introduction Organic acids have diverse
applications in various fields
especially in the industries. They
include lactic acids, citric acid,
gluconic acid and itaconic acid
manufactured by large-scale
bioprocesses [1]. Among them, the
Itaconic acid (methylene succinic acid)
is one of the most prominent one. It is
a colorless, crystalline carboxylic acid
obtained by the fermentation of
polysaccharides [2]. Various
microorganisms such as fungi of the
genus Aspergillus have been employed
in itaconic acid production through
fermentative processes [3]. The most
prolific producer being Aspergillus
terreus which has been frequently
utilized for itaconic acid production
and subjected to grow under
phosphate-limited conditions [4, 5] In
the industrial production of itaconic
acid, the culture medium is optimized
for optimum production and the
carbon source mainly used is glucose
or sucrose which is readily available
[6]. Other species of Aspergillus such
as A. niger has also been employed for
itaconic acid production. Itaconic acid
is applied primarily in the polymer
industry where it is employed as a co
monomer for certain products [1]. Its
derivatives are used in medicine and
cosmetic preparation. The polymerized
esters of itaconic acid are used as
adhensives, coatings plastics, and
elastomers [7]. An N-
vinylcaprolactam-containing
copolymer of acrylic itaconic acid [8]
and poly (acrylic acid-co-itaconic acid)
[9] was developed to be used in
mechanical and functional GICs.
These products are increasingly used
in clinical dentistry [10].
The biosynthesis of itaconic acid was
not understood for a long time because
it was not certain whether itaconic acid
emanated from the tricarboxylic acid
(TCA) cycle or from a different
pathway via citramalate or the
transition step via the condensation of
acetyl-CoA [11-13]. Bentley and
Thiessen [14] suggested a pathway for
the biosynthesis of itaconic acid; the
breakdown of glucose to pyruvate via
glycolysis. This pathway was
confirmed by tracer experiments with 14
C and 13
C labeled substrates [14-16])
and also the necessary enzymatic
activities have been proposed [11, 15].
In recent times, itaconic acid was
detected in mammalian cells, where it
was found in macrophage-derived cells
[16]. However, no specific gene
encoding this enzymatic activity has
been identified and its hysiological
role in mammalian cells is still
unknown. According to the studies of
[16] there are speculations on the role
of itaconic acid as an inhibitor of
metabolic pathways, because it is
described as an enzymatic inhibitor.
21

Covenant Journal of Physical & Life Sciences (CJPL) Vol. 6 No.1,June 2018
Itaconic acid is widely employed to
prepare resins used in emulsions
coating, leather coating, coatings for
car, refrigerators and other electrical
appliances to improve adhesion, color
and weather resistance [2]. Thus the
need to produce itaconic acid attracts
much attention. Various agro-
industrial wastes can be fermented for
the production of itaconic acid. Date
palm (Phoenix dactylifera L) a tropical
and subtropical tree, belonging to a
family Palmae (Arecaceae) is one of
the oldest plants cultivated. There is an
alarming increase in the worldwide
production, utilization and
industrialization of dates [17]. Many
date fruit producing countries are
increasing its production annually.
Date fruit have potential for use in
production with economical
advantages [18]. Date fruits have high
nutritional value due to their high
sugar content (around50–60%),
potassium (2.5 times more than
bananas), calcium, magnesium and
iron as well as vitamins B1 & B2 and
Niacin. Furthermore, dates are rich in
the monosaccharides: glucose and
fructose. Date fruits are considered as
very nutritious and they contribute to
human health especially when
consumed with other food constituents
[19, 20]. In Solid-state fermentation
(SSF), microorganisms grow on solid
materials without the presence of free
liquid [21], the process occurs in
absence or near absence of free water
by employing a natural substrate or
inert substrate as carbon source and
solid support [22]. Date pulp has
potentials for use in industries for acid
production with economic advantages.
However at the point of transportation,
due to mechanical damage during
harvesting or mishandling fruit may
spoil or may be damaged making it
unsuitable for consumption and this
damaged fruits instead of being a
waste can be made useful in an
industrial process. Hence this study is
designed towards total utilization of
date fruit (date pulp) for the
fermentative production of itaconic
acid. Scope for value addition using
bioprocessing, fermentation with
microorganism and increasing yield of
itaconic acid by varying various
parameters needed to obtain maximum
production of itaconic acid.
Materials and Methods
Sample collection and preparation:
Date fruit was bought from Zango area
in Ilorin, Kwara State. The fruit was
identified at the Plant Biology
Department, University of Ilorin,
Nigeria as Phoenix dactylifera. L The
pulp was separated from the seed
manually with the aid of a knife, pulp
was oven dried at 60 0C and was
ground to powder using an Excella
mixer grinder and preserved in an
airtight container.
Isolation and preservation of test
organism: Date fruit (Phoenix
dactylifera L) pulp was subjected to
natural fermentation. Ten grams of
grinded fruit pulp substrate was put in
a sterile plastic container and mixed
thoroughly with 10 mls of distilled
water. A clean muslin cloth was then
used to cover the plastic for
fermentation to take place for 7 days at
28 0C [23, 24]. After 5 days, 1g of
fermented substrate was weighed,
serial dilution was carried out and 1 ml
of the dilutions was plated out. The
isolated fungus was characterized and
identified macroscopically and
microscopically [25, 26, 27] as
Aspergillus niger.
22
Covenant Journal of Physical & Life Sciences (CJPL) Vol. 6 No.1,June 2018
Preparation of spore suspension:
Wild type Aspergillus niger was
grown on sabouraud dextrose agar
slant at 28 0C for 7 days. The spore
inoculum was prepared by adding 3 ml
of sterile distilled water to each slant
containing the cultured fungi and
slants were shook for one minute.
Number of spores was counted to be
2×10⁵ spores/ml [28].
Preparation of fermentation salts:
To four conical flasks containing 100
ml of distilled water each, 0.1g of
(0.25% (w/v) NH4cl, 0.095% (w/v)
KH2PO4, 0.0088% (w/v) MgSO4, and
0.0004% (w/v) CUSO4) was weighed
into each conical flask respectively
and was stored in an airtight bottle
prior to use.
Preparation of bromine reagent:
One milliliter of bromine, 3.00g of
potassium bromide, 1.87g of
potassium chloride, 48.50 ml of 1N
hydrochloric acid, and 500 ml of water
was used in the preparation of the
bromine reagent as used by Fredkin
[29]; El Imam et al. [30]. Reagent was
preserved in an amber reagent bottle.
Solid state fermentation: Varying
grams of dried and grinded date pulp
was weighed into a 250 ml Erlenmeyer
flask, 2 ml of each salts (0.25% (w/v)
NH4cl, 0.095% (w/v) KH2PO4,
0.0088% (w/v) MgSO4, and 0.0004%
(w/v) CUSO4) were added. Water was
added according to varying substrate
water holding capacity. Flasks were
corked with cotton wool wrapped with
foil paper. Flasks were sterilized in an
autoclave at 121 0C for 15 minutes and
were allowed to cool. On cooling,
substrates were inoculated with spore
suspension of Aspergillus niger and
incubated at 28 0C. One gram of
sample was taken on daily basis to
assay for production of itaconic acid
using a spectrophotometer.
Assay for itaconic acid: Into a 3 ml
curvette, was dispensed 0.3 ml of
bromine reagent using a micropipette
and was made upto 1.0 ml with
distilled water, HCl at pH 1.2 was
added to make upto 3.0 ml and left for
15 minutes. After 15 minutes
spectrophotometer was blanked at
385nm. Into another 3 ml Beckman
cuvette was added 0.3 ml of bromine
reagent using a micropipette, 1.0 ml of
sample and HCl at pH 1.2 to a volume
of 3.0 ml. After 15 minutes the change
in optical density was read at 385nm,
wavelength of maximum absorption of
bromine was also read. Readings were
repeated in 20 minutes to ascertain that
reaction is completed (Friedkin, 1945).
Proximate analysis of Date pulp
(Phoenix dactylifera. L):
Determination of moisture content, ash
content, crude protein content, crude
lipid content, crude fibre and total
carbohydrate content were determined
according to the method of A.O.A.C
[31]
Optimization of parameters used
during the period of fermentation:
The optimum conditions during
fermentation were determined by
varying parameters such as period of
incubation (fermentation days),
substrate concentration and inoculum
size.
Effect of varying fermentation days:
Fermentation days were varied for ten
days. Twenty gram of substrate (Date
pulp powder) was weighed into ten
250 ml Erlenmeyer flasks and this
process was carried out in duplicates. 2
ml of each Salts (0.25% (w/v) NH4cl,
0.095% (w/v) KH2PO4, 0.0088% (w/v)
MgSO4, and 0.0004% (w/v) CUSO4)
were added and 20 ml of distilled
23

Covenant Journal of Physical & Life Sciences (CJPL) Vol. 6 No.1,June 2018
water was added to the content in
flasks. Flasks were cotton plugged and
autoclaved at 121 0C for 15 minutes.
They were inoculated with 2ml of
spore suspension and were incubated
at 28 0C for 10 days. pH readings and
assay for itaconic acid were carried out
in duplicates on a daily basis.. One
gram of the substrate was dissolved in
100 ml of distilled water and filtered
using a Whatman filter paper. Filtrate
was used to assay for production of
itaconic acid at 24 hours interval.
Quantity of itaconic acid was derived
by translating from the itaconic acid
curve.
Effect of varying inoculum size:
Twenty grams of substrate (Date pulp
powder) was weighed into 250 ml
Erlenmeyer flasks. Twenty milliliters
of distilled water was added, cotton
plugged and autoclaved at 121 0C for
15 minutes. After cooling, the flasks
were inoculated with 1, 2, 3, 4, 5, and
6 ml of spore suspension (2×10⁵
spores/ml) of A. niger incubated at 28 0C for 6 days. They were assayed for
itaconic acid on a daily basis as
described above
Effect of varying substrate
concentration: Different substrate
concentrations of the date fruit pulp
were also analysed by weighing 10,
15, 20, 25, 30, 35 and 40g of the
substrate into 250 ml Erlenmeyer
flasks. Fermentation salts were added
along side with distilled water
according to varying water holding
capacity. Flasks were sealed and
autoclaved at 121 0C for 15 minutes
and were allowed to cool. After
cooling 2 ml of spore suspension
(inoculum) was added to each flask
and flasks were incubated at 28 0C for
6 days. Daily pH readings and assay
for itaconic acid were carried out as
described above. Filtrate was used to
assay for production of itaconic acid at
24 hours interval. Quantity of itaconic
acid was derived by translating from
the itaconic acid curve.
Statistical analysis: The data obtained
was analyzed statistically using one
way ANOVA. Post-Hoc test using the
Duncan Multiple Range test (DMRT)
was used to test for the means that are
significantly different from each other.
A level of significance was determined
at p<0.05. Statistical package (SPSS
20) was used.
Results
The results as shown in these study
shows that Date fruit (pulp)(Phoenix
dactylifera. L) have the tendency of
being used as a substrate in the
production of Itaconic acid through
solid state fermentation by naturally
occurring Aspergillus niger isolated
from the natural fermentation of Date
pulp (Phoenix dactylifera. L). Table 1
shows the proximate composition of
Date pulp (Phoenix dactylifera. L).
Proximate composition of Date pulp
The proximate composition of Date
pulp (Phoenix dactylifera. L) as shown
in Table 1 depicts that carbohydrate
have the highest value of 72.29% and
Ash content have the lowest value of
2.00%.
Effect of varying fermentation
period on itaconic acid production
by Aspergillus niger
The effect of varying fermentation
period of Date pulp for the production
of Itaconic acid by naturally occurring
Aspergillus niger are presented in
Table 2. In the fermentation, Date pulp
showed the highest yield of
16.88±0.13mg/ml of itaconic acid at
day 1followed by day 2 which had a
yield of 15.38±0.38mg/ml of itaconic
acid and had the lowest yield of
24

Covenant Journal of Physical & Life Sciences (CJPL) Vol. 6 No.1,June 2018
12.75±0.75mg/ml of itaconic acid on
day 9.
Effects of varying inoculum size on
itaconic acid production by
Aspergillus niger
The effect of varying inoculum size of
Date pulp for the production of
Itaconic acid by naturally occurring
Aspergillus niger are presented in
Table 3. In the fermentation, 2 ml
showed the highest yield of
15.13±1.13mg/ml of itaconic acid at
day 6 and had the lowest yield of
12.00±0.00mg/ml on day 2 of
fermentation.
Effect of varying substrate
concentration on itaconic acid
production by Aspergillus niger The effect of varying substrate
concentration of Date pulp for the
production of Itaconic acid by
naturally occurring Aspergillus niger
are presented in Table 4. In the
fermentation, 40g of the substrate
showed the highest yield of
20.75±0.25mg/ml of itaconic acid at
day 1 followed by day 2 which had a
yield of 18.88±0.13mg/ml and had the
lowest yield of 14.88±0.13mg/ml on
day 4.
Optimum production of itaconic
acid by Aspergillus niger using Date
pulp (Phoenix dactylifera L)
Optimum production of itaconic acid
from all the fermentation parameters
by Aspergillus niger was carried out
with 40g substrate, 2 ml of inoculum
size for 3 days at 28 0C for maximum
yield of Itaconic acid and this is shown
in Table 5. In the fermentation, day 2
showed the highest yield of
25.00±1.00mg/ml of itaconic acid and
there was a decrease in day 1 and 3.
pH values of varying the
fermentation period of the
fermenting substrate by Aspergillus
niger
The pH of the fermenting substrate for
the fermentation period was taken at
an interval of 24 hours. Figure 1 shows
the chart representing the fermentation
period and as observed the highest
acidity was observed to be at pH 4.3.
pH values of varying inoculum size
of the fermenting substrate by
Aspergillus niger
The pH of the fermenting substrate for
the inoculum size was taken at an
interval of 24 hours. Figure 2 shows
the chart representing the inoculum
sizes with highest acidic level of pH
4.2.
pH values of varying the substrate
concentration of the fermenting
substrate by Aspergillus niger
The pH of the fermenting substrate for
the substrate concentration was taken
at an interval of 24 hours. Figure 3
shows the chart representing the
substrate concentration with highest
acidic level of pH 5.4.
Discussion
The results as shown in this study
show that Date pulp (Phoenix
dactylifera L) have the tendency of
being used as a substrate in the
production of Itaconic acid through
solid state fermentation by naturally
occurring Aspergillus niger isolated
from the natural fermentation of Date
pulp (Phoenix dactylifera L). The
proximate composition of Date pulp
reveals that carbohydrate content was
highest while the Ash content had the
lowest value (Table 1). The high
carbohydrate content in the pulp serves
as a source of sugar to be utilized by
the fungi in the fermentation process
for optimum production of itaconic
acid. This agrees with earlier reports of
the importance of polysaccharides in
25
Covenant Journal of Physical & Life Sciences (CJPL) Vol. 6 No.1,June 2018
fermentation [32, 33]. However,
carbohydrates that are easily
metabolized have been found essential
for good production of organic acid
[34]. Naturally occurring fungi,
Aspergillus niger growing on
fermented Date pulp have the potential
of producing itaconic acid which can
be used in industries. This is similar to
the work of Ajiboye and Sani [35], that
A. niger was one of the naturally
occurring fungus during fermentation
of Dialium guineense for citric acid
production. However Aspergillus
terreus still remains the main producer
of itaconic acid [1].
Varying of fermentation period
showed gradual decrease by every 24
hours. As shown in Table 2, it was
observed that day 1 had the highest
yield of itaconic acid while day 9 had
the lowest yield. This could be due to
oxygen and nutrient depletion, more so
it could be due to the gradual decrease
in the amount of sugar present in the
fermenting medium as the
fermentation process progresses. The
difference in the sugar content and
surface area of the starting materials
for the fermentation process could
account for slight difference in sugar
consumption pattern of the systems.
This is contrary to the findings of Rafi
et al. [36] who observed an increase in
itaconic acid production with increase
in time of incubation showing
maximum yield at day 5. When
varying inoculum size, the maximum
yield of itaconic acid as shown in
Table 3, was observed on day 6 of
fermentation with 2 ml having the
highest yield and 6ml had the lowest
yield on the same day. This could be
because lower inoculum size result in
lower number of cells in the
fermentation medium thereby needing
a longer time to grow to the level
required to utilize the substrate so as to
give desired product [37]. However,
there was a decrease in 6 ml which
was the highest concentration. This
could be due to high spore density
thereby leading to rapid consumption
of available nutrient leaving limited
nutrient for utilization for the
production of itaconic acid. This is
contrary to the work of Chandragiri
and Sastry [38] who observed that
maximum production of itaconic acid
was obtained with 5 ml of inoculum
size of Ustilago maydis.
In varying substrate concentration
there was a high yield of itaconic acid
at day 1 of fermentation for all
substrate concentrations with 40g
having the highest yield of itaconic
acid and the lowest yield was observed
on day 4 of fermentation except for
substrates concentrations 10g and 15g
which had their lowest yield on day 6
of fermentation as shown in Table 4.
From the result it was observed that
the higher the concentration of the
substrate the higher the yield. This
result is similar to that of Chandragiri
and Sastry [38] who obtained
maximum production of itaconic acid
on 35% concentration of pure glucose
and also concurs with the findings of
El Imam et al. [30] who obtained
maximum production of itaconic acid
on 40% concentration of Jatropha
Curcas seed cake.
On optimization, Aspergillus niger
was able to utilize the high substrate
concentration 40g and 2 ml inoculums
size to produce optimum amount of
itaconic acid on day 2 of fermentation
as shown in Table 5. This agrees with
the findings of El Imam et al. [30] who
obtained maximum production of
itaconic acid on 40% concentration of
26

Jatropha Curcas seed cake. The
substrates acidic level increased at 24
hours interval with day 3 having its
acidic level at pH 4.2 as shown in
Figure 5. This is also similar to the
findings of El Imam et al. [30] who
obtained the highest yield of itaconic
acid at pH 4. pH is one of the most
important parameters that affects the
production of itaconic acid by
fermentation as shown in Figure 1-4 it
can be deduced that the highest acidity
level throughout the fermentation
period was at pH 4.2. This is close to
the findings of Rao et al. [39] and
Chandragiri and Sastry [38] who
reported the highest production of
itaconic acid at pH 3.5 and 3
respectively and it is also similar to the
findings of El Imam et al. [30] who
obtained the highest yield of itaconic
acid at pH 4. From the parameters
varied as shown in Table 2-4, it was
observed that the substrate being a
source of sugar has the ability to
produce itaconic acid through
fermentation by Aspergillus niger.
This is in line with the findings of
Wilke and Vorlop [5] who observed
that itaconic acid is achieved by the
fermentation with Aspergillus niger on
a sugar containing media.
Conclusion From this study it can be deduced that
date fruit, one of the most nutritive
fruit is an ideal substrate for the
production of organic acids (Itaconic
acid) employing solid state
fermentation. As observed in the study
Aspergillus niger, was able to utilize
the sugar available in the substrate to
produce high quantity of itaconic acid
in solid state fermentation. High yield
of itaconic acid was shown to depend
on the concentration of the substrate,
the fermentation period (days) and
inoculum size.
Table 1: Proximate Composition of Date Pulp (Phoenix dactylifera. L)
Proximate composition Values (%)
Ash Content
Moisture Content
Crude Protein
Crude Fiber
Crude Fat
Soluble Carbohydrate
2.00
6.00
4.37
9.41
5.93
72.29
27

Covenant Journal of Physical & Life Sciences (CJPL) Vol. 6 No.1,June 2018
Table 2: Effect of Fermentation Period on the production of Itaconic acid from Date pulp
(Phoenix dactylifera. L) by Aspergillus niger
Quantity of Itaconic acid (mg/ml)/ Fermentation Period (days)
Fermentation
Period (days)
Values
1 16.88±0.13e
2 15.38±0.38d
3 15.13±0.13cd
4 14.00±0.50b
5 14.25±0.25bc
6 13.50±0.00ab
7 13.75±0.25ab
8 13.13±0.13ab
9 12.75±0.75a
10 13.50±0.00ab
Values represented in the table are
means of two replicate readings and
standard error of means of Itaconic
acid produced in milligram released
from milliliter of the substrate as
derived from translation of absorbance
values using the Itaconic acid standard
curve. Values within the column
having different superscripts are
significantly different at p<0.05
Table 3: Effect of Inoculum size on the production of Itaconic acid from Date pulp (Phoenix
dactylifera. L) by Aspergillus niger
Quantity of Itaconic acid (mg/ml)/ Inoculum size (ml)
Days
Inoculum
Size(ml)
1 2 3 4 5 6
1
2
3
4
5
6
14.25±0.25b
13.00±0.50a
14.50±0.00b
12.75±0.25a
12.75±0.25a
12.50±0.00a
12.75±0.25ab
12.00±0.00a
12.75±0.25ab
13.00±0.50b
13.00±0.00b
12.75±0.25ab
12.00±0.50a
13.25±0.75abc
14.25±0.25c
14.00±0.00bc
12.75±0.25abc
12.25±0.75ab
13.75±0.25a
13.25±0.25a
13.25±0.75a
13.75±0.75a
12.63±0.13a
12.88±0.13a
12.75±0.75a 14.88±0.38a
13.00±0.50a 15.13±1.13a
13.38±0.63a 14.75±0.25a
13.50±1.50a 15.00±0.00a
12.38±0.38a 13.75±0.25a
12.00±0.00a 13.25±0.25a
28

Covenant Journal of Physical & Life Sciences (CJPL) Vol. 6 No.1,June 2018
Values represented in the table are
means of two replicate readings and
standard error of means of Itaconic
acid produced in milligram released
from milliliter of the substrate as
derived from translation of absorbance
values using the Itaconic acid standard
curve. Values within the same column
having different superscripts are
significantly different at p<0.05
Table 4: Effect of Substrate concentration on the production of Itaconic acid from Date pulp
(Phoenix dactylifera. L) byAspergillus niger
Quantity of Itaconic acid (mg/ml)/ Substrate Concentration (g)
Days
Substrate
Conc.(g)
1 2 3 4 5 6
10
15
20
25
30
35
40
19.63±0.63a
20.50±0.50a
19.13±1.13a
19.50±0.50a
19.00±0.75a
19.00±1.00a
20.75±0.25a
17.63±0.13a
17.00±0.50a
17.50±0.25a
17.13±0.13a
16.88±0.13a
16.75±0.25a
18.88±0.13b
16.75±0.25a
16.25±0.25a
17.38±0.63a
16.63±0.13a
16.63±0.13a
17.13±0.38a
17.38±0.63a
15.25±0.00c
14.75±0.25c
15.25±0.25c
13.75±0.25ab
14.00±0.00b
13.25±0.25a
14.88±0.13c
16.13±0.13ab 14.63±0.63ab
15.63±0.63ab 13.25±0.25a
16.00±1.00ab 17.75±0.25bc
15.50±1.00ab 16.00±1.50abc
16.50±0.50b 15.63±0.63abc
14.00±0.00 a 14.50±0.00ab
15.00±0.00ab 18.50±2.00c
Values represented in the table are
means of two replicate readings and
standard error of means of Itaconic
acid produced in milligram released
from milliliter of the substrate as
derived from translation of absorbance
values using the Itaconic acid standard
curve. Values within the same column
having different superscripts are
significantly different at p<0.05
29
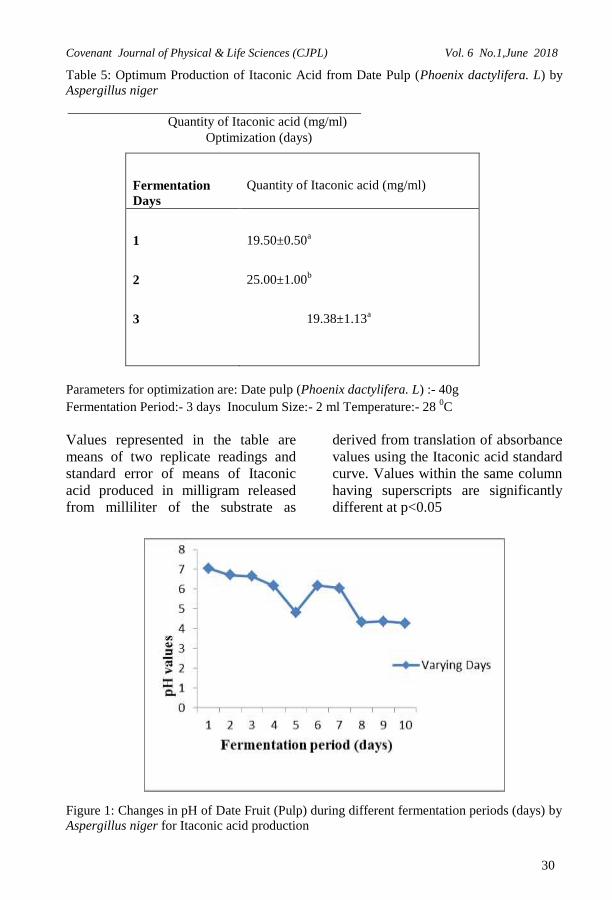
Covenant Journal of Physical & Life Sciences (CJPL) Vol. 6 No.1,June 2018
Table 5: Optimum Production of Itaconic Acid from Date Pulp (Phoenix dactylifera. L) by
Aspergillus niger
Quantity of Itaconic acid (mg/ml)
Optimization (days)
Fermentation
Days
Quantity of Itaconic acid (mg/ml)
1 19.50±0.50a
2 25.00±1.00b
3 19.38±1.13a
Parameters for optimization are: Date pulp (Phoenix dactylifera. L) :- 40g
Fermentation Period:- 3 days Inoculum Size:- 2 ml Temperature:- 28 0C
Values represented in the table are
means of two replicate readings and
standard error of means of Itaconic
acid produced in milligram released
from milliliter of the substrate as
derived from translation of absorbance
values using the Itaconic acid standard
curve. Values within the same column
having superscripts are significantly
different at p<0.05
Figure 1: Changes in pH of Date Fruit (Pulp) during different fermentation periods (days) by
Aspergillus niger for Itaconic acid production
30

Covenant Journal of Physical & Life Sciences (CJPL) Vol. 6 No.1,June 2018
Figure 2: Changes in pH of different inoculums sizes of Aspergillus niger during
fermentation of Date fruit (pulp) for production of Itaconic acid.
Figure 3: Changes in pH of different concentrations of Date fruit (pulp) during fermentation
by Aspergillus niger for Itaconic acid production
31

Covenant Journal of Physical & Life Sciences (CJPL) Vol. 6 No.1,June 2018
Figure 4: Changes in pH for Optimization of Date fruit (pulp) during fermentation by
Aspergillus niger for itaconic acid production
References 1 Menon, V. and Rao,M. (2012,)
Trends in bioconversion of
lignocellulose: Biofuels,
platform chemicals and
biorefinery concept. Prog.
Energ. Combust. 38:522-550. 2 Iqbal, M. and Saeed, A. (2005).
Letters in Applied Microbiology
40 (3): 178–182.
3 Helia, H. and Wan, M.Y. (2015).
Itaconis acid production of
microorganism. Current
Journal of Biological Sciences
7 (2): 37-42.
4 Roehr, M. and Kubicek, C. P.
(1996). Further Organic Acids.
2nd Edn., In: Roehr, M. (Ed.),
Biotechnology: Products of
Primary Metabolism. VCH
VerlagsgesellschaftmbH 6:
364-379.
5 Willke, T. and Vorlop, K. D. (2001).
Biotechnological production of
itaconic acid. Appl. Microbiol.
Biotechnol. 56: 289-295.
6 Menon, V. and Rao, M. (2012).
Trends in bioconversion of
lignocellulose: Biofuels,
platform chemicals and
biorefinery concept.
Prog.Energ.Combust. 38:522-
550.
7 Mitsuyasu, O., Dwiarti, L., Shin, K.
and Enoch, P. Y. (2009).
Biotechnological production of
itaconic acid and its
biosynthesis in Aspergillus
terreus. Appl. Microbiol.
Biotechnol. 84: 597-606.
8 Moshaverinia, A., Roohpour, N.,
Darr, J. A. and Rehman, I. U.
(2009). Synthesis and
characterization of a novel N-
vinylcarrolactam-containing
acrylic acid terpolymer for
application in glass-ionomer
dental cements. Acta Biomater.
5:2101-2108.
9 Culbertson, B.M. (2006). New
polymeric materials for use in
32

Covenant Journal of Physical & Life Sciences (CJPL) Vol. 6 No.1,June 2018
glass ionomer cements. J. Dent.
4:556-565.
10 Okabe, M., Lies, D., Kanamasa, S.
and Park, E. (2009).
Biotechnological production of
itaconic acid and its
biosynthesis in Aspergillus
terreus. Appl. Microbiol.
Biotechnol. 84:597-606.
11 Matthias, G., Steiger, M. L.,
Blumhoff, D.M. and Michael,
S. (2013). Biochemistry of
microbial itaconic acid
production. Frontier in
microbiology
12 Bentley, R. and Thiessen, C. P.
(1957). Biosynthesis of
itaconicacidinAspergillusterreu
s. III. The propertiesand
reaction mechanism of
cisaconiticacid decarboxylase.
J. Biol.Chem. 226: 703–720.
13 Winskill, N. (1983). Tricarboxylic
acidcycle activity in relation to
itaconicacid biosynthesis by
Aspergillus terreus. J. Gen.
Microbiol. 129: 2877–2883.
14 Bonnarme, P., Gillet, B., Sepulchre,
A. M., Role, C., Beloeil, J. C.
and Ducrocq, C. (1995).
Itaconate biosynthesis in
Aspergillus terreus. J.
Bacteriol. 177: 3573–3578.
15 Jaklitsch, M., Kubicek, P., Scrutton,
C., London, C., Road, C. H.
and London, W. (1991). The
subcellular organization of
itaconate biosynthesis
Aspergillus terreus. J. Gen.
Microbiol. 137: 533–539.
16 Strelko, C. L., Lu, W., Dufort, F.
J., Seyfried, T. N., Chiles, T. C.
and Rabinowitz, J. D. (2011).
Itaconic acid is a mammalian
metabolitei nduced during
macrophage activation. J. Am.
Chem. Soc. 133:16386–16389.
17 FAOSTAT.http://faostat.fao. org/
DesktopDefault.aspx?PageID=
339&lang=en&country=194
accessed on 23.12.2012. 2010
18 Al-Hooti, S., Sidhu, J. S., Al-
Otaibi, J., Al-Ameeri, H. and
Qabazard, H. (1997).
Processing quality of important
date cultivars grown in the
United Arab Emirates for jam,
butter and dates-in-syrup.
Adv.Food Sci. 19: 35–40.
19 Lambiote, B. (1982). Some aspects
of the role of dates in human
nutrition. Proceedings of the
First International Symposium
on Date palm. King Faisal
University, Saudi Arabia,
March 23–25.
20 Chandrasekaran, M. and Bahkali,
A.H. (2013). Valorization of
date palm (Phoenix dactylifera)
fruit processing by-product and
waste using bioprocess
technology- Review. Saudi
Journal of Biological Sciences
20: 105-120.
21 Bhargav, S., Panda, B. P., Ali, M.
and Javed, S. (2008). Solid-
state Fermentation: An
Overview. Chem. Biochem.
Eng. Q. 22 (1):49–70.
2 Kumar, D., Jain, V. K., Shanker, G.
and Srivastava, A. (2003).
Process Biochem. 38: 1731.
23 Lawal, T. E., Iyayi, E. A. and
Aderemi, F. A. (2005).
Biodegradation of groundnut
pod with extracted enzymes
from some isolated tropical
fungi: growth responses and
carcass quality of broilers
finisher birds. Proceedings of
33

Covenant Journal of Physical & Life Sciences (CJPL) Vol. 6 No.1,June 2018
Annual Conf Animal Sci. Ass.
Of Nig. (ASAN). pp. 109-112.
24 Kayode, R. M. O. and Sani, A.
(2008). Physicochemical and
proximate composition of
mango (Mangifera indica)
kernel cake fermentedwith
monoculture of fungal isolates
obtained from naturally
decomposed mango kernel. Life
Science Journal 5(4): 55 – 63.
25 Raper, K. B. and Fennell, D. I.
(1965). The genus Aspergillus.
William and Wilkins,
Baltimore.
26 Ainsworth, G. C., Sparrow, F. K.
and Sussman, A. S. (1973). The
fungi – an advanced treatise: A
taxonomic review with
keys.Ascomycetes and fungi
imperfecti, Academic Press,
New York, pp. 621.
27 Gilman, J. C. (2001). A manual of
soil fungi. Oxford & IBH
Publishing Corporation, New
Delhi, India.
28 Kuforiji, O. O., Kuboye, A. O. and
Odunfa, S. A. (2010). Orange
and pineapple wastes as
potential substrates for citric
acid production. International
Journal of Plant Biology 1(1): .
29 Fredkin, M. (1945). Determination
of itaconic acid in fermentation
liquors. Ind. Eng.Anal.Ed Anal.
Ed 17(10): 637-638.
30 El-Imam, M. A., Kazeem, M. O.,
Odebisi, M. B., Oke, M. A. and
Abidoye, A. O. (2013).
Production of itaconic acid
from Jatropha curcas seed cake
by Aspergillus terreus. Not Sci
Biol. 5(1): 57-61.
31 A.O.A.C. (2000). Official Method
of Analysis. 16th Edition.
Association of Official
Analytical Chemist. Washinton
D.C.
32 Xu, D. B., Madrid, C. P., Rohr, M.
and Kubicek, C. P. (1989). The
influence of type and
concentration of the carbon
source on production of citric
acid by Aspergillus niger. Appl
Microbiol Biotechnol.
30(6):553–558.
33 Amenaghawon, N. A., Areguamen,
S. O., Agbroko, N. T., Ogbeide,
S. E. and Okieimen, C. O.
(2013). Modelling and
Statistical Optimisation of
Citric Acid Production from
Solid State Fermentation of
Sugar Cane Bagasse Using
Aspergillus niger. International
Journal of Sciences Research
Article, 2.
http://www.ijSciences.com
2013.
34 Max, B., Salgado, J. M., Rodríguez,
N., Cortés, S., Converti, A. and
Domínguez, J. M. (2010).
Biotechnological production of
citric acid. Braz. J. Microbiol.
41 (4):
35 Ajiboye, A. E. and Sani, A. (2015).
Fermentation of the fruit pulp
of Dialium guineense for citric
acid production using naturally
occurring fungi. International
Journal of Current
Microbiology and Applied
Sciences. 4(7): 432 – 440.
36 Rafi, M. M., Hanumanthu, M. G.,
Rao, M. D. and Venkateswarlu,
K. (2014). Production of
Itaaconic acid by Ustilago
maydis from agro wastes in
solid state fermentation. J.
Biosci. Biotech 3(2):163-168.
34

Covenant Journal of Physical & Life Sciences (CJPL) Vol. 6 No.1,June 2018
37 Saxena, R. and Singh, R. (2011).
Amylase Production by Solid
State Fermentation of agro-
industrial wastes using Bacillus
sp. Braz J Microbial. 42
(4):1334-1342.
38 Chandragiri, R. and Sastry, R. C.
(2011). Synthesis of itaconic
acid using
Ustilagomaydis.Canadian J
Chem Eng Technol 2(7):128-
135.
39 Rao, D. M., Jaheer, S. M. D.,
Rangadu, P. V., Subramanyam,
K., Sivarama, K. G. and
Swamy, A. V. N. (2007).
Fermentative production of
itaconic acid by Apergillus
terreus using Jatropha seed
cake. Afr J Biotechnol.
6(18):2140-2142.
35

Covenant Journal of Physical & Life Sciences (CJPL) Vol. 6 No.1,June 2018
Covenant Journal of Physical & Life Sciences (CJPL) Vol. 6 No. 1, June, 2018
An Open Access Journal available online
Ciprofloxacin Susceptibility Pattern in a Secondary
Health Care Facility in Kebbi State, Nigeria
Ajibola, O.,1* Aliyu, B.
1 & Usman, K.
2
1Department of Microbiology, Federal University Birnin Kebbi,
Kebbi State, Nigeria 2Department of Microbiology, Aisha Muhammad Buhari General Hospital,
Jega, Kebbi State Nigeria
*[email protected], [email protected]
Abstract: Antibiotic resistance is a major challenge in management of
infectious diseases globally, and particularly in developing countries. There
are few studies that have analysed the impact of such abuse on the
development of bacterial resistance in Nigeria and sub Saharan Africa. To
this end, we retrospectively analysed ciprofloxacin susceptibility patterns in
a secondary healthcare facility in Northwest Nigeria over a four year period.
Three hundred and thirty six pathogens isolated from 370 patients were
analysed in this study. The common pathogens isolated from wound
infections were Staphylococcus aureus (29, 7.84%), Pseudomonas spp (10,
2.7%) and Proteus spp (7, 1.89%). In stool samples, Proteus (11, 2.97%),
Escherichia coli (8, 2.2%) and Salmonella (6, 1.62%) were the most
commonly isolated organisms respectively. While for urine samples,
isolates were S. aureus (105, 28.37%) followed by E. coli from urine
samples (62, 16.76%). During the study period, we observed there was a
high degree of resistance to ciprofloxacin among Proteus spp (50%), E. coli
(41.3%), S. aureus (20.6%), Klebsiella (20%) and Pseudomonas (20%).
Government and stakeholders need to urgently develop antimicrobial
stewardship programmes that will address the issue of antibiotic resistance
in the country.
36
Covenant Journal of Physical & Life Sciences (CJPL) Vol. 6 No.1,June 2018
Key words: Fluoroquinolones, antibiotic resistance, ciprofloxacin, bacteria,
Nigeria
Introduction
The use of antibiotics in clinical
practice represents one of the
tremendous achievements in the
control of infectious diseases.
However, the effectiveness of
antibiotics has been reduced by an
increasing threat of
bacterial resistance. Antibiotic
resistance (ABR) is the ability of
bacteria to survive
in antibiotic concentrations that would
normally inhibit or kill the bacteria[1].
ABR has emerged as one of the
greatest challenges for clinical
microbiologists and healthcare
practitioners worldwide
today[2].Globally, deaths from
antibiotic resistant bacteria are
estimated to be around 700,000
annually, and projected to rise to 10
million deaths by 2050[3].
Fluoroquinolones are among the most
frequently prescribed antimicrobial
agents worldwide, since the expiry of
the patent on this class of drugs. The
European Antimicrobial Resistance
Surveillance Network (EARS-Net
report, indicates a significant increase
in fluoroquinolone resistance across
Europe since 2001, with levels ranging
from 7% to 53% in 2007[4].
Fluoroquinolones, derivatives of
quinolones are stable, orally
administrable, broad spectrum agents
used to treat a range of bacterial
infections. A commonly prescribed
fluoroquinolone in developing
countries is ciprofloxacin which has
broad spectrum activity in treatment of
complicated and uncomplicated
bacterial infectionsin several
anatomical sites, such as respiratory
tract infections, otitis media, sinusitis,
eye infections, UTI and sepsis [5]. For
close to two decades, fluoroquinolones
were antibiotics of choice for acute
respiratory, enteric and urinary tract
infections as well as serious systemic
infections such as bacteremia[6]. The
frequent prescription of these drugs by
healthcare providers, indiscriminate
antibiotic use and substandard drugs in
developing countries including Nigeria
has contributed to the continued spread
of ABR to fluoroquinolones[7].
Quinolone resistance in enterobacteria
ceae is well documented, and is
usually the result of chromosomal
mutations leading to alterations in
target enzymes or drug
accumulation[8]. Single nucleotide
polymorphisms in the quinolone
resistance determining regions
(QRDR) of gyrA and parC, two of the
genes that encode DNA gyrase and
topoisomerase IV respectively, can
lead to conformational changes in
these enzymes that prevents
quinolones from binding but still
preserve their enzymatic
function[9,10]. Mutations in the
QRDRs of gyrA and parC are the most
commonly documented quinolone
resistance mechanisms, but resistance
is also known to be conferred by
mutations in the second topoisomerase
gene, pare [11]. Quinolone resistance
can also be acquired horizontally
through transferable aac(6')-Ib or
quinolone resistance (qnr) DNA.
AAC(6')-Ib encodes a ciprofloxacin
acetylating enzyme, while the product
of qnr inhibits quinolones binding to
target proteins [12]. More recently,
however, plasmid-mediated
quinolone resistance has been reported
in K. pneumoniae and E. coli,
37
Covenant Journal of Physical & Life Sciences (CJPL) Vol. 6 No.1,June 2018
associated with acquisition of the qnr
gene[8,10,13]. Other ABR
mechanisms in bacteria include
alteration of cell permeability, site of
action of the antibiotic or the release of
degrading enzymes[14,15]
In resource poor settings, poor
infrastructure, lack of trained
laboratory personnel and weak
surveillance for ABR contributes to
the spread of ABR bacteria. In Nigeria,
as with most of SSA there are very few
published reports on ABR to
fluoroquinolones [6,16], with no
published report from Northwest
Nigeria. To this end, this study aimed
to retrospectively
analyseciprofloxacinsusceptibility
patterns of commonly isolated bacteria
in a secondary health care facility in
Kebbi state, Northwest Nigeria.
Materials and Methods
Ethical approval: This study did not
carry out any invasive procedures and
patients‟ clinical information was not
revealed to the researchers. Ethical
approval for use of data was granted
by the management of Aisha
Muhammadu Buhari General Hospital,
Jega, Kebbi State Nigeria.
Setting: Jega local government area
(LGA) is one of the twenty-one LGAs
in Kebbi state belonging to the
Gwandu emirate. Jega LGA has a
projected population based on 2006
census of 270,517, comprising mostly
muslims, farmers and other low
income earners. Jega has only one
General hospital (AMBGH) and two
private hospitals that provide basic
health care services.
Aisha Muhammadu Buhari General
Hospital (AMBGH): AMBGHhas an
80 bed capacity and serves a rural
population from villages and
settlements within Jega LGA. The
hospital provides services in diagnosis,
curative, promotive and rehabilitative
services in medical treatment and an
outpatient clinic. AMBGH is staffed
by one physician supported by fifteen
nurses and midwives, and a
microbiology laboratory led by a
qualified laboratory scientist. The
facility has minimal laboratory
facilitiesand can only carry out urine,
stool, sputum culture, microscopy,
biochemical, immunological tests,
HIV screening and tuberculosis
testing.
Sample collection: This was a
retrospective study of the data on
fluoroquinolone resistance patterns
carried out in Jega local government
area (LGA), Kebbi state, Northwest
Nigeria, at the department of
microbiology of (AMBGH), Jega,
Kebbi State Nigeria. All microbiology
reports for urine, stool, vaginal swabs
and wound samples between June
2014 and September 2017 were
included for analysis. For this study,
we excluded data with incomplete
sensitivity results, and all samples for
microbiological analysis were referred
to the laboratory by the physician.
Microbiological analyses: Patients
referred to the microbiology laboratory
by the physician were provided with
labelled specimen bottles and trained
on how and when to provide samples
for laboratory diagnosis. All samples
brought to the laboratory were
immediately processed following
standard bacteria culture procedures.
Biochemical characterization of
isolates was carried out under the strict
supervision of a medical laboratory
scientist licensed by the Medical and
Laboratory Science Council of Nigeria
(MLSCN). Antibiotic susceptibility
38

Covenant Journal of Physical & Life Sciences (CJPL) Vol. 6 No.1,June 2018
testing was carried out following the
Clinical Laboratory Standards Institute
(CLSI) guidelines [27]. In this study,
we report the rates of susceptibility
and resistant isolates. AMBGH
microbiology laboratory is regularly
subjected to external audits by the
MLSCN to assess the state of the
facility for providing routine
diagnostic services.
Statistics: Data were accumulated and
analysed with Microsoft excel and
Stata version 12 software (College
Station, Texas, USA) to generate
differential descriptive statistics
including frequency tables thatshowed
the frequency and percentage
distribution of isolates.
Results
Demographics
In total three hundred and seventy
patients were sampled at the
microbiology laboratory of AMBGH
between June 2014 and September
2017. For the study period reviewed,
the ratio of male to female sampled
was 0.47:1.0, and the median age of
the children was 10 yrs (IQR, 15 yrs)
and that of adults was 35 yrs (IQR, 21
yrs) respectively (Table 1).
Bacteria spectrum
In total 336 isolates were included
within the study period reviewed.
There were no significant differences
(P=0.09) in the isolates collected
among children or adults (Table 2).
The most frequent isolate was
Staphylococcus aureus from urine
samples (105, 28.37%) followed by
Escherichia coli from urine samples
(62, 16.76%). From wound infections
the most frequent isolate was S. aureus
(29, 7.84%), followed by
Pseudomonas spp (10, 2.7%) and
Proteus spp (7, 1.89%). In stool
samples, Proteus (11, 2.97%), E. coli
(8, 2.2%) and Salmonella (6, 1.62%)
were the most commonly isolated
organisms respectively (Table 3).
Other samples such as sputum and
high vaginal swabs revealed S. aureus
to be the main pathogenic organism
isolated in culture.
Antibiotic susceptibility
Next we assessed the proportion of
isolates that were not susceptible to
ciprofloxacin from antibiotic
sensitivity tests carried out using the
disk diffusion method. During the
study period, we observed there was a
high degree of resistance to
ciprofloxacin among Proteusspp
(50%), E. coli (41.3%), S. aureus
(20.6%), Klebsiella (20%) and
Pseudomonas (20%) respectively.
Susceptibility to ciprofloxacin by the
isolates was highest in Salmonella
(71.4%), S. aureus (65.2%), Klebsiella
(60%), Pseudomonas (60%), E. coli
(41.3%), and Proteus (40%)
respectively. Other isolates within the
study period reviewed demonstrated
intermediate level susceptibility (Table
4).
Discussion
In developing countries, antibiotics use
without prescription due to their
availability over the counter appears to
be the norm, in addition to sub-optimal
health care systems that lack the
capacity to provide timely laboratory
results for clinicians to make decisions
with. These issues and others promote
the rapid increase in the spread of
antibiotics resistant bacteria in
resource poor settings. Here we review
four year microbiological data from a
secondary health care facility in a rural
area in Northwest Nigeria. This was
carried out in order to provide valuable
laboratory information for clinicians
39
Covenant Journal of Physical & Life Sciences (CJPL) Vol. 6 No.1,June 2018
and health care practitioners on the
pattern of ciprofloxacin susceptibility,
in the absence of routine antibiotic
resistance surveillance activities. Our
data suggests that the most commonly
isolated pathogen from samples and
swabs analysed was S. aureus,
followed by E. coli. Our findings also
revealed a high degree of ciprofloxacin
resistance in the isolates, with Proteus
spp demonstrating most resistance
(50%), followed by E. coli(41.3%). In
a five year retrospective study carried
out in Bahia, Brazil a high degree of
ciprofloxacin resistance was observed
in community acquired urinary tract
infection isolates from the participants.
Ciprofloxacin resistance was highest in
E. coli isolates, with up to 36% of the
isolates in a particular year being
resistant[17]. In a retrospective study
in Gabon, ciprofloxacin resistance of
24.1% was also reported in E. coli[18].
Quinolone resistance has also been
reported in Cameroon from S. Typhi
and Ghana inVibrio cholerae
respectively [19,20]. Studies on
fluoroquinolones resistance in Africa,
including Nigeria are very scarce. The
few published papers on
fluoroquinolones resistance in Nigeria
clearly suggest the circulation of
ciprofloxacin resistant bacteria in the
country[16,21–25]. In a study carried
out in Minna, north central Nigeria, the
authors found that Salmonella enterica
serovar Typhi were resistant to
commonly prescribed antibiotics
ceftriaxone, cefuroxime, amoxicillin,
ampicillin, ciprofloxacin, and
augmentin[26]. The increase in
treatment failures to β-lactams and
sulfamethoxazole+trimethoprim over
the past years led to the use of
fluoroquinolones as the first choice,
hence putting pressure on the use of
this drug as first line therapy for most
bacterial infections.
The review of microbiological data
from the secondary health care facility
in this study reveals an alarming trend
of ciprofloxacin resistance in the
population. Our study also provides
local ABR data which could be used
by clinicians in the region to guide
clinical decisions. Ciprofloxacin, a
broad spectrum antibiotic is widely
used in management of infections in
developing countries. Our study
suggests the need to establish
surveillance for ABR in Nigeria and
Africa in general, replicating the
approach of the European
Antimicrobial Resistance Surveillance
Network
(http://ecdc.europa.eu/en/activities/sur
veillance/ EARS-
Net/Pages/index.aspx), which monitors
antibiotic consumption in comparison
to spread of resistance. In developing
countries, the challenge of managing
the spread of ABR is enormous, owing
to lack of good sanitation practices,
lack of potable water, poor hygiene,
high poverty levels, illiteracy and sub-
optimal healthcare systems. Hence,
there is a need for African
governments to have short term goals
that will produce significant results in
dealing with the menace of ABR.
This study has some limitations, first is
the inability of the health facility
considered in this study to carry out
blood culture to isolate pathogens in
the blood of patients. Lack of blood
culture facility is one of the major
challenges facing diagnostic
laboratories in Africa, and even when
present, the approach used might be
sub-optimal or lack the required
sensitivity. Inability to carry out blood
culture in this facility has potentially
40

Covenant Journal of Physical & Life Sciences (CJPL) Vol. 6 No.1,June 2018
excluded bacteria that might be
important in our understanding of the
ciprofloxacin resistant bacteria
circulating in the population. Second,
incessant power cut offs also made it
impossible for the facility to preserve
multidrug resistant isolates for
molecular studies. Hence the
underlying molecular mechanisms of
resistance in the isolates are unclear.
Third, the isolates described here do
not distinguish between community or
hospital acquired infections based on
the records made available by the
health facility. Lastly, it is possible
that the number of isolates reported in
this study might be below the true
number of isolates actually reported
due to poor record keeping which is
common to most African hospitals, but
that might not be the case in our study.
To conclude, it is very likely that
fluoroquinolones resistance emerged
with increase in their indiscriminate
use [6], hence there is an urgent need
for establishing an antimicrobial
stewardship programme that will
address antibiotic use in humans and
animals. This programme should be
designed to complement improving the
quality of laboratories, and
establishing a national surveillance
programme to detect, report and
monitor multidrug resistant bacteria
strains.
Acknowledgements
We thank the management of
AMBGH for approving the use of the
data for this retrospective study.
References 1. Alós, J.-I. [Antibiotic resistance: A
global crisis]. Enferm. Infecc.
Microbiol. Clin.2015, 33, 692–
699,
doi:10.1016/j.eimc.2014.10.004.
2.Jung, C. M. Dissemination of
Bacterial Fluoroquinolone
Resistance in Two Multidrug-
Resistant Enterobacteriaceae. J.
Mol. Microbiol. Biotechnol.2014,
24, 130–134,
doi:10.1159/000362278.
3.Williams, D. N. Antimicrobial
resistance: are we at the dawn of
the post-antibiotic era? J. R. Coll.
Physicians Edinb.2016, 46, 150–
156,
doi:10.4997/JRCPE.2016.302.
4. Paltansing, S.; Kraakman, M. E. M.;
Ras, J. M. C.; Wessels, E.;
Bernards, A. T. Characterization
of fluoroquinolone and
cephalosporin resistance
mechanisms in
Enterobacteriaceae isolated in a
Dutch teaching hospital reveals
the presence of an Escherichia
coli ST131 clone with a specific
mutation in parE. J. Antimicrob.
Chemother.2013, 68, 40–45,
doi:10.1093/jac/dks365.
5. Andriole, V. T. The quinolones:
past, present, and future. Clin.
Infect. Dis. Off. Publ. Infect. Dis.
Soc. Am.2005, 41 Suppl 2, S113-
119, doi:10.1086/428051.
6. Lamikanra, A.; Crowe, J. L.; Lijek,
R. S.; Odetoyin, B. W.; Wain, J.;
Aboderin, A. O.; Okeke, I. N.
Rapid evolution of
fluoroquinolone-resistant
Escherichia coli in Nigeria is
temporally associated with
fluoroquinolone use. BMC Infect.
Dis.2011, 11, 312,
doi:10.1186/1471-2334-11-312.
7. Tytler, B. A.; Mijinyawa, N.; Ida, A.
Comparative quality of
fluoroquinolone tablets marketed
in some towns in Northern
41

Covenant Journal of Physical & Life Sciences (CJPL) Vol. 6 No.1,June 2018
Nigeria. J Pharm
Bioresources2007, 4, 8–13.
8.Tran, J. H.; Jacoby, G. A.
Mechanism of plasmid-mediated
quinolone resistance. Proc. Natl.
Acad. Sci. U. S. A.2002, 99,
5638–5642,
doi:10.1073/pnas.082092899.
9.Karczmarczyk, M.; Martins, M.;
Quinn, T.; Leonard, N.; Fanning,
S. Mechanisms of
Fluoroquinolone Resistance in
Escherichia coli Isolates from
Food-Producing Animals. Appl.
Environ. Microbiol.2011, 77,
7113–7120,
doi:10.1128/AEM.00600-11.
10.Blair, J. M. A.; Webber, M. A.;
Baylay, A. J.; Ogbolu, D. O.;
Piddock, L. J. V. Molecular
mechanisms of antibiotic
resistance. Nat. Rev.
Microbiol.2015, 13, 42–51,
doi:10.1038/nrmicro3380.
11.Hopkins, K. L.; Davies, R. H.;
Threlfall, E. J. Mechanisms of
quinolone resistance in
Escherichia coli and Salmonella:
recent developments. Int. J.
Antimicrob. Agents2005, 25,
358–373,
doi:10.1016/j.ijantimicag.2005.02
.006.
12.Tran, J. H.; Jacoby, G. A.
Mechanism of plasmid-mediated
quinolone resistance. Proc. Natl.
Acad. Sci. U. S. A.2002, 99,
5638–5642,
doi:10.1073/pnas.082092899.
13.Redgrave, L. S.; Sutton, S. B.;
Webber, M. A.; Piddock, L. J. V.
Fluoroquinolone resistance:
mechanisms, impact on bacteria,
and role in evolutionary success.
Trends Microbiol.2014, 22, 438–
445,
doi:10.1016/j.tim.2014.04.007.
14.Wright, G. D. Bacterial resistance
to antibiotics: enzymatic
degradation and modification.
Adv. Drug Deliv. Rev.2005, 57,
1451–1470,
doi:10.1016/j.addr.2005.04.002.
15.Machuca, J.; Briales, A.; Díaz-de-
Alba, P.; Martínez-Martínez, L.;
Pascual, Á.; Rodríguez-Martínez,
J.-M. Effect of the efflux pump
QepA2 combined with
chromosomally mediated
mechanisms on quinolone
resistance and bacterial fitness in
Escherichia coli. J. Antimicrob.
Chemother.2015, 70, 2524–2527,
doi:10.1093/jac/dkv144.
16.Aibinu, I.; Aednipekun, E.;
Odugbemi, T. Emergence of
Quinolone Resistance amongst
Escherichia coli strains isolated
from Clinical infections in some
Lagos State Hospitals, in Nigeria.
Niger. J. Health Biomed.
Sci.2004, 3,
doi:10.4314/njhbs.v3i2.11513.
17. REIS, A. C. C.; SANTOS, S. R. da
S.; de SOUZA, S. C.;
SALDANHA, M. G.; PITANGA,
T. N.; OLIVEIRA, R. R.
CIPROFLOXACIN
RESISTANCE PATTERN
AMONG BACTERIA
ISOLATED FROM PATIENTS
WITH COMMUNITY-
ACQUIRED URINARY TRACT
INFECTION. Rev. Inst. Med.
Trop. São Paulo2016, 58,
doi:10.1590/S1678-
9946201658053.
18.Alabi, A. S.; Frielinghaus, L.;
Kaba, H.; Kösters, K.; Huson, M.
A. M.; Kahl, B. C.; Peters, G.;
Grobusch, M. P.; Issifou, S.;
42
Covenant Journal of Physical & Life Sciences (CJPL) Vol. 6 No.1,June 2018
Kremsner, P. G.; Schaumburg, F.
Retrospective analysis of
antimicrobial resistance and
bacterial spectrum of infection in
Gabon, Central Africa. BMC
Infect. Dis.2013, 13, 455,
doi:10.1186/1471-2334-13-455.
19.Nkemngu N, M. Susceptibility
patterns of Salmonella enterica
serovar Typhi to 10 antibiotics in
Cameroon. In; Guilin, China;
Vol. 99.
20.Opintan, J. A.; Newman, M. J.;
Nsiah-Poodoh, O. A.; Okeke, I.
N. Vibrio cholerae O1 from
Accra, Ghana carrying a class 2
integron and the SXT element. J.
Antimicrob. Chemother.2008, 62,
929–933,
doi:10.1093/jac/dkn334.
21.Fortini, D.; Fashae, K.; Villa, L.;
Feudi, C.; García-Fernández, A.;
Carattoli, A. A novel plasmid
carrying blaCTX-M-15 identified
in commensal Escherichia coli
from healthy pregnant women in
Ibadan, Nigeria. J. Glob.
Antimicrob. Resist.2015, 3, 9–12,
doi:10.1016/j.jgar.2014.12.002.
22.Fashae, K.; Hendriksen, R. S.
Diversity and antimicrobial
susceptibility of Salmonella
enterica serovars isolated from
pig farms in Ibadan, Nigeria.
Folia Microbiol. (Praha)2014, 59,
69–77, doi:10.1007/s12223-013-
0270-6.
23.Aibinu, I.; Pfeifer, Y.; Peters, F.;
Ogunsola, F.; Adenipekun, E.;
Odugbemi, T.; Koenig, W.
Emergence of bla(CTX-M-15),
qnrB1 and aac(6‟)-Ib-cr
resistance genes in Pantoea
agglomerans and Enterobacter
cloacae from Nigeria (sub-
Saharan Africa). J. Med.
Microbiol.2012, 61, 165–167,
doi:10.1099/jmm.0.035238-0.
24.Akinyemi, K. O.; Bamiro, B. S.;
Coker, A. O. Salmonellosis in
Lagos, Nigeria: Incidence of
Plasmodium falciparum-
associated Co-infection, Patterns
of Antimicrobial Resistance, and
Emergence of Reduced
Susceptibility to
Fluoroquinolones. J. Health
Popul. Nutr.2007, 25, 351–358.
25.Aibinu, I.; Odugbemi, T.; Koenig,
W.; Ghebremedhin, B. Sequence
type ST131 and ST10 complex
(ST617) predominant among
CTX-M-15-producing
Escherichia coli isolates from
Nigeria. Clin. Microbiol. Infect.
Off. Publ. Eur. Soc. Clin.
Microbiol. Infect. Dis.2012, 18,
E49-51, doi:10.1111/j.1469-
0691.2011.03730.x.
26.Adabara, N. U.; Ezugwu, B. U.;
Momojimoh, A.; Madzu, A.;
Hashiimu, Z.; Damisa, D. The
Prevalence and Antibiotic
Susceptibility Pattern of
Salmonella typhi among Patients
Attending a Military Hospital in
Minna, Nigeria Available online:
https://www.hindawi.com/journal
s/apm/2012/875419/ (accessed on
Mar 21, 2018).
27.CLSI Standards Center: Our
Standards Help Foster Health
Care Excellence Available
online: https://clsi.org/standards/
(accessed on Nov 13, 2017).
43

Covenant Journal of Physical & Life Sciences (CJPL) Vol. 6 No.1,June 2018
Table 1. Demographics of patients
Children (≤ 18 yrs) Adult (> 18 yrs)
54 316
Median age ( IQR) 10 35
Male Female
Sex, n (%) 119 (32.2%) 251 (67.8%)
Table 2. Distribution of isolates from children and adults
Isolates Proteu
s spp
Klebsiell
a
Pseudomona
s
Staphylococcu
s
aureus
Escherichi
a coli
Salmonell
a
Childre
n (≤18
yrs)
7 - 3 28 14 2
Adults
(>18
yrs)
23 10 7 176 61 5
Total 30 10 10 204 75 7
Table 3. Source of isolates from patients‟ samples
Samples Proteu
s spp
Klebsiell
a
Pseudomona
s
Staphylococcu
s
Escherichi
a coli
Salmonell
a
Wound
infection
s
7 3 10 29 - -
Urine
infection
s
21 7 - 105 62 1
High
vaginal
swab
- - - 20 4 -
Sputum - - - 50 1 -
Stool 11 - - - 8 6
Total 30 10 10 204 75 7
44

Covenant Journal of Physical & Life Sciences (CJPL) Vol. 6 No.1,June 2018
Table 4. Susceptibility pattern of bacterial isolates to ciprofloxacin
Samples Proteu
s spp
Klebsiell
a
Pseudomon
as
Staphylococc
us
Escherichi
a coli
Salmonell
a
Susceptible 12
(40%)
6 (60%) 6 (60%) 133 (65.2) 31
(41.3%)
5 (71.4%)
Intermediat
e
3
(10%)
2 (20%) 2 (20%) 29 (14.2%) 13
(17.4%)
1 (14.3%)
Resistant 15
(50%)
2 (20%) 2 (20%) 42 (20.6%) 31
(41.3%)
1 (14.3%)
Total 30
(100%
)
10
(100%)
10 (100%) 204 (100%) 75 (100%) 7 (100%)
45

Covenant Journal of Physical & Life Sciences (CJPL) Vol. 6 No.1,June 2018
Covenant Journal of Physical & Life Sciences (CJPL) Vol. 6 No. 1, June, 2018
An Open Access Journal available online
A Mathematical Model on Cholera Dynamics with
Prevention and Control
Ayoade A. A. 1
, Ibrahim M. O. 1
, Peter O. J., 1*& Oguntolu F. A.
2
1Department of Mathematics, University of Ilorin, Nigeria
2Department of Mathematics/Statistics,
Federal University of Technology, Minna, Nigeria
Abstract: In this paper, we present and analyze a cholera epidemiological
model with modifications to Fung (2014) cholera model. The extended
model incorporates preventive and control measures as well as the possibility
of disease transmission from person-to-person. Equilibrium analysis is
conducted for the extended model for two cases of epidemic equilibrium and
endemic equilibrium to establish disease free equilibrium state (DFE) and
endemic equilibrium state (EE) respectively. We derive the basic
reproduction numbers and establish the local asymptotical stability for the
two models. We later use the results to compare the models at the DFE states
as regards the effects of control on the extended model. The endemic
equilibrium state (EE) of the extended model is also studied and found to be
locally asymptotically stable when the basic reproduction number . This
shows that cholera can be eliminated in a population only if the preventive
and control measures are strong enough.
Keywords: model, equilibrium, reproduction number, stability
Introduction Cholera is an acute intestinal water-
borne infectious disease. It is a
potentially epidemic and life-
threatening secretory diarrhea that is
caused by the bacterium Vibrio
Cholerae, first identified by Robert
Koch in 1883 during a cholera
outbreak in Egypt and characterized by
numerous, voluminous watery stools,
often accompanied by vomiting and
resulting in hypovolenic shock and
acidosis (Finkelstein, 2013). Though
cholera is preventable and curable, the
46
Covenant Journal of Physical & Life Sciences (CJPL) Vol. 6 No.1,June 2018
current global cholera report indicates
that there are an estimated 3 – 5
million cholera cases and 100 000 –
120 000 deaths due to cholera every
year [1].
The complexity of cholera dynamics
stems from the fact that both direct
(i.e. human-to –human) and indirect
(i.e. environment-to-human) routes are
involved in the disease transmission
[2]. The environment-to-human way of
transmitting cholera is mainly through
ingesting Vibrio Cholerae bacteria
from contaminated food or water while
human-to-human way of cholera
transmission is mostly unhygienic
contact with cholera patient‟sfaeces,
vomit or corpse [3]. Although cholera
is well prevented in developed
countries of the world, recent data
show that the global outbreak of
cholera is rising in Africa and the
entire less developed countries. This
rise may be attributed to inadequate
access to safe drinking water supply,
improper treatment of reservoirs and
improper sanitation [4].
While cholera has been a recognized
disease for more than a century, its
occurrence in developing countries
including Nigeria has been alarming
and has become a subject of concern.
In 1971, 22,931 cases of cholera and
2,945 deaths with a case fatality rate
(CFR) of 12.8% were recorded in
Nigeria. The disease reoccurred in
1991 in which 59,478 cases and 7,654
deaths were reported. The CFR was
12.9% which remains the highest rate
reported by the country to date. Also,
in 2009, Nigeria reported 13,691 cases
and 431 deaths [5]. Furthermore, in
2005, Nigeria had 4,477 cases and 174
deaths and in 2008, there were
reported cases of 6,330 and 429 deaths
[6].
Several mathematical models have
been proposed to understand the
transmission dynamics and control of
cholera [3, 6]In all of these models, the
use of vaccination and antibiotics to
control cholera are played down.
Nevertheless, the place of vaccination
and antibiotics in fighting against the
propagation of infectious diseases
cannot be underestimated. Vaccination
reduces the number of fully
susceptible individuals, reduces
infectiousness (i.e the rate of
contamination of the water supply),
and reduces the probability of
becoming symptomatic when infected.
Also, antibiotics administration
shortens the duration of illness and
perhaps reduces the concentration of
Vibrios excreted during illness [7].
Chao et al. (2011) claimed that the use
of vaccines would likely have
minimized the calamity that befell
Haiti in 2010 in terms of reduction in
morbidity and mortality of cholera, but
such vaccines were in short supply and
little was known about effective
vaccination strategies for epidemic
cholera. The researchers also
examined prevaccination strategies in
which vaccination occurs well before
the epidemic starts and reactive
vaccination strategies in which
vaccination begins after the epidemic
has started and discovered that
randomly prevaccinating a fraction of
the population well before the
epidemic begins can reduce the
number of cases roughly in proportion
to the number of individuals
vaccinated and delay the epidemic
peak.
Benefits from an intervention are a
combination of direct effects on those
receiving the intervention and indirect
effects on those with reduced exposure
47

Covenant Journal of Physical & Life Sciences (CJPL) Vol. 6 No.1,June 2018
because others received the
intervention. In the context of
vaccination, producing immunity
through vaccination of only a part of
the population may stop an epidemic
because chains of transmission are
broken – a concept known as “herd
protection“[7]. Concentration of
prevaccination in areas at high risk of
cholera, such as along rivers and other
bodies of fresh water can help achieve
critical vaccination threshold – the
proportion of the population one
would need to vaccinate effectively to
stop an epidemic [8]. The cholera
vaccines are safe, effective and have
an efficacy against clinical disease of
over 65% lasting at least 3 – 5 years
[9]
The study conducted by the research
arm of the international medical
humanitarian organization [10] and the
Guinean Ministry of Health revealed
that an oral cholera vaccine (i.e.
Shanchol) protected individuals by
86% during the 2012 cholera outbreak
in Guinea (MSF, 2012). Since most
existing cholera models exclude the
use of vaccination and antibiotics as
measures against cholera despite their
roles in fighting against the
propagation of infectious diseases, this
work is aimed to better understand the
effects of these measures so as to gain
useful guidelines to the effective
prevention and intervention strategies
against cholera epidemics. To that end,
we study cholera dynamics with
prevention and control measures as
well as the possibility of disease
transmission from person-to-person
incorporated into the model of [11]
which involve only the environment-
to-human transmission mode
Material and Methods
Formulation of model
Let S(t), I(t) and R(t) represent the
susceptible, the infected, and the
recovered human populations,
respectively. The total human
population N = S + I + R is closed,
which is a reasonable assumption for a
relatively short period of time and for
low – mortality diseases like cholera.
For example, WHO states that “In
2012, the overall case fatality rate for
cholera was 1.2 %”[12] Also, let B
denote the concentration of the Vibrios
in the environment (i.e. contaminated
water). The following assumptions are
made to extend [11] cholera model:
(i) Vaccination is introduced to the
susceptible population at a rate
v1(t), so that v1(t)S(t) individuals
per time are removed from the
susceptible category and added to
the recovered population.
(ii)Therapeutic treatment and
vaccination are applied to the infected
people at a rate
(t), and v2(t) respectively so that
(t)I(t) and v2(t)I(t) individuals per
time are removed from the infected
class and added to the recovered class.
Therapeutic treatment is in the form of
administration of antibiotics or
rehydration salts. As a result of
modifications, the new model
equations are as follows:
48

(2)
Where
All the parameters are non-
negative and
is the recruitment rate of susceptible
individuals, is the natural recovery
rate and are death rates,
unrelated to cholera and due to cholera
respectively, is the rate of losing
immunity,
is the force of infection,
and are vaccination rates, before
and after the outbreak respectively,
is the rate of applying therapeutic
treatment, the rate at which
infectious individuals contribute V.
cholerae to the water reservoir,
is
the death rate of V. cholerae unrelated
to water treatment, is the
concentration of V. cholerae in the
water reservoir that will make 50% of
the susceptible population ill and
represent rates of ingesting
Vibrios from the contaminated water
and through human – to – human
interaction, respectively
Equilibrium analysis For the special case when the rates of
prevention and control are positive
constants,
i.e v(t) = 0, and
the model eqn. (1)
using eqn. (2) is reduced to an
autonomous system
(3)
(4)
(5)
(6)
Permanent immunity is assumed
therefore, equation (6) is not needed in
the model analysis. This is done for
convenience of discussion [12,13].
Besides in (3) is dropped since
compartment R is not included in the
analysis.
This allows us to conduct a careful
equilibrium analysis to investigate the
effects of protection and control on the
epidemic and endemic dynamics of
cholera.
1
2
2 1
( ) I
(1)c
dSS S S R
dt
dIS
dt
dRI R I S I R
dt
dBI B
dt
v
v
v v
49
Covenant Journal of Physical & Life Sciences (CJPL) Vol. 6 No.1,June 2018
Epidemic Dynamics
The disease-free equilibrium (DFE) for
the model is given by
E0 = . (7)
Having determined the disease free
equilibrium point E0, we proceeded to
compute the basic reproduction
number for the two models using the
method of [14]. The associated next
generation matrices are given by
(8)
The basic reproduction number is then
determined as the spectral radius
of , which yields
(9)
The superscript q is used to emphasize
the model with controls. Compared to
the basic reproduction number for the
original no-control model (Fung,
2014) which is given as
(10)
Clearly, and the result in (9)
shows that, mathematically, each of
the controls can reduce the value of
below 1 so that the disease will be
eradicated though the combination of
the two interventions would achieve
better result.
It follows from theorem 2 in [15] that
the disease- free equilibrium is locally
asymptotically stable when .
In contrast, if the controls are weak
such that , then the disease-
free equilibrium is unstable and a
disease outbreak occurs.
Local Stability of the Disease Free
Equilibrium (DFE)
If the controls are assumed to be weak
and an outbreak occurs then there is a
need to compare the outbreak growth
rates between the original no - control
model and the model with controls.
We shall use the linearization
approach to analyze the effect of weak
prevention and control measures on
the extended model. The positive
(dominant) eigenvalue of the Jacobian
matrix at the DFE characterizes the
initial outbreak growth rate [16].
For the system of equations (3) – (5),
the Jacobian matrix at the DFE is
given by
J(E0)= (11)
At the disease free equilibrium state,
using the expression i.e put eqn. (7)
in eqn. (11), we obtain
J(E0)= (12)
The characteristic equation in λ is
obtained from the Jacobian
determinant thus,
( )
= 0,
(13)
where .
The necessary and sufficient
conditions for the DFE of the model to
be locally asymptotically stable is for
all the eigenvalues of eqn. (13) to be
negative
Clearly the first eigenvalue is:
The remaining part of the
characteristic equation is given as:
= 0
50
Covenant Journal of Physical & Life Sciences (CJPL) Vol. 6 No.1,June 2018
In the absence of the disease (i.e.
DFE), there is no transmission of
infection either from person-to-person
or from water-to-person which makes
and to be zero in the above
equation hence, all the eigenvalues in
eqn. (13) are negative and the DFE of
the extended model is locally
asymptotically stable for .
As speculate earlier, suppose the
controls are weak and there is an
outbreak i.e and
such that then there will be
at least one positive eigenvalue for
eqn. (13). Let denote the
eigenvalue and it exists if and only if
<
. This is the sufficient
condition for the product of the
remaining roots of eqn. (13) to be
negative.
In terms of graph, the value of is
the slope of the ascending infection
curve when and the higher
the the higher the severity of
disease outbreak. Obviously,
and . This
result can be interpreted by the values
of the controls. The disease easily
breaks out and easily sustained if
whereas the initial
disease outbreak growth rate is
prevented or eradicated if the strength
of is strong enough.
For the purpose of comparison, the
quadratic part of the characteristic
equation of the original no-control
cholera model for R0 is evaluated
in a similar way as in eqn. (13) and it
is given as
=0, (14)
where . If is the positive
eigenvalue of the original no-control
cholera model then, if
while
if Hence,
the severity of outbreak will be lower
when than when R0
.The above inequalities hold from the
elementary algebra since
Finally, the summary of the results of
analysis of disease-free equilibrium
states is that the disease-free
equilibrium of the system of equations
(3) – (5) is locally asymptotically
stable if ; whereas it is
unstable, with a lower outbreak growth
rate than that of the original no-control
model whenever .
Endemic dynamics
Assuming that the disease-free
equilibrium of the extended model is
unstable and the disease is sustained in
the population then there is need to
investigate the long-term behavior of
the disease dynamicsfor .
Suppose the endemic equilibrium of
the model equations (3) - (5) is
denoted by
= ( ) (15)
Where and represent the population
of each compartment at endemic
equilibrium. Hence, the model
equations (3) – (5) are written in terms
of the endemic state as
0 (16)
51

Covenant Journal of Physical & Life Sciences (CJPL) Vol. 6 No.1,June 2018
0 (17)
0 (18)
Note that is dropped in eqn. (16)
due to the fact that the compartment R
is not included in the model analysis as
stated earlier under eqn. (6)
From eqn. (18),
= (19)
Solving for the remaining
compartments at endemic equilibrium
(i.e. and ), their values are
positive since each compartment and
parameter is assumed non-negative.
Local asymptotic stability of the
endemic equilibrium
Theorem 1: The endemic equilibrium
state is locally asymptotically
stable if
The linearization approach shall be
employed to investigate the stability of
the endemic equilibrium state The
approach shall be employed to show
that the endemic equilibrium state
is locally asymptotically stable. To
achieve this, eqn. (11) is used, so that,
substituting for B and for S and
replacing by M
and by N, the Jacobian
matrix eqn. (11) is reduced to
J( ) =
(20)
The characteristic equation in of
eqn. (20) is evaluated as follows -
(
= 0 (21)
On simplification, eqn. (21) can be
written as
(22)
Where
The Routh-Hurwitz criterion
inTianet al.(2010) and Liao and Wang
(2011) requires
and
(23)
as the necessary and sufficient
conditions for the local asymptotical
stability of the endemic equilibrium of
the model; i.e., all the solutions of eqn.
(22) must have negative real parts.
is obvious. Meanwhile, to
establish the validity of eqn. (23) for
the local asymptotic stability of the
extended model, eqn. (17) and eqn.
(19) shall be considered and eqn. (19)
will be substituted into eqn. (17) to
obtain
(24)
From (24),
(25)
Since all the model parameters as well
as M and N are positive andeqns (24)
and (25) hold then all the inequalities
in (23) are true. Hence, the endemic
equilibrium of the extended model is
locally asymptotically stable. The
implication of the local asymptotical
stability of the endemic equilibrium
state as proved
above is that even though the
prevention and control measures are
not strong enough to remove the
52
Covenant Journal of Physical & Life Sciences (CJPL) Vol. 6 No.1,June 2018
epidemic, they have the effect of
reducing the size of the infection,
particularly for the long-term disease
dynamics. We expect that when is
close to zero, an endemic state would
be unlikely to occur or persist in
reality, since practical endemism
requires a reasonably higher value for
(Tian et al., 2010)
Results and Discussion
In our analysis, there exists a disease
free equilibrium state and theendemic
equilibrium state. We established that
if 1 then disease free
equilibrium state is locally
asymptotically stable, which implies
that the prevention and control
measures are potent enough to inhibit
the emergence of secondary infections.
The United States of America is one of
the several countries that has been
maintaining stability in terms of
cholera outbreak both locally and
globally for more than a century. Even
though there are occasional sporadic
cases of cholera resulting from several
people who traveled abroad to
countries where cholera is endemic
and contracted the disease either by
drinking the water or eating some food
that was contaminated and developed
illness on returning to the United
States but at large, no secondary
transmission has been recorded within
the United States. We also established
that an endemic equilibrium state
exists if 1 which implies that
the prevention and control measures
are not strong enough to break the
chain of transmission of the disease
and the population experienced mild
waves of cholera epidemic. The
frequent outbreak of cholera in most
developing countries of the world is as
a result of carefree attitude towards
cholera prevention and control.
Despite availability of cholera
measures in these countries, the
measures are being handled with levity
hands.
Conclusion In this work we modified the model by
Fung [11] to incorporate vaccination
and therapeutic treatment as
prevention and control strategies
against cholera transmission. We
derive the basic reproduction number
and conduct a careful equilibrium and
stability analyses. Both the disease free
equilibrium state and the endemic
equilibrium state are found to be
locally asymptotically stable. From the
results obtained from the study we
conclude that the most effective way to
curb cholera outbreak is to ensure the
effectiveness and wide coverage of
cholera vaccination as well as cholera
treatment through the use of drugs in
cholera endemic regions. The
availability and potency of these
interventions are capable of averting
120 000 deaths due to cholera yearly.
References 1. Azman, A. S., Rudolph, K. E.,
Cummings, D. A. T.,
Lessler, J. (2012). The
incubation period of cholera: A
system review. Journal of
Infection, 66, 432-438.
2. Mukandavire, Z., Liao, S., Wang, J.,
Gaff, H., Smith, D. L. and
Morris, J. G. Jr (2011).
Estimating the reproductive
numbers for the 2008-2009
cholera outbreaks in Zimbabwe.
Proc. Natl Acad. Sci. USA,
108(21), 8767- 8772.
3. Fakai, S. A., Ibrahim, M. O. and
Siddiqui, A.M.(2014). A
53
Covenant Journal of Physical & Life Sciences (CJPL) Vol. 6 No.1,June 2018
deterministic model on cholera
dynamics and some control
strategies. International Journal of
Scientific Engineering and
Technology, 3(8), 1115-1118.
4. Posny, D. and Wang, J. (2014).
Modeling cholera in periodic
environments.Journal
ofBiological Dynamics, 8(1),
1-1
5.World Health Organisation,
(2012).Global Task on
Cholera Control. Cholera Country
Profile: Nigeria. Retrieved from:
http:/www.who.int/cholera
countries/Nigeria country profile
2011.pdf
6. Fatima,S., Krishnarajah, I., Jaffar, M.
Z. A. M., Adam, M. B.
(2014). A mathematical model
for the control of cholera in
Nigeria. Research Journal of
Environmental and Earth
Sciences,6(6), 321 – 325.
7. Grad, Y. H., Miller, J. C. and Lipsitch,
M. (2012).Cholera modeling:
challenges to quantitative
analysis ans predicting the
impact ofintervention.
Epidemiology, 23(4), 523-530.
8. Chao, D. L., Holloran, M. E. Longini,
I. M. Jr. (2011). Vaccination
strategies for epidemic cholera in
Haiti with implications for the
developing world.Proc. Natl
Acad. Sci. USA, 108,7081-
7085.Azman,
9. Azman, A. S., and Lessler, J. (2014).
Reactive vaccination in the
presence of disease
hotspot.Pro.R. Soc. B.
http:/rspb.royalsocietypublishing.
org Emerging themes in
epidemiology. htpp://www.et
online.com./content/11/1/1.
10.Me‟decinsSanFrontie‟res (MSF,
2012). Oral cholera vaccines
highly effective during outbreak
in Guinea.Retrieved from:
http:/www.msf.org.
11 Fung, I. C-H.(2014). Cholera
transmission dynamic models for
public health practitioners. Fung
12.Wang, J. and Modnak, C.
(2011).Modeling Cholera
Dynamics with
Controls.Canadian Applied
Mathematics Quarterly.19(3),
255-273
13. Tian, J. P., Liao, S. and Wang, J.
(2010). Dynamical Analysis
and Control Strategies in
Modelling Cholera.Retrieved
from:ath.wm.edu/jptian/tain-
liao-wang.
14. Tian, J. P. and Wang, J. (2011),
Global Stability for Cholera
Epidemic Models. Mathematical
Biosciences 232, 31-41.
15. van den Driessche, P. and
Watmough, J. (2002).
Reproduction number and sub –
threshold endemic equilibria
for compartmental models of
disease transmission.Math.Biosci.
180,29 – 48.
16.Tien, J. H. and Earn, D. J. D. (2010).
Multiple transmission
pathways and disease dynamics
in a waterborne pathogen
model.Bull. Math.Biol.72, 1502 –
1533.
.
54
Covenant Journal of Physical & Life Sciences (CJPL) Vol. 6 No.1,June 2018
Covenant Journal of Physical & Life Sciences (CJPL) Vol. 6 No. 1, June, 2018
An Open Access Journal available online
Phytochemical and Antimicrobial Properties of
Mangifera indica Leaf Extracts
Olasehinde G. I.,1 Sholotan K. J.,
1,2 Openibo J. O.,
1
Taiwo O. S.,1
Bello O. A.,1
Ajayi J. B.,2
Ayepola O. O.1 & Ajayi A. A.
1
1Department of Biological Sciences, Covenant University,
Ota, Ogun State, Nigeria 2Ogun State College of Technology, Igbesa, Nigeria.
Abstract: There have been reports of increasing development of drug resistance
among human pathogens as well as undesirable side effects of certain
antimicrobial agents.It is therefore necessary to search for new agents that are
better, cheaper and without side effects for treating infectious diseases especially
in developing countries. In this study, phytochemical composition and
antimicrobial activities of aqueous and ethanolic extracts of leaves of Mangifera
indica were investigated. Standard methods were employed to screen for the
phytochemicals. Agar well diffusion method was used to determine the
antimicrobial effects of aqueous and ethanolic extracts of M. indica leaves against
seven different clinical isolates namely:Stapylococcus aureus, Micrococcus
virians, M. leteus, Escherichia coli, Klebsellia pneumoniae, Pseudomonas
aeruginosa and a fungus, Candida albicans. Phytochemical screening showed the
presence of active pharmacological components such as tannins, saponins,
cardiac glycoside, flavonoid and alkaloids. Aqueous extract demonstrated a
higher activity than the ethanolic extract. S. aureus showed highest sensitivity to
the aqueous extracts with MIC 31.25mg/mL. Least sensitivity was observed in K.
pneumoniae and Candida albicans with MIC 125mg/mL each in the two
extracts.M. indica exhibited significant antimicrobial activity comparable to
gentamicin which is used as control in this study.
Keywords: Resistance, Antimicrobial, Phytochemicals, Sensitivity
Introduction
Continuous spread of infectious
diseases is a major apprehension for
health institutions, pharmaceutical
companies and government think-
tanks all over the world. Failure of
treatment, particularly with the current
escalating trends of multi-drug
55

Covenant Journal of Physical & Life Sciences (CJPL) Vol. 6 No.1,June 2018
resistance (MDR) to the available
modern drugs or antibiotics among
emerging and re-emerging bacterial
pathogens leads to serious risks [1].
Prior to this century, medical
practitioners whether allopath (medical
doctors), homeopaths, naturopaths,
herbalists or shamans had to know the
plants in their areas and how to use
them since many of their drugs were
derived from plants [2–5]. Around
1900, 80% of the drugs were derived
from plants, however, in the decades
that followed, the development of
synthetic drugs from petroleum
products caused a sharp decline in the
pre-eminence of drugs from live plant
sources [6–8]. However, with the
recent trend of high percentage
resistance of microorganisms to the
present day antibiotics, efforts have
been intensified by researchers
towards a search for more sources of
antimicrobial agents [1, 9].
Mangifera indica is commonly called
mango (English), manako (Hawai„i),
manggo‟am (Fiji), tharyetthi
(Myanmar), mangot, mangue or
manguier (French), aam, am or amb
(Hindi), bobbiemanja, kanjannamanja,
magg, manggaboomormanja (Dutch),
mamung (Thailand), manga or mango
(Spanish), manga (Portuguese),
manga, mempelamorampelam
(Malaysia), manggaor mempelamn
(Indonesia), mangobaum (German),
paho (Philippines) and xoài (Vietnam),
mongoro (Yoruba, Nigeria), mangolo
(Igbo, Nigeria) and mangoro (Hausa,
Nigeria). The fruits are eaten and used
in the production of juice and wine.
Traditionally, the mango plant has
medicinal applications.Mango extract
has been reported to have anti malaria
effect by Tsabang et al [10] and was
found to display in vitro activity
against Plasmodium falciparum [11].
The leaves of M. indicahave also been
reported to possess antibacterial
activity [12]. Ojewole [13] reported
the anti-inflammatory, analgesic and
hypoglycemic effects of M. indica
stem-bark aqueous extract. Doughari
and Manzara [12] also affirm that both
acetone and methanol extracts
inhibited the growth of gram positive
bacteria, with acetone extract exerting
more activities on all the gram positive
bacteria with zone of inhibition
between 15 - 16 mm, and a gram
negative bacterium Salmonella typhi
(14 mm) at 250 mg/ml. Stem bark of
M. indica showed significant
antibacterial and antifungal activities
against Streptococcus pneumoniae,
Enterobacter aerogenes, Klebsiella
pneumoniae and Candida albicans
with MIC of 0.08 mg/ml [14].
Mangifera indica contains alkaloids
and glycosides which are of great
importance pharmacologically. Certain
aliphatic constituents such as
coumarin, mangiferin,
sequiterpinenoids, triterpinoids and
phenolics have also been reported
from the stem barks of different
cultivars of M. indica [15]. It is
believed that the presence of these
phytochemicals confers on Mangifera
indica, its medicinal ability.
Studies have shown that aqueous and
ethanolic herbal extracts show less
toxicity in animal models than N-
Haxane, acetone, ethanol and other
solvents [1].This study therefore
investigated and revalidated the
phytochemical and in
vitroantimicrobial properties of
aqueous and ethanolic extracts of
Magniferaindica.
56

Covenant Journal of Physical & Life Sciences (CJPL) Vol. 6 No.1,June 2018
Methods
Sampling: Samples of Mangifera
indica (leaves) were obtained from
Igbesa in Ado Odo/Otta Local
Government Area of Ogun State and
were identified in the Department
ofBiological Sciences, Covenant
University, Ota, Ogun State, Nigeria.
Preparation of plant materials:
Freshly collected leaves of M.
indicawere washed with distilled water
and dried under the shade at normal
room temperature for 10 days. After
drying, the plant material was pounded
using mortar and pestle into smaller
particles and then blended to powder
using an electric blender. 200grams of
the powdered samples were stored in
airtight containers and kept under
normal room temperature for further
screening.
Collection of test organisms: Clinical
isolates of Escherichia coli,
Pseudomonas
aerugenosa,Micrococcus
leteus,Staphylococcus aureus,
Klebsiellapneumoniae, Micrococcus
virians and Candida albicans were
collected from Microbiological
Teaching Laboratory of Covenant
University Ota in Ado OdoOta Local
Government Area of Ogun State,
Nigeria. The collected isolates were
sub-cultured for 24hours and were
adjusted to 0.5McFarland standard.
Preparation of aqueous extracts:
Samples (100 g) of the dried powdered
of the plant leaves were soaked in1000
ml of distilled water contained in a
2000 ml flask. The flask was plugged
with cotton wrapped with foil and then
allowed to stand for 48 hours. The
suspension was shaken vigorously and
filtered using a muslin cloth. The
filtrates wereconcentrated using a
rotary evaporator. The concentrated
extract was stored in airtight sample
bottle until required. For the
preparations of crude extracts for
antimicrobial screening, the extract
wasreconstituted in Dimethyl
Sulphoxide (DMSO) to500mg, 250mg,
125mg and 62.5mg/ml by dissolving
0.5g in 1ml, 0.5g in 2ml, 0.5g in 4ml
and 0.5g in 8ml DMSO respectively.
Preparation of ethanolic extracts:
Samples (100 g) of the dried powdered
of the plant leaves were soaked in
1000 ml of ethanol containedina
2000ml flask. The flask was plugged
with cotton wrapped with foil and then
allowed to stand for 72 hours. The
suspension was shaken vigorously and
filtered using a muslin cloth. The
filtrates wereconcentrated using a
rotary evaporator. The concentrated
extract was stored in airtight sample
bottle until required. For the
preparations of crude extracts for
antimicrobial screening, the extract
was reconstituted in Dimethyl
Sulphoxide (DMSO) to 500mg,
250mg, 125mg and 62.5mg/ml by
dissolving 0.5g in 1ml, 0.5g in 2 ml,
0.5g in 4ml and 0.5g in 8ml
respectively.
Phytochemical screening:
Phytochemical tests for the screening
and identification of bioactive
chemical constituents in the medicinal
plants under study were carried out on
the extract using the standard
procedures as previously described
[16].
Qualitative analysis of
phytochemical constituents
Tannins: The powdered leaf sample
(0.5 g) was boiled in 20 ml of distilled
water in a test tube and filtered, 0.1%
FeCl3was added to the filtered samples
and observed for brownish green or a
57

Covenant Journal of Physical & Life Sciences (CJPL) Vol. 6 No.1,June 2018
blue black colouration which shows
the presence of tannins.
Saponins: The powdered leaf sample
(2.0 g) was boiled in 20ml of distilled
water in a water bath and filtered off;
the filtratewas mixed with 5ml of
distilled water in a test tube and
shaken vigorously to obtain astable
persistent froth. The frothing is then
mixed with 3drops of olive oil and for
the formation of emulsion which
indicates the presence of saponins.
Flavonoids: A few drop of 1%
NH3solution was added to the aqueous
extract of each plant sample in a test
tube. A yellow coloration is observed
if flavonoids compound are present.
Glycosides: Concentrated H2SO4 (1
ml) was prepared in a test tube, 5 ml of
aqueous extract from the powdered
leaf samplewas mixed with 2ml of
glacial CH3COOH containing 1 drop
of FeCl3. The above mixture was
carefully added to 1ml of concentrated
H2SO4so that the concentrated H2SO4
settled beneath the mixture. The
presence of cardiac glycoside
constituent was indicated by
appearance of a brown ring.
Alkaloids: The plant sample (5.0 g)
was prepared in a beaker and 200ml of
10% CH3COOH in C2H5OH was
added to the plant sample nearly 0.5g.
Antimicrobial activity: Agar well
diffusion technique as described by
Olasehindeet al. [1] was adopted for
the study. 56 petri-dishes filled with
20ml of Mueller Hinton Agar each
(MHA Oxoid) was inoculated with
0.5Mcfarland‟s standard of each test
organisms using sterile swab stick as
demonstrated by Cheesbrough[16].
Duplicate well of 7mm diameter were
bored on each plate using sterile cork
borer and filled with equal volume of
plant extracts (0.4ml) with the aid of a
sterile micropipette. Control
experiment was done using
commercially produced
Gentamicin.The plates were incubated
at 37oC for 18-24hours. Zones of
Inhibition were measured in millimeter
(mm) and the average values were
calculated and recorded.
Determination of minimum
inhibitory concentration (MIC): The
determination of Minimum Inhibitory
Concentration (MIC) was carried out
on the extract against the test isolates
(E. coli, K. pneumoniae, M. viridans,
M. leteus, S. aureus, P. aeruginosa
and C. albicans) due to its sensitivity
against the growth of the isolates.
Nutrient broth (5 ml) was dispensed
into each of the 56 test-tubes and
sterilized at 121oC for 15 minutes and
allowed to cool to 40-45oC. 0.5ml of
0.5Mcfarland standard of each test
isolates were introduced into 8
different tubes while 5ml of each
extract concentrations (500, 250, 125,
and 62.5 mg/ml of aqueous and
ethanolic extract) were introduced into
7 different tubes containing each
isolates, labelled accordingly and
incubated at 37oC for 24 hours.
Results and Discussion
The preliminary phytochemical tests
carried out on the aqueous leaf extract
showed the presence of tannin,
saponins, alkaloids and cardiac
glycosides but sterols and flavonoids
were absent. In the ethanolic extract,
saponin, tannin, flavonoids, alkaloids
and cardiac glycosides were all present
but sterols was absent (Table 1).
58
Covenant Journal of Physical & Life Sciences (CJPL) Vol. 6 No.1,June 2018
Table 1: Phytochemical properties of M.
indica leaf extracts
Phytochemi
cals
Leave Extract
Aqueo
us
Ethanol
ic
Tannin + +
Saponin + +
Sterols - -
Flavonoids - +
Alkaloids + +
Cardiac
glycosides + +
Antimicrobial activity of aqueous and
ethanolic extracts of M. indica leaf
assayed against seven human
pathogenic microorganisms, using
gentamicin as positive control showed
great potency at varying concentration
(Table 2). Phytochemical screening of
the extracts of M. indicashowed
presence of active pharmacological
components such as tannins, saponins,
cardiac glycoside, flavonoid and
alkaloids. This observation agrees with
the findings of Madunagu et al. [17].
These components are known to be
biologically active because they
protect the plant against infections and
predations by animals. Phytochemicals
generally exert their antimicrobial
activities through different
mechanisms from that of synthetic
drugs [18].
The leaves and flowers of M. indica
have been reported to possess
antibacterial activity against E. coli
and other bacteria in the family
Enterobacteriaceae and the bioactive
component mangiferin isolated from
M. indicawas reported to possess
remarkable anti-influenza activity [19].
The presence of phyto-constituents in
the leaf extracts may be responsible for
the antibacterial activity of the plant
[20–22]. Medicinally, this is important
for the treatment of pneumonia,
asthma and inflamed tissues.It also
plays important roles in herbs for
treating dysentery [23]. This justified
the use of M. indica in traditional
medicine.
The antibacterial assay performed
using the Agar well diffusion method
showed the clear zones of inhibition in
diameters. Table 2 above showed the
varied susceptibility of the bacteria
and fungi used as test organisms in this
study.The susceptibility exhibited are
dependent on the microorganisms and
extracting solvents. This agrees with
earlier findings that length of zones of
growth inhibition from different
studies vary from one organism to
another, plants and concentration
difference [24, 25]. The patterns
organisms which were sensitive tend
to move away from the region around
the extract while those that are
resistant show no zones of inhibition
of growth. In this study, it was
observed that the aqueous extract
demonstrated a slightly higher activity
atsome concentrations than the
ethanolic extract. Ethanolic extract
was observed to possess more potency
against P. aerugenosa and M. virians
with zones of inhibition value of 21
mm and 50 mm respectively as shown
in Table 2.
59
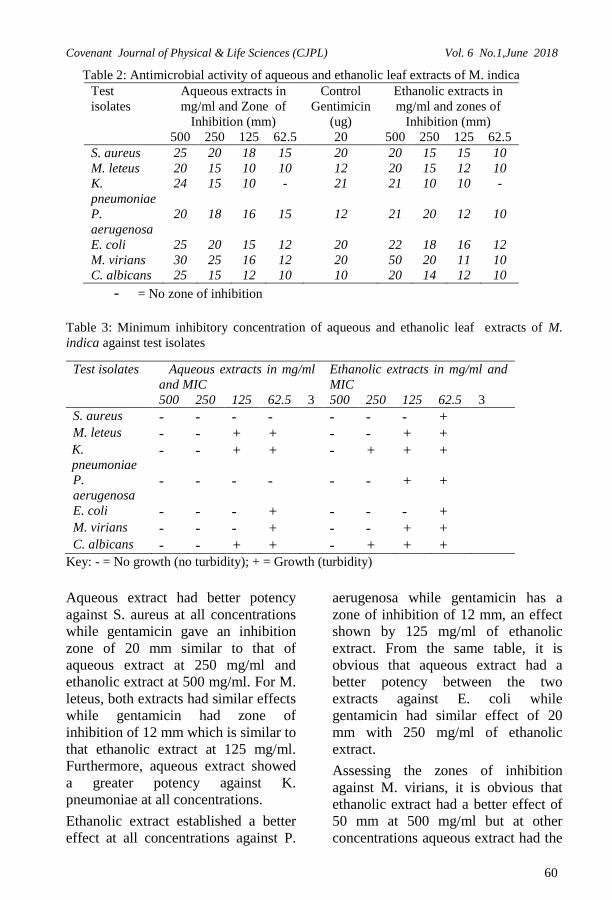
Covenant Journal of Physical & Life Sciences (CJPL) Vol. 6 No.1,June 2018
Table 2: Antimicrobial activity of aqueous and ethanolic leaf extracts of M. indica
Test
isolates
Aqueous extracts in
mg/ml and Zone of
Inhibition (mm)
Control
Gentimicin
(ug)
Ethanolic extracts in
mg/ml and zones of
Inhibition (mm)
500 250 125 62.5 20 500 250 125 62.5
S. aureus 25 20 18 15 20 20 15 15 10
M. leteus 20 15 10 10 12 20 15 12 10
K.
pneumoniae
24 15 10 - 21 21 10 10 -
P.
aerugenosa
20 18 16 15 12 21 20 12 10
E. coli 25 20 15 12 20 22 18 16 12
M. virians 30 25 16 12 20 50 20 11 10
C. albicans 25 15 12 10 10 20 14 12 10
- = No zone of inhibition
Table 3: Minimum inhibitory concentration of aqueous and ethanolic leaf extracts of M.
indica against test isolates
Test isolates Aqueous extracts in mg/ml
and MIC
Ethanolic extracts in mg/ml and
MIC
500 250 125 62.5 3 500 250 125 62.5 3
S. aureus - - - - - - - + M. leteus - - + + - - + + K.
pneumoniae - - + + - + + +
P.
aerugenosa - - - - - - + +
E. coli - - - + - - - + M. virians - - - + - - + + C. albicans - - + + - + + +
Key: - = No growth (no turbidity); + = Growth (turbidity)
Aqueous extract had better potency
against S. aureus at all concentrations
while gentamicin gave an inhibition
zone of 20 mm similar to that of
aqueous extract at 250 mg/ml and
ethanolic extract at 500 mg/ml. For M.
leteus, both extracts had similar effects
while gentamicin had zone of
inhibition of 12 mm which is similar to
that ethanolic extract at 125 mg/ml.
Furthermore, aqueous extract showed
a greater potency against K.
pneumoniae at all concentrations.
Ethanolic extract established a better
effect at all concentrations against P.
aerugenosa while gentamicin has a
zone of inhibition of 12 mm, an effect
shown by 125 mg/ml of ethanolic
extract. From the same table, it is
obvious that aqueous extract had a
better potency between the two
extracts against E. coli while
gentamicin had similar effect of 20
mm with 250 mg/ml of ethanolic
extract.
Assessing the zones of inhibition
against M. virians, it is obvious that
ethanolic extract had a better effect of
50 mm at 500 mg/ml but at other
concentrations aqueous extract had the
60

Covenant Journal of Physical & Life Sciences (CJPL) Vol. 6 No.1,June 2018
activity against the same organism
while Gentamicin had an inhibition
zone of 20 mm, a zone size also shown
at 250 mg/ml of ethanolic extract.
Aqueous extract had better potency
against C. albicans at all
concentrations while gentamicin had
inhibition zone of 10 mm, inhibition
zone size shown by 62.5mg/ml of both
extracts. Aqueous extract of M. indica
had minimum inhibitory concentration
(MIC) of 62.5 mg/ml against S. aureus
and P. aerugenosa only while an MIC
of 31.25 mg/ml was observed for M.
leteus, K. pneumoniae, and C. albicans
had turbity. The MIC for K.
pneumoniae, and C. Albicans was
found to be 62.5 mg/ml and 125 mg/ml
for S. aureus and E. coli respectively.
The zones of inhibition and MIC of M.
indica extracts observed in this study
compares with earlier findings where
zones of inhibition ranging between 12
mm and 16 mm were recorded for
extracts of M. indica stem bark and
leaves for Gram negative and Gram
positive bacteria [13]. Doughari and
Manzara [12] found that both acetone
and methanol extracts inhibited the
growth of gram positive bacteria, with
acetone extract exerting more activities
on all the Gram positive bacteria with
zone of inhibition between 15 - 16
mm, and a Gram negative bacterium
Salmonella typhi (14 mm) at 250
mg/ml. Stem bark of M. indica had
been found to show significant
antibacterial and antifungal activities
against Streptococcus pneumoniae,
Enterobacter aerogenes, Klebsiella
pneumonia and Candida albicans with
MIC of 0.08 mg/ml [6].
This study has established that crude
aqueous and ethanolic extracts of M.
indica leaves have good activity
against Gram positive and negative
bacteria and the fungus, Candida
albicans at low concentrations.
References 1 Olasehinde G. I. , Okolie Z. V.,
Oniha M. I., Adekeye B. T. and
A. A. Ajayi (2016). In vitro
antibacterial and antifungal
activities of Chrysophyllum
albidum and Diospyros
monbuttensis leaves,J. Pharm.
Phytothera. 8 (1):1–7.
2 Aderibigbe A. O., Emudianughe T.
S. and Lawal B. A. (2001).
Evaluation of the antidiabetic
action of Mangifera indica in
mice. Phytothera. Res.
15(5):456–458.
3 Aderibigbe A. O., Emudianughe T.
S. and Lawal B. A. (1999).
Antihyperglycaemic effect of
Mangifera indica in rat. Phyto.
Res.13(6) :504–7.
4 Zheng M. S. and Lu Z. Y. (1990).
Antiviral effect of mangiferin
and isomangiferin on herpes
simplex virus.,Chi. Med.
J.103(2):160–165.
5 Zhu X. M., Song J. X.,Huang Z. Z.,
Wu Y. M. and Yu M. J.
(1993). Antiviral activity of
mangiferin against herpes
simplex virus type 2 in vitro.
Zhongguo yao li xue bao,
14(5): 452–454.
6 Singh M., Khatoon S., Singh S.,
Kumar V., Rawat A. K. S. and
Mehrotra S. (2010).
Antimicrobial screening of
ethnobotanically important
stem bark of medicinal plants.
Pharma. Res. 2(4), 254–257.
61

Covenant Journal of Physical & Life Sciences (CJPL) Vol. 6 No.1,June 2018
7 Scartezzini P. and Speroni E. (2000).
Review on some plants of
Indian traditional medicine with
antioxidant activity. J.
Ethnopharma. 71(1–2):23–43.
8 Sofowora A. O. (1993).Medicinal
plants and traditional medicine
in Africa. University of Ife
Press 2nd ed. pp 320.
9 Barie P. S. (2012). Multidrug-
Resistant Organisms and
Antibiotic Management.Surg.
Clin. N. Amer. 92(2):345–391.
10 Tsabang N., Fokou P. V. T.,
Tchokouaha L. R. Y., Noguem
B., Bakarnga-Via I., Nguepi M.
S. D. et al.
(2012).Ethnopharmacological
survey of Annonaceae
medicinal plants used to treat
malaria in four areas of
Cameroon. J. Ethnopharma..
139(1):171–180.
11 Rasoanaivo P.Ramanitrahasimbola
D., Rafatro H.,
Rakotondramanana D.,
Robijaona B.,Rakotozafy A. et
al.(2004). Screening extracts of
Madagascan plants in search of
antiplasmodial compounds.
Phytothera. Res.18(9):742–747.
12 Doughari J. H. and Manzara S.
(2008). In vitro antibacterial
activity of crude leaf extracts of
Mangifera indica Linn. Afr. J.
Microbiol. Res.(2):67–72.
13 Ojewole J. (2005). Anti-
inflammatory, analgesic and
hypoglycaemic effects of
Mangifera indica Linn.
(Anacardiaceae) stem-bark
aqueous extract,” Meth. F.
Expt. Clin. Pharma. 27(8): 547.
14 Singh N., Kumar M. and R. K.
Singh R, K. (2012).
Leishmaniasis: Current status
of available drugs and new
potential drug targets,” Asian
Pac. J. Trop. Med. 5(6):485–
497.
15 Ghosal S. and Chakrabarti D. K.
(1988). Differences in phenolic
and steroidal constituents
between healthy and infected
florets of Mangifera
indica.Phytochem. 27(5):1339–
1343.
16African Networks on
Ethnomedicines (2004).
African journal of traditional,
complementary, and alternative
medicines. [African Networks
on Ethnomedicines], 2004.
17 Madunagu B., Ebana R. and Ekpe
E. (1990). Antibacterial and
antifungal activity of some
medicinal plants of Akwa Ibom
state.West Af. J. Biol. Appl.
Chem. 35: 25-30.
18 Scalbert A. (1991). Antimicrobial
properties of
tannins.Phytochem,30(12):3875
-3883.
19 Poongothai P. and Rajan S. (2013).
Antibacterial Properties of
Mangifera indica flower
extracts on Uropathogenic
Escherichia coli.Intl.J.
Curr.Microbiol. Appl. Sci.
2(12):104-111.
20 KhanM. A. and Khan M. N. I.
(1989). Alkyl gallates of
flowers of Mangifera Indica”
Fitoterapia. 60:284.
21 Khan M. N. I., Nizami S. S., Khan
M. A. and Ahmed Z.
(1993).New saponins from
Mangifera indica.J. Nat. Prod.
56(5):767-770.
22 Cowan M. M. (1999). Plant
products as antimicrobial
62

Covenant Journal of Physical & Life Sciences (CJPL) Vol. 6 No.1,June 2018
agents,” Clin.l Microbiiol
Rev.12(4):564-582.
23 Leven M.,Vanden Berghe D.,
Mertens F., Vlietinck A. and
LammensE. (1979).Screening
of higher plants for biological
activities I. Antimicrobial
activity.Planta.Med. 36(4):
311-321.
24 El-Mahmood A. M., Doughari J. H.
and Ladan N. (2008).
Antimicrobial screening of
stem bark extracts of Vitellaria
paradoxa against some enteric
pathogenic microorganisms.
Afr. J. Pharm. Pharmacol.
2(5):89-94.
25 Mann A., Banso A. and Clifford L.,
(2008). An antifungal property
of crude plant extracts from
Anogeissus leiocarpus and
Terminalia avicennioides,”
Tanz. J Health Res.10(1):34-38.
63

Covenant Journal of Physical & Life Sciences (CJPL) Vol. 6 No.1,June 2018
Covenant Journal of Physical & Life Sciences (CJPL) Vol. 6 No. 1, June, 2018
An Open Access Journal available online
Theoretical Investigation of Temperature and Grain
Size Dependence of Thermal Properties of alpha-
Silicon Crystal
Nenuwe O.N.
Department of Physics, Federal University of Petroleum Resources,
P. M. B. 1221, Effurun, Delta State, Nigeria
Abstract: Using reverse non-equilibrium molecular dynamics method, we
study the thermal properties of grain boundary between two alpha-silicon
crystal grains with (200) and (220) crystallographic orientations. The
interfacial thermal conductance of the grain boundary and thermal
conductivity are temperature dependent, leading to increasing/decreasing
thermal transport as the temperature is increased. Also, thermal conductivity
increased with increasing grain size. The observed decrease in thermal
resistance indicates the suitability of silicon as interface materials for high-
thermal conductivity material applications and thermal management in
micro and nanoelectronic devices.
Introduction The desire for faster and cheaper
electronic devices, continuous device
miniaturization and increasing density
of components on an integrated circuit
has increased the complexity of micro-
and nanoelectronics [1– 6]. It is well
known that downsizing of electronic
devices has enhanced computing
capabilities at the expense of
increasing heat dissipation across the
material [7–9]. This has posed great
thermal management challenge within
the electronic device industry. Over
the past fifty years [10], it has
motivated material scientists and
engineers into rigorous research and
continuous development of new
materials, by making thermal designs
an integral part of the fabrication of
electronic devices to increase
computing performance. For example,
64
Covenant Journal of Physical & Life Sciences (CJPL) Vol. 6 No.1,June 2018
in some processor modules, the power
required for high-performance
computing (HPC) may reach 300 –
400W resulting to heat loads up to
4kW for processors in a ten-socket
computing system [11]. High
management of power dissipation has
great implications on such systems,
and therefore, requires good thermal
management solutions that will
quickly transfer the heat from hot spots
to regions of low temperature to
maintain high reliability of such
electronic device. According to
Panasonic [12], energy consumption
rate keeps increasing even as the size
of electronic devices is continuously
decreasing, and the usual techniques
for thermal transfer have failed to meet
the present day electronic designs.
Hence, they developed the Pyrolytic
graphite sheet (PGS) for thermal
management solutions. The PGS was
designed to diffuse heat generated by
heat sources like power amplifier,
computer processors, and batteries.
Also, Tang et al. [13] reiterated that
thermal interface materials which are
usually introduced to bridge the gap
between difficulties to minimize the
thermal contact resistance can capably
improve heat dissipation of electronic
devices [14]. It is important to note
that thermal conductivity is difficult to
predict when the electronic device is
fabricated from different materials.
Therefore, material scientists and
engineers are always designing
interfaces between materials to
minimize or maximize thermal
conductivity [15].
Thus, in this review article, we use the
reverse non-equilibrium molecular
dynamics (RNEMD) [16] with a
classical potential to simulate the heat
flow through alpha-silicon (200) and
(220) interface and calculate the
interfacial Kapitza conductance and
resistance of the grain boundary at
different temperatures. The thermal
conductivity is calculated at all
temperatures, and the grain- size
dependence of thermal conductivity is
also investigated to have more insight
into the behavior of thermal
conductivity as the grain size is varied.
This article is arranged as follows:
Section 2 briefly reviews the theory of
RNEMD and discusses the
computational details. The results
obtained are analyzed in Section 3, and
Section 4 discusses the conclusion of
the study.
Theory and Computational methods
The interfacial thermal conductance is
calculated with the reverse non-
equilibrium molecular dynamics
method. In this method heat flux dQ/dt
is imposed through two alpha-silicon
crystal grains with (200) and (220)
crystallographic orientations, which
results in temperature jump (ΔT)
across the grain boundary since the
interface creates additional thermal
resistance, R to the heat flow, and a
temperature gradient is generated over
the hot and cold grains as illustrated in
Figure 1. The thermal conductance (G)
across an interface, also called Kapitza
conductance [17] is directly
proportional to the heat flux and
inversely proportional to the
temperature jump developing across
the grain boundary as given by Eq.
(2.1)
1dQ dtG
T R
(2.1)
65

Figure 1. A diagram of simulation system for determining thermal conductivity across the
interface of two silicon crystals in (200) and (220) crystallographic orientations in the regime
of RNEMD technique.
In Figure 1, the heat flux is imposed
by periodically exchanging the
positions and velocities of the hottest
atoms in the heat sink (cold grain) and
coldest atoms in the heat source (hot
grain). After the exchange, the
velocities of the atoms in the cold and
hot grains are given as [18]
v vv -v 2 c c h h
c c
c h
m m
m m
(2.2)
c hh h
v vv v 2 c h
c h
m m
m m
(2.3)
Where vc and vh are velocities of
atoms before the exchange, v'c and v'h
are velocities after the exchange in the
cold and hot grains, mc and mh are the
respective masses for the cold and hot
atoms. This results in heat flow from
the heat source to the heat sink.
Because of energy conservation and
the buildup of a temperature gradient,
energy transport is generated in the
opposite direction. When adequate
exchange has occurred, a steady-state
heat flux, dQ/dt is reached in the
system, and it is directly proportional
to the magnitude (but opposite in
direction) of the temperature gradient,
dT/dz as given by Eq. (2.4). Where κ,
is the thermal conductivity of the
material, and A, is the area
perpendicular to heat flux.
dQ dTA
dt dz (2.4)
In this study, the virtual nanolab
2017.1 [19] is used to prepare grain
boundary between two α-silicon (Si)
crystal grains with (200) and (220)
crystallographic orientations. The
thermal current is directed to run along
the z-direction. The (200) and (220)
crystal grain interface are studied for
(AxXByXCz=) 11.52X11.52X570,
11.52X11.52X680,
15.3601X15.3601X270 and
15.3601X15.3601X550 supercells.
The Cz-vector was chosen to be larger
than Ax andBybecause in the non-
equilibrium thermal current
simulations, it is customary to choose
a large cell length in the direction of
heat flow. The supercell created is
66

Covenant Journal of Physical & Life Sciences (CJPL) Vol. 6 No.1,June 2018
non-periodic in the Cz-direction so as
to terminate the system by vacuum at
either end. Then, the slab is centered in
the middle of the supercell.
The atomistix toolkit (ATK) force
field calculator [19-21] and Stillinger-
Weber potential [22] are used for the
equilibration of the system. The
system is first optimized using LBFGS
method [23] with a tolerance of
0.1eV/A and 0.1GPa in stress error, to
remove initial large destabilizing
forces that might have occurred during
the interface generation. Then, the
lateral cell vectors are relaxed and
equilibrated to the target temperature
using the molecular dynamics (MD)
method. First, the thermal transport
simulation is performed at an average
temperature of 500K. The molecular
dynamics type is taken as NPT
Martyna-Tobias-Kelein [24]. The
simulation is carried out for 7X10⁴
steps at log interval of 1.5X10³.
External stress is switched off and
reservoir temperature is set to 500K. In
order to remove the center of mass
momentum, the initial velocity is set to
Maxwell Boltzmann distribution at
500K. These settings are used to carry
out the simulation at constant
temperature and pressure. When the
simulation is done, the grains of the
resulting structure is now relaxed and
equilibrated at 500K. For the
equilibrated structure, regions of the
heat source and heat sink are defined
within the (200) and (220) oriented
grains. The NVT Nose Hoover Chain
[25] type MD is then used to
equilibrate the system at constant
volume. To achieve this, the
simulation is carried out for 1X10⁵
steps at log intervals of 1X10⁴ to allow
the system to reach steady-state
regime. Reservoir and final
temperatures are set to 500K, and
thermo-state time scale is taken to be
100fs.
Finally, another MD block is used to
carry out the non-equilibrium
simulations. Here, we set MD type to
non-equilibrium momentum exchange,
the number of simulation steps and log
interval are taken as 8X10⁵ and 2000,
respectively. The configuration
velocities are used. The time step is set
to 1fs. The exchange interval is taken
as 200. This is to allow the exchange
to stimulate every 200 steps and to
increase the transferred kinetic energy
per simulation time, which yields
larger temperature gradient and a more
definite temperature profile. When the
simulation is done, the system is
carefully checked for convergence
with respect to the system size and
simulation time. Subsequently, the
entire simulation is repeated at other
temperatures 600K, 800K and 1000K,
respectively
.
67

Covenant Journal of Physical & Life Sciences (CJPL) Vol. 6 No.1,June 2018
Figure 2. Comparison of temperature profile between 0 - 800ps, 100 - 800ps, 100 - 600ps,
200 - 500ps and 300 – 700ps at different temperatures: 500K, 600K, 800K and 100K.
Result Analysis
First, we check the convergence of the
temperature profile with respect to the
simulation time. This is done by
comparing different time intervals with
one another. The temperature profile is
shown in Figure 2. The blue, green,
red, sky-blue and purple curves
correspond to the intervals, 0 – 800
picosecond (ps), 100 - 800ps, 100 -
600ps, 200 - 500ps and 300 – 700ps,
respectively. In Figure 2, it can be seen
that the curves in the temperature
profile are in a steady state. That is, the
temperature profile looks the same as
time passes. This implies that the
temperature profile for 500K, 600K,
800K and 1000K converged with
respect to the simulation time. The
temperature profile shows positive and
negative peaks on the left and right-
hand sides of the profile. These areas
respectively, signify the heat source
and heat sink. This non-linear section
comes from the artificial transfer of
kinetic energy due to the momentum
exchange between the hot and cold
grains.
For the system with lattice parameters
11.52X11.52X570, around Cz = 274Å,
there is a temperature jump ΔT =
106K. This is the interface region that
provides additional thermal resistance.
From our simulation, the average heat
flux at 500K is 0.00082eV/fs.
Therefore, the Kapitza conductance is
obtained from Eq. (2.1) as
19
9 1
15
0.00082 1.6 10 J1.2377 10 J/sK or (WK )
106K 10 s
dQ dtG
T
(3.1)
This implies that the interface between
the temperature source and sink causes
a discontinuity in the temperature
68

Covenant Journal of Physical & Life Sciences (CJPL) Vol. 6 No.1,June 2018
profile since the interface provides
thermal resistance of R =1/G = 8.0795
X 108 KW
-1, to the heat current. At
600K, Cz = 276Å and the temperature
jump is ΔT = 116K.The average heat
flux is obtained as 0.00099eV/fs.
Therefore, the thermal or Kapitza
conductance is obtained as 1.3655X10-
9WK
-1, and the interfacial thermal
resistance is 7.3232X10⁸KW
-1. Tables
1 – 4 show the average heat flux,
temperature jump, Kapitza
conductance and interface thermal
resistance at different temperatures for
the various systems considered. As we
can observe, the Kapitza conductance
and interface thermal resistance are
sensitive to temperature.
Table 1 The Kapitza conductance (G), interface thermal resistance (R), temperature jump
(ΔT) and average heat flux (dQ/dt) at different temperatures for (200) oriented grains in the
system with lattice parameter 11.52 X 11.52 X 570.
Temperature (K) Cz(Å) ΔT(K) dQ/dt (eV/fs) G(WK-1) X10-9 R(KW-1) X108
500 274 106 0.00082 1.2377 8.0795
600 276 116 0.00099 1.3655 7.3232
800 276 113 0.001272 1.8011 5.5522
1000 275 141 0.001488 1.6885 5.9224
Table 2 The Kapitza conductance (G), interface thermal resistance (R), temperature jump
(ΔT) and average heat flux (dQ/dt) at different temperatures for (200) oriented grains in the
system with lattice parameter 11.52 X 11.52 X 680.
Temperature (K) Cz(Å) ΔT(K) dQ/dt (eV/fs) G(WK-1) X10-9 R(KW-1) X108
500 322 122 0.001321 1.7325 5.7720
600 324 168 0.001557 1.4828 6.7439
800 323 186 0.001958 1.6843 5.9372
1000 326 184 0.002478 2.1548 4.6408
Table 3 The Kapitza conductance (G), interface thermal resistance (R), temperature jump
(ΔT) and average heat flux (dQ/dt) at different temperatures for (200) oriented grains in the
system with lattice parameter 15.3601 X 15.3601 X 270.
Temperature (K) Cz(Å) ΔT(K) dQ/dt (eV/fs) G(WK-1) X10-9 R(KW-1) X108
500 131 79 0.001068 2.1659 4.617
600 132 88 0.001275 2.3213 4.307
800 133 102 0.001688 2.6514 3.771
1000 136 136 0.002167 2.0303 4.925
Table 4 The Kapitza conductance (G), interface thermal resistance (R), temperature jump
(ΔT) and average heat flux (dQ/dt) at different temperatures for (200) oriented grains in the
system with lattice parameter 15.3601 X 15.3601 X 550
Temperature (K) Cz(Å) ΔT(K) dQ/dt(eV/fs) G(WK-1) X10-9 R(KW-1) X108
500 276 64 0.001036 2.5900 3.8610
600 283 79 0.001237 2.5053 3.9915
800 279 77 0.001635 3.3974 2.9434
1000 279 161 0.002074 2.0611 4.8518
69

Covenant Journal of Physical & Life Sciences (CJPL) Vol. 6 No.1,June 2018
Figure 3. Interface Kapitza resistance as a function of temperature.
Usually, thermal resistance creates a
barrier to heat flow leading to
temperature jump across the interface
[26,27]. Figure 3 displays the interface
Kapitza resistance for the supercell
crystal 11.52X11.52X570, and
15.3601X15.3601X550, as a function
of temperature. As the temperature is
increased from 500K to 1000K, the
thermal resistance is observed to
decrease linearly and then increased
for 11.52 X11.52X570. While the
interface resistance is observed to first
increased as the temperature is
increased from 500K to 600k, then
decreased at 800K and finally,
increased as the temperature is
increased to 1000K for the
15.3601X15.3601X550 supercell. This
nonlinear behavior is as a result of the
difference in discontinuity in the
temperature profile at different
temperatures. This trend has been
obtained earlier by Song and Min [28],
who pointed out that interface thermal
resistance decreases with temperature
in the form , where α is higher for
interface with weaker interactions.This
significant property of silicon makes it
suitable for use as interface material
with other semiconductors in
integrated circuit applications, with the
aim to reduce or increase the thermal
resistance across the boundary to allow
the desired thermal transport and
maintain an appropriate temperature
within the electronic device.
Grain Size Dependence of Thermal
Conductivity
Also, we calculated the grain size and
temperature dependence of the thermal
conductivity for the (200) and (220)
crystallographic oriented grains. For
the various supercells studied, the
grain size dependence of the thermal
conductivity is tabulated in Tables 5 –
8. Usually, the grain size dependence
of thermal conductivity is modeled by
the distance between the heat source or
sink to the interface boundary. The
thermal conductivity κ (W/mK)
calculated for different temperatures at
70

Covenant Journal of Physical & Life Sciences (CJPL) Vol. 6 No.1,June 2018
different grain sizes displayed in
Figure 4. It is obvious that thermal
conductivity is sensitive to both
temperature and grain size. For the
(200) oriented grains, at each
temperature in the four different
supercells studied, it is seen that the
thermal conductivity increased linearly
between grain sizes 116 – 259 Å.
Thereafter, there is a jump in thermal
conductivity between grain sizes 257 –
270 Å, and then increased linearly
again around 317 – 322 Å. A similar
trend is also observed for the (220)
oriented grains. This might be as a
result of boundary effects in the
system that is smaller than the mean
free path of phonons [29].
Around the (200) oriented grains, at
500K in Tables 5 – 8, for the grain
sizes 116, 250, 257 and 317 Å, we
obtained the grain thermal
conductivity as 29.209, 43.082,
51.18874 and 54.5233 W/mK,
respectively. At 600K, for grain sizes
119, 257, 262 and 319 Å, the
calculated grain thermal conductivity
is respectively, 26.8058, 35.8068,
42.4583 and 47.6362 W/mK. At 800K,
the simulated grain thermal
conductivity for grain sizes 120, 258,
266 and 320 Å are 22.3884, 28.4109,
30.2294 and 33.1348 W/mK. Finally,
at 1000K, for grain sizes 123, 259, 270
and 322 Å, the corresponding grain
thermal conductivity is respectively,
15.1379, 18.9584, 22.0628 and
22.0947 W/mK.
Table 5. The grain size, temperature gradient dT/dz, and thermal conductivity κ, at different
temperatures for (200) and (220) oriented grains in the system with supercell 15.3601 X
15.3601 X 270. (200) oriented grains (220) oriented grains
Temperature (K) Grain size (Å) dT/dz(K/Å) κ(WK-1m-1) Grain size (Å) dT/dz(K/Å) κ(WK-1m-1)
500 116 -0.2483 29.2090 111 -0.2321 31.2477
600 119 -0.3230 26.8058 113 -0.3569 24.2597
800 120 -0.5120 22.3884 115 -0.5851 19.5913
1000 123 -0.9607 15.3179 118 -0.6806 21.6216
Table 6. The grain size, temperature gradient dT/dz, and thermal conductivity κ, at different
temperatures for (200) and (220) oriented grains in the system with supercell 15.3601 X
15.3601 X 550. (200) oriented grains (220) oriented grains
Temperature (K) Grain size (Å) dT/dz(K/Å) κ(WK-1m-1) Grain size (Å) dT/dz(K/Å) κ(WK-1m-1)
500 250 -0.1633 43.0820 234 -0.1655 42.5093 600 257 -0.2346 35.8067 238 -0.2229 37.6861
800 258 -0.3908 28.4109 242 -0.3533 31.4265
1000 259 -0.7429 18.9584 243 -0.4781 29.4586
71

Covenant Journal of Physical & Life Sciences (CJPL) Vol. 6 No.1,June 2018
Table 7. The grain size, temperature gradient dT/dz, and thermal conductivity κ, at different
temperatures for (200) and (220) oriented grains in the system with supercell 11.52 X 11.52
X 570. (200) oriented grains (220) oriented grains
Temperature (K) Grain size (Å) dT/dz(K/Å) κ(WK-1m-1) Grain size (Å) dT/dz(K/Å) κ(WK-1m-1)
500 257 -0.1934 51.1874 260 -0.2119 46.7184 600 262 -0.2815 42.4583 262 -0.2902 41.1854
800 266 -0.5080 30.2294 269 -0.4761 32.2548
1000 270 -0.8954 22.0628 272 -0.6774 26.5194
Table 8. The grain size, temperature gradient dT/dz, and thermal conductivity κ, at different
temperatures for (200) and (220) oriented grains in the system with supercell 11.52 X 11.52
X 680. (200) oriented grains (220) oriented grains
Temperature (K) Grain size (Å) dT/dz(K/Å) κ(WK-1m-1) Grain size (Å) dT/dz(K/Å) κ(WK-1m-1)
500 317 -0.2915 54.5233 317 -0.2440 65.5233
600 319 -0.3946 47.6362 318 -0.3269 57.5014
800 320 -0.7134 33.1348 321 -0.5212 45.3538 1000 322 -1.3540 22.0947 334 -0.6933 43.1505
Figure 4. Grain size dependence of the grain thermal conductivity for (200) and (220) oriented grains
In the (220) crystallographic oriented
region, the grain sizes considered are
111, 234, 260 and 317 Å at 500K, and
the corresponding grain thermal
conductivity is 31.2477, 42.5093,
46.7184 and 65.5233 W/mK. At 600K,
we obtained 24.2597, 37.6861,
41.1854 and 57.5014 W/mK as the
grain thermal conductivity for grain
sizes 113, 238, 262 and 318 Å. Around
800K, we calculated 19.5913, 31.4265,
32.2548 and 45.3538 W/mK for grain
sizes 115, 242, 269 and 321 Å. Finally,
at 1000K, we calculated 21.6216,
29.4586, 26.5194 and 43.1505 W/mK
for grain sizes 118, 243, 272 and 334
72

Covenant Journal of Physical & Life Sciences (CJPL) Vol. 6 No.1,June 2018
Å. From the aforementioned, it is clear
that, as the grain size is increased, the
grain thermal conductivity increased
substantially for all grain
crystallographic orientation types and
temperatures as displayed in Figure 4.
The reason for these is that the
phonons or lattice waves are scattered
near the grain interface. The extent of
increase in thermal conductivity is
more significant around grain size 317
Å at 500K for both (200) and (220)
crystallographic oriented grains, as
shown by the purple curve in Figure 4.
It is important to state that results for
thermal conductivity obtained from
this study are comparably smaller than
the bulk thermal conductivity for
silicon at 500, 600, 800 and 1000K
reported by Howell [30] using the
same Stillinger-Weber potential. This
trend is expected since the bulk
thermal conductivity is generally
higher than the corresponding grain
thermal conductivity [31]. This is
because the mean free path of phonons
is normally larger than 1X10⁴ Å,
which implies that the simulated
smaller grain size suppresses the
thermal conductivity [30, 31].
Figure 5. Temperature dependence of the grain thermal conductivity for (200) and (220) oriented grains
Figure 6. Inverse of thermal conductivity versus inverse of grain size for both (200) and (220) oriented grains.
From Tables 5 – 8, it is also clear that
the grain thermal conductivity
decreased substantially when the
temperature is increased as displayed
in Figure 5. These results indicate that
simulation size and temperature have
73
Covenant Journal of Physical & Life Sciences (CJPL) Vol. 6 No.1,June 2018
great influence on thermal
conductivity of materials, which
signifies a positive beneficial effect of
grain size and temperature, especially
in the micro and nanoelectronic device
industries. It is important to note that
this behavior has been observed by
other researchers using different
techniques [32, 33]. Furthermore,
Figure 6 displays a plot of the inverse
of thermal conductivity against the
inverse of grain size. In RNEMD
simulations phonons are scattered in
the hot and cold regions. Usually, this
leads to a lower mean free path, and
lower thermal conductivity. It is
customary to perform simulations for
cells of different sizes to overcome this
problem, as has been done by other
researchers [34, 35]. Calculating
thermal conductivity (κ) for different
grain sizes and plotting the inverse of
κ against the inverse of lg, it is also
possible to extrapolate lg = 0 to
determine the thermal conductivity of
a simulation of infinite grain size
which is comparable to infinite system
data [30, 36]. This accounts for the
fictitious phonon-boundary scattering
introduced by the heat transfer
dynamics.
Conclusion The thermal properties of grain
boundaries between Si (200) and Si
(220) crystals have been studied by
means of reverse non-equilibrium
molecular dynamics method. This
method allows one to calculate the
Kapitza conductance and thermal
resistance across the interface, and we
found they are both sensitive to
temperature. The thermal conductivity
monotonically decreased with
increasing temperature for all the
systems in both crystallographic
orientations. We also found that the
thermal conductivity is sensitive to the
grain size. Increase in grain size
resulted in significant increase in
thermal conductivity, with the most
substantial one around grain size 317
Å at 500K for all crystal orientations.
The importance of temperature and
grain size effects on thermal properties
of crystalline materials is a very vital
issue in the micro and nanoelectronic
device industries. It is expected that
this study will greatly contribute to the
full understanding of thermal
properties of micro- and nano-
crystalline materials.
References 1. Quantumwise Document, www.
quantumwise.com.
2. Goddard W. (Ed.), Brenner, D.
(Ed.), Lyslevski, S. (Ed.) and
Lafrate, G. (Ed.),
(2012).andbook of
NanoScience, Engineering, and
Technology, Third Edition,
Boca Raton: CRC Press.
3. Gu, J., Yang, X., Lv, Z., Li, N.
Liang, C. Zhang, Q. (2016).
Functionalized graphite
nanoplatelets/epoxy resin
nanocomposites with high
thermal conductivity,
International Journal of Heat
and Mass Transfer 92, 15-22.
4. Simon, R.P. and Alan, J.H.M.
(2005). Introduction to Thermal
Transport, Elsevier Materials
Today, 18 – 20.
5. InternationalTechnology Roadmap
for Semiconductors: ITRS
Reports,
http://www.itrs.net/reports.html.
6. Ferain, I., Colinge, C.A. and
Colinge, J. (2011). Multigate
transistors as the future of
74 74

Covenant Journal of Physical & Life Sciences (CJPL) Vol. 6 No.1,June 2018
classical metal–oxide–
semiconductor field-effect
transistors, Nature, 479, 310 –
316.
7. Schelling, P.K., Shib, L. and
Goodson, K.E. (2005).
Managing heat for electronics,
Mater. Today8 (6), 30-35.
8. Pop, E., Sinha, S. and Goodson, K.
E. (2006). Heat Generation and
Transport in Nanometer-Scale
Transistors, Proceedings of the
IEEE, 94 (8), 1587-1601.
9. Haensch, W., Nowak, E.J., Dennard,
R.H., Solomon, P.M., Bryant,
A., Dokumaci, O.H., Kumar,
A., Wang, X., Johnson, J.B. and
Fischetti, M.V. (2006). Silicon
CMOS devices beyond scaling,
IBM Journal of Research and
Development, 50, 339-361.
10. Arden L.M., and Li S. (2014).
Emerging challenges and
materials for thermal
management of electronics,
Elsevier: Materials Today17
(4), 163 – 174.
11. Datacom Equipment Power
Trends and Cooling
Applications, 2nd ed.,
ASHRAE, Atlanta, GA, 2012.
12 na.industrial.panasonic.com/PGS.
The Advance Thermal
Management Solution for
Today‟s Designs.
13. Tang, B., Hu, G., Gao, H. and Hai,
L. (2015). Application of
graphene as filler to improve
thermal transport property of
epoxy resin for thermal
interface materials,
International Journal of Heat
and Mass Transfer,85, 420–
429.
14. Siemens, M.E., Li, Q., Yang, R.,
Nelson, K.A., Anderson, E.H.,
Murnane, M.M. and Kapteyn,
H.C. (2010). Quasi-ballistic
thermal transport from
nanoscale interfaces observed
using ultrafast coherent soft x-
ray beams, Nature Mater. 9,
26–30.
15. Müller-Plathe, F. (1997). A simple
nonequilibrium molecular
dynamics method for
calculating the thermal
conductivity J. Chem. Phys.
106 (14), 6082-6085.
16. Carlos, N. and Avalos, J.B. (2003).
Non-equilibrium exchange
algorithm for molecular
dynamics simulation of heat
flow in multicomponent
systems, Mol. Phys. 101 (14),
2303 – 2307.
17. Schelling, P.K. (2004). Kapitza
conductance and phonon
scattering at grain boundaries
by simulation, Journal of
Applied Physics,95, 6082 –
6091.
18. Stackhouse, S. and Stixrude L.
(2010). Theoretical Methods
for Calculating the Lattice
Thermal Conductivity of
Minerals, Reviews of
Mineralogy and Geochemistry,
71, 253-269.
19.Atomistix ToolKit 2017.1,
Quantumwise A/S,
www.quantumwise.com.
20. Griebel, M., Knapek, S. and
Zumbusch, G. (2007).
Numerical Simulation in
Molecular Dynamics, Springer.
21. Griebel, M. and Hamaekers, J.,
(2004). Computer Methods in
Applied Mechanics and
Engineering, 193, 1773-1788.
22. Stillinger, F.H. and Weber, T.A.
(1985). Computer Simulation of
75

Covenant Journal of Physical & Life Sciences (CJPL) Vol. 6 No.1,June 2018
local order in condensed phases
of silicon, Phys. Rev. B, 31, 5262
– 5271.
23. Zhu, C., Byrd, R.H., Lu, P., and
Nocedal, J. (1997). Algorithm
778: L-BFGS-B: Fortran
subroutines for large-scale
bound-constrained
optimization,ACM Transactions
on Mathematical Software23 (4),
550 – 560.
24. Martyna, G.J., Tobias, D.J. and
Klein, M.L. (1994). Constant
pressure molecular dynamics
algorithms, J. Chem. Phys., 101
(5):4177–4189.
25. Martyna, G. J., Klein, M. L. and
Tuckerman, M. (1992). Nosé–
hoover chains: The canonical
ensemble via continuous
dynamics. J. Chem. Phys., 97 (4),
2635–2643.
26. Kapitza, P.L. (1941). Heat Transfer
and Superfluidity of Helium II,
Phys. Rev. 60, 354.
27. Robert J.S., Leonid, V.Z. and
Norris, P.M. (2007). Effects of
temperature and disorder on
thermal boundary conductance at
solid-solid interfaces:
Nonequilibrium molecular
dynamics simulations,
International Journal of Heat and
Mass Transfer,50, 3977–3989.
28. Song, G. and Min, C. (2013).
Temperature dependence of
thermal resistance at a
solid/liquid interface,
International Journal at the
Interface between Chemistry and
Physics,111, 903-908.
29. Nika, D.L., Askerov, A.S. and
Balandin, A.A. (2012).
Anomalous Size Dependence of
the Thermal Conductivity of
Graphene Ribbons, Nano Letters
12 (6), 3238–3244.
30. Howell P.C. (2012). Comparison
of molecular dynamics methods
and interatomic potentials for
calculating the thermal
conductivity of silicon, J Chem
Phys. 137 (22), 224111.
31. Akbar, B., Sang-Pil, K., Rodney,
S.R., and Vivek, B.S. (2011).
Thermal transport across Twin
Grain Boundaries in
Polycrystalline Graphene from
Nonequilibrium Molecular
Dynamics Simulations, Nano
Lett., 11, 3917–3921.
32. Sebastian G.V. and Gang C.
(2000). Molecular-dynamics
simulation of thermal
conductivity of silicon crystals,
Phys. Rev. B 61, 2651.
33. Mark S.H. and Steven G.L. (1986).
Electron correlation in
semiconductors and insulators:
Band gaps and quasiparticle
energies, Phys. Rev. B 34, 5390.
34. Stackhouse, S., Stixrude L. and
Karki B.B. (2010), Thermal
Conductivity of Periclase (MgO)
from first principle, Phys. Rev.
Lett. 104, 208501.
35. Patrick K.S, Simon R.P, and Pawel
K. (2002). Comparison of atomic-
level simulation methods for
computing thermal conductivity,
Phys. Rev. B 65, 144306.
36. Sellan, D.P., Landry, E.S., Turney,
J. E., McGaughey, A.J.H. and
Amon, C.H. (2010). Size effects
in molecular dynamics thermal
conductivity predictions, Phys.
Rev. B 81, 214305.
56