
Course code: ZOO560 Week 4 polymorphism Advanced molecular biology (ZOO560) by Rania M. H. Baleela...
43
Course code: ZOO560 Week 4 polymorphism Advanced molecular biology (ZOO560) by Rania M. H. Baleela is licensed under a Creative Commons Attribution- NonCommercial-ShareAlike 3.0 Unported License.
-
Upload
allen-page -
Category
Documents
-
view
213 -
download
0
Transcript of Course code: ZOO560 Week 4 polymorphism Advanced molecular biology (ZOO560) by Rania M. H. Baleela...
Course code: ZOO560
Week 4polymorphism
Advanced molecular biology (ZOO560) by Rania M. H. Baleela is licensed under a Creative Commons Attribution-NonCommercial-ShareAlike 3.0 Unported License.

This week content
• Allozyme vs. DNA polymorphism• Quantification of polymorphism and uses• The neutral theory of molecular evolution (selection)• Crucial population genetics:
• Wright’s F-statistics• The Wahlund effect• Linkage
• Laws of molecular evolution

Allozyme vs. DNA polymorphism

Terminology • Isozymes enzymes that catalyse the same biochemical reaction but may differ
ina) tissue specificityb) developmental regulationc) electrophoretic mobilityd) biochemical properties
• encoded by different loci, usually duplicated genes
• Allozymes• distinct forms of an enzyme• encoded by different alleles at a single locus

Allozyme polymorphisms
• Allozyme variation in a population= indication of simple Mendelian genetic variation.
O. australiensis analyzed for 12 isozyme loci, Sdh-1, Pgi-1, Pgi-2, Amp-1, Amp-2, Amp-3, Amp-4, Adh-1, Pgd-1, Pgd-2, Got-1, Got-3, using starch gel electrophoresis
(de los Reyes et al., Rice Genetics Newsletter, Vol. 8, http://www.shigen.nig.ac.jp/rice/rgn/vol8/v8p83.html)

DNA polymorphisms• Polymorphisms may be:1. Silent: present in the coding region but does
not alter the AA sequence. 2. Noncoding: affects nucleotides in noncoding
regions.
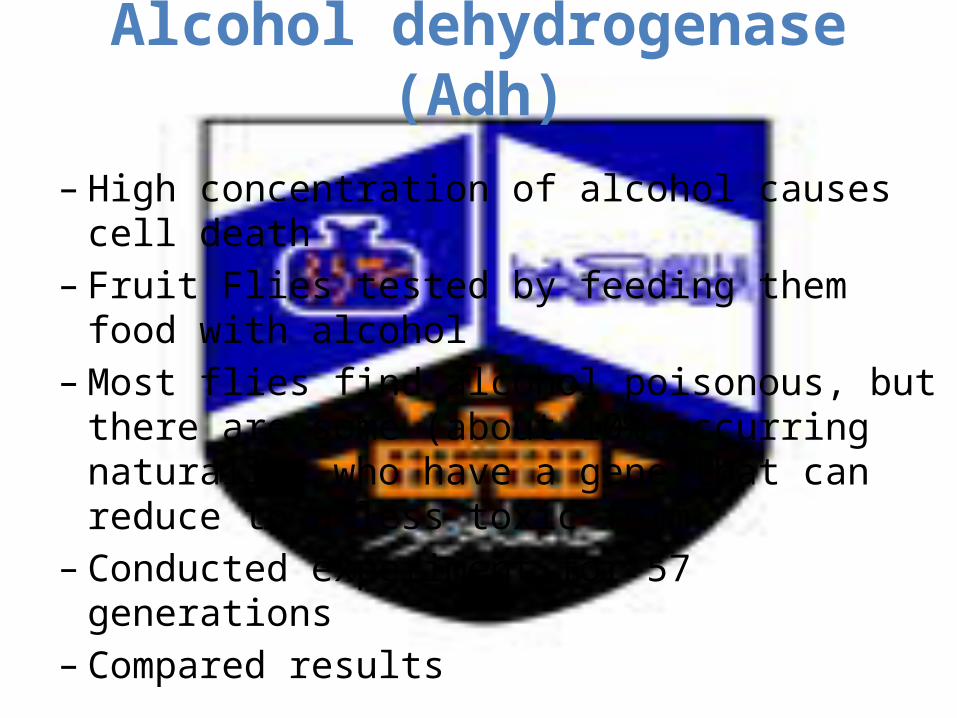
Alcohol dehydrogenase (Adh)
– High concentration of alcohol causes cell death– Fruit Flies tested by feeding them food with alcohol– Most flies find alcohol poisonous, but there are some
(about 10% occurring naturally) who have a gene that can reduce to a less toxic form
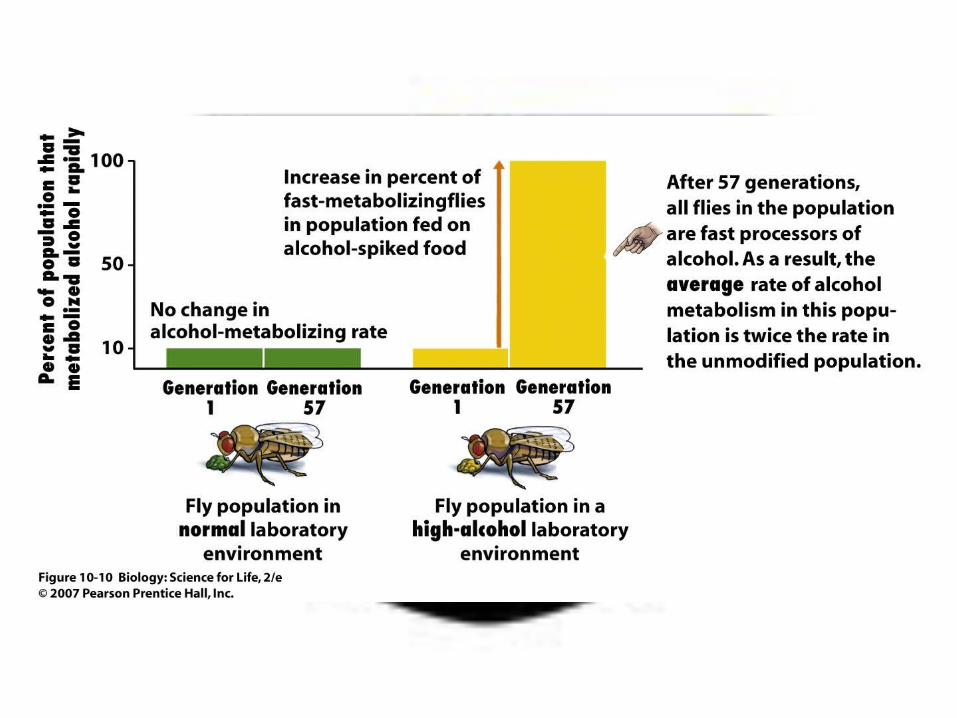
– Conducted experiment for 57 generations– Compared results

It is an e.g. of extensive silent polymorphism
• In Drosophila sp.: Allozyme polymorphism= Adh-S and Adh-F
• Adh-S: slow electrophoretic mobility, has got AAG coding AA # 193 (lysine), synthesised in lower amounts & has lower enzymatic activity
• Adh-F: fast electrophoretic mobility, got ACG coding AA # 193 (threonine), synthesised in greater amounts & has greater enzymatic activity

What happened was
• Experimental population showed consistent long-term increase in frequency of ADHF
• Flies with adhF allele have higher fitness when ethanol is present.
• ADHF enzyme breaks down ethanol twice as fast as ADHS enzyme.

Fig 5.13

Allozymes & polymorphism
Protein electrophoresis is a convenient method for detecting polymorphisms
BUT it is difficult to extrapolate from electrophoretic
surveys of enzymes to the entire genome because the enzymes may not be
representative.Why?

Allozymes polymorphism use: disadvantages
(1) it requires use of a large amount of protein; (2) it is time consuming, laborious, expensive and
technically demanding(3) has relatively poor discrimination power since it
only detects changes in AAs, yet changes in AA composition that do not affect the electrophoretic mobility will remain unobserved (Lewin et al., 2002),
(4) bands with equal electrophoretic mobility may not be homologous (Rieseberg, 1996).

Quantitation of DNA polymorphism
• Nucleotide polymorphism (θ): the proportion of nucleotide sites that are expected to be polymorphic in any suitable sample.
• Nucleotide diversity (π):is the average proportion of nucleotide differences between all possible pairs of sequences in the sample
Genetic polymorphism, whether studied through allozymes or nucleotide sequences, provides a set of markers for the study of organisms in their natural habitats.

Uses of polymorphism detection
• To investigate the genetic relationships among an organism subpopulations,
• As diseases markers and in early diagnosis,• Mating systems of organisms investigations
(e.g. inbreeding, selfing, outbreeding)• Crime investigations (e.g. CODIS system)• To infer evolutionary histories,

Laws of Molecular Evolution

Kimura and Ohta (1974) PNAS 71: 2848-2852
Laws of Molecular Evolution1. For each protein, the rate of evolution in terms of AAs substitutions is ~
constant/year/site for various lines, as long as the function and tertiary structure of the molecule remain essentially unaltered.
2. Functionally less important molecules or parts of molecules evolve (in terms of mutant substitutions) faster than more important ones.
3. Those mutant substitutions that are less disruptive to the existing structure and function of the molecule (conservative substitutions) occur more frequently in evolution than more disruptive ones.
4. Gene duplication must always precede the emergence of a gene having a new function.
5. Selective elimination of definitely deleterious mutant and random fixation of selectively neutral or very slightly deleterious mutants occur far more frequently in evolution than positive Darwinian selection of definitely advantageous mutants.

Kimura and Ohta (1974) PNAS 71: 2848-2852
• The first 3 laws relate to the molecular clock.• The fourth is “Ohno’s Law”,
Ohno’s work: evolution by gene duplication, made the case for the importance of gene duplication.
• The last is the neutral mutation theory.
Molecular clock (Zuckerkandl & Pauling, 1962)
Is the uniformity in the rate of AAs replacement or nucleotide substitution through long
periods.• Molecular clocks offer the possibility of dating
events that are not documented in the fossil record.
The molecular clock
• Is a technique in molecular evolution that uses fossil constraints and rates of molecular change to deduce the time in geologic history when two species diverged.
• It is used to estimate the time of occurrence of speciation events
e.g. Human and dog
• The α-globin genes of human and dogs differ in 16.3% of their AA sites.
• Mammalian α-globin contain 141 AA.• 16.3%= ~23 different AA sites• Note: differences due to in/dels of AAs are
excluded.

Phylogenetic relationships and
approximate times of evolutionary
divergence (Kimura, 1983)

Relation between estimated #of AAs substitutions (K) between pairs of spp. against time since divergence.
A straight line is exp. when AAs substitution is uniform
Variation across genes affects the rate of the molecular clock
• Different genes has different molecular clock rates.• However, within each gene there are reasonably
uniform rates of change.• This variation across genes appear to be due to
genes “tolerance of substitutions”e.g. 1. Histone H4 has extremely low tolerance2. γ-interferon has high tolerance3. Globins are at the middle of the spectrum
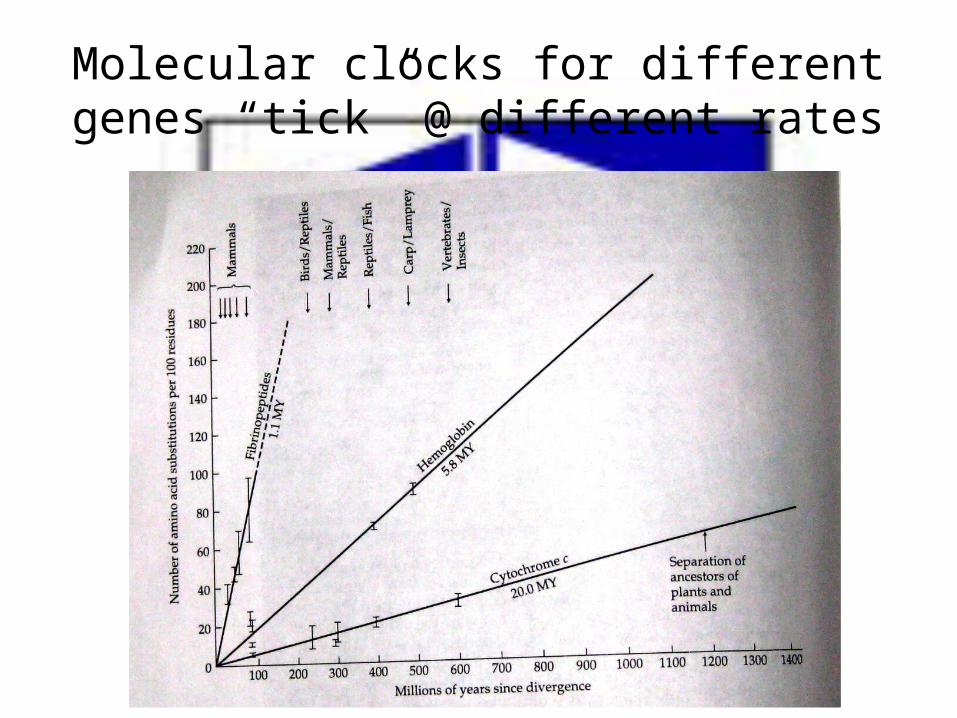
Molecular clocks for different genes “tick” @ different rates

The mitochondrion
• Primary site of oxidative phosphorylation
• Contains own genome• Gene sequences suggest
closest relationship with -proteobacteria
• Believed to be of endosymbiotic origin
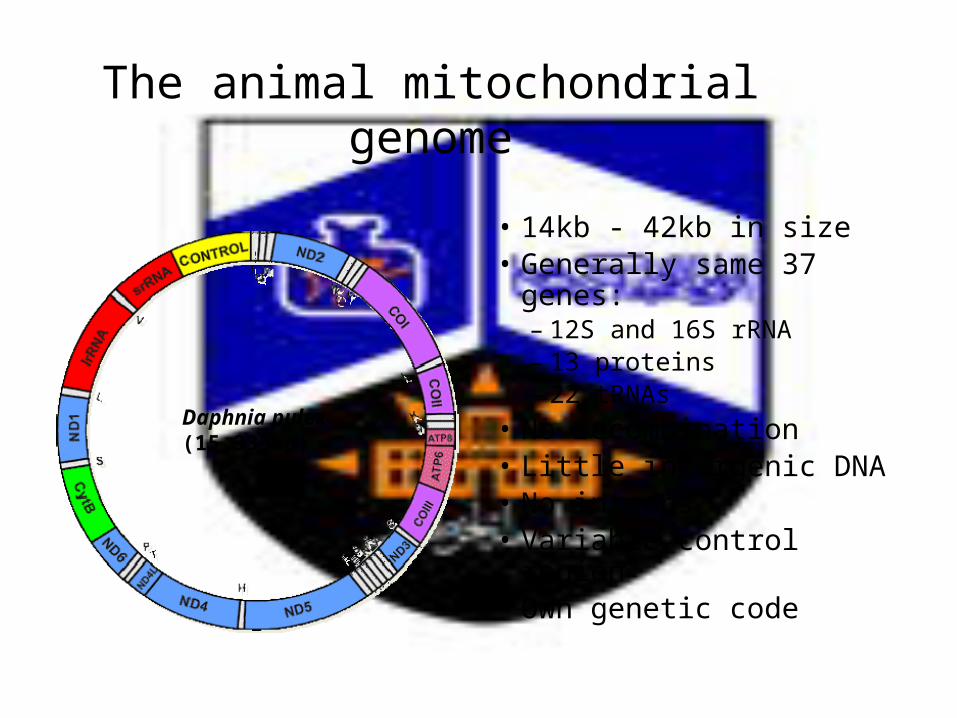
The animal mitochondrial genome
Daphnia pulex(15,333bp)
• 14kb - 42kb in size• Generally same 37 genes:
– 12S and 16S rRNA– 13 proteins– 22 tRNAs
• No recombination• Little intergenic DNA• No introns• Variable control region• Own genetic code
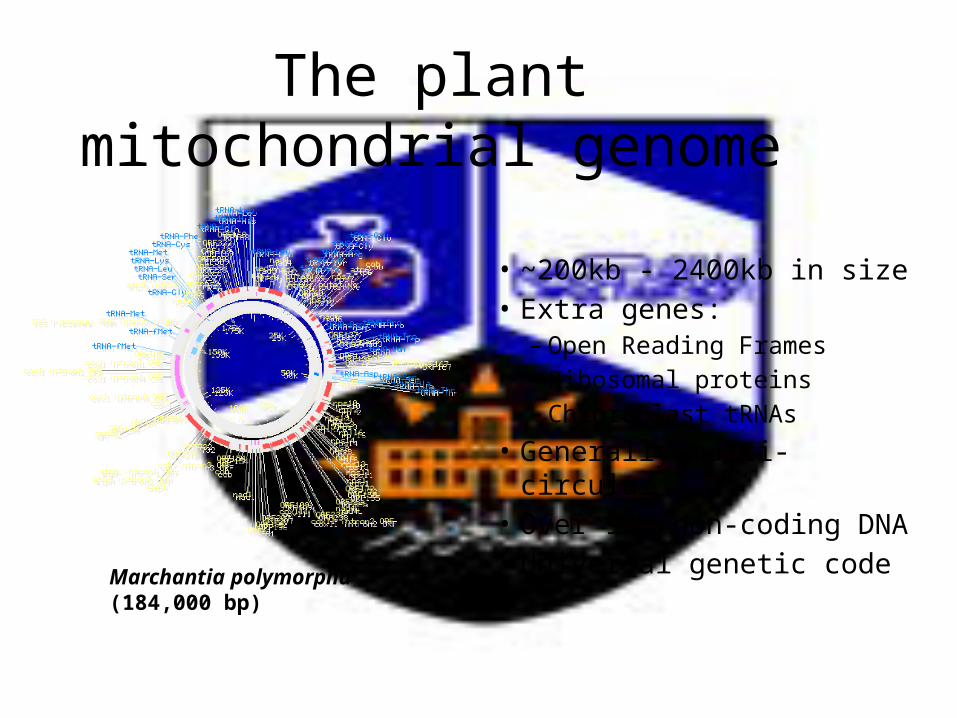
The plant mitochondrial genome
• ~200kb - 2400kb in size• Extra genes:
– Open Reading Frames– Ribosomal proteins– Chloroplast tRNAs
• Generally multi-circular• Over 90% non-coding DNA• Universal genetic code
Marchantia polymorpha(184,000 bp)
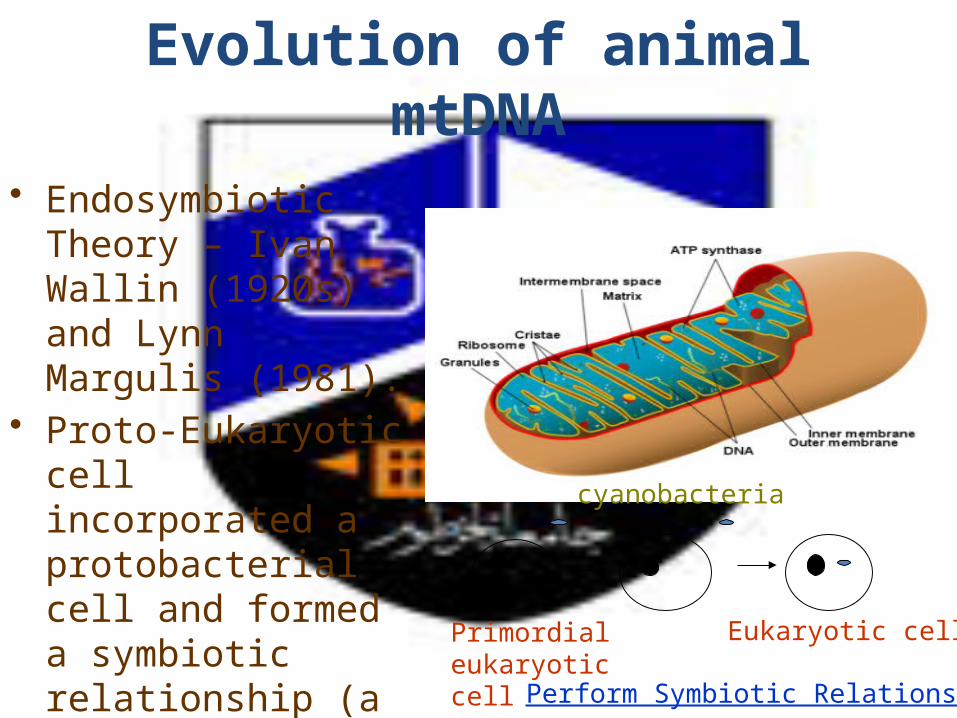
Evolution of animal mtDNA
• Endosymbiotic Theory – Ivan Wallin (1920s) and Lynn Margulis (1981).
• Proto-Eukaryotic cell incorporated a protobacterial cell and formed a symbiotic relationship (a billion years ago).
Primordial eukaryotic cell
cyanobacteria
Eukaryotic cell
Perform Symbiotic Relationship
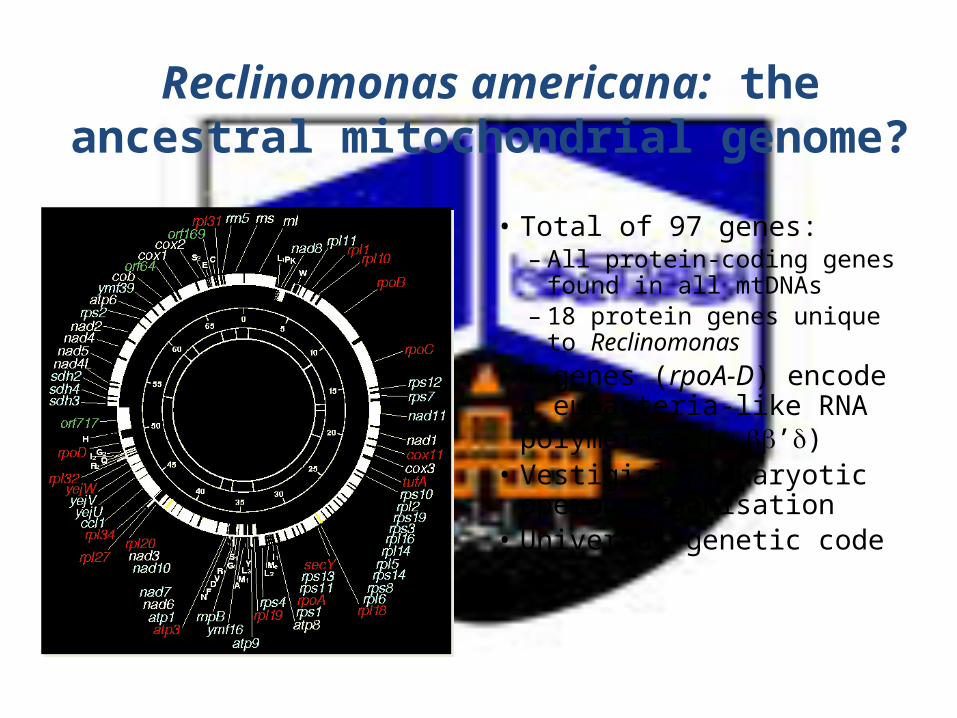
Reclinomonas americana: the ancestral mitochondrial genome?
• Total of 97 genes:– All protein-coding genes
found in all mtDNAs– 18 protein genes unique to
Reclinomonas
• 4 genes (rpoA-D) encode a eubacteria-like RNA polymerase (2’)
• Vestigial prokaryotic operon organisation
• Universal genetic code
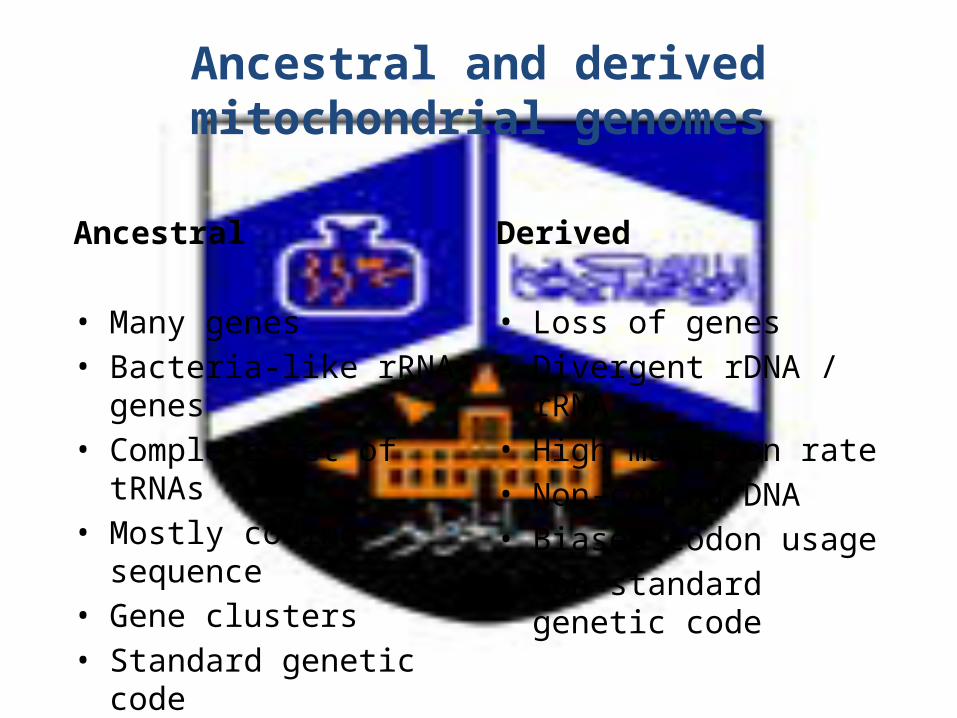
Ancestral and derived mitochondrial genomes
Ancestral
• Many genes• Bacteria-like rRNA genes• Complete set of tRNAs• Mostly coding sequence• Gene clusters• Standard genetic code
Derived
• Loss of genes• Divergent rDNA / rRNA• High mutation rate• Non-coding DNA• Biased codon usage• Non-standard genetic code

Mitochondrial phylogeny - a separate origin for plant mtDNA?
• Presence of unique 5S RNA gene in plant mtDNA and structural difference led to theory of separate origin of mitochondria for plants
• Analysis of mitochondrial proteins gave topology similar to nuclear gene-derived phylogenies acquired before radiation of eukaryotes
Neurospora crassaPodospora anserina
Aspergillus nidulansSaccharomyces cerevisiaeHomo sapiens
Mus musculusXenopus laevis
Strongylocentrosus purpuratusDrosophila yakuba
Oryza sativaTriticum aestivum
Oenothera berterianaMarchantia polymorphaProthoteca wickerhamii
Chondrus crispusCyanidium caldarium
Acanthamoeba castellanii
cox1/cox2/cob amino acid sequence

Final remarks
• Mitochondria seem to be monophyletic in origin, derived from a common protomitochondrial ancestor
• Continuing quest for mtDNAs older than Reclinomonas americana containing more genes
• Studies of early-diverging protists to find minimally-diverged -proteobacterial relatives of mitochondria
• Implications for phylogeny of eukaryotes• Evolution of plant mitochondrial genomes radically
different

The neutral theory of molecular evolution
Kimura (1968)
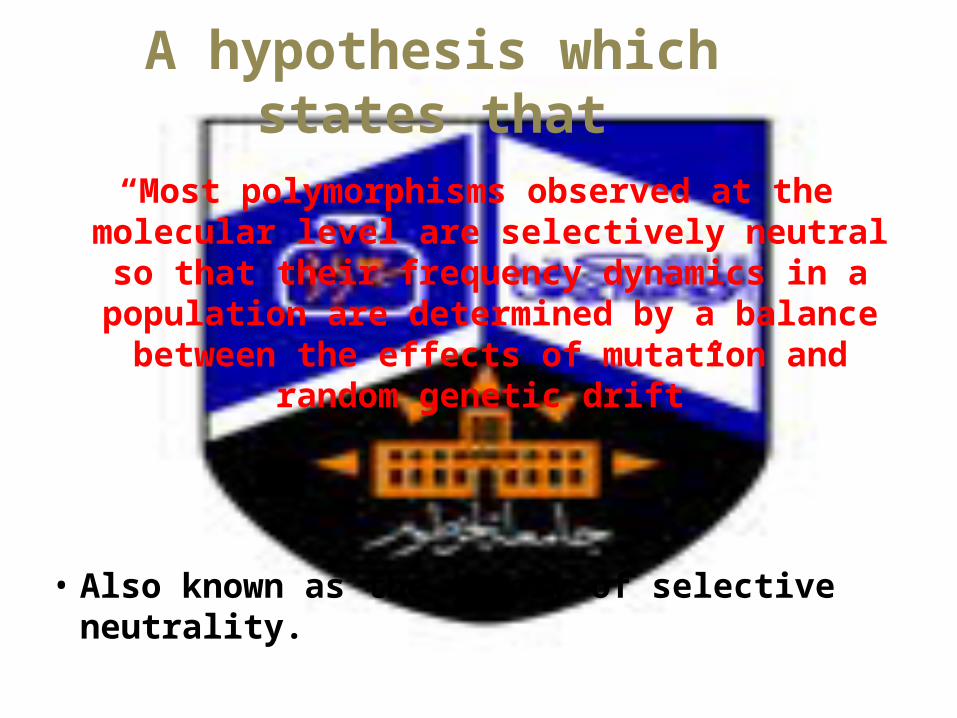
A hypothesis which states that“Most polymorphisms observed at the molecular
level are selectively neutral so that their frequency dynamics in a population are
determined by a balance between the effects of mutation and random genetic drift”
• Also known as the theory of selective neutrality.

theoretical principles implications (Kimura, 1983)
1. If a population contain a neutral allele with the allele frequency Po=>Pr(allele to become fixed)=Po, Po=1/2N (i.e. a mutant allele arising in a smaller pop. has higher chance of fixation).
2. The steady-state rate at which neutral mutations are fixed in a population= μ=(1/2N)(2Nμ), whereas 2Nμ is the average # of new neutral mutations/generation.
3. The average time between neutral substitutions = 1/ μ.4. Among newly arising neutral alleles destinied to be fixed, the average
time of fixation=4Ne generations, where Ne= effective population size. Among newly arising neutral alleles destinied to be lost, the average time to loss=(2Ne/N)ln(2N) generations.
5. If each neutral mutation created an allele that is different from all existing others (IAM), then at equilibrium, the expected homozygosity= 1/4Neμ+1

Theta (θ): the population parameter
• Θ= 4Neμ • where μ= neutral mutation rate.• ThenThe average Homozygosity at equilibrium
between mutation & genetic drift=1/ θ+1• Heterozygosity=1-homozygosityIn IAM, @ equilibrium, the average
heterozygosity= 1- (1/ θ+1)= θ/ θ+1

Detection of natural selection• Different tests were developed to test for neutrality. • Some approaches to determine whether molecular
variation is consistent with the neutral theory and to potentially detect purifying and positive selection:
Tajima (1989) Genetics 123:585-595.Fu (1997) Genetics 147:915-925.Fu & Li (1993) Genetics 133:693-709.Fu (1996) Genetics 143:557-570.
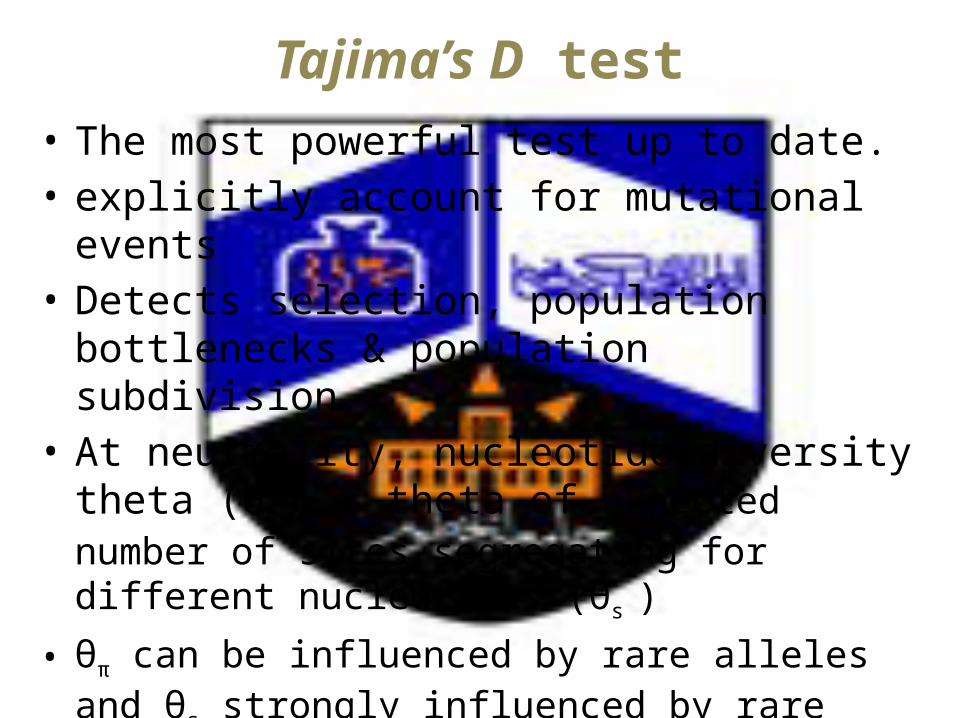
Tajima’s D test• The most powerful test up to date.• explicitly account for mutational events• Detects selection, population bottlenecks &
population subdivision. • At neutrality, nucleotide diversity theta (θπ ) = theta
of expected number of sites segregating for different nucleotides (θs )
• θπ can be influenced by rare alleles and θs strongly influenced by rare alleles

Tajima’s D test is defined as
• Where d= θπ - θs and k is the average number of nucleotide sites that are different.
use MEGA4 software for sequence data
Tajima’s D values• In populations at neutral equilibrium, Tajima’s D should equal
zero; • In cases of slightly deleterious variants, θs will be greater than
θπ and D will be negative;• In demographic events such as a population growth from an
equilibrium situation, S will grow faster than π leading to a negative D as well.
• In cases of heterozygote advantage S will be reduced and the estimates of θπ greater and D will be positive.
• Distinguishing between negative values of D due to selection and those due to demographic events may prove difficult.

3 main approaches to analyse your data
• In genome-wide association studies GWAS, analysis to capture genetic differentiation:
a) Bayesian clustering, b) Principal component (PC) analysis c) Multidimensional scaling (MDS) analysis
based upon genome-wide identity-by-state (IBS) distances
PC & MDS methodologies became increasingly popular because they require less computing power and have higher discriminatory power than Bayesian analysis for closely related (e.g. European) populations.