County-Scale Spatial Variability of Macronutrient ...gis.geog.uconn.edu/personal/paper1/journal...
11
Research Article County-Scale Spatial Variability of Macronutrient Availability Ratios in Paddy Soils Mingkai Qu, 1 Weidong Li, 2 and Chuanrong Zhang 2 1 Key Laboratory of Soil Environment and Pollution Remediation, Institute of Soil Science, Chinese Academy of Sciences, Nanjing 210008, China 2 Department of Geography and Center for Environmental Sciences and Engineering, University of Connecticut, Storrs, CT 06269, USA Correspondence should be addressed to Weidong Li; [email protected] Received 22 June 2013; Revised 5 January 2014; Accepted 9 January 2014; Published 11 March 2014 Academic Editor: Davey Jones Copyright © 2014 Mingkai Qu et al. is is an open access article distributed under the Creative Commons Attribution License, which permits unrestricted use, distribution, and reproduction in any medium, provided the original work is properly cited. Macronutrients (N, P, and K) are essential to plants but also can be harmful to the environment when their available concentrations in soil are excessive. Availability ratios (available concentration/total concentration) of macronutrients may reflect their transforming potential between fixed and available forms in soil. Understanding their spatial distributions and impact factors can be, therefore, helpful to applying specific measures to modify the availability of macronutrients for agricultural and environmental management purposes. In this study, 636 topsoil samples (0–15cm) were collected from paddy fields in Shayang County, Central China, for measuring soil properties. Factors influencing macronutrient availability ratios were investigated, and total and available concentrations of macronutrients were mapped using geostatistical method. Spatial distribution maps of macronutrient availability ratios were further derived. Results show that (1) availability of macronutrients is controlled by multiple factors, and (2) macronutrient availability ratios are spatially varied and may not always have spatial patterns identical to those of their corresponding total and available concentrations. ese results are more useful than traditional soil macronutrient average content data for guiding site-specific field management for agricultural production and environmental protection. 1. Introduction Soil macronutrients (i.e., Nitrogen (N), phosphorus (P), and potassium (K)) are essential to plants [1]. ey provide nutrients necessary for plant growth, which are important to maintain ecosystems and high crop yields. However, macronutrients, particularly N, and P can be potentially haz- ardous to water resources when their available components in soils are excessive, because available macronutrients can be transported off site in runoff due to rain or irrigation [2–4]. Improper or excessive fertilization has increasingly become a serious problem and the eutrophication problem caused by the losses of N and P from farmland to water bodies has caught people’s attentions [5–7]. erefore, proper management of soil N, P, and K is necessary to avoid deteri- orating the environment while meeting the requirement of high crop productivity. In addition, reducing the losses of macronutrients from farmland also can save the costs spent on fertilizers. Most of macronutrient contents exist in fixed forms in soils (e.g., contained in organic matter and minerals) and thus cannot be directly utilized by plants or transported to water bodies. Part of fertilizers applied to soil also can be fixed by soil and thus become unavailable to plants. is means that the total content of a macronutrient in soil is only a potentially available content in a long term, rather than its currently available content. Apparently the total content and the avail- able content of a macronutrient are two different measures for the macronutrient in soil, and it is the availability ratio (i.e., available concentration/total concentration) that represents the potential effectiveness of a specific macronutrient in soil. at is to say, all the three indices may be necessary to understand the general situation of a macronutrient in soil. It is, therefore, important to investigate the spatial variability of availability ratios of soil macronutrients and corresponding controlling factors so that proper measures may be taken to modify the availability of the macronutrients for site-specific management. Hindawi Publishing Corporation Applied and Environmental Soil Science Volume 2014, Article ID 689482, 10 pages http://dx.doi.org/10.1155/2014/689482
-
Upload
vuongthien -
Category
Documents
-
view
219 -
download
1
Transcript of County-Scale Spatial Variability of Macronutrient ...gis.geog.uconn.edu/personal/paper1/journal...
Research ArticleCounty-Scale Spatial Variability of Macronutrient AvailabilityRatios in Paddy Soils
Mingkai Qu1 Weidong Li2 and Chuanrong Zhang2
1 Key Laboratory of Soil Environment and Pollution Remediation Institute of Soil Science Chinese Academy of SciencesNanjing 210008 China
2Department of Geography and Center for Environmental Sciences and Engineering University of Connecticut Storrs CT 06269 USA
Correspondence should be addressed to Weidong Li weidongwoodygmailcom
Received 22 June 2013 Revised 5 January 2014 Accepted 9 January 2014 Published 11 March 2014
Academic Editor Davey Jones
Copyright copy 2014 Mingkai Qu et al This is an open access article distributed under the Creative Commons Attribution Licensewhich permits unrestricted use distribution and reproduction in any medium provided the original work is properly cited
Macronutrients (N P and K) are essential to plants but also can be harmful to the environment when their availableconcentrations in soil are excessive Availability ratios (available concentrationtotal concentration) of macronutrients may reflecttheir transforming potential between fixed and available forms in soil Understanding their spatial distributions and impactfactors can be therefore helpful to applying specific measures to modify the availability of macronutrients for agricultural andenvironmental management purposes In this study 636 topsoil samples (0ndash15 cm) were collected from paddy fields in ShayangCounty Central China for measuring soil properties Factors influencing macronutrient availability ratios were investigatedand total and available concentrations of macronutrients were mapped using geostatistical method Spatial distribution maps ofmacronutrient availability ratios were further derived Results show that (1) availability of macronutrients is controlled by multiplefactors and (2) macronutrient availability ratios are spatially varied and may not always have spatial patterns identical to those oftheir corresponding total and available concentrations These results are more useful than traditional soil macronutrient averagecontent data for guiding site-specific field management for agricultural production and environmental protection
1 Introduction
Soil macronutrients (ie Nitrogen (N) phosphorus (P) andpotassium (K)) are essential to plants [1] They providenutrients necessary for plant growth which are importantto maintain ecosystems and high crop yields Howevermacronutrients particularly N and P can be potentially haz-ardous to water resources when their available componentsin soils are excessive because available macronutrients canbe transported off site in runoff due to rain or irrigation[2ndash4] Improper or excessive fertilization has increasinglybecome a serious problem and the eutrophication problemcaused by the losses of N and P from farmland to waterbodies has caught peoplersquos attentions [5ndash7]Therefore propermanagement of soil N P and K is necessary to avoid deteri-orating the environment while meeting the requirement ofhigh crop productivity In addition reducing the losses ofmacronutrients from farmland also can save the costs spenton fertilizers
Most of macronutrient contents exist in fixed forms insoils (eg contained in organicmatter andminerals) and thuscannot be directly utilized by plants or transported to waterbodies Part of fertilizers applied to soil also can be fixed bysoil and thus become unavailable to plants This means thatthe total content of amacronutrient in soil is only a potentiallyavailable content in a long term rather than its currentlyavailable content Apparently the total content and the avail-able content of amacronutrient are two differentmeasures forthe macronutrient in soil and it is the availability ratio (ieavailable concentrationtotal concentration) that representsthe potential effectiveness of a specific macronutrient in soilThat is to say all the three indices may be necessary tounderstand the general situation of a macronutrient in soilIt is therefore important to investigate the spatial variabilityof availability ratios of soilmacronutrients and correspondingcontrolling factors so that proper measures may be taken tomodify the availability of the macronutrients for site-specificmanagement
Hindawi Publishing CorporationApplied and Environmental Soil ScienceVolume 2014 Article ID 689482 10 pageshttpdxdoiorg1011552014689482
2 Applied and Environmental Soil Science
In addition to macronutrients micronutrients and tracemetals in soil also have similar problems and their availabilityratios in soil are also important indices for agricultural andenvironmental management Recently Wu et al [8] studiedthe variability of Cu availability in soil and its relation to somesoil properties in a 731 km2 region in southeast China Theirresults showed that Cu availability ratio has a distributionaltrend similar to those of total Cu concentration and availableCu concentrationwhich are similar to each other Zhang et al[9] modeled the availability ratio of Cu in soil in FuyangCounty China using the general regression neural networkmethod Although many studies on the spatial variabilityof soil N P and K were conducted in last several decades[10ndash20] most of them however were focused on their totalcontents or available contents in agricultural fields andstudies on the spatial distributions of their availability ratiosin soils and corresponding impact factors at regional scaleswere rarely seen Therefore a study on the spatial variabilityof availability ratios of soil macronutrients and their impactfactors in soil at a regional scale should be interestingand may provide valuable information to soil scientists andagricultural managers
The objectives of this study were to (1) analyze the rela-tionships between some soil properties and the availabilityof soil N P and K (2) determine the controlling factors onthe availability ratios of macronutrients (3) map the spatialdistributions of the indices of macronutrients in paddy soilsat a regional scale and (4) understand the characteristics ofspatial patterns of macronutrient availability ratios ShayangCounty in central China was selected as our case study areaThis paper will provide an example for the availability ratiostudy of soil macronutrients and results of such kind of stud-ies will be helpful to decision making in applying concretemeasures to modify the availability of soil macronutrients forsite-specific agricultural management purposes
2 Materials and Methods
21 Study Area Shayang County Hubei Province in centralChina was selected as the study areaThe county is among themost developed regions for cropping in Hubei Province andis located in the Jianghan Plain bounded by the longitudes112∘031015840 and 112∘431015840 east and the latitudes 30∘231015840 and 30∘571015840north with an area of 2044 km2 It belongs to the northernsubtropicalmonsoonal climate zonewith a temperate-humidclimate throughout the year and four distinct seasons Theaverage annual temperature is 161∘C and the mean annualprecipitation is 10256mm In this region paddy fields con-stitute the dominant land use type of arable lands
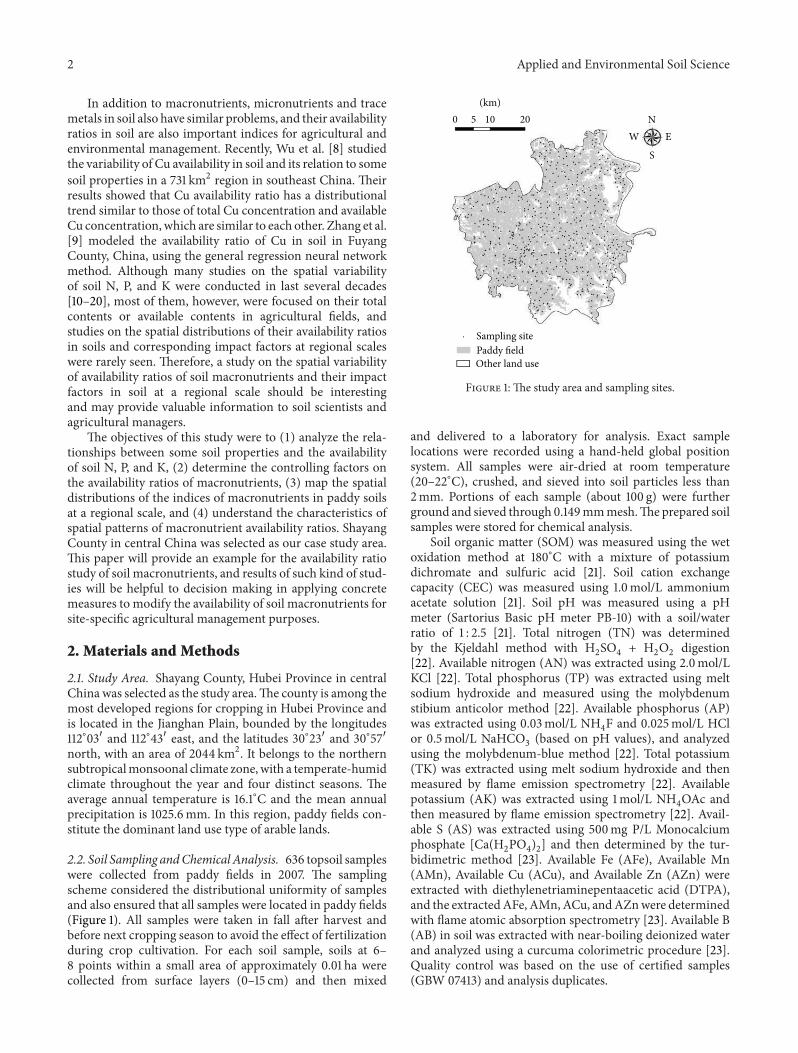
22 Soil Sampling andChemical Analysis 636 topsoil sampleswere collected from paddy fields in 2007 The samplingscheme considered the distributional uniformity of samplesand also ensured that all samples were located in paddy fields(Figure 1) All samples were taken in fall after harvest andbefore next cropping season to avoid the effect of fertilizationduring crop cultivation For each soil sample soils at 6ndash8 points within a small area of approximately 001 ha werecollected from surface layers (0ndash15 cm) and then mixed
0 5 10 20
(km)N
W E
S
Sampling sitePaddy fieldOther land use
Figure 1 The study area and sampling sites
and delivered to a laboratory for analysis Exact samplelocations were recorded using a hand-held global positionsystem All samples were air-dried at room temperature(20ndash22∘C) crushed and sieved into soil particles less than2mm Portions of each sample (about 100 g) were furtherground and sieved through 0149mmmeshTheprepared soilsamples were stored for chemical analysis
Soil organic matter (SOM) was measured using the wetoxidation method at 180∘C with a mixture of potassiumdichromate and sulfuric acid [21] Soil cation exchangecapacity (CEC) was measured using 10molL ammoniumacetate solution [21] Soil pH was measured using a pHmeter (Sartorius Basic pH meter PB-10) with a soilwaterratio of 1 25 [21] Total nitrogen (TN) was determinedby the Kjeldahl method with H
2SO4+ H2O2digestion
[22] Available nitrogen (AN) was extracted using 20molLKCl [22] Total phosphorus (TP) was extracted using meltsodium hydroxide and measured using the molybdenumstibium anticolor method [22] Available phosphorus (AP)was extracted using 003molL NH
4F and 0025molL HCl
or 05molL NaHCO3(based on pH values) and analyzed
using the molybdenum-blue method [22] Total potassium(TK) was extracted using melt sodium hydroxide and thenmeasured by flame emission spectrometry [22] Availablepotassium (AK) was extracted using 1molL NH
4OAc and
then measured by flame emission spectrometry [22] Avail-able S (AS) was extracted using 500mg PL Monocalciumphosphate [Ca(H
2PO4)2] and then determined by the tur-
bidimetric method [23] Available Fe (AFe) Available Mn(AMn) Available Cu (ACu) and Available Zn (AZn) wereextracted with diethylenetriaminepentaacetic acid (DTPA)and the extractedAFe AMnACu andAZnwere determinedwith flame atomic absorption spectrometry [23] Available B(AB) in soil was extracted with near-boiling deionized waterand analyzed using a curcuma colorimetric procedure [23]Quality control was based on the use of certified samples(GBW 07413) and analysis duplicates
Applied and Environmental Soil Science 3
Table 1 Summary statistics for macronutrient elements and other selected properties of paddy soils (119899 = 636)
Range Minimum Maximum Mean SD Skewness Kurtosis CV ()N availability ratio () 1413 338 1750 943 133 109 545 1407P availability ratio () 3188 012 3200 245 308 476 3111 12536K availability ratio () 451 013 464 056 035 397 3308 6181TN (gkg) 187 048 235 144 031 minus037 014 2169AN (mgkg) 18100 4500 22600 13464 2815 minus045 018 2091TP (gkg) 1565 015 1580 074 066 1875 42686 8873ln TP 466 minus190 276 minus041 046 minus029 407 minus11204
AP (mgkg) 9300 200 9500 1403 1121 255 973 7989lnAP 386 069 455 239 071 minus002 minus001 2954TK (gkg) 2836 733 3569 1996 341 091 187 1707ln TK 158 199 357 298 017 minus005 300 561AK (mgkg) 40000 2500 42500 11111 6466 187 443 5820lnAK 283 322 605 457 053 001 034 1160SOM (gkg) 3565 489 4054 2311 531 minus060 007 2297pH 300 510 810 661 067 076 minus019 1008CEC (cmol (+)kg) 3042 108 3150 1278 419 004 083 3279AB (mgkg) 504 010 514 064 055 359 1816 8673ACu (mgkg) 528 061 589 270 089 045 minus011 3308AZn (mgkg) 839 012 851 138 073 240 1520 5258AMn (mgkg) 54541 579 55120 3308 2579 1292 25627 7796AFe (mgkg) 34974 603 35577 11878 8918 067 minus099 7508AS (mgkg) 18265 785 19050 4125 2199 142 458 5330
23 Availability Ratio The availability ratio of a soil macro-nutrient (N P or K) at a given location is calculated using thefollowing equation
119877 =119860 (u)119879 (u) times 1000
times 100 (1)
where 119877 represents the availability ratio () u refers to aspecific location 119860(u) is the available concentration of a soilmacronutrient at location u with a unit of mgkg 119879(u) is thetotal concentration of the soil macronutrient at location uwith a unit of gkg
24 CorrelationAnalysis Correlation analysiswas conductedto reveal relationships between availability ratios of N P andK and selected soil properties (ie TN AN TP AP TKAK AFe AMn AS ACu AZn AB pH SOM and CEC)The significant level reported (ie 119875 lt 001) was based onPearsonrsquos correlation coefficients The software used is SPSSR130 for Windows
We also performed stepwise regression analysis to selectthe main factors that affect the availability ratios of soilN P and K using the SPSS R130 software Usually manypossible explanatory variablesmay exist in a data setThrougha stepwise regression process explanatory variables can beexamined one by one and the one that explains the mostvariation in the dependent variable will be added to themodel at each step When adding an extra variable will makeno significant improvement in the amount of explainedvariation the regression process will stop [24]
25 Geostatistical Analysis Geostatistics provides methodsto predict values at unsampled locations from values at sam-pled locations by taking into account the spatial correlation ofsampled points The variogram the spatial measure for krig-ing is an effective tool for evaluating spatial variability Thevariogram may describe the spatial autocorrelation structureof a continuous variable and provide some insight into pos-sible factors that affect data distribution Spatial patterns ofsoil attributes following intrinsic stationarity can be describedusing variogram models [25]
In this study no apparent anisotropy was found forany studied variable through experimental variograms Soall experimental variograms were in isotropic form andwere fitted using basic math models such as the sphericaland exponential models for kriging interpolation Ordinarykriging was chosen to create the spatial distribution maps ofsoil N P and K contents with the maximum search radiusbeing set to the autocorrelation range of the correspondingvariableThe interpolated grid had a resolution of 20079m times20079m Readers may see Chiles and Delfiner [26] fordetailed description of kriging and the variogram The Soft-ware GSLIB was used to conduct all the geostatistical work
3 Results and Discussions
31 Correlation Analysis and Controlling Factors The sum-mary statistics of soil N P and K and selected soil properties(pH SOM CEC AFe AMn AS ACu AZn and AB) arelisted in Table 1 The coefficients of variation (CVs) foravailability ratios of N P and K are 1407 12536 and
4 Applied and Environmental Soil Science
618 respectively This means that the availability ratiosof P and K have much larger variability than those of Nin the study area This situation may be caused by someextrinsic factors such as different fertilizer applications andseasonal cropping which have stronger impacts on availableP and K In fact TP AP and AK indeed have large CV valuesTable 1 also shows that CEC AB ACu AZn AMn AFeand AS have relatively high CV values (gt25) reflecting thecomplex heterogeneity of paddy soils in the study area
Pearsonrsquos correlation coefficients were calculated for eachvariable to reveal the relationships between the availabilityratios of macronutrients and the selected soil properties(see Table 2) Apparently the availability ratio of everymacronutrient is negatively correlated with its total contentand positively correlated with its available content as shownin Table 2 However the correlation situations between avail-ability ratio and total and available contents are different fordifferent macronutrientsThe availability ratio of K has a veryweak negative correlation with TK and a very strong positivecorrelation with AK This implies that the TK content in soilis relatively stable over the study area and a considerableamount of AK may come from outside input The strongpositive correlation between P availability ratio and AP alsoindicates that outside input may contribute a lot to soilAP However the availability ratio of N does not have suchcharacteristic and it is relatively more strongly impacted byTN This means that most AN in paddy soils may comefrom SOM and this point is supported by the strong positivecorrelation between AN and SOM In general the availablecontents of K and P are more decisive to their availabilityratios on the contrary the total content of N hasmore impacton its availability ratio
Checking the correlation situations of other soil prop-erties with N P and K one can find that these selectedproperties each have similar positive or negative influenceson AN and TN (Table 2) This may explain why the avail-ability ratio of N is less correlated with other soil properties(the largest correlation coefficient is with SOM which isminus0135 119875 lt 001) However the selected soil propertieshave much stronger correlations with AP and TK than withTP and AK although these correlations are mostly weakerthan those with TN and AN For example both pH andAB show strong correlations with TK but weak correlationswith AK The correlations of availability ratios of N P andK with the selected soil properties are generally not strongThe availability ratio of P is moderately correlated with ACuand AFe (119903
119904= 0261 and 0266 respectively 119875 lt 001) The
availability ratio of K is moderately correlated with CEC andAZn (119903
119904= 0252 and 0367 respectively 119875 lt 001)
Stepwise regression analysis was performed for the avail-ability ratios ofN P andK by using all of other soil propertiesas independent variables The results are given as follows
119884(N availability ratio )
= 8669 minus 7063119883(TN) + 0075119883(AN) + 0106119883(PH)
+ 0004119883(AP) + 0061119883(AZn) + 0069119883(AB)
(1198772= 091)
119884(P availability ratio )
= minus2533 + 0203119883(AP) minus 0992119883(TP)
+ 0004119883(AFe) + 0359119883(PH) (119877
2= 086)
119884(K availability ratio )
= 0497 + 0005119883(AK) minus 0036119883(TK)
+ 0026119883(PH) + 0027119883(AB) (119877
2= 093)
(2)
The coefficients of determination (1198772) provided after each ofabove regression models indicate that all of three multiplelinear regression models are well fitted by sample data Itcan be seen that the availability ratios of N P and K are allinfluenced bymultiple factorswhich are also interrelatedwitheach other Stepwise regression could find major controllingfactors Above equations indicate that the availability ratioof N is mainly controlled by TN AN pH AP AZn andAB the availability ratio of P mainly depends on AP TPAFe and pH and that of K is mainly contributed by AKTK pH and AB These results are not fully consistent withthe Pearsonrsquos correlation coefficients in Table 2 For examplepH appears to be an important positive contributing factorto the availability ratios of all macronutrients here howeverits correlation coefficients with these availability ratios arequite small in absolute values and are not all positive Thereason may be that a Pearsonrsquos correlation coefficient onlyreflects the linear correlation between two variables but aregression coefficient in a multiple linear regression model isalso related with other predictor variables and impacted bythe multicollinearity problem
32 Spatial Structure and Distributional Patterns Geostatis-tical methods were used to analyze the spatial correlationstructures of the total and available contents of N P andK in soil and spatially estimate their values at unsampledlocations Because kriging assumes the normal distributionfor each estimated variable it is necessary to check whetherthe total and available contents of N P and K in soil samplesare approximately normally distributed or not From Table 1one can see that the skewness and kurtosis indices of TNand AN are close to the standard value of 0 but those of TPAP TK and AK are not In this study natural logarithmictransformation was used to reduce the skewness of the datadistributions of P and K The histograms of N P and K dataused for geostatistical interpolation are shown in Figure 2One can see that they tend to be normally distributed
Experimental variograms and fitted models for TNAN ln(TP) ln(AP) ln(TK) and ln(AK) are presented inFigure 3 Spherical models are chosen for TN and ln(AK)Gaussian models for ln(TP) and ln(AP) and exponentialmodels for AN and ln(TK) The nuggetsill ratio (119862
0(119862 +
1198620)) may be used as a criterion to reflect the spatial
autodependency of a variable Ratio values lower than25 between 25 and 75 and higher than 75 corre-spond to strong moderate and weak spatial dependencies
Applied and Environmental Soil Science 5
Table2Pearsonrsquos
correlationcoeffi
cientsbetweenmacronu
trient
elementsandotherselectedsoilprop
ertie
s
TNAN
TPAP
TKAK
pHSO
MCE
CAB
AZn
ACu
AFe
AMn
AS
Navailabilityratiominus0374lowastlowast0186lowastlowastminus0036minus0038minus0032minus0117lowastlowast
0022minus0135lowastlowastminus0025minus0014minus0088lowastminus0102lowastlowastminus0049minus0058minus0099lowast
Pavailabilityratio0196lowastlowast0180lowastlowastminus0208lowastlowast0755lowastlowastminus0096lowast0242lowastlowastminus0098lowast0219lowastlowast0122lowastlowastminus0098lowast0218lowastlowast0261lowastlowast0266lowastlowastminus00230193lowastlowast
Kavailabilityratio0255lowastlowast0182lowastlowast
00650332lowastlowastminus00390901lowastlowastminus00470236lowastlowast0252lowastlowastminus00100367lowastlowast0226lowastlowast0123lowastlowast
0053
006
4
TN0826lowastlowast
00630298lowastlowastminus0297lowastlowast0199lowastlowastminus0578lowastlowast0877lowastlowast0437lowastlowastminus0269lowastlowast0305lowastlowast0519lowastlowast0473lowastlowastminus0090lowast0240lowastlowast
AN
004
20272lowastlowastminus0345lowastlowast0118lowastlowastminus0629lowastlowast0853lowastlowast0459lowastlowastminus0320lowastlowast0246lowastlowast0484lowastlowast0469lowastlowastminus0142lowastlowast0200lowastlowast
TP000
400170080lowastminus002400550025
00160043
0023
0029
0017
0030
AP
minus0122lowastlowast0306lowastlowastminus0180lowastlowast0295lowastlowast0205lowastlowastminus0109lowastlowast0200lowastlowast0310lowastlowast0244lowastlowastminus00440188lowastlowast
TK0268lowastlowast0583lowastlowastminus0353lowastlowastminus0246lowastlowast0487lowastlowastminus0154lowastlowastminus0303lowastlowastminus0260lowastlowast0166lowastlowastminus0235lowastlowast
AK
0089lowast0169lowastlowast0197lowastlowast0097lowast0327lowastlowast0161lowastlowast
006
60098lowast
0002
lowast119875lt005lowastlowast119875lt001
6 Applied and Environmental Soil Science
60
50
40
30
20
10
0050 100 150 200
TN
Freq
uenc
y
(a)
125
100
75
50
25
0minus200 minus100 000 100 200 300
ln(TP)Fr
eque
ncy
(b)
ln(TK)
150
100
50
0200 250 300 350
Freq
uenc
y
(c)
60
40
20
0
Freq
uenc
y
AN5000 10000 15000 20000
(d)
60
40
20
0
Freq
uenc
y
100 200 300 400
ln(AP)
(e)
80
60
40
20
0300 350 400 450 500 550 600
ln(AK)
Freq
uenc
y(f)
Figure 2 Histograms of TN (a) ln(TP) (b) ln(TK) (c) AN (d) ln(AP) (e) and ln(AK) (f)
012
008
004
000000 1000 2000 3000 4000 5000
TN
120574
Distance (km)
Model sphericalC0(C + C0) 042Range 3615 km
(a)
030
020
010
000000 400 800 1200 1600 2000
120574
Distance (km)
Model gaussianC0(C + C0) 071
Range 204 km
ln(TP)
(b)
0025
0020
0015
0010
0005
0000000 1000 2000 3000
120574
Distance (km)
Model exponentialC0(C + C0) 033Range 2529 km
ln(TK)
(c)
1200
800
400
0000 1000 2000 3000 4000 5000
AN
120574
Distance (km)
Model exponentialC0(C + C0) 036Range 5946km
(d)
040
030
020
010
000000 400 800 1200 1600 2000
120574
Distance (km)
Model gaussianC0(C + C0) 075
Range 500 km
ln(AP)
(e)
030
020
010
000000 400 800 1200 1600 2000
120574
Distance (km)
Model sphericalC0(C + C0) 065
Range 300 km
ln(AK)
(f)
Figure 3 Experimental variograms of TN (a) ln(TP) (b) ln(TK) (c) AN (d) ln(AP) (e) and ln(AK) (f) and their fitted models
Applied and Environmental Soil Science 7
N
EW
S
067sim082
083sim094
095sim110
111sim134
135sim148
149sim158
159sim168
169sim179
TN (gkg)0 5 10 20
(km)
(a)
N
EW
S
AN (mgkg)6388sim8022
8023sim9222
9223sim10575
10576sim12546
12547sim13905
13906sim14933
14934sim16066
16067sim18492
0 5 10 20
(km)
(b)
N
EW
S
0 5 10 20
(km)
TP (gkg)005sim027
028sim047
048sim064
065sim084
085sim110
111sim239
240sim634
635sim1056
(c)
N
EW
S
234sim412
413sim748
749sim1091
1092sim1542
1543sim1956
1957sim2407
2408sim7073
7074sim14074
AP (mgkg)0 5 10 20
(km)
(d)
N
EW
S
1238sim1550
1551sim1637
1638sim1737
1738sim1850
1851sim2002
2003sim2211
2212sim2660
2661sim2868
TK (gkg)0 5 10 20
(km)
(e)
N
EW
S
2948sim5418
5419sim6764
6765sim8031
8032sim10526
10527sim13139
13140sim15653
15654sim17435
17436sim42087
AK (mgkg)0 5 10 20
(km)
(f)
Figure 4 Spatial distribution maps of TN (a) AN (b) TP (c) AP (d) TK (e) and AK (f) interpolated by ordinary kriging
respectively [11] The nuggetsill ratios of variogram modelsfor TN AN ln(TP) ln(AP) ln(TK) and ln(AK) all fallbetween 25 and 75 which indicates that all of the sixproperties exhibit moderate spatial dependency Accordingto Cambardella et al [11] these spatial autodependenciesmaybe attributed to both intrinsic factors such as other soil prop-erties and extrinsic factors such as human activities Thecorrelation range measures the spatial separate distancewithin which data are autocorrelated [27] The approximatecorrelation ranges for TN AN ln(TP) ln(AP) ln(TK) andln(AK) are 3615 km 5946 km 204 km 500 km 2529 kmand 300 km respectively Apparently AN TN and TK areautocorrelated in longer ranges than TP AP and AK areThisresult is consistent with their CV values This may imply thatTPAP andAKcontents aremore sensitive to extrinsic factorssuch as fertilization
To map the spatial distributions of TN AN TP AP TKand AK we used ordinary kriging to interpolate their respec-tive sample data (Figure 4) After the spatial distributionmaps of the total and available contents of a macronutrientwere obtained its availability ratio map could be furtherderived from the total contentmap and available contentmapby using (1) (ie at each spatial location availability ratio= available contenttotal content) The spatial maps of TNand AN (Figures 4(a) and 4(b)) show similar patterns Thismay be why TN and AN are strongly correlated (119903
119904= 0826
119875 lt 001) However the spatial map of the availability ratio ofN (Figure 5(a)) shows a different spatial pattern This meansthat the contents of AN and TN are not spatially proportionaland they are impacted by other factors with different degreesAP and the availability ratio of P exhibit similar spatial trends(see Figures 4(d) and 5(b)) This should be caused by thestrong correlation (119903
119904= 0755 119875 lt 001) between these
two variables Because AP and TP have almost no correlation(see Table 2) consequently the spatial pattern of P availabilityratio is quite different from that of TPThe spatial distributionmaps of AK and K availability ratio also show similar spatialpatterns which should be caused by their strong (nearlylinear) correlation (119903
119904= 0901 119875 lt 001) (see Figures 4(f)
and 5(c)) The correlation between AK and TK is not strongwhichmay be why they have different spatial patterns and thespatial pattern of K availability ratio is very different from thatof TK
The short autocorrelation ranges of TP AP and AK arereflected on their spatial distribution maps with fragmentarypatterns and this characteristic is further propagated to thespatial distribution maps of the availability ratios of P andK Consequently one can see in Figure 5 that the spatialdistributional characteristics of the availability ratios of NP and K are very different (i) the availability ratio of Nchanges smoothly with large patches while that of K and Pvary abruptly as small pieces or spots in the study area (ii)
8 Applied and Environmental Soil Science
N
EW
S
0 5 10 20
(km)
754sim815
816sim862
863sim900
901sim929
930sim963
964sim995
996sim1077
1078sim1196
N availability ratio ()
(a)
N
EW
S
0 5 10 20
(km)
019sim044
045sim091
092sim152
153sim213
214sim321
322sim429
430sim630
631sim5657
P availability ratio ()
(b)
N
EW
S
0 5 10 20
(km)
013sim028
029sim036
037sim048
049sim057
058sim068
069sim103
104sim137
138sim214
K availability ratio ()
(c)
Figure 5 Spatial distribution maps of availability ratios of N (a) P (b) and K (c) Note that (a) is derived from Figures 4(a) and 4(b) (b) isderived from Figures 4(c) and 4(d) and (c) is derived from Figures 4(e) and 4(f)
high availability ratio values of N mainly appear in severalsubareas in the east and north of the study area and highavailability ratio values of P mainly occur as a series of spotsalong a strip in the southwest while high availability ratiovalues of K mainly emerge as isolated spots often borderedwith very low values These availability ratio maps clearlyshowwhere amacronutrient has low availability andwhere itsavailability is highThus concretemeasuresmight be taken toincrease the low availability or decrease the high availabilityof amacronutrient in a specific area tomeet the requirementsof agricultural production and environmental protection Forexample changing soil pH may help change the efficiency ofsoil nitrogen to be absorbed by plants
It should be noted that the data value ranges (from mini-mum value to maximum value in each legend) in the legendsof Figures 4 and 5 are not consistent with the correspondingvalue ranges of sample data provided in Table 2 The majorreason may be that the locations of interpolated grid valuesby kriging for mapping do not overlap those of sample data
thus the legends show only the value ranges of interpolateddata and sample data values are ignored in the maps
4 Conclusion
The spatial variability of soil N P and K and their availabilityratios in paddy soils in a county were explored After a longhistory of various land management the spatial variabilityof N P and K and their availability ratios in soils are notonly dependent on soil parent materials but also impactedby anthropogenic activities Statistical analysis shows that theavailability ratios of P and K have larger variation than thatof N in the study area probably due to the heterogeneousland use and management The contents of TN AN and TKin paddy fields have relatively longer correlation ranges thanthose of TP AP and AKThe availability ratios of N P and Kare all affected by multiple factors that are also interrelatedThe main factors controlling the availability ratios of N Pand K were determined using stepwise regression analysis N
Applied and Environmental Soil Science 9
availability ratio is mainly related to TN AN pH AP AZnand AB P availability ratio is mainly controlled by AP TPAFe and pH andK availability ratio ismainly affected byAKTK pH and AB
TN and AN contents have similar spatial patterns butN availability ratio has a different spatial pattern howeverthe spatial patterns of availability ratios of P and K areonly similar to those of their available components (ie APand AK) respectively Availability ratios of nutrients in soilmay reflect soilrsquos nutrient holding (or fixing) ability Thedifferent spatial variability characteristics among the totalcontent the available content and the availability ratio ofeach macronutrient indicate that these three indices are alluseful to reflect the general situation of the macronutrient insoil and their spatial maps are all useful data for agriculturaland environmental management
Because the availability ratio of a macronutrient is relatedwith its availability (or efficiency) to plants and its risk ofloss into deep soil or water body proper adjustment ofmacronutrient availability ratios in soil through some mea-sures (eg fertilization liming to change soil pH) may behelpful to improving agricultural productivity and reducingenvironmental hazards Therefore spatial distribution mapsof macronutrient availability ratios may provide useful infor-mation to guide site-specific soil management
Conflict of Interests
The authors declare that there is no conflict of interestsregarding the publication of this paper
Acknowledgment
This work was partially supported by China PostdoctoralScience Foundation (Funded Project 2013M530273)
References
[1] H Marschner Mineral Nutrition of Higher Plants AcademicPress London UK 1995
[2] P Phupaibul C Chitbuntanorm N Chinoim P Kangya-wongha and T Matoh ldquoPhosphorus accumulation in soils andnitrate contamination in underground water under export-oriented asparagus farming in Nong Ngu Lauem VillageNakhon Pathom Province Thailandrdquo Soil Science and PlantNutrition vol 50 no 3 pp 385ndash393 2004
[3] X T Ju C L Kou P Christie Z X Dou and F S ZhangldquoChanges in the soil environment from excessive application offertilizers and manures to two contrasting intensive croppingsystems on the North China Plainrdquo Environmental Pollutionvol 145 no 2 pp 497ndash506 2007
[4] V H Smith G D Tilman and J C Nekola ldquoEutrophicationimpacts of excess nutrient inputs on freshwater marine andterrestrial ecosystemsrdquo Environmental Pollution vol 100 no 1ndash3 pp 179ndash196 1998
[5] A Sharpley ldquoIdentifying sites vulnerable to phosphorus loss inagricultural runoffrdquo Journal of Environmental Quality vol 24no 5 pp 947ndash951 1995
[6] M N Almasri and J J Kaluarachchi ldquoAssessment and man-agement of long-term nitrate pollution of ground water in
agriculture-dominated watershedsrdquo Journal of Hydrology vol295 no 1ndash4 pp 225ndash245 2004
[7] Y Chen B H He X L Zhao and L Zhang ldquoEffect of soilerosion and water loss in Farmland on water eutrophication inXiaojiang River Basinrdquo Journal of Soil and Water Conservationvol 24 pp 31ndash43 2010
[8] C F Wu Y M Luo and L M Zhang ldquoVariability of copperavailability in paddy fields in relation to selected soil propertiesin southeast Chinardquo Geoderma vol 156 no 3-4 pp 200ndash2062010
[9] X Y Zhang Z Y Ling T Y Zhong and K Wang ldquoSimulationof the availability index of soil copper content using generalregression neural networkrdquo Environmental Earth Sciences vol64 no 7 pp 1697ndash1702 2011
[10] J G White and R J Zasoski ldquoMapping soil micronutrientsrdquoField Crops Research vol 60 no 1-2 pp 11ndash26 1999
[11] C A Cambardella T B Moorman J M Novak et al ldquoField-scale variability of soil properties in central Iowa soilsrdquo SoilScience Society of America Journal vol 58 no 5 pp 1501ndash15111994
[12] Y L Bai J Y Jin L P Yang and M Z Liang ldquoResearch on thesubarea management model of soil nutrients by GISrdquo ScientiaAgricultura Sinica vol 34 pp 46ndash50 2001 (Chinese)
[13] R Corstanje S Grunwald K R Reddy T Z Osborne and SNewman ldquoAssessment of the spatial distribution of soil proper-ties in a Northern Everglades marshrdquo Journal of EnvironmentalQuality vol 35 no 3 pp 938ndash949 2006
[14] KWHolmes P C Kyriakidis O A Chadwick J V Soares andD A Roberts ldquoMulti-scale variability in tropical soil nutrientsfollowing land-cover changerdquoBiogeochemistry vol 74 no 2 pp173ndash203 2005
[15] S W Huang J Y Jin L P Yang Y L Bai and C H Li ldquoSpatialvariability of nitrate in cabbage and nitrate-N in soilrdquo SoilScience vol 169 no 9 pp 640ndash649 2004
[16] S W Huang J Y Jin L P Yang and Y L Bai ldquoSpatial vari-ability of soil nutrients and influencing factors in a vegetableproduction area of Hebei Province in Chinardquo Nutrient Cyclingin Agroecosystems vol 75 no 1ndash3 pp 201ndash212 2006
[17] B Huang W X Sun Y C Zhao et al ldquoTemporal andspatial variability of soil organic matter and total nitrogen inan agricultural ecosystem as affected by farming practicesrdquoGeoderma vol 139 no 3-4 pp 336ndash345 2007
[18] T J Sauer and D W Meek ldquoSpatial variation of plant-availablephosphorus in pastures with contrasting managementrdquo SoilScience Society of America Journal vol 67 no 3 pp 826ndash8362003
[19] Y CWei Y L Bai J Y Jin F Zhang L P Zhang and X Q LiuldquoSpatial variability of soil chemical properties in the reclaimingmarine foreland to yellow sea of Chinardquo Agricultural Sciences inChina vol 8 no 9 pp 1103ndash1111 2009
[20] Y Zhao X Xu J L Darilek B Huang W Sun and X ShildquoSpatial variability assessment of soil nutrients in an intenseagricultural area a case study of Rugao County in Yangtze RiverDelta Region Chinardquo Environmental Geology vol 57 no 5 pp1089ndash1102 2009
[21] Agricultural Chemistry Committee of China ConventionalMethods of Soil and Agricultural Chemistry Analysis (in Chi-nese) Science Press Beijing China 1983
[22] H T Kim Soil Sampling Preparation and Analysis CRCFlorida Pa USA 2005
10 Applied and Environmental Soil Science
[23] R K Lu Analysis Method of Soil and Agricultural Chemistry(in Chinese) China Agricultural Science and Technology PressBeijing China 2000
[24] DGAltmanPractical Statistics forMedical Research Chapmanamp Hall London UK 1991
[25] RWebster andMAOliver StatisticalMethods in Soil and LandResource Survey Oxford University Press London UK 1990
[26] J-P Chiles and P Delfiner Geostatistics Modeling SpatialUncertainty Wiley New York NY USA 1999
[27] M D Cahn J W Hummel and B H Brouer ldquoSpatial analysisof soil fertility for site-specific crop managementrdquo Soil ScienceSociety of America Journal vol 58 no 4 pp 1240ndash1248 1994
Submit your manuscripts athttpwwwhindawicom
Forestry ResearchInternational Journal of
Hindawi Publishing Corporationhttpwwwhindawicom Volume 2014
Environmental and Public Health
Journal of
Hindawi Publishing Corporationhttpwwwhindawicom Volume 2014
Hindawi Publishing Corporationhttpwwwhindawicom Volume 2014
EcosystemsJournal of
Meteorology
Hindawi Publishing Corporationhttpwwwhindawicom Volume 2014
Advances in
EcologyInternational Journal of
Hindawi Publishing Corporationhttpwwwhindawicom Volume 2014
Marine BiologyJournal of
Hindawi Publishing Corporationhttpwwwhindawicom Volume 2014
Hindawi Publishing Corporationhttpwwwhindawicom
Applied ampEnvironmentalSoil Science
Volume 2014
Advances in
Hindawi Publishing Corporationhttpwwwhindawicom Volume 2014
Environmental Chemistry
Atmospheric SciencesInternational Journal of
Hindawi Publishing Corporationhttpwwwhindawicom Volume 2014
Hindawi Publishing Corporationhttpwwwhindawicom Volume 2014
Waste ManagementJournal of
Hindawi Publishing Corporation httpwwwhindawicom Volume 2014
International Journal of
Geophysics
Hindawi Publishing Corporationhttpwwwhindawicom
Volume 2014
Geological ResearchJournal of
EarthquakesJournal of
Hindawi Publishing Corporationhttpwwwhindawicom Volume 2014
Hindawi Publishing Corporationhttpwwwhindawicom
Volume 2014
BiodiversityInternational Journal of
ScientificaHindawi Publishing Corporationhttpwwwhindawicom Volume 2014
OceanographyInternational Journal of
Hindawi Publishing Corporationhttpwwwhindawicom Volume 2014
The Scientific World JournalHindawi Publishing Corporation httpwwwhindawicom Volume 2014
Journal of Computational Environmental SciencesHindawi Publishing Corporationhttpwwwhindawicom Volume 2014
Hindawi Publishing Corporationhttpwwwhindawicom Volume 2014
ClimatologyJournal of
2 Applied and Environmental Soil Science
In addition to macronutrients micronutrients and tracemetals in soil also have similar problems and their availabilityratios in soil are also important indices for agricultural andenvironmental management Recently Wu et al [8] studiedthe variability of Cu availability in soil and its relation to somesoil properties in a 731 km2 region in southeast China Theirresults showed that Cu availability ratio has a distributionaltrend similar to those of total Cu concentration and availableCu concentrationwhich are similar to each other Zhang et al[9] modeled the availability ratio of Cu in soil in FuyangCounty China using the general regression neural networkmethod Although many studies on the spatial variabilityof soil N P and K were conducted in last several decades[10ndash20] most of them however were focused on their totalcontents or available contents in agricultural fields andstudies on the spatial distributions of their availability ratiosin soils and corresponding impact factors at regional scaleswere rarely seen Therefore a study on the spatial variabilityof availability ratios of soil macronutrients and their impactfactors in soil at a regional scale should be interestingand may provide valuable information to soil scientists andagricultural managers
The objectives of this study were to (1) analyze the rela-tionships between some soil properties and the availabilityof soil N P and K (2) determine the controlling factors onthe availability ratios of macronutrients (3) map the spatialdistributions of the indices of macronutrients in paddy soilsat a regional scale and (4) understand the characteristics ofspatial patterns of macronutrient availability ratios ShayangCounty in central China was selected as our case study areaThis paper will provide an example for the availability ratiostudy of soil macronutrients and results of such kind of stud-ies will be helpful to decision making in applying concretemeasures to modify the availability of soil macronutrients forsite-specific agricultural management purposes
2 Materials and Methods
21 Study Area Shayang County Hubei Province in centralChina was selected as the study areaThe county is among themost developed regions for cropping in Hubei Province andis located in the Jianghan Plain bounded by the longitudes112∘031015840 and 112∘431015840 east and the latitudes 30∘231015840 and 30∘571015840north with an area of 2044 km2 It belongs to the northernsubtropicalmonsoonal climate zonewith a temperate-humidclimate throughout the year and four distinct seasons Theaverage annual temperature is 161∘C and the mean annualprecipitation is 10256mm In this region paddy fields con-stitute the dominant land use type of arable lands
22 Soil Sampling andChemical Analysis 636 topsoil sampleswere collected from paddy fields in 2007 The samplingscheme considered the distributional uniformity of samplesand also ensured that all samples were located in paddy fields(Figure 1) All samples were taken in fall after harvest andbefore next cropping season to avoid the effect of fertilizationduring crop cultivation For each soil sample soils at 6ndash8 points within a small area of approximately 001 ha werecollected from surface layers (0ndash15 cm) and then mixed
0 5 10 20
(km)N
W E
S
Sampling sitePaddy fieldOther land use
Figure 1 The study area and sampling sites
and delivered to a laboratory for analysis Exact samplelocations were recorded using a hand-held global positionsystem All samples were air-dried at room temperature(20ndash22∘C) crushed and sieved into soil particles less than2mm Portions of each sample (about 100 g) were furtherground and sieved through 0149mmmeshTheprepared soilsamples were stored for chemical analysis
Soil organic matter (SOM) was measured using the wetoxidation method at 180∘C with a mixture of potassiumdichromate and sulfuric acid [21] Soil cation exchangecapacity (CEC) was measured using 10molL ammoniumacetate solution [21] Soil pH was measured using a pHmeter (Sartorius Basic pH meter PB-10) with a soilwaterratio of 1 25 [21] Total nitrogen (TN) was determinedby the Kjeldahl method with H
2SO4+ H2O2digestion
[22] Available nitrogen (AN) was extracted using 20molLKCl [22] Total phosphorus (TP) was extracted using meltsodium hydroxide and measured using the molybdenumstibium anticolor method [22] Available phosphorus (AP)was extracted using 003molL NH
4F and 0025molL HCl
or 05molL NaHCO3(based on pH values) and analyzed
using the molybdenum-blue method [22] Total potassium(TK) was extracted using melt sodium hydroxide and thenmeasured by flame emission spectrometry [22] Availablepotassium (AK) was extracted using 1molL NH
4OAc and
then measured by flame emission spectrometry [22] Avail-able S (AS) was extracted using 500mg PL Monocalciumphosphate [Ca(H
2PO4)2] and then determined by the tur-
bidimetric method [23] Available Fe (AFe) Available Mn(AMn) Available Cu (ACu) and Available Zn (AZn) wereextracted with diethylenetriaminepentaacetic acid (DTPA)and the extractedAFe AMnACu andAZnwere determinedwith flame atomic absorption spectrometry [23] Available B(AB) in soil was extracted with near-boiling deionized waterand analyzed using a curcuma colorimetric procedure [23]Quality control was based on the use of certified samples(GBW 07413) and analysis duplicates
Applied and Environmental Soil Science 3
Table 1 Summary statistics for macronutrient elements and other selected properties of paddy soils (119899 = 636)
Range Minimum Maximum Mean SD Skewness Kurtosis CV ()N availability ratio () 1413 338 1750 943 133 109 545 1407P availability ratio () 3188 012 3200 245 308 476 3111 12536K availability ratio () 451 013 464 056 035 397 3308 6181TN (gkg) 187 048 235 144 031 minus037 014 2169AN (mgkg) 18100 4500 22600 13464 2815 minus045 018 2091TP (gkg) 1565 015 1580 074 066 1875 42686 8873ln TP 466 minus190 276 minus041 046 minus029 407 minus11204
AP (mgkg) 9300 200 9500 1403 1121 255 973 7989lnAP 386 069 455 239 071 minus002 minus001 2954TK (gkg) 2836 733 3569 1996 341 091 187 1707ln TK 158 199 357 298 017 minus005 300 561AK (mgkg) 40000 2500 42500 11111 6466 187 443 5820lnAK 283 322 605 457 053 001 034 1160SOM (gkg) 3565 489 4054 2311 531 minus060 007 2297pH 300 510 810 661 067 076 minus019 1008CEC (cmol (+)kg) 3042 108 3150 1278 419 004 083 3279AB (mgkg) 504 010 514 064 055 359 1816 8673ACu (mgkg) 528 061 589 270 089 045 minus011 3308AZn (mgkg) 839 012 851 138 073 240 1520 5258AMn (mgkg) 54541 579 55120 3308 2579 1292 25627 7796AFe (mgkg) 34974 603 35577 11878 8918 067 minus099 7508AS (mgkg) 18265 785 19050 4125 2199 142 458 5330
23 Availability Ratio The availability ratio of a soil macro-nutrient (N P or K) at a given location is calculated using thefollowing equation
119877 =119860 (u)119879 (u) times 1000
times 100 (1)
where 119877 represents the availability ratio () u refers to aspecific location 119860(u) is the available concentration of a soilmacronutrient at location u with a unit of mgkg 119879(u) is thetotal concentration of the soil macronutrient at location uwith a unit of gkg
24 CorrelationAnalysis Correlation analysiswas conductedto reveal relationships between availability ratios of N P andK and selected soil properties (ie TN AN TP AP TKAK AFe AMn AS ACu AZn AB pH SOM and CEC)The significant level reported (ie 119875 lt 001) was based onPearsonrsquos correlation coefficients The software used is SPSSR130 for Windows
We also performed stepwise regression analysis to selectthe main factors that affect the availability ratios of soilN P and K using the SPSS R130 software Usually manypossible explanatory variablesmay exist in a data setThrougha stepwise regression process explanatory variables can beexamined one by one and the one that explains the mostvariation in the dependent variable will be added to themodel at each step When adding an extra variable will makeno significant improvement in the amount of explainedvariation the regression process will stop [24]
25 Geostatistical Analysis Geostatistics provides methodsto predict values at unsampled locations from values at sam-pled locations by taking into account the spatial correlation ofsampled points The variogram the spatial measure for krig-ing is an effective tool for evaluating spatial variability Thevariogram may describe the spatial autocorrelation structureof a continuous variable and provide some insight into pos-sible factors that affect data distribution Spatial patterns ofsoil attributes following intrinsic stationarity can be describedusing variogram models [25]
In this study no apparent anisotropy was found forany studied variable through experimental variograms Soall experimental variograms were in isotropic form andwere fitted using basic math models such as the sphericaland exponential models for kriging interpolation Ordinarykriging was chosen to create the spatial distribution maps ofsoil N P and K contents with the maximum search radiusbeing set to the autocorrelation range of the correspondingvariableThe interpolated grid had a resolution of 20079m times20079m Readers may see Chiles and Delfiner [26] fordetailed description of kriging and the variogram The Soft-ware GSLIB was used to conduct all the geostatistical work
3 Results and Discussions
31 Correlation Analysis and Controlling Factors The sum-mary statistics of soil N P and K and selected soil properties(pH SOM CEC AFe AMn AS ACu AZn and AB) arelisted in Table 1 The coefficients of variation (CVs) foravailability ratios of N P and K are 1407 12536 and
4 Applied and Environmental Soil Science
618 respectively This means that the availability ratiosof P and K have much larger variability than those of Nin the study area This situation may be caused by someextrinsic factors such as different fertilizer applications andseasonal cropping which have stronger impacts on availableP and K In fact TP AP and AK indeed have large CV valuesTable 1 also shows that CEC AB ACu AZn AMn AFeand AS have relatively high CV values (gt25) reflecting thecomplex heterogeneity of paddy soils in the study area
Pearsonrsquos correlation coefficients were calculated for eachvariable to reveal the relationships between the availabilityratios of macronutrients and the selected soil properties(see Table 2) Apparently the availability ratio of everymacronutrient is negatively correlated with its total contentand positively correlated with its available content as shownin Table 2 However the correlation situations between avail-ability ratio and total and available contents are different fordifferent macronutrientsThe availability ratio of K has a veryweak negative correlation with TK and a very strong positivecorrelation with AK This implies that the TK content in soilis relatively stable over the study area and a considerableamount of AK may come from outside input The strongpositive correlation between P availability ratio and AP alsoindicates that outside input may contribute a lot to soilAP However the availability ratio of N does not have suchcharacteristic and it is relatively more strongly impacted byTN This means that most AN in paddy soils may comefrom SOM and this point is supported by the strong positivecorrelation between AN and SOM In general the availablecontents of K and P are more decisive to their availabilityratios on the contrary the total content of N hasmore impacton its availability ratio
Checking the correlation situations of other soil prop-erties with N P and K one can find that these selectedproperties each have similar positive or negative influenceson AN and TN (Table 2) This may explain why the avail-ability ratio of N is less correlated with other soil properties(the largest correlation coefficient is with SOM which isminus0135 119875 lt 001) However the selected soil propertieshave much stronger correlations with AP and TK than withTP and AK although these correlations are mostly weakerthan those with TN and AN For example both pH andAB show strong correlations with TK but weak correlationswith AK The correlations of availability ratios of N P andK with the selected soil properties are generally not strongThe availability ratio of P is moderately correlated with ACuand AFe (119903
119904= 0261 and 0266 respectively 119875 lt 001) The
availability ratio of K is moderately correlated with CEC andAZn (119903
119904= 0252 and 0367 respectively 119875 lt 001)
Stepwise regression analysis was performed for the avail-ability ratios ofN P andK by using all of other soil propertiesas independent variables The results are given as follows
119884(N availability ratio )
= 8669 minus 7063119883(TN) + 0075119883(AN) + 0106119883(PH)
+ 0004119883(AP) + 0061119883(AZn) + 0069119883(AB)
(1198772= 091)
119884(P availability ratio )
= minus2533 + 0203119883(AP) minus 0992119883(TP)
+ 0004119883(AFe) + 0359119883(PH) (119877
2= 086)
119884(K availability ratio )
= 0497 + 0005119883(AK) minus 0036119883(TK)
+ 0026119883(PH) + 0027119883(AB) (119877
2= 093)
(2)
The coefficients of determination (1198772) provided after each ofabove regression models indicate that all of three multiplelinear regression models are well fitted by sample data Itcan be seen that the availability ratios of N P and K are allinfluenced bymultiple factorswhich are also interrelatedwitheach other Stepwise regression could find major controllingfactors Above equations indicate that the availability ratioof N is mainly controlled by TN AN pH AP AZn andAB the availability ratio of P mainly depends on AP TPAFe and pH and that of K is mainly contributed by AKTK pH and AB These results are not fully consistent withthe Pearsonrsquos correlation coefficients in Table 2 For examplepH appears to be an important positive contributing factorto the availability ratios of all macronutrients here howeverits correlation coefficients with these availability ratios arequite small in absolute values and are not all positive Thereason may be that a Pearsonrsquos correlation coefficient onlyreflects the linear correlation between two variables but aregression coefficient in a multiple linear regression model isalso related with other predictor variables and impacted bythe multicollinearity problem
32 Spatial Structure and Distributional Patterns Geostatis-tical methods were used to analyze the spatial correlationstructures of the total and available contents of N P andK in soil and spatially estimate their values at unsampledlocations Because kriging assumes the normal distributionfor each estimated variable it is necessary to check whetherthe total and available contents of N P and K in soil samplesare approximately normally distributed or not From Table 1one can see that the skewness and kurtosis indices of TNand AN are close to the standard value of 0 but those of TPAP TK and AK are not In this study natural logarithmictransformation was used to reduce the skewness of the datadistributions of P and K The histograms of N P and K dataused for geostatistical interpolation are shown in Figure 2One can see that they tend to be normally distributed
Experimental variograms and fitted models for TNAN ln(TP) ln(AP) ln(TK) and ln(AK) are presented inFigure 3 Spherical models are chosen for TN and ln(AK)Gaussian models for ln(TP) and ln(AP) and exponentialmodels for AN and ln(TK) The nuggetsill ratio (119862
0(119862 +
1198620)) may be used as a criterion to reflect the spatial
autodependency of a variable Ratio values lower than25 between 25 and 75 and higher than 75 corre-spond to strong moderate and weak spatial dependencies
Applied and Environmental Soil Science 5
Table2Pearsonrsquos
correlationcoeffi
cientsbetweenmacronu
trient
elementsandotherselectedsoilprop
ertie
s
TNAN
TPAP
TKAK
pHSO
MCE
CAB
AZn
ACu
AFe
AMn
AS
Navailabilityratiominus0374lowastlowast0186lowastlowastminus0036minus0038minus0032minus0117lowastlowast
0022minus0135lowastlowastminus0025minus0014minus0088lowastminus0102lowastlowastminus0049minus0058minus0099lowast
Pavailabilityratio0196lowastlowast0180lowastlowastminus0208lowastlowast0755lowastlowastminus0096lowast0242lowastlowastminus0098lowast0219lowastlowast0122lowastlowastminus0098lowast0218lowastlowast0261lowastlowast0266lowastlowastminus00230193lowastlowast
Kavailabilityratio0255lowastlowast0182lowastlowast
00650332lowastlowastminus00390901lowastlowastminus00470236lowastlowast0252lowastlowastminus00100367lowastlowast0226lowastlowast0123lowastlowast
0053
006
4
TN0826lowastlowast
00630298lowastlowastminus0297lowastlowast0199lowastlowastminus0578lowastlowast0877lowastlowast0437lowastlowastminus0269lowastlowast0305lowastlowast0519lowastlowast0473lowastlowastminus0090lowast0240lowastlowast
AN
004
20272lowastlowastminus0345lowastlowast0118lowastlowastminus0629lowastlowast0853lowastlowast0459lowastlowastminus0320lowastlowast0246lowastlowast0484lowastlowast0469lowastlowastminus0142lowastlowast0200lowastlowast
TP000
400170080lowastminus002400550025
00160043
0023
0029
0017
0030
AP
minus0122lowastlowast0306lowastlowastminus0180lowastlowast0295lowastlowast0205lowastlowastminus0109lowastlowast0200lowastlowast0310lowastlowast0244lowastlowastminus00440188lowastlowast
TK0268lowastlowast0583lowastlowastminus0353lowastlowastminus0246lowastlowast0487lowastlowastminus0154lowastlowastminus0303lowastlowastminus0260lowastlowast0166lowastlowastminus0235lowastlowast
AK
0089lowast0169lowastlowast0197lowastlowast0097lowast0327lowastlowast0161lowastlowast
006
60098lowast
0002
lowast119875lt005lowastlowast119875lt001
6 Applied and Environmental Soil Science
60
50
40
30
20
10
0050 100 150 200
TN
Freq
uenc
y
(a)
125
100
75
50
25
0minus200 minus100 000 100 200 300
ln(TP)Fr
eque
ncy
(b)
ln(TK)
150
100
50
0200 250 300 350
Freq
uenc
y
(c)
60
40
20
0
Freq
uenc
y
AN5000 10000 15000 20000
(d)
60
40
20
0
Freq
uenc
y
100 200 300 400
ln(AP)
(e)
80
60
40
20
0300 350 400 450 500 550 600
ln(AK)
Freq
uenc
y(f)
Figure 2 Histograms of TN (a) ln(TP) (b) ln(TK) (c) AN (d) ln(AP) (e) and ln(AK) (f)
012
008
004
000000 1000 2000 3000 4000 5000
TN
120574
Distance (km)
Model sphericalC0(C + C0) 042Range 3615 km
(a)
030
020
010
000000 400 800 1200 1600 2000
120574
Distance (km)
Model gaussianC0(C + C0) 071
Range 204 km
ln(TP)
(b)
0025
0020
0015
0010
0005
0000000 1000 2000 3000
120574
Distance (km)
Model exponentialC0(C + C0) 033Range 2529 km
ln(TK)
(c)
1200
800
400
0000 1000 2000 3000 4000 5000
AN
120574
Distance (km)
Model exponentialC0(C + C0) 036Range 5946km
(d)
040
030
020
010
000000 400 800 1200 1600 2000
120574
Distance (km)
Model gaussianC0(C + C0) 075
Range 500 km
ln(AP)
(e)
030
020
010
000000 400 800 1200 1600 2000
120574
Distance (km)
Model sphericalC0(C + C0) 065
Range 300 km
ln(AK)
(f)
Figure 3 Experimental variograms of TN (a) ln(TP) (b) ln(TK) (c) AN (d) ln(AP) (e) and ln(AK) (f) and their fitted models
Applied and Environmental Soil Science 7
N
EW
S
067sim082
083sim094
095sim110
111sim134
135sim148
149sim158
159sim168
169sim179
TN (gkg)0 5 10 20
(km)
(a)
N
EW
S
AN (mgkg)6388sim8022
8023sim9222
9223sim10575
10576sim12546
12547sim13905
13906sim14933
14934sim16066
16067sim18492
0 5 10 20
(km)
(b)
N
EW
S
0 5 10 20
(km)
TP (gkg)005sim027
028sim047
048sim064
065sim084
085sim110
111sim239
240sim634
635sim1056
(c)
N
EW
S
234sim412
413sim748
749sim1091
1092sim1542
1543sim1956
1957sim2407
2408sim7073
7074sim14074
AP (mgkg)0 5 10 20
(km)
(d)
N
EW
S
1238sim1550
1551sim1637
1638sim1737
1738sim1850
1851sim2002
2003sim2211
2212sim2660
2661sim2868
TK (gkg)0 5 10 20
(km)
(e)
N
EW
S
2948sim5418
5419sim6764
6765sim8031
8032sim10526
10527sim13139
13140sim15653
15654sim17435
17436sim42087
AK (mgkg)0 5 10 20
(km)
(f)
Figure 4 Spatial distribution maps of TN (a) AN (b) TP (c) AP (d) TK (e) and AK (f) interpolated by ordinary kriging
respectively [11] The nuggetsill ratios of variogram modelsfor TN AN ln(TP) ln(AP) ln(TK) and ln(AK) all fallbetween 25 and 75 which indicates that all of the sixproperties exhibit moderate spatial dependency Accordingto Cambardella et al [11] these spatial autodependenciesmaybe attributed to both intrinsic factors such as other soil prop-erties and extrinsic factors such as human activities Thecorrelation range measures the spatial separate distancewithin which data are autocorrelated [27] The approximatecorrelation ranges for TN AN ln(TP) ln(AP) ln(TK) andln(AK) are 3615 km 5946 km 204 km 500 km 2529 kmand 300 km respectively Apparently AN TN and TK areautocorrelated in longer ranges than TP AP and AK areThisresult is consistent with their CV values This may imply thatTPAP andAKcontents aremore sensitive to extrinsic factorssuch as fertilization
To map the spatial distributions of TN AN TP AP TKand AK we used ordinary kriging to interpolate their respec-tive sample data (Figure 4) After the spatial distributionmaps of the total and available contents of a macronutrientwere obtained its availability ratio map could be furtherderived from the total contentmap and available contentmapby using (1) (ie at each spatial location availability ratio= available contenttotal content) The spatial maps of TNand AN (Figures 4(a) and 4(b)) show similar patterns Thismay be why TN and AN are strongly correlated (119903
119904= 0826
119875 lt 001) However the spatial map of the availability ratio ofN (Figure 5(a)) shows a different spatial pattern This meansthat the contents of AN and TN are not spatially proportionaland they are impacted by other factors with different degreesAP and the availability ratio of P exhibit similar spatial trends(see Figures 4(d) and 5(b)) This should be caused by thestrong correlation (119903
119904= 0755 119875 lt 001) between these
two variables Because AP and TP have almost no correlation(see Table 2) consequently the spatial pattern of P availabilityratio is quite different from that of TPThe spatial distributionmaps of AK and K availability ratio also show similar spatialpatterns which should be caused by their strong (nearlylinear) correlation (119903
119904= 0901 119875 lt 001) (see Figures 4(f)
and 5(c)) The correlation between AK and TK is not strongwhichmay be why they have different spatial patterns and thespatial pattern of K availability ratio is very different from thatof TK
The short autocorrelation ranges of TP AP and AK arereflected on their spatial distribution maps with fragmentarypatterns and this characteristic is further propagated to thespatial distribution maps of the availability ratios of P andK Consequently one can see in Figure 5 that the spatialdistributional characteristics of the availability ratios of NP and K are very different (i) the availability ratio of Nchanges smoothly with large patches while that of K and Pvary abruptly as small pieces or spots in the study area (ii)
8 Applied and Environmental Soil Science
N
EW
S
0 5 10 20
(km)
754sim815
816sim862
863sim900
901sim929
930sim963
964sim995
996sim1077
1078sim1196
N availability ratio ()
(a)
N
EW
S
0 5 10 20
(km)
019sim044
045sim091
092sim152
153sim213
214sim321
322sim429
430sim630
631sim5657
P availability ratio ()
(b)
N
EW
S
0 5 10 20
(km)
013sim028
029sim036
037sim048
049sim057
058sim068
069sim103
104sim137
138sim214
K availability ratio ()
(c)
Figure 5 Spatial distribution maps of availability ratios of N (a) P (b) and K (c) Note that (a) is derived from Figures 4(a) and 4(b) (b) isderived from Figures 4(c) and 4(d) and (c) is derived from Figures 4(e) and 4(f)
high availability ratio values of N mainly appear in severalsubareas in the east and north of the study area and highavailability ratio values of P mainly occur as a series of spotsalong a strip in the southwest while high availability ratiovalues of K mainly emerge as isolated spots often borderedwith very low values These availability ratio maps clearlyshowwhere amacronutrient has low availability andwhere itsavailability is highThus concretemeasuresmight be taken toincrease the low availability or decrease the high availabilityof amacronutrient in a specific area tomeet the requirementsof agricultural production and environmental protection Forexample changing soil pH may help change the efficiency ofsoil nitrogen to be absorbed by plants
It should be noted that the data value ranges (from mini-mum value to maximum value in each legend) in the legendsof Figures 4 and 5 are not consistent with the correspondingvalue ranges of sample data provided in Table 2 The majorreason may be that the locations of interpolated grid valuesby kriging for mapping do not overlap those of sample data
thus the legends show only the value ranges of interpolateddata and sample data values are ignored in the maps
4 Conclusion
The spatial variability of soil N P and K and their availabilityratios in paddy soils in a county were explored After a longhistory of various land management the spatial variabilityof N P and K and their availability ratios in soils are notonly dependent on soil parent materials but also impactedby anthropogenic activities Statistical analysis shows that theavailability ratios of P and K have larger variation than thatof N in the study area probably due to the heterogeneousland use and management The contents of TN AN and TKin paddy fields have relatively longer correlation ranges thanthose of TP AP and AKThe availability ratios of N P and Kare all affected by multiple factors that are also interrelatedThe main factors controlling the availability ratios of N Pand K were determined using stepwise regression analysis N
Applied and Environmental Soil Science 9
availability ratio is mainly related to TN AN pH AP AZnand AB P availability ratio is mainly controlled by AP TPAFe and pH andK availability ratio ismainly affected byAKTK pH and AB
TN and AN contents have similar spatial patterns butN availability ratio has a different spatial pattern howeverthe spatial patterns of availability ratios of P and K areonly similar to those of their available components (ie APand AK) respectively Availability ratios of nutrients in soilmay reflect soilrsquos nutrient holding (or fixing) ability Thedifferent spatial variability characteristics among the totalcontent the available content and the availability ratio ofeach macronutrient indicate that these three indices are alluseful to reflect the general situation of the macronutrient insoil and their spatial maps are all useful data for agriculturaland environmental management
Because the availability ratio of a macronutrient is relatedwith its availability (or efficiency) to plants and its risk ofloss into deep soil or water body proper adjustment ofmacronutrient availability ratios in soil through some mea-sures (eg fertilization liming to change soil pH) may behelpful to improving agricultural productivity and reducingenvironmental hazards Therefore spatial distribution mapsof macronutrient availability ratios may provide useful infor-mation to guide site-specific soil management
Conflict of Interests
The authors declare that there is no conflict of interestsregarding the publication of this paper
Acknowledgment
This work was partially supported by China PostdoctoralScience Foundation (Funded Project 2013M530273)
References
[1] H Marschner Mineral Nutrition of Higher Plants AcademicPress London UK 1995
[2] P Phupaibul C Chitbuntanorm N Chinoim P Kangya-wongha and T Matoh ldquoPhosphorus accumulation in soils andnitrate contamination in underground water under export-oriented asparagus farming in Nong Ngu Lauem VillageNakhon Pathom Province Thailandrdquo Soil Science and PlantNutrition vol 50 no 3 pp 385ndash393 2004
[3] X T Ju C L Kou P Christie Z X Dou and F S ZhangldquoChanges in the soil environment from excessive application offertilizers and manures to two contrasting intensive croppingsystems on the North China Plainrdquo Environmental Pollutionvol 145 no 2 pp 497ndash506 2007
[4] V H Smith G D Tilman and J C Nekola ldquoEutrophicationimpacts of excess nutrient inputs on freshwater marine andterrestrial ecosystemsrdquo Environmental Pollution vol 100 no 1ndash3 pp 179ndash196 1998
[5] A Sharpley ldquoIdentifying sites vulnerable to phosphorus loss inagricultural runoffrdquo Journal of Environmental Quality vol 24no 5 pp 947ndash951 1995
[6] M N Almasri and J J Kaluarachchi ldquoAssessment and man-agement of long-term nitrate pollution of ground water in
agriculture-dominated watershedsrdquo Journal of Hydrology vol295 no 1ndash4 pp 225ndash245 2004
[7] Y Chen B H He X L Zhao and L Zhang ldquoEffect of soilerosion and water loss in Farmland on water eutrophication inXiaojiang River Basinrdquo Journal of Soil and Water Conservationvol 24 pp 31ndash43 2010
[8] C F Wu Y M Luo and L M Zhang ldquoVariability of copperavailability in paddy fields in relation to selected soil propertiesin southeast Chinardquo Geoderma vol 156 no 3-4 pp 200ndash2062010
[9] X Y Zhang Z Y Ling T Y Zhong and K Wang ldquoSimulationof the availability index of soil copper content using generalregression neural networkrdquo Environmental Earth Sciences vol64 no 7 pp 1697ndash1702 2011
[10] J G White and R J Zasoski ldquoMapping soil micronutrientsrdquoField Crops Research vol 60 no 1-2 pp 11ndash26 1999
[11] C A Cambardella T B Moorman J M Novak et al ldquoField-scale variability of soil properties in central Iowa soilsrdquo SoilScience Society of America Journal vol 58 no 5 pp 1501ndash15111994
[12] Y L Bai J Y Jin L P Yang and M Z Liang ldquoResearch on thesubarea management model of soil nutrients by GISrdquo ScientiaAgricultura Sinica vol 34 pp 46ndash50 2001 (Chinese)
[13] R Corstanje S Grunwald K R Reddy T Z Osborne and SNewman ldquoAssessment of the spatial distribution of soil proper-ties in a Northern Everglades marshrdquo Journal of EnvironmentalQuality vol 35 no 3 pp 938ndash949 2006
[14] KWHolmes P C Kyriakidis O A Chadwick J V Soares andD A Roberts ldquoMulti-scale variability in tropical soil nutrientsfollowing land-cover changerdquoBiogeochemistry vol 74 no 2 pp173ndash203 2005
[15] S W Huang J Y Jin L P Yang Y L Bai and C H Li ldquoSpatialvariability of nitrate in cabbage and nitrate-N in soilrdquo SoilScience vol 169 no 9 pp 640ndash649 2004
[16] S W Huang J Y Jin L P Yang and Y L Bai ldquoSpatial vari-ability of soil nutrients and influencing factors in a vegetableproduction area of Hebei Province in Chinardquo Nutrient Cyclingin Agroecosystems vol 75 no 1ndash3 pp 201ndash212 2006
[17] B Huang W X Sun Y C Zhao et al ldquoTemporal andspatial variability of soil organic matter and total nitrogen inan agricultural ecosystem as affected by farming practicesrdquoGeoderma vol 139 no 3-4 pp 336ndash345 2007
[18] T J Sauer and D W Meek ldquoSpatial variation of plant-availablephosphorus in pastures with contrasting managementrdquo SoilScience Society of America Journal vol 67 no 3 pp 826ndash8362003
[19] Y CWei Y L Bai J Y Jin F Zhang L P Zhang and X Q LiuldquoSpatial variability of soil chemical properties in the reclaimingmarine foreland to yellow sea of Chinardquo Agricultural Sciences inChina vol 8 no 9 pp 1103ndash1111 2009
[20] Y Zhao X Xu J L Darilek B Huang W Sun and X ShildquoSpatial variability assessment of soil nutrients in an intenseagricultural area a case study of Rugao County in Yangtze RiverDelta Region Chinardquo Environmental Geology vol 57 no 5 pp1089ndash1102 2009
[21] Agricultural Chemistry Committee of China ConventionalMethods of Soil and Agricultural Chemistry Analysis (in Chi-nese) Science Press Beijing China 1983
[22] H T Kim Soil Sampling Preparation and Analysis CRCFlorida Pa USA 2005
10 Applied and Environmental Soil Science
[23] R K Lu Analysis Method of Soil and Agricultural Chemistry(in Chinese) China Agricultural Science and Technology PressBeijing China 2000
[24] DGAltmanPractical Statistics forMedical Research Chapmanamp Hall London UK 1991
[25] RWebster andMAOliver StatisticalMethods in Soil and LandResource Survey Oxford University Press London UK 1990
[26] J-P Chiles and P Delfiner Geostatistics Modeling SpatialUncertainty Wiley New York NY USA 1999
[27] M D Cahn J W Hummel and B H Brouer ldquoSpatial analysisof soil fertility for site-specific crop managementrdquo Soil ScienceSociety of America Journal vol 58 no 4 pp 1240ndash1248 1994
Submit your manuscripts athttpwwwhindawicom
Forestry ResearchInternational Journal of
Hindawi Publishing Corporationhttpwwwhindawicom Volume 2014
Environmental and Public Health
Journal of
Hindawi Publishing Corporationhttpwwwhindawicom Volume 2014
Hindawi Publishing Corporationhttpwwwhindawicom Volume 2014
EcosystemsJournal of
Meteorology
Hindawi Publishing Corporationhttpwwwhindawicom Volume 2014
Advances in
EcologyInternational Journal of
Hindawi Publishing Corporationhttpwwwhindawicom Volume 2014
Marine BiologyJournal of
Hindawi Publishing Corporationhttpwwwhindawicom Volume 2014
Hindawi Publishing Corporationhttpwwwhindawicom
Applied ampEnvironmentalSoil Science
Volume 2014
Advances in
Hindawi Publishing Corporationhttpwwwhindawicom Volume 2014
Environmental Chemistry
Atmospheric SciencesInternational Journal of
Hindawi Publishing Corporationhttpwwwhindawicom Volume 2014
Hindawi Publishing Corporationhttpwwwhindawicom Volume 2014
Waste ManagementJournal of
Hindawi Publishing Corporation httpwwwhindawicom Volume 2014
International Journal of
Geophysics
Hindawi Publishing Corporationhttpwwwhindawicom
Volume 2014
Geological ResearchJournal of
EarthquakesJournal of
Hindawi Publishing Corporationhttpwwwhindawicom Volume 2014
Hindawi Publishing Corporationhttpwwwhindawicom
Volume 2014
BiodiversityInternational Journal of
ScientificaHindawi Publishing Corporationhttpwwwhindawicom Volume 2014
OceanographyInternational Journal of
Hindawi Publishing Corporationhttpwwwhindawicom Volume 2014
The Scientific World JournalHindawi Publishing Corporation httpwwwhindawicom Volume 2014
Journal of Computational Environmental SciencesHindawi Publishing Corporationhttpwwwhindawicom Volume 2014
Hindawi Publishing Corporationhttpwwwhindawicom Volume 2014
ClimatologyJournal of
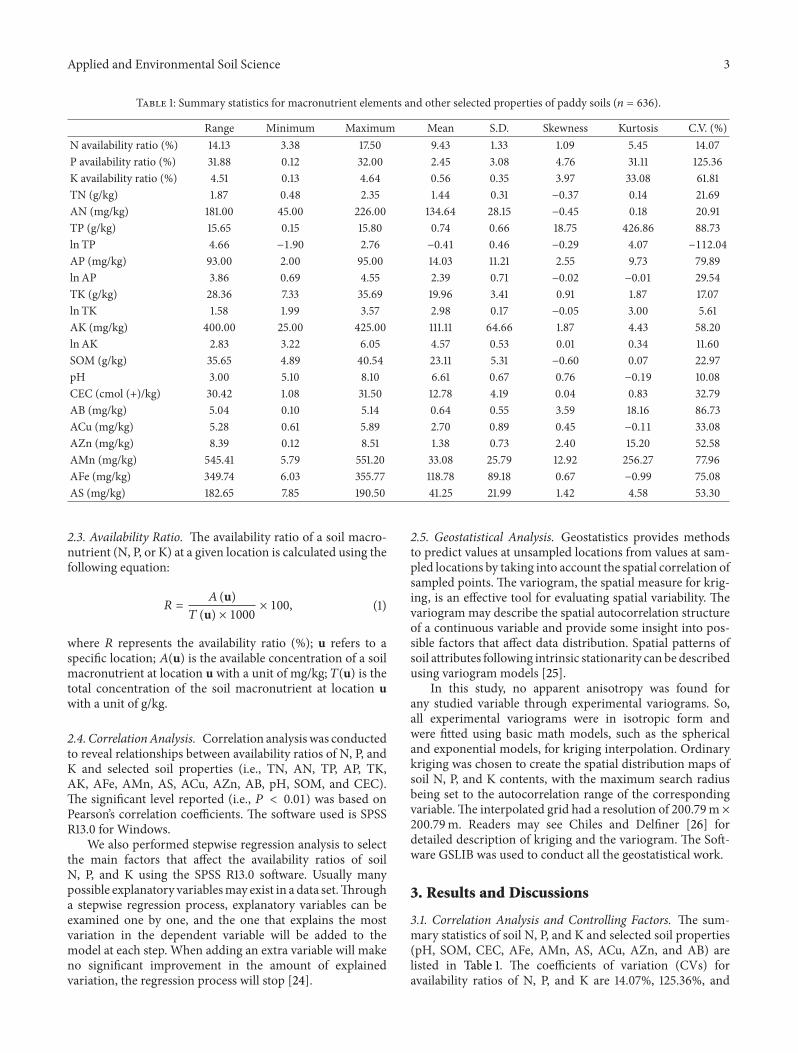
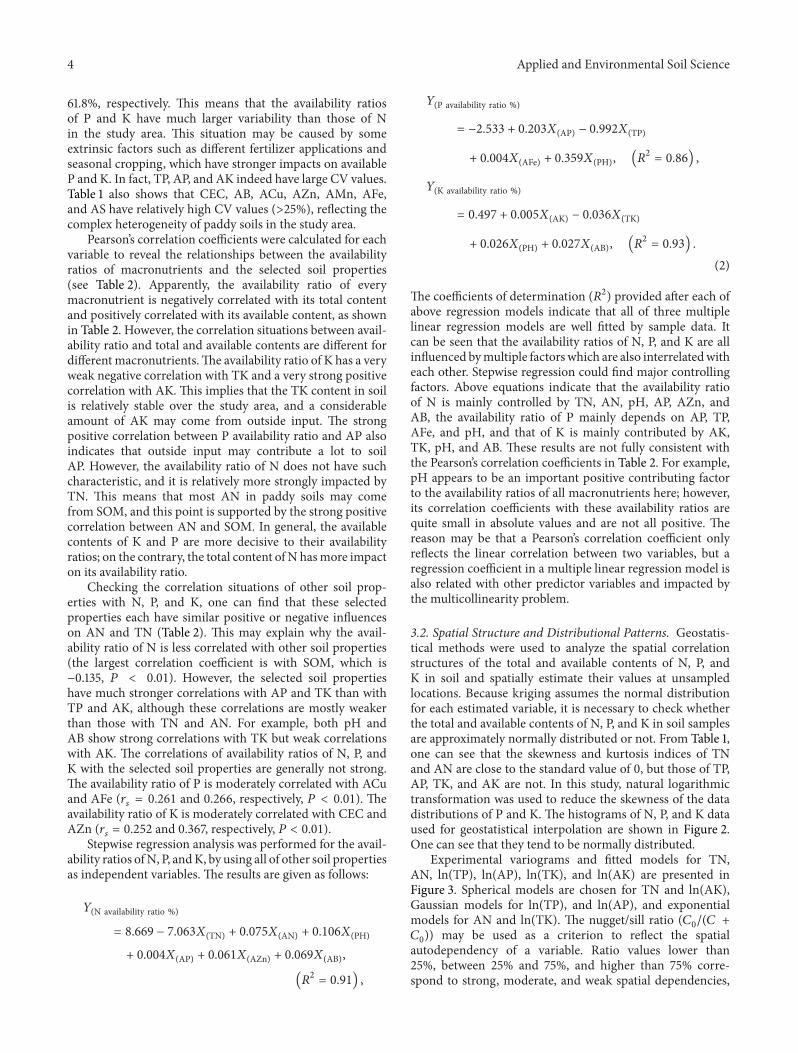
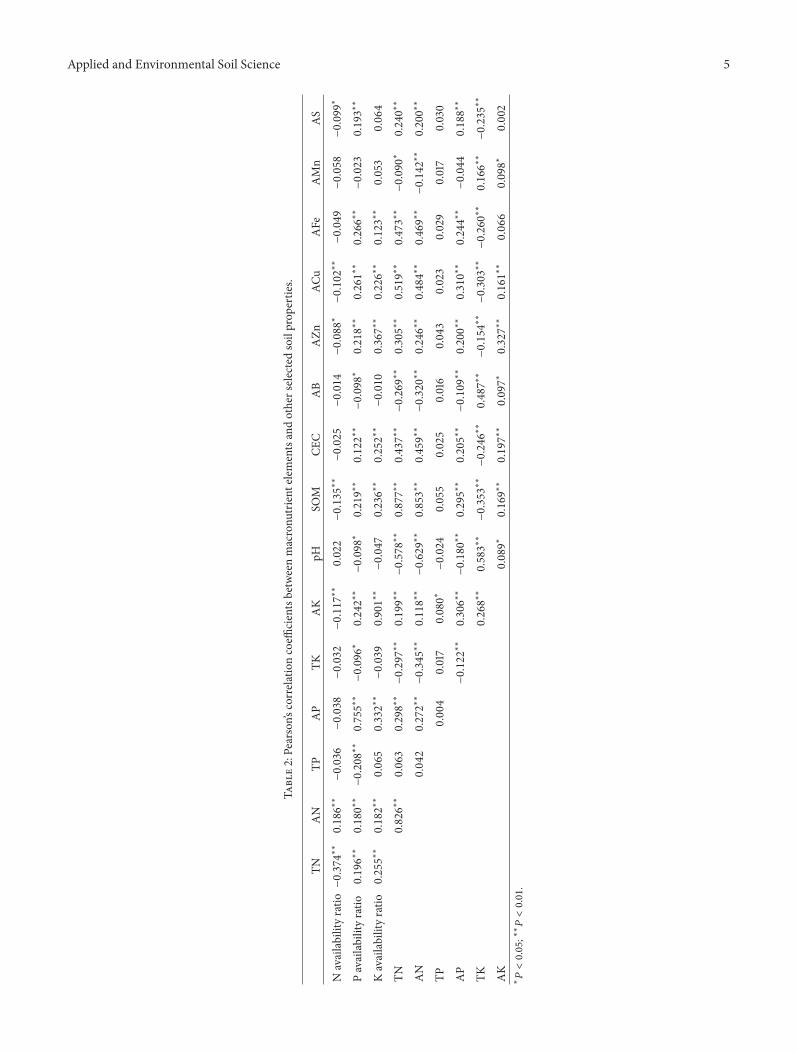