County Profile - PAD County Profile Page 1 of 30 . This profile is a part of a set of profiles...
31
Tompkins County Profile 2017 A collection of recent demographic, social and economic data Compiled by Jan Vink Cornell Program on Applied Demographics
Transcript of County Profile - PAD County Profile Page 1 of 30 . This profile is a part of a set of profiles...

Tompkins County Profile
2017
A collection of recent demographic, social and economic data
Compiled by
Jan Vink
Cornell Program on Applied Demographics

Tompkins County Profile
Page 1 of 30
This profile is a part of a set of profiles generated for each county in New York State. The profiles were developed and generated by the Cornell Program on Applied Demographics. The work is sponsored by the New York State Data Center in the New York State Department of Labor.
Cornell Program on Applied Demographics:
The Program on Applied Demographics (PAD) brings skills in demographics, economics, statistics, data gathering and data analysis together to provide a variety of organizations with data, information and advice. PAD is located in the Department of Policy Analysis and Management within the College of Human Ecology at Cornell University. PAD is also affiliated with the Cornell Institute for Social and Economic Research and the Cornell Population Center.
For more information: http://pad.human.cornell.edu/
New York State Data Center:
The New York State Data Center (NYSDC) is located in the Division of Research and Statistics within the New York State Department of Labor. The State Data Center operates as part of a nationwide effort to improve public access to data provided by the U.S. Census Bureau. The U.S. Census Bureau collects and tabulates data on a multitude of subjects such as population, social, economic and housing demographics, labor force data, health care, migration and transportation. These data play a critical role in understanding our local and larger surrounding communities. Census data also influence state and federal funding, aid decision making in the legislative process, and determine each state's number of congressional seats. As the lead agency in New York for the SDC program, the New York State Data Center helps users navigate through the multitude of surveys and products provided by the U.S. Census Bureau.
For more information: https://labor.ny.gov/nys-data-center/
All profiles are freely downloadable as PDF documents on the PAD website:
http://pad.human.cornell.edu/profiles/index.cfm
This profile is an update from the County Profile produced in 2013. The 2013 profile also contained information on agriculture related items and can be found at https://pad.human.cornell.edu/profiles/2013/Tompkins.pdf
Tompkins County Profile
Page 2 of 30
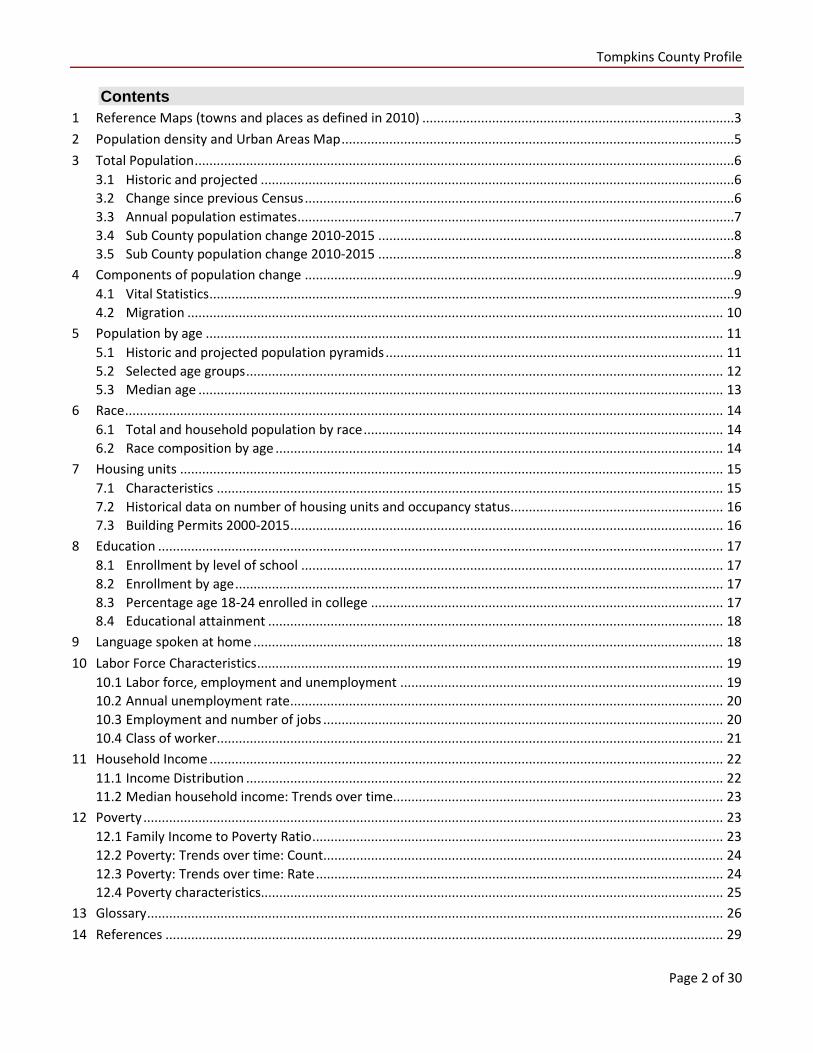
Contents 1 Reference Maps (towns and places as defined in 2010) .....................................................................................3 2 Population density and Urban Areas Map ...........................................................................................................5 3 Total Population ...................................................................................................................................................6
3.1 Historic and projected .................................................................................................................................6 3.2 Change since previous Census .....................................................................................................................6 3.3 Annual population estimates .......................................................................................................................7 3.4 Sub County population change 2010-2015 .................................................................................................8 3.5 Sub County population change 2010-2015 .................................................................................................8
4 Components of population change .....................................................................................................................9 4.1 Vital Statistics ...............................................................................................................................................9 4.2 Migration .................................................................................................................................................. 10
5 Population by age ............................................................................................................................................. 11 5.1 Historic and projected population pyramids ............................................................................................ 11 5.2 Selected age groups .................................................................................................................................. 12 5.3 Median age ............................................................................................................................................... 13
6 Race ................................................................................................................................................................... 14 6.1 Total and household population by race .................................................................................................. 14 6.2 Race composition by age .......................................................................................................................... 14
7 Housing units .................................................................................................................................................... 15 7.1 Characteristics .......................................................................................................................................... 15 7.2 Historical data on number of housing units and occupancy status .......................................................... 16 7.3 Building Permits 2000-2015 ...................................................................................................................... 16
8 Education .......................................................................................................................................................... 17 8.1 Enrollment by level of school ................................................................................................................... 17 8.2 Enrollment by age ..................................................................................................................................... 17 8.3 Percentage age 18-24 enrolled in college ................................................................................................ 17 8.4 Educational attainment ............................................................................................................................ 18
9 Language spoken at home ................................................................................................................................ 18 10 Labor Force Characteristics ............................................................................................................................... 19
10.1 Labor force, employment and unemployment ........................................................................................ 19 10.2 Annual unemployment rate ...................................................................................................................... 20 10.3 Employment and number of jobs ............................................................................................................. 20 10.4 Class of worker .......................................................................................................................................... 21
11 Household Income ............................................................................................................................................ 22 11.1 Income Distribution .................................................................................................................................. 22 11.2 Median household income: Trends over time.......................................................................................... 23
12 Poverty .............................................................................................................................................................. 23 12.1 Family Income to Poverty Ratio ................................................................................................................ 23 12.2 Poverty: Trends over time: Count ............................................................................................................. 24 12.3 Poverty: Trends over time: Rate ............................................................................................................... 24 12.4 Poverty characteristics.............................................................................................................................. 25
13 Glossary ............................................................................................................................................................. 26 14 References ........................................................................................................................................................ 29

Tompkins County Profile
Page 3 of 30
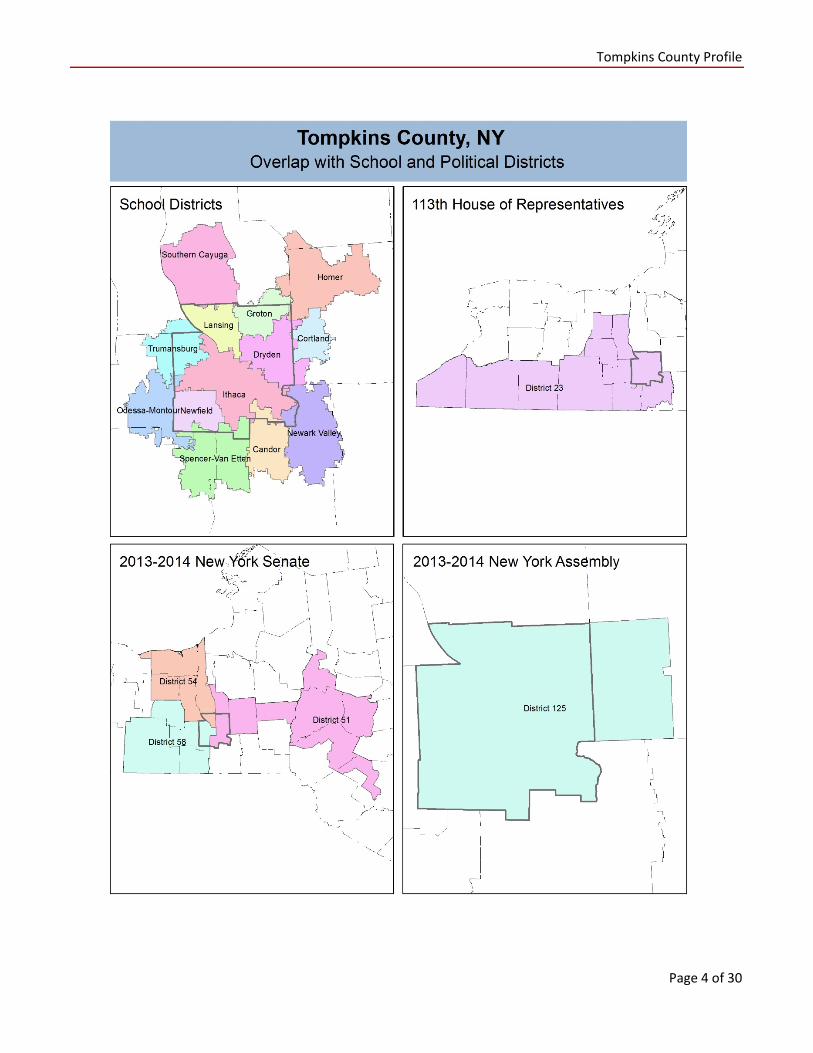
1 Reference Maps (towns and places as defined in 2010)
Tompkins County Profile
Page 4 of 30

Tompkins County Profile
Page 5 of 30
2 Population density and Urban Areas Map

Tompkins County Profile
Page 6 of 30
3 Total Population 3.1 Historic and projected
Source: 1940-2010 Decennial Census and projections by Cornell Program on Applied Demographics
3.2 Change since previous Census
Total
population Change
Number Percent
Dece
nnia
l Cen
sus
1940 42,340 1950 59,122 16,782 39.6% 1960 66,164 7,042 11.9% 1970 77,106 10,942 16.5% 1980 87,085 9,979 12.9% 1990 94,097 7,012 8.1% 2000 96,501 2,404 2.6% 2010 101,564 5,063 5.2%
PAD
proj
ec-
tions
2020 101,732 168 0.2%
2030 100,893 -839 -0.8%
2040 98,606 -2,287 -2.3% Source: 1940-2010 Decennial Census and projections by Cornell Program on Applied Demographics
42,3
40
59,1
22
66,1
64
77,1
06
87,0
85
94,0
97
96,5
01
101,
564
101,
732
100,
893
98,6
06
1940 1950 1960 1970 1980 1990 2000 2010 2020 2030 2040
Total population, Tompkins County, 1940-2040
Decennial Census PAD projections

Tompkins County Profile
Page 7 of 30
3.3 Annual population estimates
Source: U.S. Census Bureau population estimates (1990-1999 and 2000-2009 intercensal and vintage 2016 postcensal)
Min1990
94,241
Max2016
104,871
1990 1995 2000 2005 2010 2015
Annual population estimatesTompkins County, 1990-2016

Tompkins County Profile
Page 8 of 30
3.4 Sub County population change 2010-2015
Total Population Difference
2000 2010
Count %
New York State 18,976,821 * 19,378,102 401,281 2.1% Tompkins County 96,501 101,564 5,063 5.2% Cities Ithaca 28,775 * 30,014 1,239 4.3% Towns Caroline 2,910 3,282 372 12.8% Danby 3,007 3,329 322 10.7% Dryden 13,532 14,435 903 6.7% Enfield 3,369 3,512 143 4.2% Groton 5,794 5,950 156 2.7% Ithaca 18,710 * 19,930 1,220 6.5% Lansing 10,521 11,033 512 4.9% Newfield 5,108 5,179 71 1.4% Ulysses 4,775 4,900 125 2.6%
* Original counts revised through Count Question Resolution Program (CQR) Source: U.S. Census Bureau intercensal population estimates 2000-2010
3.5 Sub County population change 2010-2015
Total Population Difference
2010 base 2015
Count %
New York State 19,378,087 19,795,791 417,704 2.2% Tompkins County 101,594 104,926 3,332 3.3% Cities Ithaca 30,020 30,788 768 2.6% Towns Caroline 3,292 3,456 164 5.0% Danby 3,326 3,534 208 6.3% Dryden 14,436 14,955 519 3.6% Enfield 3,512 3,618 106 3.0% Groton 5,977 6,112 135 2.3% Ithaca 19,920 20,529 609 3.1% Lansing 11,027 11,524 497 4.5% Newfield 5,181 5,317 136 2.6% Ulysses 4,903 5,093 190 3.9%
Source: U.S. Census Bureau population estimates 2010-2015
Tompkins County Profile
Page 9 of 30
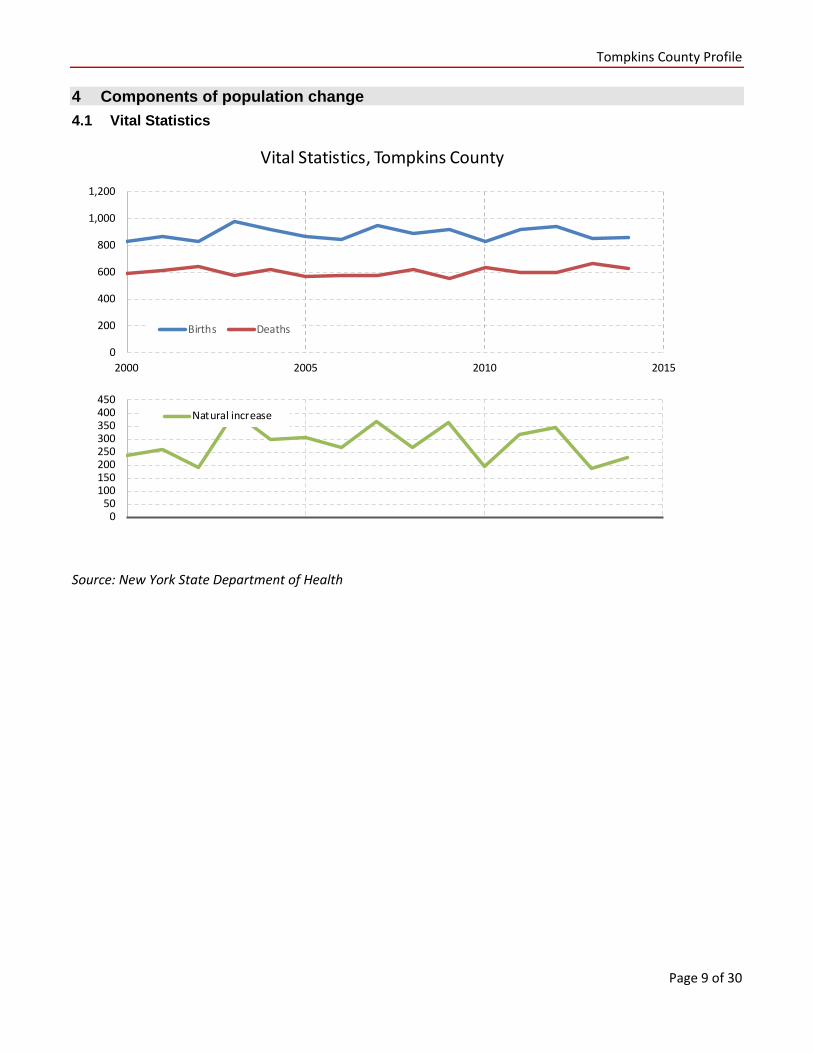
4 Components of population change 4.1 Vital Statistics
Source: New York State Department of Health
0
200
400
600
800
1,000
1,200
2000 2005 2010 2015
Vital Statistics, Tompkins County
Births Deaths
050
100150200250300350400450
Natural increase
Tompkins County Profile
Page 10 of 30
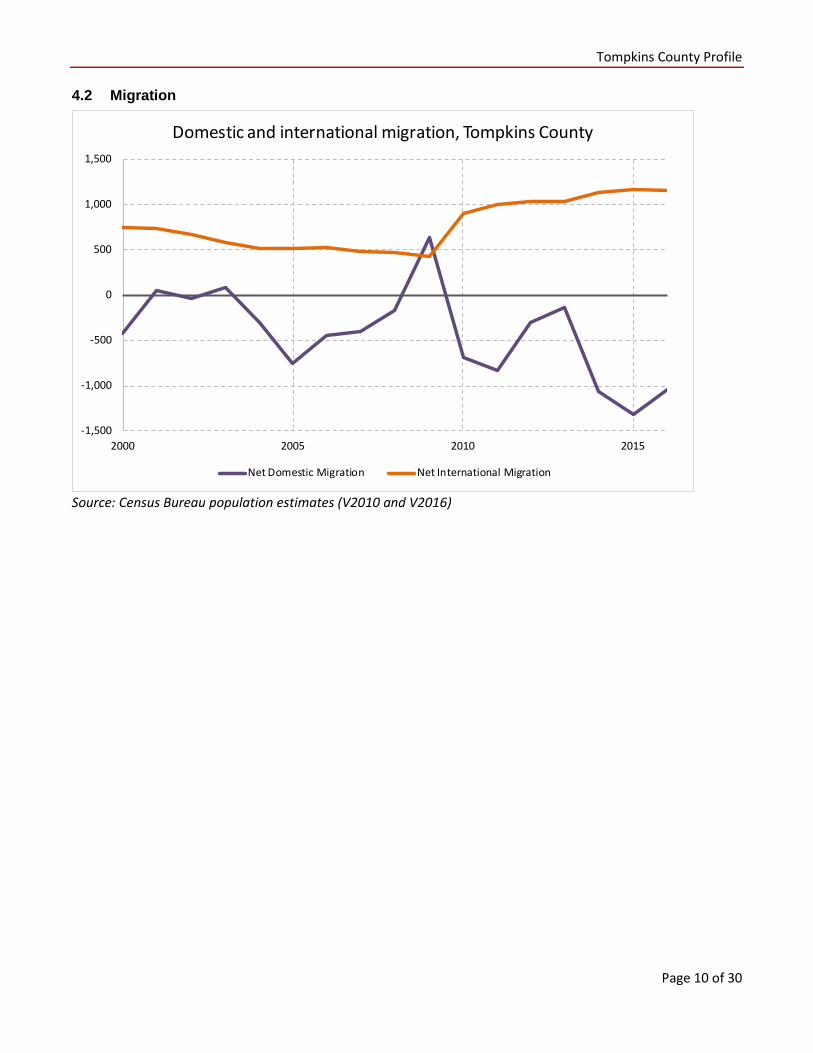
4.2 Migration
Source: Census Bureau population estimates (V2010 and V2016)
-1,500
-1,000
-500
0
500
1,000
1,500
2000 2005 2010 2015
Domestic and international migration, Tompkins County
Net Domestic Migration Net International Migration
Tompkins County Profile
Page 11 of 30
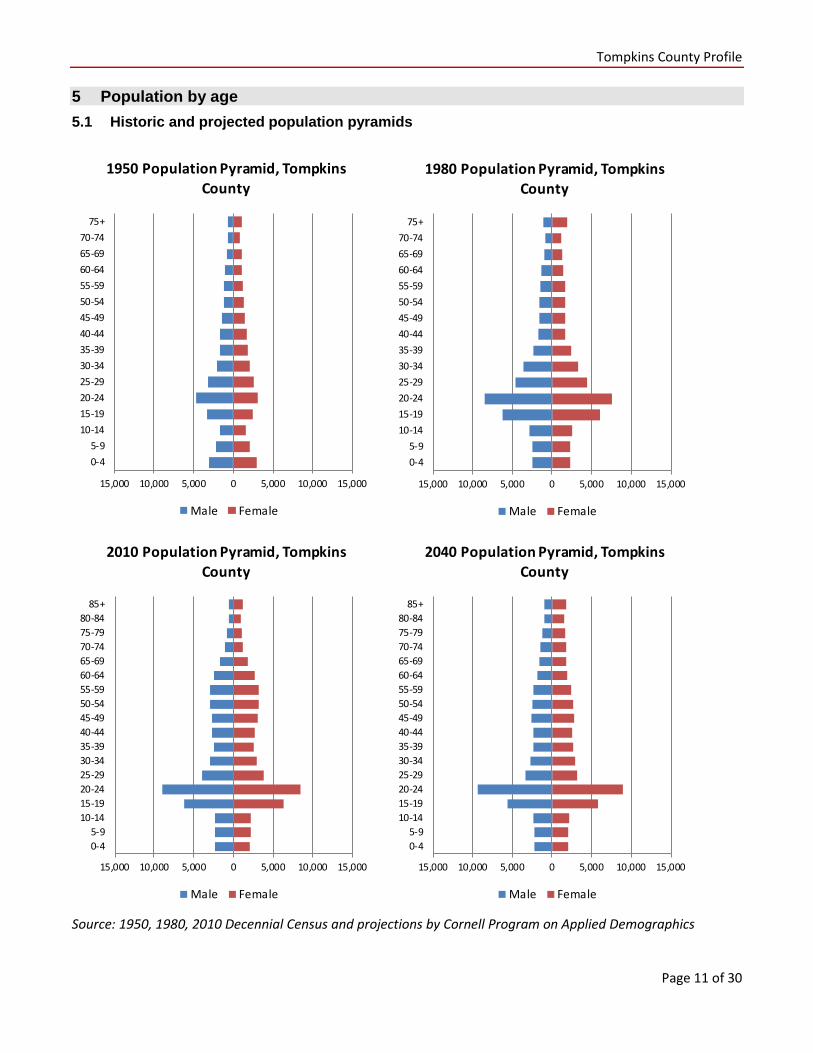
5 Population by age 5.1 Historic and projected population pyramids
Source: 1950, 1980, 2010 Decennial Census and projections by Cornell Program on Applied Demographics
15,000 10,000 5,000 0 5,000 10,000 15,000
0-45-9
10-1415-1920-2425-2930-3435-3940-4445-4950-5455-5960-6465-6970-74
75+
1950 Population Pyramid, Tompkins County
Male Female
15,000 10,000 5,000 0 5,000 10,000 15,000
0-45-9
10-1415-1920-2425-2930-3435-3940-4445-4950-5455-5960-6465-6970-74
75+
1980 Population Pyramid, Tompkins County
Male Female
15,000 10,000 5,000 0 5,000 10,000 15,000
0-45-9
10-1415-1920-2425-2930-3435-3940-4445-4950-5455-5960-6465-6970-7475-7980-84
85+
2010 Population Pyramid, Tompkins County
Male Female
15,000 10,000 5,000 0 5,000 10,000 15,000
0-45-9
10-1415-1920-2425-2930-3435-3940-4445-4950-5455-5960-6465-6970-7475-7980-84
85+
2040 Population Pyramid, Tompkins County
Male Female
Tompkins County Profile
Page 12 of 30
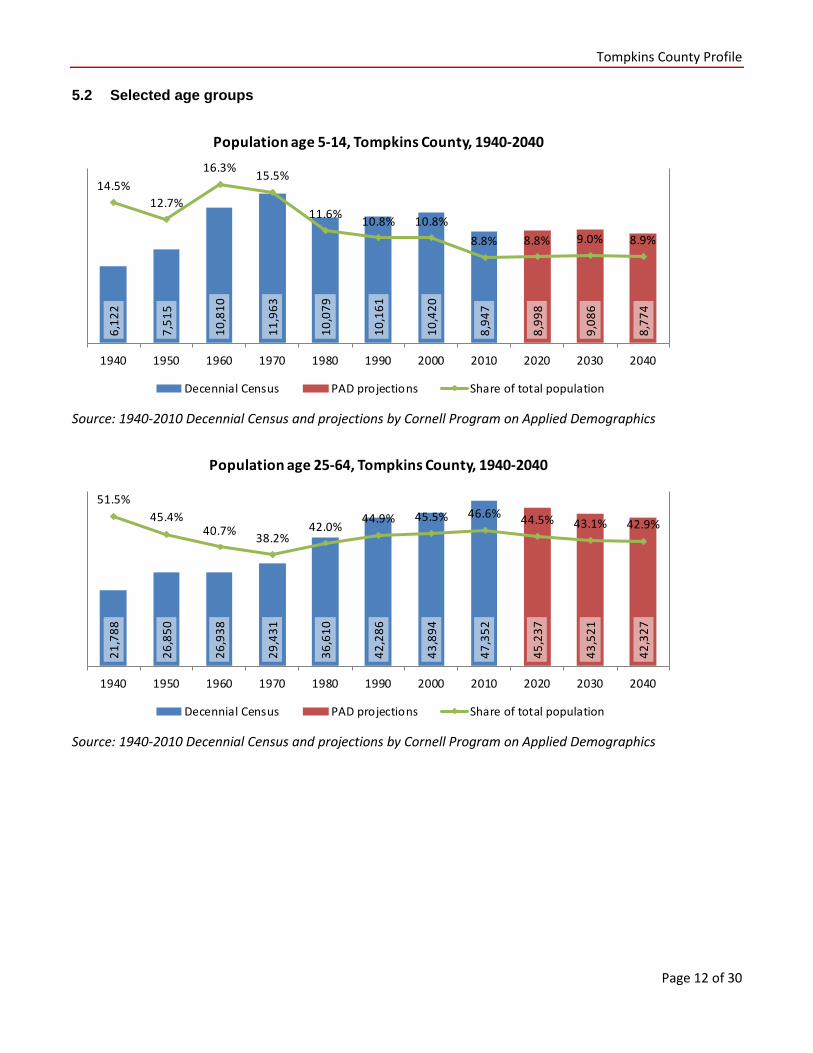
5.2 Selected age groups
Source: 1940-2010 Decennial Census and projections by Cornell Program on Applied Demographics
Source: 1940-2010 Decennial Census and projections by Cornell Program on Applied Demographics
6,12
2
7,51
5
10,8
10
11,9
63
10,0
79
10,1
61
10,4
20
8,94
7
8,99
8
9,08
6
8,77
4
14.5%12.7%
16.3% 15.5%
11.6% 10.8% 10.8%8.8% 8.8% 9.0% 8.9%
1940 1950 1960 1970 1980 1990 2000 2010 2020 2030 2040
Population age 5-14, Tompkins County, 1940-2040
Decennial Census PAD projections Share of total population
21,7
88
26,8
50
26,9
38
29,4
31
36,6
10
42,2
86
43,8
94
47,3
52
45,2
37
43,5
21
42,3
27
51.5%45.4%
40.7% 38.2%42.0%
44.9% 45.5% 46.6% 44.5% 43.1% 42.9%
1940 1950 1960 1970 1980 1990 2000 2010 2020 2030 2040
Population age 25-64, Tompkins County, 1940-2040
Decennial Census PAD projections Share of total population

Tompkins County Profile
Page 13 of 30
Source: 1940-2010 Decennial Census and projections by Cornell Program on Applied Demographics
5.3 Median age
Tompkins
County New York State
Median age 2000 28.6 35.9 2010 29.8 38.0 2015 30.6 38.3
Source: 2000, 2010 Decennial Census, 2015 Population Estimates
4,26
8
5,13
8
5,58
9
5,76
3
7,25
2
8,46
5
9,25
7
10,9
29
14,1
04
15,4
31
14,7
09
10.1%8.7% 8.4%
7.5%8.3% 9.0% 9.6%
10.8%
13.9%15.3% 14.9%
1940 1950 1960 1970 1980 1990 2000 2010 2020 2030 2040
Population age 65 and over, Tompkins County, 1940-2040
Decennial Census PAD projections Share of total population
Tompkins County Profile
Page 14 of 30
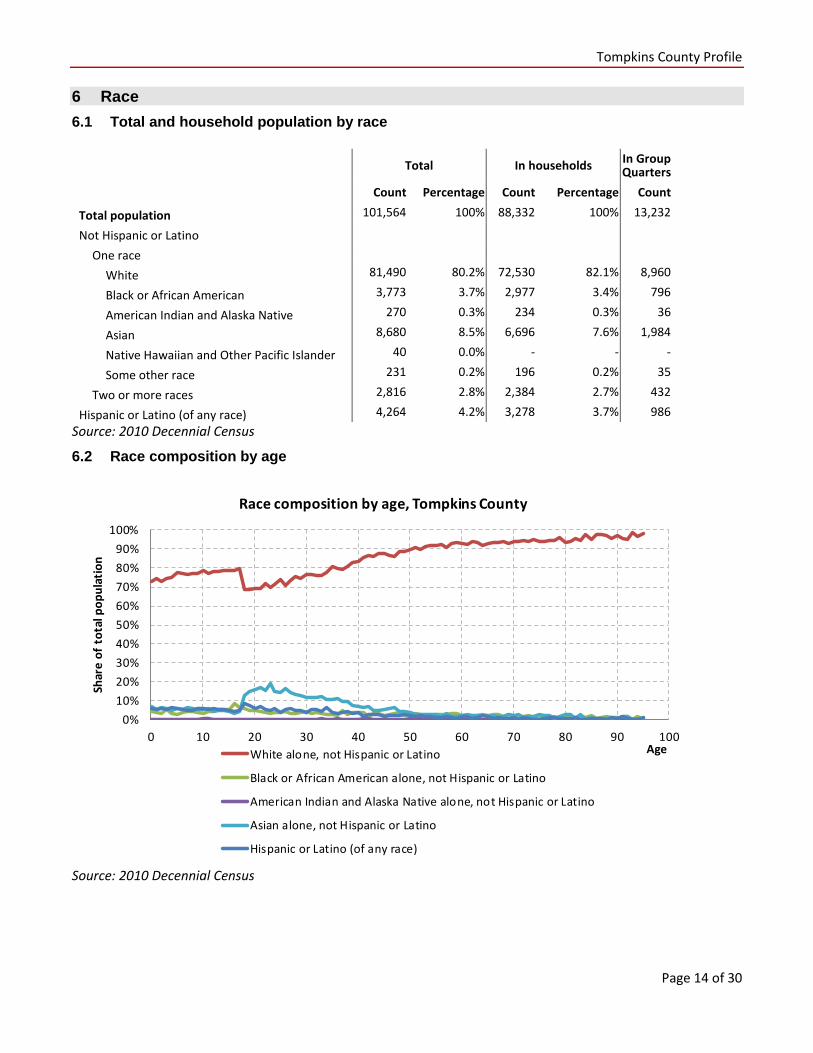
6 Race 6.1 Total and household population by race
Total In households In Group Quarters
Count Percentage Count Percentage Count
Total population 101,564 100% 88,332 100% 13,232
Not Hispanic or Latino
One race
White 81,490 80.2% 72,530 82.1% 8,960
Black or African American 3,773 3.7% 2,977 3.4% 796
American Indian and Alaska Native 270 0.3% 234 0.3% 36
Asian 8,680 8.5% 6,696 7.6% 1,984
Native Hawaiian and Other Pacific Islander 40 0.0% - - -
Some other race 231 0.2% 196 0.2% 35
Two or more races 2,816 2.8% 2,384 2.7% 432
Hispanic or Latino (of any race) 4,264 4.2% 3,278 3.7% 986 Source: 2010 Decennial Census
6.2 Race composition by age
Source: 2010 Decennial Census
0%10%20%30%40%50%60%70%80%90%
100%
0 10 20 30 40 50 60 70 80 90 100
Shar
e of
tot
al p
opul
atio
n
Age
Race composition by age, Tompkins County
White alone, not Hispanic or Latino
Black or African American alone, not Hispanic or Latino
American Indian and Alaska Native alone, not Hispanic or Latino
Asian alone, not Hispanic or Latino
Hispanic or Latino (of any race)

Tompkins County Profile
Page 15 of 30
7 Housing units 7.1 Characteristics
COUNT PERCENTAGE
HOUSING OCCUPANCY Estimate Margin of error Estimate Margin
of error Total housing units 41,983 ± 272 100.0%
Occupied housing units 38,460 ± 536 91.6% ± 1.1
Vacant housing units 3,523 ± 448 8.4% ± 1.1
YEAR STRUCTURE BUILT Total housing units 41,983 ± 272 100.0%
Built 2014 or later 36 ± 39 0.1% ± 0.1
Built 2010 to 2013 543 ± 190 1.3% ± 0.5
Built 2000 to 2009 3,540 ± 370 8.4% ± 0.9
Built 1990 to 1999 5,841 ± 652 13.9% ± 1.6
Built 1980 to 1989 5,183 ± 439 12.3% ± 1.0
Built 1970 to 1979 5,976 ± 467 14.2% ± 1.1
Built 1960 to 1969 4,026 ± 400 9.6% ± 1.0
Built 1950 to 1959 3,336 ± 325 7.9% ± 0.8
Built 1940 to 1949 1,345 ± 213 3.2% ± 0.5
Built 1939 or earlier 12,157 ± 668 29.0% ± 1.6
HOUSING TENURE Occupied housing units 38,460 ± 536 100.0%
Owner-occupied 21,356 ± 483 55.5% ± 1.3
Renter-occupied 17,104 ± 605 44.5% ± 1.3
HOUSE HEATING FUEL Occupied housing units 38,460 ± 536 100.0%
Utility gas 19,993 ± 585 52.0% ± 1.3
Bottled, tank, or LP gas 4,167 ± 387 10.8% ± 1.0
Electricity 6,732 ± 469 17.5% ± 1.2
Fuel oil, kerosene, etc. 4,131 ± 314 10.7% ± 0.8
Coal or coke 486 ± 118 1.3% ± 0.3
Wood 2,288 ± 273 5.9% ± 0.7
Solar energy 37 ± 33 0.1% ± 0.1
Other fuel 502 ± 139 1.3% ± 0.4
No fuel used 124 ± 75 0.3% ± 0.2
VALUE Owner-occupied units 21,356 ± 483 100.0%
Less than $50,000 1,782 ± 213 8.3% ± 1.0
$50,000 to $99,999 2,469 ± 285 11.6% ± 1.3
$100,000 to $149,999 3,823 ± 333 17.9% ± 1.5
$150,000 to $199,999 4,509 ± 389 21.1% ± 1.7
$200,000 to $299,999 4,853 ± 379 22.7% ± 1.7
$300,000 to $499,999 3,019 ± 311 14.1% ± 1.4
$500,000 to $999,999 752 ± 174 3.5% ± 0.8
$1,000,000 or more 149 ± 64 0.7% ± 0.3
Median (dollars) 176,500 ± 4,925
Source: 2011-2015 American Community Survey
Tompkins County Profile
Page 16 of 30
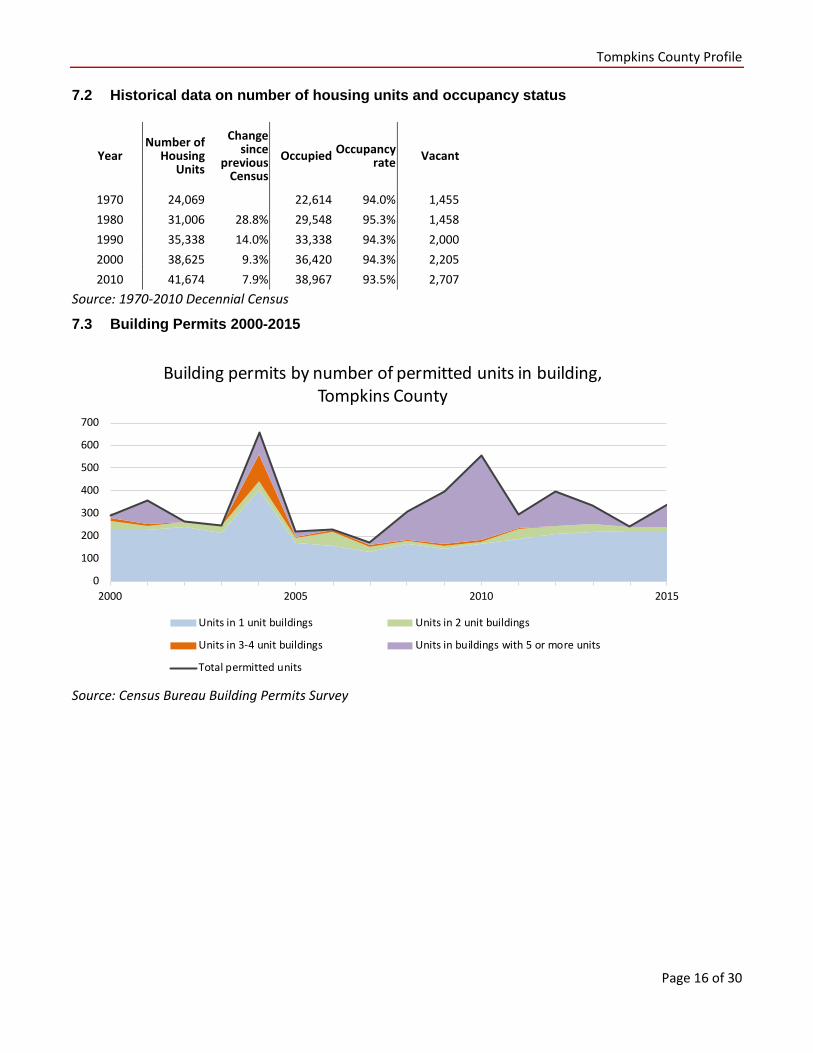
7.2 Historical data on number of housing units and occupancy status
Year Number of
Housing Units
Change since
previous Census
Occupied Occupancy rate Vacant
1970 24,069 22,614 94.0% 1,455 1980 31,006 28.8% 29,548 95.3% 1,458 1990 35,338 14.0% 33,338 94.3% 2,000 2000 38,625 9.3% 36,420 94.3% 2,205 2010 41,674 7.9% 38,967 93.5% 2,707
Source: 1970-2010 Decennial Census
7.3 Building Permits 2000-2015
Source: Census Bureau Building Permits Survey
0
100
200
300
400
500
600
700
2000 2005 2010 2015
Building permits by number of permitted units in building, Tompkins County
Units in 1 unit buildings Units in 2 unit buildings
Units in 3-4 unit buildings Units in buildings with 5 or more units
Total permitted units
Tompkins County Profile
Page 17 of 30
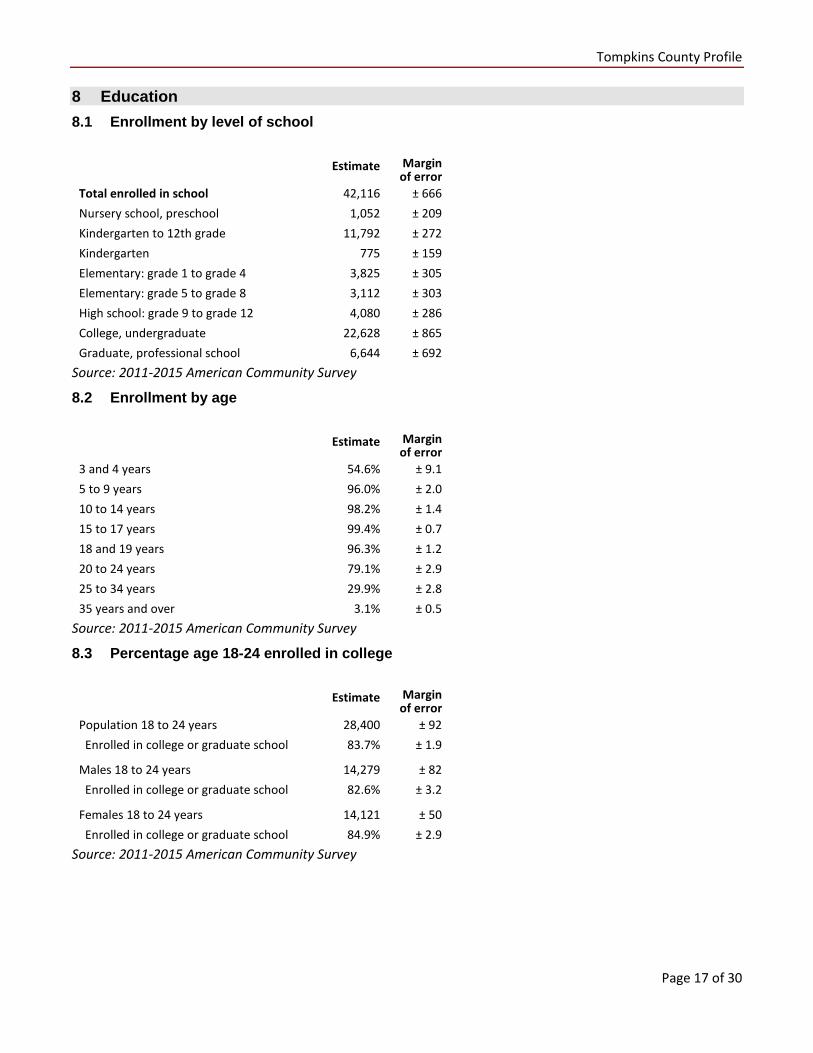
8 Education 8.1 Enrollment by level of school
Estimate Margin of error
Total enrolled in school 42,116 ± 666 Nursery school, preschool 1,052 ± 209 Kindergarten to 12th grade 11,792 ± 272 Kindergarten 775 ± 159 Elementary: grade 1 to grade 4 3,825 ± 305 Elementary: grade 5 to grade 8 3,112 ± 303 High school: grade 9 to grade 12 4,080 ± 286 College, undergraduate 22,628 ± 865 Graduate, professional school 6,644 ± 692
Source: 2011-2015 American Community Survey
8.2 Enrollment by age
Estimate Margin of error
3 and 4 years 54.6% ± 9.1 5 to 9 years 96.0% ± 2.0 10 to 14 years 98.2% ± 1.4 15 to 17 years 99.4% ± 0.7 18 and 19 years 96.3% ± 1.2 20 to 24 years 79.1% ± 2.9 25 to 34 years 29.9% ± 2.8 35 years and over 3.1% ± 0.5
Source: 2011-2015 American Community Survey
8.3 Percentage age 18-24 enrolled in college
Estimate Margin of error
Population 18 to 24 years 28,400 ± 92 Enrolled in college or graduate school 83.7% ± 1.9
Males 18 to 24 years 14,279 ± 82 Enrolled in college or graduate school 82.6% ± 3.2
Females 18 to 24 years 14,121 ± 50 Enrolled in college or graduate school 84.9% ± 2.9
Source: 2011-2015 American Community Survey

Tompkins County Profile
Page 18 of 30
8.4 Educational attainment
COUNT PERCENTAGE
Estimate Margin of error Estimate Margin
of error Population 25 years and over 59,323 ± 87 100% EDUCATIONAL ATTAINMENT
Less than 9th grade 815 ± 214 1.4% ± 0.4 9th to 12th grade, no diploma 2,604 ± 353 4.4% ± 0.6 High school graduate (includes equivalency) 11,756 ± 681 19.8% ± 1.1 Some college, no degree 8,162 ± 587 13.8% ± 1.0 Associate's degree 5,834 ± 513 9.8% ± 0.9 Bachelor's degree 13,169 ± 668 22.2% ± 1.1 Graduate or professional degree 16,983 ± 716 28.6% ± 1.2
Percent high school graduate or higher 94.2% ± 0.7 Percent bachelor's degree or higher 50.8% ± 1.4
Source: 2011-2015 American Community Survey
9 Language spoken at home
COUNT PERCENTAGE SPEAK ENGLISH LESS THAN "VERY WELL"
Estimate Margin of error
Estimate Margin of error
Estimate Margin of error
Population 5 years and over 99,462 ± 58 100% LANGUAGE SPOKEN AT HOME English only 85,736 ± 1,030 86.2% ± 1.0 Language other than English 13,726 ± 1,021 13.8% ± 1.0 3,301 ± 514
Spanish 2,274 ± 380 2.3% ± 0.4 286 ± 107 Other Indo-European languages 4,279 ± 594 4.3% ± 0.6 689 ± 164 Asian and Pacific Islander languages 6,316 ± 647 6.4% ± 0.7 2,087 ± 510 Other languages 857 ± 185 0.9% ± 0.2 239 ± 125
Source: 2011-2015 American Community Survey

Tompkins County Profile
Page 19 of 30
10 Labor Force Characteristics 10.1 Labor force, employment and unemployment
TOTAL IN LABOR FORCE EMPLOYED UNEMPLOYMENT
RATE
Estimate Margin
of error
Estimate Margin
of error
Estimate Margin
of error
Estimate Margin
of error
Population 16 years and over 89,862 ± 186 58.4% ± 1.3 54.9% ± 1.3 5.9% ± 0.7 AGE
16 to 19 years 12,653 ± 611 31.9% ± 2.7 24.5% ± 2.3 23.2% ± 3.7
20 to 24 years 17,886 ± 592 49.4% ± 4.0 45.5% ± 4.1 7.9% ± 2.2
25 to 29 years 7,167 ± 82 71.5% ± 4.1 67.6% ± 4.5 5.2% ± 2.3
30 to 34 years 6,254 ± 126 78.6% ± 3.9 75.3% ± 4.4 4.1% ± 2.1
35 to 44 years 10,244 ± 169 84.2% ± 2.6 80.9% ± 2.6 4.0% ± 1.5
45 to 54 years 11,579 ± 208 84.6% ± 2.1 82.2% ± 2.2 2.6% ± 0.8
55 to 59 years 6,170 ± 397 79.8% ± 3.5 76.9% ± 3.4 3.7% ± 1.9
60 to 64 years 5,637 ± 374 61.1% ± 3.3 59.2% ± 3.3 3.2% ± 1.6
65 to 74 years 7,072 ± 137 33.3% ± 3.3 31.8% ± 3.3 4.5% ± 2.6
75 years and over 5,200 ± 80 7.6% ± 2.0 7.3% ± 2.0 3.3% ± 3.7
RACE AND HISPANIC OR LATINO ORIGIN
White alone 73,480 ± 339 61.1% ± 1.3 57.5% ± 1.3 5.8% ± 0.7
Black or African American alone 3,593 ± 318 45.0% ± 5.5 36.1% ± 5.8 19.8% ± 6.9
American Indian and Alaska Native alone 332 ± 104 63.6% ± 18.2 63.6% ± 18.2 0.0% ± 13.2
Asian alone 9,525 ± 270 43.3% ± 5.2 42.4% ± 5.4 2.1% ± 1.4
Two or more races 2,069 ± 374 51.8% ± 9.4 49.9% ± 9.4 3.6% ± 3.2
Hispanic or Latino origin (of any race) 3,965 ± 42 55.3% ± 5.7 50.4% ± 5.7 8.8% ± 4.0
White alone, not Hispanic or Latino 70,792 ± 190 61.4% ± 1.3 57.8% ± 1.3 5.8% ± 0.7
SEX Population 20 to 64 years 64,937 ± 646 70.3% ± 1.5 67.1% ± 1.6 4.5% ± 0.7
Male 32,047 ± 482 73.0% ± 2.0 69.3% ± 2.2 4.9% ± 1.0
Female 32,890 ± 404 67.7% ± 2.1 64.9% ± 2.2 4.1% ± 0.9
With own children under 18 years 8,069 ± 457 79.1% ± 3.1 76.2% ± 3.3 3.7% ± 1.4
EDUCATIONAL ATTAINMENT Population 25 to 64 years 47,051 ± 158 78.3% ± 1.4 75.3% ± 1.5 3.7% ± 0.6
Less than high school graduate 2,257 ± 357 58.4% ± 8.6 47.4% ± 8.6 18.8% ± 8.4
High school graduate (includes equivalency) 8,418 ± 579 75.7% ± 3.0 72.5% ± 3.0 4.3% ± 1.6
Some college or associate's degree 11,476 ± 613 80.2% ± 2.5 76.7% ± 2.8 4.4% ± 1.7
Bachelor's degree or higher 24,900 ± 754 80.1% ± 1.8 78.2% ± 1.9 2.2% ± 0.6
Table formula: LABOR FORCE = # EMPLOYED + # UNEMPLOYED % IN LABOR FORCE = LABOR FORCE / TOTAL * 100% % EMPLOYED = # EMPLOYED / TOTAL * 100% UNEMPLOYMENT RATE = # UNEMPLOYED / LABOR FORCE * 100% Source: 2011-2015 American Community Survey
Tompkins County Profile
Page 20 of 30
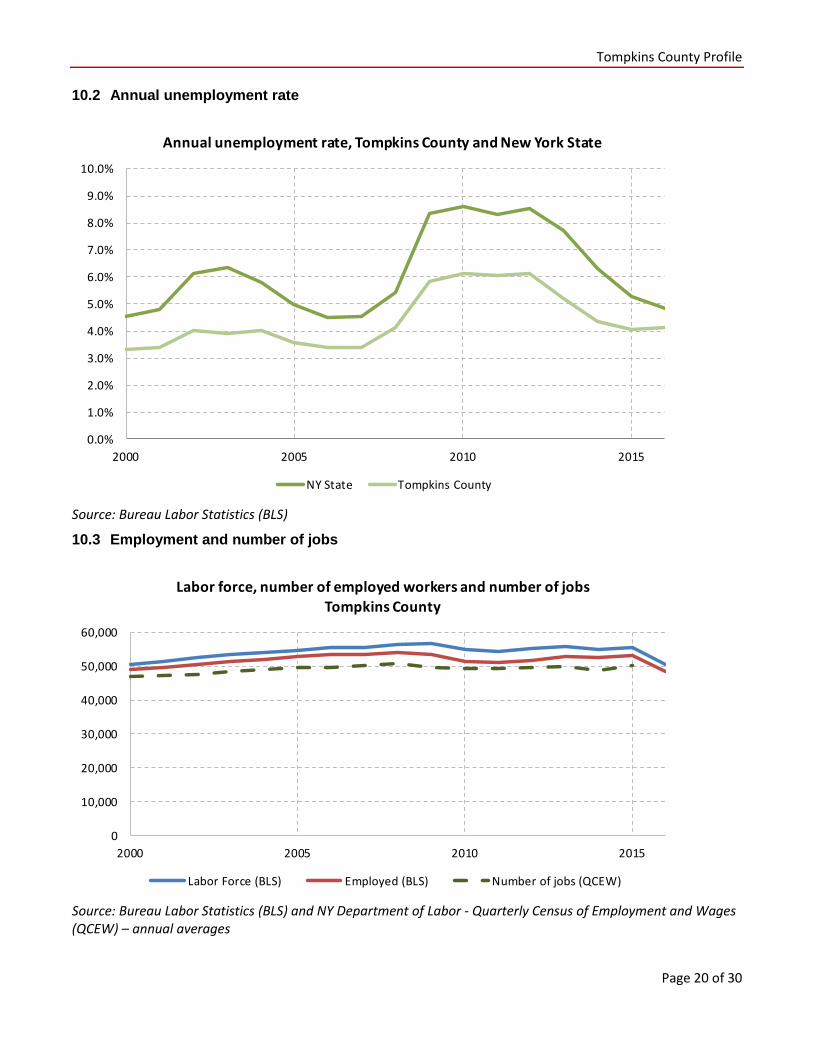
10.2 Annual unemployment rate
Source: Bureau Labor Statistics (BLS)
10.3 Employment and number of jobs
Source: Bureau Labor Statistics (BLS) and NY Department of Labor - Quarterly Census of Employment and Wages (QCEW) – annual averages
0.0%
1.0%
2.0%
3.0%
4.0%
5.0%
6.0%
7.0%
8.0%
9.0%
10.0%
2000 2005 2010 2015
Annual unemployment rate, Tompkins County and New York State
NY State Tompkins County
0
10,000
20,000
30,000
40,000
50,000
60,000
2000 2005 2010 2015
Labor force, number of employed workers and number of jobsTompkins County
Labor Force (BLS) Employed (BLS) Number of jobs (QCEW)
Tompkins County Profile
Page 21 of 30
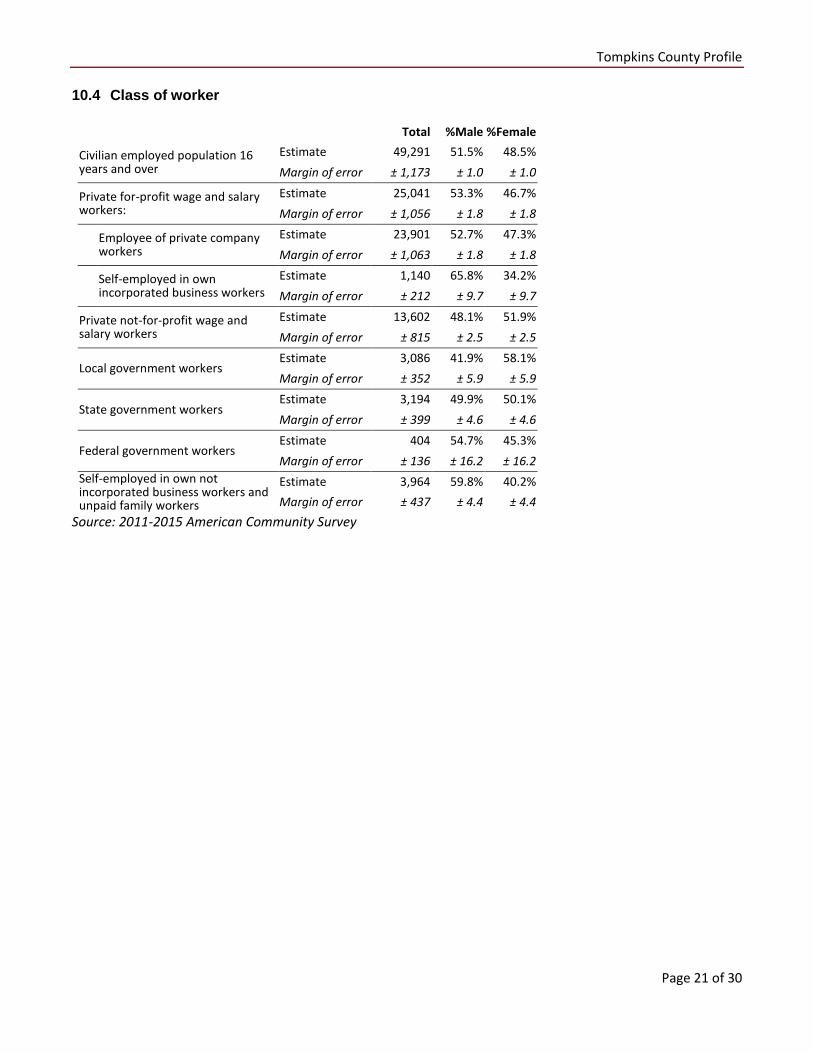
10.4 Class of worker
Total %Male %Female
Civilian employed population 16 years and over
Estimate 49,291 51.5% 48.5% Margin of error ± 1,173 ± 1.0 ± 1.0
Private for-profit wage and salary workers:
Estimate 25,041 53.3% 46.7% Margin of error ± 1,056 ± 1.8 ± 1.8
Employee of private company workers
Estimate 23,901 52.7% 47.3%
Margin of error ± 1,063 ± 1.8 ± 1.8
Self-employed in own incorporated business workers
Estimate 1,140 65.8% 34.2%
Margin of error ± 212 ± 9.7 ± 9.7
Private not-for-profit wage and salary workers
Estimate 13,602 48.1% 51.9% Margin of error ± 815 ± 2.5 ± 2.5
Local government workers Estimate 3,086 41.9% 58.1% Margin of error ± 352 ± 5.9 ± 5.9
State government workers Estimate 3,194 49.9% 50.1% Margin of error ± 399 ± 4.6 ± 4.6
Federal government workers Estimate 404 54.7% 45.3% Margin of error ± 136 ± 16.2 ± 16.2
Self-employed in own not incorporated business workers and unpaid family workers
Estimate 3,964 59.8% 40.2% Margin of error ± 437 ± 4.4 ± 4.4
Source: 2011-2015 American Community Survey
Tompkins County Profile
Page 22 of 30
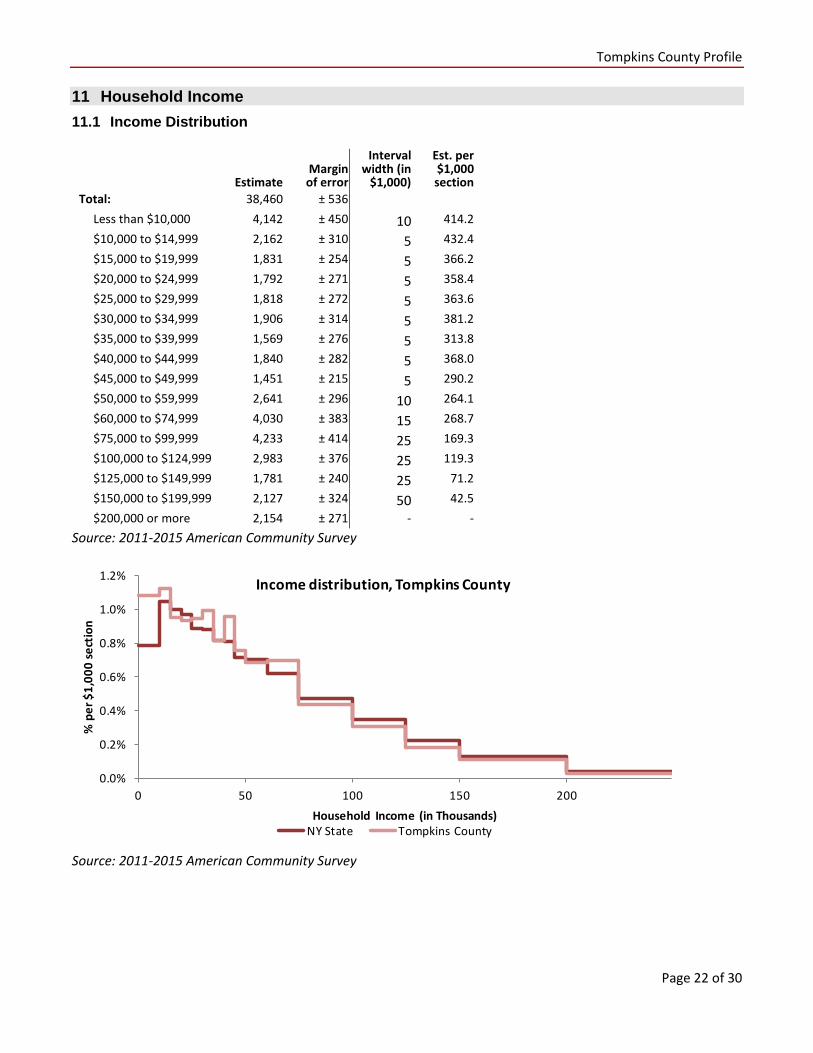
11 Household Income 11.1 Income Distribution
Estimate
Margin of error
Interval width (in
$1,000)
Est. per $1,000 section
Total: 38,460 ± 536
Less than $10,000 4,142 ± 450 10 414.2
$10,000 to $14,999 2,162 ± 310 5 432.4
$15,000 to $19,999 1,831 ± 254 5 366.2
$20,000 to $24,999 1,792 ± 271 5 358.4
$25,000 to $29,999 1,818 ± 272 5 363.6
$30,000 to $34,999 1,906 ± 314 5 381.2
$35,000 to $39,999 1,569 ± 276 5 313.8
$40,000 to $44,999 1,840 ± 282 5 368.0
$45,000 to $49,999 1,451 ± 215 5 290.2
$50,000 to $59,999 2,641 ± 296 10 264.1
$60,000 to $74,999 4,030 ± 383 15 268.7
$75,000 to $99,999 4,233 ± 414 25 169.3
$100,000 to $124,999 2,983 ± 376 25 119.3
$125,000 to $149,999 1,781 ± 240 25 71.2
$150,000 to $199,999 2,127 ± 324 50 42.5
$200,000 or more 2,154 ± 271 - -
Source: 2011-2015 American Community Survey
Source: 2011-2015 American Community Survey
0.0%
0.2%
0.4%
0.6%
0.8%
1.0%
1.2%
0 50 100 150 200
% p
er $
1,00
0 se
ctio
n
Household Income (in Thousands)
Income distribution, Tompkins County
NY State Tompkins County

Tompkins County Profile
Page 23 of 30
11.2 Median household income: Trends over time
Source: Small Area Income and Poverty Estimates (SAIPE)
12 Poverty 12.1 Family Income to Poverty Ratio
TOTAL PERCENT OF ALL
Estimate Margin of error Estimate Margin
of error All families 20,250 ± 556 ALL FAMILIES WITH INCOME:
Below 50 percent of poverty level 933 ± 239 4.6% ± 1.2
Below 100 percent of poverty level 1,929 ± 276 9.5% ± 1.3
Below 125 percent of poverty level 2,308 ± 310 11.4% ± 1.5
Below 150 percent of poverty level 2,966 ± 408 14.6% ± 2.0
Below 185 percent of poverty level 3,948 ± 431 19.5% ± 2.1
Below 200 percent of poverty level 4,291 ± 454 21.2% ± 2.2
Below 300 percent of poverty level 7,248 ± 499 35.8% ± 2.3
Below 400 percent of poverty level 9,979 ± 525 49.3% ± 2.2
Below 500 percent of poverty level 12,331 ± 534 60.9% ± 2.0
Source: 2011-2015 American Community Survey
0
10,000
20,000
30,000
40,000
50,000
60,000
70,000
2000 2005 2010 2015
Median Household Income ($), Tompkins County, 2000-2015
90% Confidence interval Estimate NY state estimate
Tompkins County Profile
Page 24 of 30
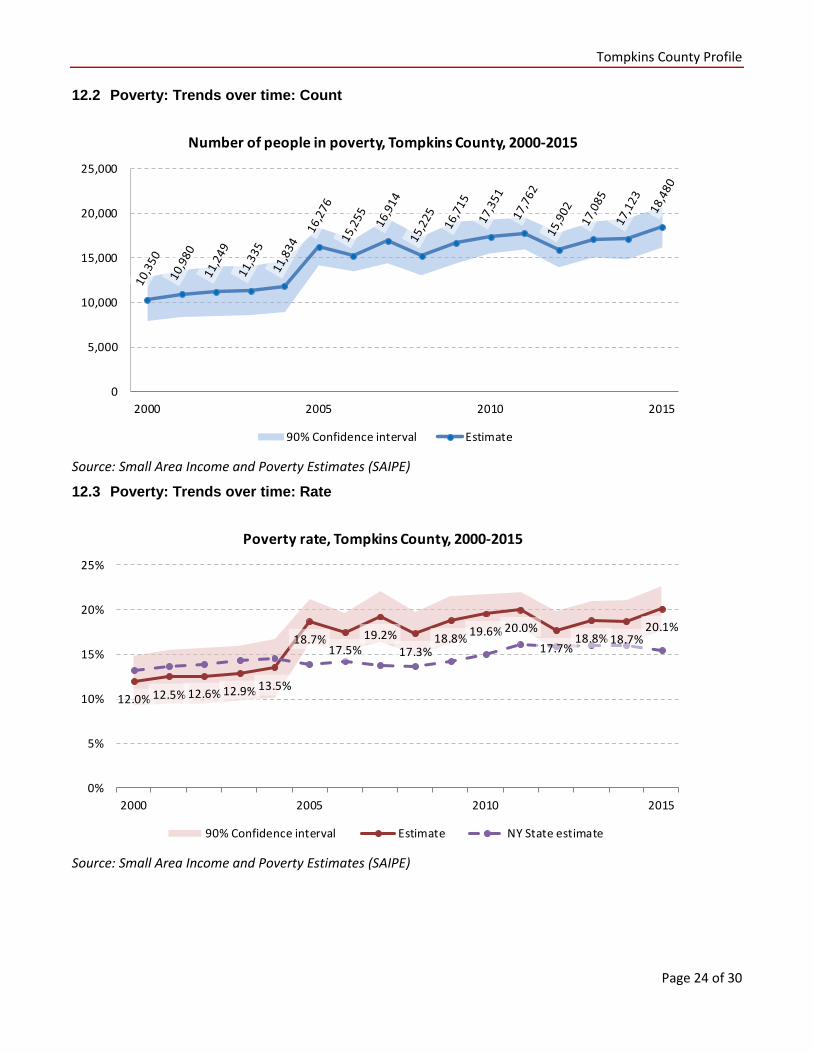
12.2 Poverty: Trends over time: Count
Source: Small Area Income and Poverty Estimates (SAIPE)
12.3 Poverty: Trends over time: Rate
Source: Small Area Income and Poverty Estimates (SAIPE)
0
5,000
10,000
15,000
20,000
25,000
2000 2005 2010 2015
Number of people in poverty, Tompkins County, 2000-2015
90% Confidence interval Estimate
12.0% 12.5% 12.6% 12.9% 13.5%
18.7%17.5%
19.2%17.3%
18.8% 19.6% 20.0%
17.7%18.8% 18.7%
20.1%
0%
5%
10%
15%
20%
25%
2000 2005 2010 2015
Poverty rate, Tompkins County, 2000-2015
90% Confidence interval Estimate NY State estimate
Tompkins County Profile
Page 25 of 30
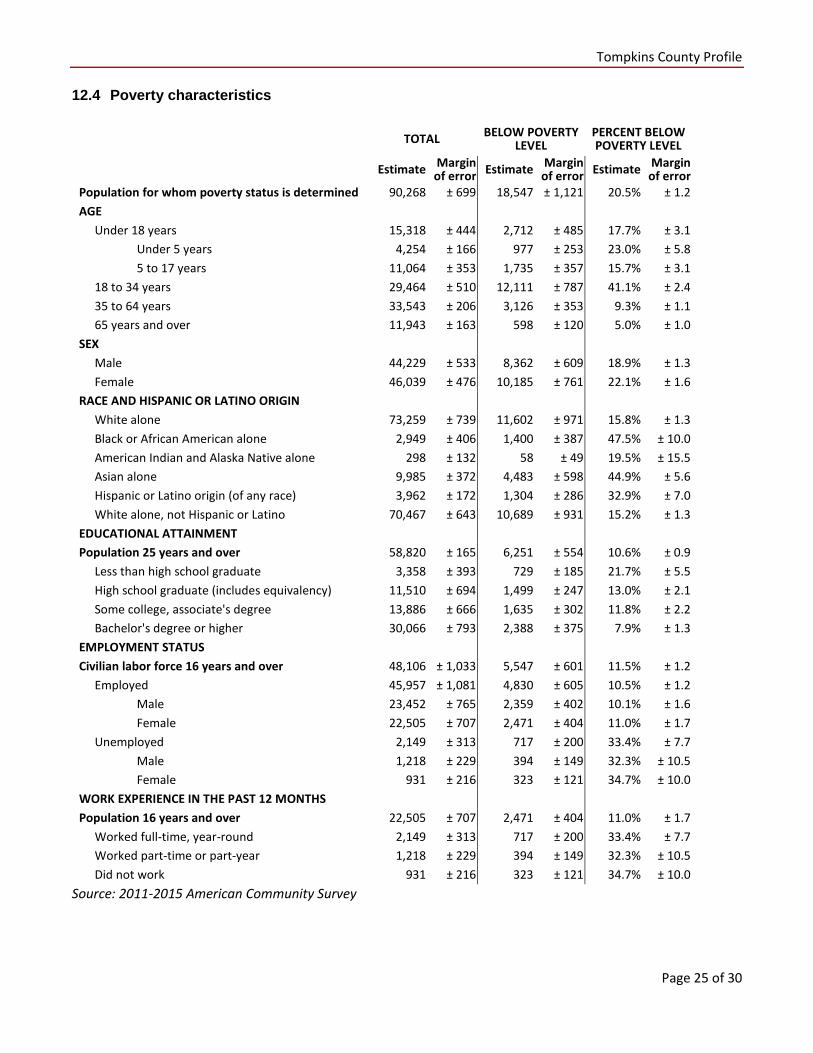
12.4 Poverty characteristics
TOTAL BELOW POVERTY
LEVEL PERCENT BELOW POVERTY LEVEL
Estimate Margin of error Estimate Margin
of error Estimate Margin of error
Population for whom poverty status is determined 90,268 ± 699 18,547 ± 1,121 20.5% ± 1.2 AGE
Under 18 years 15,318 ± 444 2,712 ± 485 17.7% ± 3.1
Under 5 years 4,254 ± 166 977 ± 253 23.0% ± 5.8
5 to 17 years 11,064 ± 353 1,735 ± 357 15.7% ± 3.1
18 to 34 years 29,464 ± 510 12,111 ± 787 41.1% ± 2.4
35 to 64 years 33,543 ± 206 3,126 ± 353 9.3% ± 1.1
65 years and over 11,943 ± 163 598 ± 120 5.0% ± 1.0
SEX
Male 44,229 ± 533 8,362 ± 609 18.9% ± 1.3
Female 46,039 ± 476 10,185 ± 761 22.1% ± 1.6
RACE AND HISPANIC OR LATINO ORIGIN
White alone 73,259 ± 739 11,602 ± 971 15.8% ± 1.3
Black or African American alone 2,949 ± 406 1,400 ± 387 47.5% ± 10.0
American Indian and Alaska Native alone 298 ± 132 58 ± 49 19.5% ± 15.5
Asian alone 9,985 ± 372 4,483 ± 598 44.9% ± 5.6
Hispanic or Latino origin (of any race) 3,962 ± 172 1,304 ± 286 32.9% ± 7.0
White alone, not Hispanic or Latino 70,467 ± 643 10,689 ± 931 15.2% ± 1.3
EDUCATIONAL ATTAINMENT Population 25 years and over 58,820 ± 165 6,251 ± 554 10.6% ± 0.9
Less than high school graduate 3,358 ± 393 729 ± 185 21.7% ± 5.5
High school graduate (includes equivalency) 11,510 ± 694 1,499 ± 247 13.0% ± 2.1
Some college, associate's degree 13,886 ± 666 1,635 ± 302 11.8% ± 2.2
Bachelor's degree or higher 30,066 ± 793 2,388 ± 375 7.9% ± 1.3
EMPLOYMENT STATUS Civilian labor force 16 years and over 48,106 ± 1,033 5,547 ± 601 11.5% ± 1.2
Employed 45,957 ± 1,081 4,830 ± 605 10.5% ± 1.2
Male 23,452 ± 765 2,359 ± 402 10.1% ± 1.6
Female 22,505 ± 707 2,471 ± 404 11.0% ± 1.7
Unemployed 2,149 ± 313 717 ± 200 33.4% ± 7.7
Male 1,218 ± 229 394 ± 149 32.3% ± 10.5
Female 931 ± 216 323 ± 121 34.7% ± 10.0
WORK EXPERIENCE IN THE PAST 12 MONTHS Population 16 years and over 22,505 ± 707 2,471 ± 404 11.0% ± 1.7
Worked full-time, year-round 2,149 ± 313 717 ± 200 33.4% ± 7.7
Worked part-time or part-year 1,218 ± 229 394 ± 149 32.3% ± 10.5
Did not work 931 ± 216 323 ± 121 34.7% ± 10.0
Source: 2011-2015 American Community Survey

Tompkins County Profile
Page 26 of 30
13 Glossary
American Community Survey (ACS) - The American Community Survey is an ongoing survey of the population that provides data every year on a variety of social and economic characteristics—age, sex, race, family and relationships, income and benefits, health insurance, education, veteran status, disabilities, where you work and how you get there, where you live and how much you pay for some essentials. The ACS replaced the information previously gathered by what was known as the “long form” of the decennial censuses. The ACS provides communities, companies and other institutions with current information they need to plan investments and services. Information from the survey generates data that help determine how more than $400 billion in federal and state funds are distributed each year. Every estimate presented in the American Community Survey, as in other surveys, has an uncertainty associated with it. Often the magnitude of that uncertainty is expressed as the Margin of Error.
Confidence Interval (CI) - indication of the degree of uncertainty about a sample estimates. Confidence intervals have been traditionally reported at the 90, 95 and 99 percent levels. A 90 percent confidence interval can be interpreted, for example, roughly as providing 90 percent certainty that the interval defined by the upper and lower bounds contain the true value of the characteristic. If a Margin of Error is given, the lower bound of the confidence interval is equal to the estimate minus the Margin of Error and the upper bound is equal to the estimate plus the Margin of Error. (See further, Margin of Error definition below.)
County subdivision or Minor Civil Division (MCD) - The Census Bureau geography for primary administrative units below the county level in New York is collectively referred to as county subdivisions or minor civil divisions. These include towns, cities and Indian Reservations.
Decennial Census - the Census of the population and housing taken every 10 years in the United States, at the start of each decade, since 1790.
Employed – either “at work” or “with a job, but not at work”.
Group Quarters Population - all U.S. residents who live in group living facilities including correctional institutions, juvenile facilities, skilled nursing facilities, college residence halls, military barracks, group homes, and workers' dormitories.
Household Population - all U.S. residents who live in housing units such as single family homes, townhouses, apartments, and mobile homes.
Intercensal Population Estimates - estimates produced for the years between two decennial censuses when both the beginning and ending populations are known. They are produced once a decade by adjusting the existing time series of postcensal estimates for the entire decade to smooth the transition from one decennial census count to the next. They differ from the postcensal estimates that are released annually because the difference between the April 1 postcensal estimate and April 1 census count for the end of the decade is redistributed across the estimates for that decade. For dates when both postcensal and intercensal estimates are available, intercensal estimates are preferred.
Labor Force - consists of people classified as employed or unemployed.
Margin of Error (MOE) - a measure of the precision of an estimate at a given level of confidence. The confidence level of a margin of error indicates the likelihood that the difference between the population value (which you
Tompkins County Profile
Page 27 of 30
would get if you could measure the whole population instead of a sample) and the estimate is less than or equal to the margin of error. The range from the estimate minus the margin of error to the estimate plus the margin of error is called the confidence interval. All ACS estimates are published with their margins of error at the 90 percent confidence level. Margins of error are useful in assessing the reliability of estimates and whether differences between estimates are significant.
Numeric Population Change - difference between the population of an area at the beginning and end of a time period. It is computed by taking the difference between the population at one point in time (t1) and some future time (t2).
Percent Population Change - difference between the population of an area at the beginning and end of a time period, expressed as a percentage of the beginning population. It is computed by dividing the population change (t2 - t1) by t1 and multiplying the result by 100.
Population Estimates - The calculated number of people living in an area as of a specified point in time, usually July 1st. The estimated population is calculated using a component of change model that incorporates information on natural increase (births, deaths) and net migration (net domestic migration, net international migration) that has occurred in an area since the latest decennial census. A procedure for estimating the current population using a procedure involving a “base population” value at time t -1, adding to that the births during the interval t-1 to t, subtracting the deaths during that interval t-1 to t, and then adding the net domestic and net international migration that occurred during that interval.
Population Density - Total number of people per areal unit like a square mile or square kilometer.
Population Pyramids - A graphical way of portraying a population’s age and sex composition at a given slice in time. The first horizontal bar, constituting the base of the graph, is the youngest age group (typically 0-4) with the number of males in that age group on the left and the number of females in that age group on the right. On top of that age group is another horizontal bar for the next age group (e.g. 5-9) and so forth with the top bar typically for those aged 75 and over. In a population with lots of births and deaths, the shape typically forms a pyramid with a broad base and a narrow top. It is one of the most basic ways to understand population change over time as well as between different geographic units of a similar status (e.g. counties).
Postcensal Estimates - estimates produced for the years after a decennial census when only the beginning population is known. They are produced and revised each year, targeted to July 1 of that year.
Projection - estimated population at some future time based on assumptions about births, deaths, migration, and ages.
Race/Ethnicity - the Census Bureau collects racial data in accordance with guidelines provided by the U.S. Office of Management and Budget (OMB), and these data are based on self-identification. The racial categories included in the census questionnaire generally reflect a social definition of race recognized in this country and not an attempt to define race biologically, anthropologically, or genetically. In addition, it is recognized that the categories of the race item include racial and national origin or sociocultural groups. People may choose to report more than one race to indicate their racial mixture, such as “American Indian” and “White.” People who identify their origin as Hispanic, Latino, or Spanish may be of any race. OMB requires five minimum categories: White, Black or African American, American Indian or Alaska Native, Asian, and Native Hawaiian or Other Pacific Islander. Hispanics may be classified as white or black. So we generally separate them out as an ethnic group first.

Tompkins County Profile
Page 28 of 30
Unemployed – Not employed, but actively looking for work and available to accept a job.
Unemployment rate – Fraction of the Labor Force that is unemployed.
Urban Area – A densely settled area with at least 2,500 people. If the total number of people is less than 50,000 the Census Bureau calls it an Urban Cluster, otherwise an Urbanized Area.
Vintage - each year, the U.S. Census Bureau produces and publishes estimates of the population for each state and county, as well as the nation as a whole. These are called “vintages.” In producing these vintages, the Bureau utilizes administrative data from a number of sources to estimate 1) the change in population since the most recent decennial census, and 2) the population for each year since the most recent decennial census. With each annual release of population estimates (vintage), the entire time series of estimates beginning on April 1, 2010 is revised and updated.
Vital Statistics - quantitative data concerning a population, such as the number of births, marriages, and deaths.
Tompkins County Profile
Page 29 of 30
14 References
Tompkins County homepage: http://tompkinscountyny.gov/
At Cornell:
• Program on Applied Demographics (PAD) URL: http://pad.human.cornell.edu/
o More county trends: https://pad.human.cornell.edu/counties/trends1geo.cfm?geo=109 • Community and Regional Development Institute (CaRDI)
URL: https://cardi.cals.cornell.edu/ • Cornell Cooperative Extensions (CCE)
Home page: http://www.cce.cornell.edu o Tompkins local office: http://ccetompkins.org/
Data sources and background information:
• New York State Data Center o https://labor.ny.gov/nys-data-center/index.shtm
• U.S. Census Bureau - general o QuickFacts: https://www.census.gov/quickfacts/table/PST045216/36,36109 o American FactFinder: http://factfinder.census.gov/
• U.S. Census Bureau - population o Decennial Census
Background: https://www.census.gov/2010census/ Demographic Profile:
http://factfinder2.census.gov/bkmk/table/1.0/en/DEC/10_SF1/SF1DP1/0500000US36109
o American Community Survey (ACS) Background: https://www.census.gov/programs-surveys/acs/ Social Data Profile:
http://factfinder2.census.gov/bkmk/table/1.0/en/ACS/15_5YR/DP02/0500000US36109 Economic Data Profile:
http://factfinder2.census.gov/bkmk/table/1.0/en/ACS/15_5YR/DP03/0500000US36109 Housing Data Profile:
http://factfinder2.census.gov/bkmk/table/1.0/en/ACS/15_5YR/DP04/0500000US36109 Demographics Data Profile:
http://factfinder2.census.gov/bkmk/table/1.0/en/ACS/15_5YR/DP05/0500000US36109 o Population estimates:
General: https://www.census.gov/programs-surveys/popest.html Explorer: https://www.census.gov/censusexplorer/censusexplorer-popest.html
• U.S. Census Bureau – Small Area Income & Poverty Estimates (SAIPE) o http://www.census.gov/did/www/saipe/
• U.S. Census Bureau - Public Use Quarterly Workforce Indicators (QWI) – annual averages o https://qwiexplorer.ces.census.gov/static/explore.html
• U.S. Census Bureau – Building Permits Survey o https://www.census.gov/construction/bps/
Tompkins County Profile
Page 30 of 30
• Bureau Labor Statistics (BLS) o Local Area Unemployment Statistics: http://www.bls.gov/lau/ o Quarterly Census of Employment and Wages (QCEW): https://www.bls.gov/cew/data.htm
• NY Department of Labor - o Labor statistics: https://labor.ny.gov/stats/index.shtm o Quarterly Census of Employment and Wages (QCEW): https://labor.ny.gov/stats/LSQCEW.shtm
• NY State Department of Health o Vital Statistics: https://www.health.ny.gov/statistics/vital_statistics/
• Bureau of Economic Analysis (BEA) – Local Area Personal Income and Employment: http://bea.gov/iTable/iTable.cfm?ReqID=70&step=1
Alternative sites for data retrieval:
• The Nelson A. Rockefeller Institute of Government – New York State Statistical Yearbooks http://www.rockinst.org/nys_statistics/
• Headwaters Economics: Economic Profile System – Human Dimensions Toolkit http://headwaterseconomics.org/tools/eps-hdt
• National Historical Geographic Information System (NHGIS) https://www.nhgis.org/
• Social Explorer http://www.socialexplorer.com/pub/home/home.aspx
• Stats America http://www.statsamerica.org/Default.aspx
• Missouri Census Data Center http://mcdc.missouri.edu/
• DataFerret http://dataferrett.census.gov/
• Investigative Reporters and Editors (IRE) Census project http://census.ire.org/