County DataBook - Illinois General Assembly Home · PDF fileCounty DataBook July 2013 Illinois...
195
County DataBook July 2013 Illinois General Assembly Legislative Research Unit
Transcript of County DataBook - Illinois General Assembly Home · PDF fileCounty DataBook July 2013 Illinois...

County DataBook
July 2013
Illinois General Assembly
Legislative Research UnitIllinois General Assembly
Legislative Research Unit

JOINT COMMITTEE ON LEGISLATIVE SUPPORT SERVICES
Senate Republican Leader & Chairman Sen. Christine Radogno President of the Senate Sen. John J. Cullerton Speaker of the House Rep. Michael J. Madigan House Republican Leader Rep. Tom Cross
LEGISLATIVE RESEARCH UNIT
Co-Chairperson Sen. Pamela J. Althoff Co-Chairperson Vacant Executive Director Alan R. Kroner Associate Director Jonathan P. Wolff
Senators RepresentativesThomas Cullerton Adam BrownSam McCann La Shawn K. FordJulie A. Morrison Chad HaysJim Oberweis Barbara WheelerMartin A. Sandoval Vacant
Legislative Research Unit 222 S. College, Suite 301
Springfield, Illinois 62704-1894Phone: 217/782-6851 E-mail: [email protected]
Website: www.ilga.gov/commission/lru/lru_home.html
The Legislative Research Unit is the central general research agency for the General Assembly. A board of 12 legislators, appointed by the Joint Com-mittee on Legislative Support Services, supervises its operations.
A staff of researchers handles inquiries from legislators, legislative commit-tees, and partisan staff. The staff’s areas of expertise include law generally, science and technology, taxation, education, local government, economics and fiscal affairs, and the political and social history of Illinois.

ILLINOIS COUNTY DATA BOOKSeventh Edition
Compiled by Thomas Bazan, Senior Research Associate
Proofing and Cover Design byKathleen Young, Proofreader-Office Associate
Layout byDianna Jones, Office Administrator
Publication 372, July 2013


IntroductionThe Legislative Research Unit is pleased to present the seventh edition of its County Data Book. This reference collects in one place the major demographic, economic, and political statistics for each county. It is intended for legislators and others who want to become more familiar with the state of Illinois and its counties.
Part 1 describes Illinois as a whole and contains maps shaded to show some important data about counties. Part 2 gives a separate compilation of statistics for each county. Part 3 ranks all counties for most of these statistics. Part 4 contains sources and methodology. The appendices list coun-ties by representative, legislative, and Congressional districts. Your suggestions for additions and improvements are appreciated.
Alan R. KronerExecutive Director

Contents
Page
Part 1: Illinois in Perspective .......................................................................................................................... 1Map 1: Population Changes for Illinois Counties, 2000 to 2010 .......................................................................... 5Map 2: Per-Capita Income for Illinois Counties, 2010 ......................................................................................... 6Map 3: Unemployment Rates by County, 2010 .................................................................................................... 7Map 4: Largest Source of Employment in Each County, 2010 ............................................................................. 8Map 5: Number of State Employees by County, 2011 .......................................................................................... 9
Part 2: Economic & Social Profiles of Each County .......................................................................11-114
Part 3: County Rankings for Selected Social & Economic Characteristics ...........................115-177Table 1: Areas of Illinois Counties ...................................................................................................................... 117Table 2: Populations of Illinois Counties, 2000 .................................................................................................. 118Table 3: Populations of Illinois Counties, 2010 .................................................................................................. 119Table 4: Percentage Population Change, 2000 and 2010 .................................................................................... 120Table 5: Percent of Population White, 2010 ........................................................................................................ 121Table 6: Percent of Population Black or African American, 2010 ...................................................................... 122Table 7: Percent of Population Asian or Pacific Islander, 2010 .......................................................................... 123Table 8: Percent of Population American Indian or Alaskan Native Races, 2010 .............................................. 124Table 9: Percent of Population of Hispanic Origin, Any Race, 2010 .................................................................. 125Table 10: Percent of Population Under Age 18, 2010 ........................................................................................... 126Table 11: Percent of Population Age 18 to 64, 2010 ............................................................................................ 127Table 12: Percent of Population Age 65 and Over, 2010 ...................................................................................... 128Table 13: Percent of Population with a High School Diploma or Equivalent, 2010 ............................................. 129Table 14: Percent of Population with a Bachelor’s Degree or Higher, 2010 ........................................................ 130Table 15: Single Female Households With Children Under 18, 2010 (as a percent of total households in the county) ................................................................................................................... 131Table 16: Single Male Households With Children Under 18, 2010 (as a percent of total households in the county) ................................................................................................................... 132Table 17: Percent of Children Under 18 in Poverty, 2010 .................................................................................... 133Table 18: Income Per Capita, 2010 ....................................................................................................................... 134Table 19: Percent Change in Income Per Capita, 2000-2010 ................................................................................ 135Table 20: Unemployment Rate, 2010 .................................................................................................................... 136Table 21: Percent Change in Unemployment Rate, 2000-2010 ............................................................................ 137Table 22: Percent of Households with Incomes Under $25,000, 2010 ................................................................. 138Table 23: Percent of Households with Incomes $25,000 to $99,999, 2010 .......................................................... 139Table 24: Percent of Households with Incomes $100,000 and over, 2010 ........................................................... 140Table 25: Construction Jobs, 2010 (as a percent of total jobs in the county) ........................................................ 141Table 26: Construction Jobs, 2010 (as a percent of total such jobs in the state) ................................................... 142Table 27: Farm Jobs, 2010 (as a percent of total jobs in the county) .................................................................... 143Table 28: Farm Jobs, 2010 (as a percent of total such jobs in the state) ............................................................... 144Table 29: Information, Finance, and Real Estate Jobs, 2010 (as a percent of total jobs in the county) ................ 145Table 30: Information, Finance, and Real Estate Jobs, 2010 (as a percent of total such jobs in the state) ........... 146

Contents (cont’d)Page
Table 31: Government (Federal, State, and Local) Jobs, 2010 (as a percent of total jobs in the county) ............. 147Table 32: Government (Federal, State, and Local) Jobs, 2010 (as a percent of total such jobs in the state) ........ 148Table 33: Manufacturing and Transportation Jobs, 2010 (as a percent of total jobs in the county) ..................... 149Table 34: Manufacturing and Transportation Jobs, 2010 (as a percent of total such jobs in the state) ................. 150Table 35: Business and Education Jobs, 2010 (as a percent of total jobs in the county) ...................................... 151Table 36: Business and Education Jobs, 2010 (as a percent of total such jobs in the state).................................. 152Table 37: Health and Social Services Jobs, 2010 (as a percent of total jobs in the county) .................................. 153Table 38: Health and Social Services Jobs, 2010 (as a percent of total such jobs in the state) ............................. 154Table 39: Forestry, Mining, and Utilities Jobs, 2010 (as a percent of total jobs in the county) ............................ 155Table 40: Forestry, Mining, and Utilities Jobs, 2010 (as a percent of total such jobs in the state) ....................... 156Table 41: Wholesale and Retail Trade Jobs, 2010 (as a percent of total jobs in the county) ................................ 157Table 42: Wholesale and Retail Trade Jobs, 2010 (as a percent of total such jobs in the state) ........................... 158Table 43: Other Service Jobs, 2010 (as a percent of total jobs in the county) ...................................................... 159Table 44: Other Service Jobs, 2010 (as a percent of total such jobs in the state) .................................................. 160Table 45: County Percent of Total Jobs in the State, 2010.................................................................................... 161Table 46: Number of State Employees, 2010 (excluding those at state universities) ........................................... 162Table 47: Value of Farmland, 2009 Equalized Assessed Valuation (millions) ..................................................... 163Table 48: Value of Residential Real Estate, 2009 Equalized Assessed Valuation (millions) ............................... 164Table 49: Value of Industrial, Railroad, and Mineral Real Estate, 2009 Equalized Assessed Valuation (millions) ........................................................................................... 165Table 50: Value of Commercial Real Estate, 2009 Equalized Assessed Valuation (millions) ............................. 166Table 51: Number of Farms, 2007 ......................................................................................................................... 167Table 52: Percent Change in Number of Farms, 1997-2007 ................................................................................. 168Table 53: Acres of Farms, 1997............................................................................................................................. 169Table 54: Percent Change in Acres of Farms, 1997-2007 ..................................................................................... 170Table 55: Acres of Foreign-Owned Agricultural Land, 2007 ............................................................................... 171Table 56: Percentage Turnout of Registered Voters in the 2010 General Election ............................................... 172Table 57: Number of Republican Ballots in the 2012 Primary Election ............................................................... 173Table 58: Number of Democratic Ballots in the 2012 Primary Election............................................................... 174Table 59: Percentage Turnout of Registered Voters in the 2012 General Election ............................................... 175Table 60: Number of Ballots for the Top of the Republican Ticket in the 2012 General Election ....................... 176Table 61: Number of Ballots for the Top of the Democratic Ticket in the 2012 General Election ...................... 177
Part 4: Sources, Methodology, and Appendices ............................................................................179-185Sources and Methodology ...................................................................................................................................... 181Appendix A: Counties in Each Congressional District ........................................................................................ 183Appendix B: Counties in Each Legislative (Senate) District ............................................................................... 184Appendix C: Counties in Each Representative (House) District ......................................................................... 185

Part 1Illinois in Perspective
POPULATIONIllinois’ population increased by 411,339 people from 2000 to 2010, roughly 3.3%. This was below the national growth rate of 9.7%. Illinois’ share of the total U.S. population decreased 0.2 percentage points. Cook County’s population decreased by 3.4%, and there were large population gains in counties surrounding Cook—15.0% from 2000 to 2010. Although downstate counties showed a combined 4.3% increase in population, most counties’ populations fell. In sum, Cook County’s population decreased by 182,066 from 2000 to 2010; the 5 counties surrounding Cook gained 406,996; and the remaining counties gained a collective 186,409. Overall, 61 counties lost population. By far the largest growth as a percentage of population was in Ken-dall County—in northeastern Illinois—which increased by 110.4%. See Map 1 on page 5.
Illinois % of Illinois % change U.S. % change U.S. population
2000 Census 12,419,293 - 281,421,906 - 4.4% 2010 Census 12,830,632 3.3% 308,745,538 9.7% 4.2
The 2010 Census showed Illinois with a smaller proportion of all races except black or African American in comparison to the nation, and a population with a median average slightly below the national average. Educationally, Illinois was below the national average in the percentage of people with at least 12 years of school, but above the national average for those with 16 years or more.
2000 2010 % change Illinois U.S. Illinois U.S. Illinois U.S.
RaceWhite (non-Hispanic) 67.8% 69.1% 63.7% 63.7% -3.0% 1.2%Black or African American 14.9 12.1 14.3 12.2 -1.3 11.0American Indian and Alaska Native 0.1 0.7 0.1 0.7 3.4 8.6Asian or Pacific Islander 3.4 3.7 4.5 4.8 37.9 42.7Hispanic Origin, any race 12.3 12.5 15.8 16.3 32.5 43.0
AgeUnder 18 26.1% 25.7% 24.4% 24.0% -3.6% 2.6%18 to 64 61.8 61.9 63.1 62.9 5.5 11.665 or over 12.1 12.4 12.5 13.0 7.3 15.5
Median Age 34.7 35.3 36.6 37.2 5.5 5.4
Education (age 25 or over)12 years or more 55.4% 56.0% 55.9% 57.4% 5.7% 14.9%16 years or more 26.1 24.4 30.3 28.2 21.6 29.5
2 / Illinois County Data Book
ELECTIONSMore voters have taken Democratic than Republican primary ballots in every statewide election since 2002, except 2012, and Democratic candidates carried the state in each gubernatorial and presidential election during that time. Democratic voters outnumber Republicans in Cook County and many southern Illinois counties, and Republicans are more dominant in the col-lar counties and most counties in central Illinois.
Primary Democratic Republican Election Total vote Number Percent Number Percent
2002 2,321,875 1,320,813 56.9% 946,339 40.8% 2004 2,067,824 1,310,129 63.4 702,658 34.0 2006 1,804,624 997,720 55.3 751,627 41.7 2008 2,986,982 2,059,702 69.0 910,540 30.5 2010 1,758,489 959,521 54.6 783,060 44.5 2012 1,694,317 730,219 43.1 948,178 56.0
General Election Registered Turnout Kind of election Democratic* Republican*
2002 7,043,557 51.8% Gubernatorial 52.2% 45.1% 2004 7,499,488 71.3 Presidential 54.8 44.5 2006 7,375,688 48.6 Gubernatorial 49.8 39.3 2008 7,789,500 71.6 Presidential 61.9 36.8 2010 7,506,073 50.5 Gubernatorial 46.8 45.9 2012 7,520,722 70.2 Presidential 57.6 40.7
* Percents do not add to 100% because they are based on all votes, including other parties.
ECONOMYIllinois’ per-capita income decreased from 107.7% of the U.S. average in 2000 to 105.3% in 2010. Income varies widely among the counties throughout the state, ranging from 135% of the national average to under 63%. See Map 2 on page 6 for per-capita income and Map 3 on page 7 for unemployment rates.
Per-capita income
Year Illinois U.S. Ill. % of U.S.
2000 $32,645 $30,319 107.7% 2005 37,437 35,452 105.6 2010 42,040 39,937 105.3
Lowest county 2010 (Johnson) 25,000 62.6Highest county 2010 (Lake) 53,905 135.0
Illinois has 4.3% of the total U.S. workforce and an unemployment rate that is higher than the national rate.
Employment
(2010) Illinois U.S. Ill. % of U.S.
Labor force 6,602,663 153,889,000 4.3%Unemployed 10.5% 9.6% -

Illinois County Data Book / 3
Percent Change in Number of Jobs, Illinois and U.S., 2001 to 2010
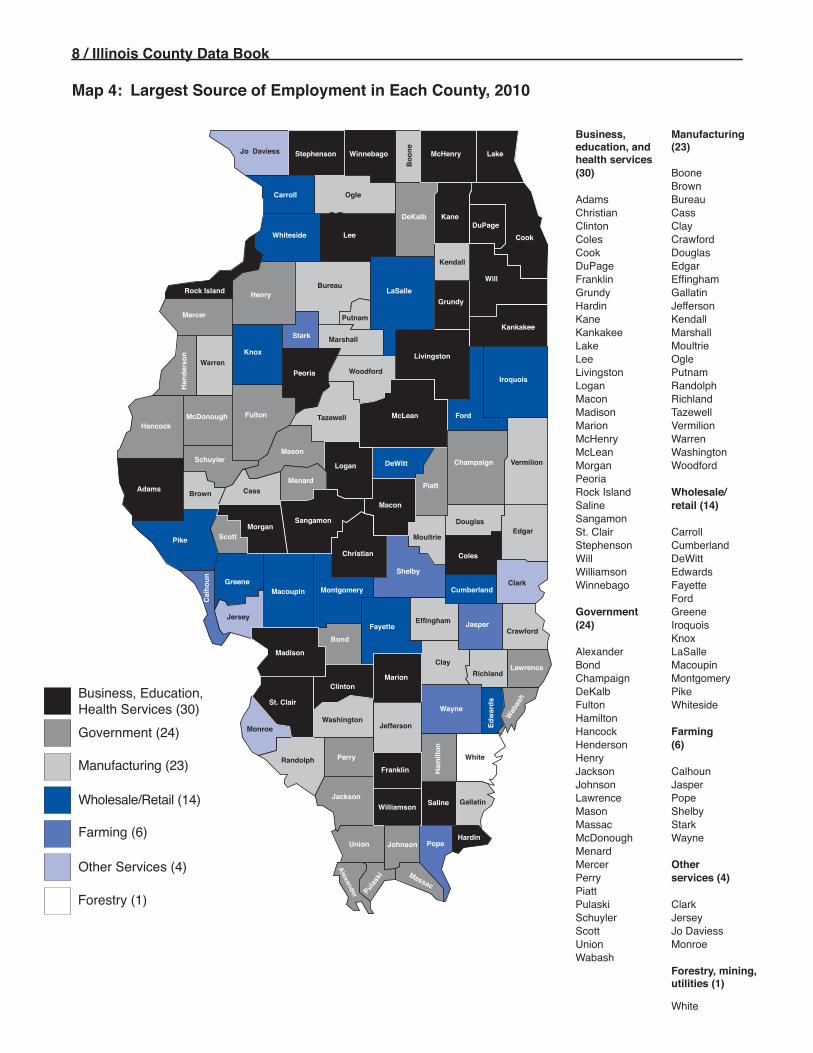
The distribution of jobs by kind of industry in Illinois is very similar to the national distribution; services and wholesale and retail trade comprise over half of the total employment. Illinois showed a decline in total jobs from 2001 to 2010 although the national figure showed an increase—Illinois’ percentage change in every category lagged behind the national total. See Map 4 on page 8 for the two major industry in each county.
2001 2010 PercentIllinois No. of jobs % total No. of jobs % total change
Business, education, and health services 1,869,422 25.5% 2,106,983 29.0% 12.7%Other services 961,777 13.1 1,028,280 14.1 6.9Wholesale and retail trade 1,086,451 14.8 1,006,709 13.8 -7.3Government 900,405 12.3 907,715 12.5 0.8Information, finance, real estate 831,977 11.4 893,720 12.3 7.4Manufacturing and transportation 1,124,110 15.4 875,271 12.0 -22.1Construction 387,061 5.3 318,989 4.4 -17.6Farm 96,985 1.3 79,912 1.1 -17.6Forestry, mining, utilities 59,230 0.8 58,759 0.8 -0.8
Total 7,317,418 7,276,338 -0.6%
United StatesBusiness, education, and health services 39,930,300 24.1% 47,383,400 27.3% 18.7%Other services 23,046,900 13.9 25,683,800 14.8 11.4Government 23,151,000 14.0 24,680,000 14.2 6.6Wholesale and retail trade 24,488,200 14.8 23,808,200 13.7 -2.8Information, finance, real estate 17,400,800 10.5 20,321,200 11.7 16.8Manufacturing and transportation 22,391,600 13.5 17,711,300 10.2 -20.9Construction 9,817,700 5.9 8,914,200 5.1 -9.2Farm 3,060,000 1.8 2,665,000 1.5 -12.9Forestry, mining, utilities 2,223,700 1.3 2,600,300 1.5 16.9
Total 165,510,200 173,767,400 5.0%
Illinois U.S.

4 / Illinois County Data Book
REVENUES AND EXPENDITURESIllinois state government relies mainly on sales tax, income tax, and motor fuel taxes. Local governments rely mainly on property taxes. (The figures below are totals for the most recent years for which data are available or estimates could be made for individual counties.)
Revenue collections (after refunds) (millions)
State sales & use tax (est. 2011) $9,671.7 Individual income tax (2010) 9,199.1 State motor fuel tax (2011) 1,234.5 Local property tax (2008) 24,111.0
State expenditures (millions)
Elementary and Secondary education (FY 2011) $ 6,620.5 Human services (Medicaid, FY 2011) 10,984.1 State payroll (2011) 4,534.3
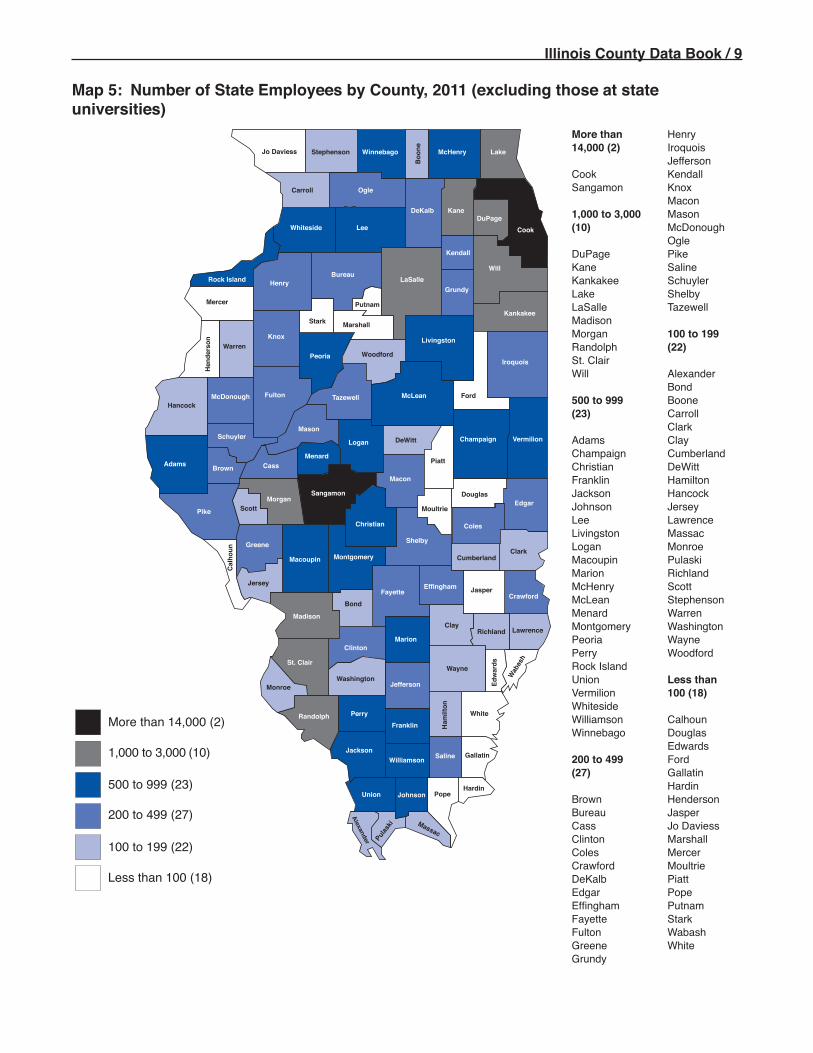
Number of state employees, excluding those at 78,903 state universities (2011) (see Map 5 on page 9)
LAND USEThe most striking feature of the change in land use from 1999 to 2009 was the increase in the value of residential property. Figures from 1999-2009 show an increase of over 135% for residential property, which in 2009 was valued at two-thirds of the value of all property in the state. Farmland increased the smallest percent at 3.9%.
Equalized Assessed Value 1999-2009 1999 % of total 2009 % of total % chg Residential $110,314.1 57.2% $259,246.4 66.0% 135.0% Commercial 50,619.7 26.2 91,148.0 23.2 80.1 Industrial 22,987.9 11.9 33,119.9 8.4 44.1 Farm 9,072.3 4.7 9,425.3 2.4 3.9 Total $192,993.9 $392,939.7 103.6%
Change in Equalized Assessed Property Value in Illinois, 1999 to 2009 ($ in millions)
Illinois U.S.

Illinois County Data Book / 5
Map 1: Population Changes for Illinois Counties, 2000 to 2010
Over 110% Effingham(1) Ford HamiltonKendall Henry Lee5% to 35% Livingston(19) McDonough MontgomeryBoone PutnamChampaign RandolphClinton RockIslandDeKalb Grundy -4% to <-2%Jersey (21)Kane Kankakee ClarkLake CookLawrence CrawfordMcHenry EdwardsMcLean FultonMonroe JeffersonSt.Clair JohnsonTazewell LoganWill MaconWilliamson MacoupinWinnebago MercerWoodford Morgan Perry0% to 5% Scott(21) Shelby StephensonBond UnionCalhoun VermilionColes WashingtonDouglas WayneDuPage WhitesideFayette Franklin Less than -4%Jackson (22)Jo Daviess LaSalle AlexanderMadison CarrollMassac ClayMenard EdgarMoultrie GallatinOgle GreenePeoria HancockPiatt HardinPope HendersonRichland IroquoisSangamon JasperSchuyler Knox Marion-2% to <0% Marshall(18) Mason PikeAdams PulaskiBrown SalineBureau StarkCass WabashChristian WarrenCumberland WhiteDe Witt
Over 110% (1)
5% to 35% (19)
0% to 5% (21)
-2% to <0% (18)
-4% to <-2% (21)
White
Boo
ne Lake
Carroll Ogle
DeKalb Kane
CookWhiteside LeeDuPage
Will
Kendall
Henry LaSalleGrundy
Rock Island
PutnamMercer
Hen
ders
on WarrenKnox
Marshall
Livingston
Kankakee
Peoria WoodfordIroquois
FordMcLeanTazewellFultonHancock
McDonough
Schuyler
Adams Brown Cass
Mason
Logan
Menard
DeWitt Champaign
EdgarDouglas
Piatt
Macon
SangamonMorgan
Christian
Pike Scott
GreeneMacoupin
Shelby
Coles
ClarkCumberland
Jersey
CrawfordBond
FayetteEffingham Jasper
Madison
Clinton
St. Clair
Washington
Marion RichlandLawrence
Jefferson
Wayne
Edw
ards
Wab
ash
Ham
ilton
FranklinPerryRandolph
JacksonWilliamson Saline
Union Johnson PopeHardin
Pulask
i
Alexander
Cal
houn
McHenry
Monroe
Vermilion
Stark
Stephenson WinnebagoJo Daviess
Clay
Gallatin
Moultrie
Bureau
Montgomery
Massac
Less than -4% (22)

6 / Illinois County Data Book
Map 2: Per-Capita Income for Illinois Counties, 2010
Boo
ne Lake
Carroll Ogle
DeKalb Kane
CookWhiteside LeeDuPage
Will
Kendall
Henry LaSalleGrundy
Rock Island
PutnamMercer
Hen
ders
on WarrenKnox
Marshall
Livingston
Kankakee
Peoria WoodfordIroquois
FordMcLeanTazewellFultonHancock
McDonough
Schuyler
Adams Brown Cass
Mason
Logan
Menard
DeWitt Champaign
EdgarDouglas
Piatt
Macon
SangamonMorgan
Christian
Pike Scott
GreeneMacoupin
Shelby
Coles
ClarkCumberland
Jersey
CrawfordBond
FayetteEffingham Jasper
Madison
Clinton
St. Clair
Washington
Marion RichlandLawrence
Jefferson
Wayne
Edw
ards
Wab
ash
Ham
ilton
WhiteFranklin
PerryRandolph
JacksonWilliamson Saline
Union Johnson PopeHardin
Pulask
i
Alexander
Cal
houn
McHenry
Monroe
Vermilion
Stark
Stephenson WinnebagoJo Daviess
Clay
Gallatin
Moultrie
Bureau
Montgomery
Massac
$40,000 to $49,999 (9)
$35,000 to $39,999 (28)
$33,000 to $34,999 (20)
$30,000 to $32,999 (32)
$25,000 to $29,999 (11)
Over $50,000 (2)
Over $50,000 Jasper(2) Kendall KnoxDuPage MacoupinLake Morgan Ogle$40,000 to Stark$49,999 (9) Stephenson WhitesideCook WilliamsonFord WinnebagoMcLean Monroe $30,000 toPeoria $32,999 (32)Piatt Sangamon BooneWill CalhounWoodford Cass Clay$35,000 to Coles$39,999 (28) DeKalb EdwardsAdams FultonBureau HamiltonChristian HancockClinton HendersonCrawford JacksonDe Witt JeffersonEffingham KankakeeHenry LeeIroquois LoganJersey MarionJo Daviess MassacKane McDonoughLaSalle MontgomeryLivingston PikeMacon PulaskiMadison RichlandMarshall SalineMason SchuylerMcHenry ScottMenard ShelbyMercer UnionMoultrie VermilionPutnam WabashRockIsland WarrenSt. Clair WayneTazewell Washington $25,000 toWhite $29,999 (11) $33,000 to Alexander$34,999 (20) Brown FayetteBond FranklinCarroll GreeneChampaign HardinClark JohnsonCumberland LawrenceDouglas PerryEdgar PopeGallatin RandolphGrundy

Illinois County Data Book / 7
Map 3: Unemployment Rates by County, 2010
Over 15% (2)
12% to 14% (15)
11% to 11.9% (16)
10% to 10.9% (23)
9% to 9.9% (25)
Boo
ne Lake
Carroll Ogle
DeKalbKane
CookWhiteside LeeDuPage
Will
Kendall
HenryLaSalle
GrundyRock Island
PutnamMercer
Hen
ders
on WarrenKnox
Marshall
Livingston
Kankakee
Peoria WoodfordIroquois
FordMcLeanTazewellFultonHancock
McDonough
Schuyler
Adams Brown Cass
Mason
Logan
Menard
DeWitt Champaign
EdgarDouglas
Piatt
Macon
SangamonMorgan
Christian
Pike Scott
GreeneMacoupin
Shelby
Coles
ClarkCumberland
Jersey
CrawfordBond
FayetteEffingham
Jasper
Madison
Clinton
St. Clair
Washington
Marion RichlandLawrence
Jefferson
Wayne
Edw
ards
Wab
ash
Ham
ilton
WhiteFranklin
PerryRandolph
JacksonWilliamson Saline
Union Johnson PopeHardin
Pulask
i
Alexander
Cal
houn
McHenry
Monroe
Vermilion
Stark
Stephenson WinnebagoJo Daviess
Clay
Gallatin
Moultrie
Bureau
Montgomery
Massac
Under 9% (21)
Over 15% Mercer(2) Richland SalineBoone ShelbyWinnebago St.Clair Tazewell12% to 14% Wabash(15) Will Clark 9% to 9.9%Clay (25)FranklinGrundy ChampaignKankakee ColesLaSalle DeKalbMacon DeWittMarion DouglasMason EdwardsMontgomery GreeneOgle HamiltonPerry HenryPutnam JasperUnion JeffersonVermilion Jersey Kendall11% to 11.9% Knox(16) Lawrence LoganAlexander MadisonBureau MarshallCarroll MassacEdgar MorganFayette RandolphFulton RockIslandHancock ScottHardin WayneJohnson WilliamsonLee Peoria Under 9%Pope (21)PulaskiStark AdamsStephenson BrownWhiteside Cass Clinton10% to 10.9% DuPage(23) Effingham JacksonBond Jo DaviessCalhoun McDonoughChristian McLeanCook MenardCrawford MonroeCumberland MoultrieFord PiattGallatin PikeHenderson SangamonIroquois SchuylerKane WarrenLake WashingtonLivingston WhiteMacoupin WoodfordMcHenry
8 / Illinois County Data Book
Map 4: Largest Source of Employment in Each County, 2010
Government (24)
Manufacturing (23)
Wholesale/Retail (14)
Farming (6)
Other Services (4)
Forestry (1)
Boo
ne Lake
Carroll Ogle
DeKalb Kane
CookWhiteside LeeDuPage
Will
Kendall
Henry LaSalleGrundy
Rock Island
PutnamMercer
Hen
ders
on WarrenKnox
Marshall
Livingston
Kankakee
Peoria WoodfordIroquois
FordMcLeanTazewellFultonHancock
McDonough
Schuyler
Adams Brown Cass
Mason
Logan
Menard
DeWitt Champaign
EdgarDouglas
Piatt
Sangamon
Christian
Pike Scott
GreeneMacoupin
Shelby
Coles
ClarkCumberland
Jersey
CrawfordBond
FayetteEffingham Jasper
Madison
Clinton
St. Clair
Washington
Marion RichlandLawrence
Jefferson
Wayne
Wab
ash
Ham
ilton
WhitePerryRandolph
JacksonWilliamson Saline
Union Johnson PopeHardin
Pulask
i
Alexander
Cal
houn
McHenry
Monroe
Vermilion
Stark
Stephenson WinnebagoJo Daviess
Clay
Gallatin
Moultrie
Bureau
Montgomery
Massac
Edw
ards
Morgan
Macon
Franklin
Business, Education,Health Services (30)
Business, Manufacturingeducation, and (23)health services(30) Boone BrownAdams BureauChristian CassClinton ClayColes CrawfordCook DouglasDuPage EdgarFranklin EffinghamGrundy GallatinHardin JeffersonKane KendallKankakee MarshallLake MoultrieLee OgleLivingston PutnamLogan RandolphMacon RichlandMadison TazewellMarion VermilionMcHenry WarrenMcLean WashingtonMorgan WoodfordPeoria RockIsland Wholesale/Saline retail (14)SangamonSt. Clair CarrollStephenson CumberlandWill DeWittWilliamson EdwardsWinnebago Fayette FordGovernment Greene(24) Iroquois KnoxAlexander LaSalleBond MacoupinChampaign MontgomeryDeKalb PikeFulton WhitesideHamiltonHancock FarmingHenderson (6)Henry Jackson CalhounJohnson JasperLawrence PopeMason ShelbyMassac StarkMcDonough WayneMenard Mercer OtherPerry services (4)Piatt Pulaski ClarkSchuyler JerseyScott Jo DaviessUnion MonroeWabash Forestry, mining, utilities (1) White
Illinois County Data Book / 9
Map 5: Number of State Employees by County, 2011 (excluding those at state universities)
500 to 999 (23)
More than 14,000 (2)
1,000 to 3,000 (10)
200 to 499 (27)
100 to 199 (22)
Boo
ne Lake
Carroll Ogle
DeKalb Kane
CookWhiteside LeeDuPage
Will
Kendall
Henry LaSalleGrundy
Rock Island
PutnamMercer
Hen
ders
on WarrenKnox
Marshall
Livingston
Kankakee
Peoria WoodfordIroquois
FordMcLeanTazewellFultonHancock
McDonough
Schuyler
Adams Brown Cass
Mason
Logan
Menard
DeWitt Champaign
EdgarDouglas
Piatt
Macon
SangamonMorgan
Christian
Pike Scott
Greene
Macoupin
Shelby
Coles
ClarkCumberland
Jersey
CrawfordBond
FayetteEffingham Jasper
Madison
Clinton
St. Clair
Washington
MarionRichland Lawrence
Jefferson
Wayne
Edw
ards
Wab
ash
Ham
ilton
WhiteFranklin
PerryRandolph
JacksonWilliamson Saline
Union Johnson PopeHardin
Pulask
i
Alexander
Cal
houn
McHenry
Monroe
Vermilion
Stark
Stephenson WinnebagoJo Daviess
Clay
Gallatin
Moultrie
Bureau
Montgomery
Massac
Less than 100 (18)
More than Henry14,000 (2) Iroquois JeffersonCook KendallSangamon Knox Macon1,000 to 3,000 Mason(10) McDonough OgleDuPage PikeKane SalineKankakee SchuylerLake ShelbyLaSalle TazewellMadison Morgan 100 to 199Randolph (22)St. Clair Will Alexander Bond500 to 999 Boone(23) Carroll ClarkAdams ClayChampaign CumberlandChristian DeWittFranklin HamiltonJackson HancockJohnson JerseyLee LawrenceLivingston MassacLogan MonroeMacoupin PulaskiMarion RichlandMcHenry ScottMcLean StephensonMenard WarrenMontgomery WashingtonPeoria WaynePerry WoodfordRockIslandUnion Less thanVermilion 100 (18)WhitesideWilliamson CalhounWinnebago Douglas Edwards200 to 499 Ford(27) Gallatin HardinBrown HendersonBureau JasperCass Jo DaviessClinton MarshallColes MercerCrawford MoultrieDeKalb PiattEdgar PopeEffingham PutnamFayette StarkFulton WabashGreene WhiteGrundy


Economic&SocialProfilesofEachCounty
Part 2Stark


Illinois County Data Book / 13
Adams CountyCongressional District: 18Senate District: 47House District: 94County Seat: QuincyEstablished: January 13, 1825Area: 857 square miles
POPULATION2000 Census 68,2772010 Census 67,103Percent change (2000-2010) -1.7%
Race (2010)White (non-Hispanic) 93.0%Black or African American 3.4American Indian or Alaskan Native 0.1Asian and Pacific Islander 0.7
Hispanic origin, any race 1.2%
Age (2010)Under 18 23.0%18 to 64 59.565 and over 17.5Median age (2010) 40.7 years
Education (age 25 or over) (2010)12 or more years 89.2%16 or more years 21.1
Single female households with children < 18 (2010) 10.3%Single male households with children < 18 (2010) 3.5Children under 18 in poverty (2010) 17.5
ECONOMY 2010 2000-10 changeIncome per capita $37,130 48.9%
Labor Force 37,873 5.5%Unemployed 7.5% 97.4
Under $25,000- $100,000 Annual household $25,000 $99,999 and overincome (2010) 27.9% 59.2% 12.9%
% of total jobsJobs by Industry (2010) county stateConstruction 4.9% 0.7%Farm 2.9 1.6Information, finance, real estate 10.7 0.5Government 11.4 0.5Manufacturing and transportation 14.4 0.7Business and education 9.9 0.3Health and social services 13.6 0.7Forestry, mining, utilities 0.3 0.2Wholesale and retail trade 17.7 0.8Other services 13.6 0.6Total jobs - 0.6
REVENUES AND EXPENDITURES
Revenue Collections (millions)State sales & use tax (est. 2011) $60.3Individual income tax (2010) 34.4 State motor fuel tax (est. 2011) 6.7Local property tax (2008) 61.5
State Expenditures (millions)Education (2011) $33.4Medicaid (2011) 52.2State payroll (2011) 41.2
Number of state employees (2011) 842
LAND USE Equalized assessed value 2009 1999-09 (millions) changeFarm $ 97.7 -1.9%Residential 627.3 57.1Industrial 46.8 92.2Commercial 229.7 60.1Total $1,001.4 50.2%
2007 1997-07 changeNumber of farms 1,295 -8.5%Acres of farms 374,133 -15.4
Foreign-owned Parcels Acresagricultural land (2010) 6 274
ELECTIONS
Primary Dem. Rep. Total2002 5,246 7,607 15,4982004 5,165 8,449 16,7052006 3,800 3,850 7,7212008 6,557 7,232 14,1542010 1,774 5,868 7,6552012 1,420 7,854 9,872
Registered Number Percent General voters voting voting2002 42,861 25,512 59.5%2004 42,498 31,723 74.62006 43,873 22,599 51.52008 44,329 31,107 70.22010 44,891 24,125 53.72012 45,172 31,056 68.8
Office Dem. Rep.2002 Governor 35.9% 62.2%2004 President 33.4 66.22006 Governor 34.5 54.32008 President 38.3 60.72010 Governor 20.5 74.52012 President 31.5 66.7
Stark

14 / Illinois County Data Book
Alexander CountyCongressional District: 12Senate District: 59House District: 118County Seat: CairoEstablished: March 4, 1819Area: 236 square miles
POPULATION
2000 Census 9,5902010 Census 8,238Percent change (2000-2010) -14.1%
Race (2010)White (non-Hispanic) 60.5%Black or African American 35.3American Indian or Alaskan Native 0.3Asian and Pacific Islander 0.3
Hispanic origin, any race 1.9%
Age (2010)Under 18 22.9%18 to 64 60.265 and over 17.0Median age (2010) 41.1 years
Education (age 25 or over) (2010)12 or more years 76.0%16 or more years 9.5
Single female households with children < 18 (2010) 17.7%Single male households with children < 18 (2010) 4.0Children under 18 in poverty (2010) 33.1
ECONOMY 2010 2000-10 changeIncome per capita $26,045 56.1%
Labor Force 3,002 -17.3%Unemployed 11.9% 52.6
Under $25,000- $100,000 Annual household $25,000 $99,999 and overincome (2010) 42.4% 54.0% 3.6%
% of total jobsJobs by Industry (2010) county stateConstruction 2.6% 0.0%Farm 5.3 0.2Information, finance, real estate 7.2 0.0Government 21.6 0.1Manufacturing and transportation 12.7 0.0Business and education 4.8 0.0Health and social services 0.0 0.0Forestry, mining, utilities 1.4 0.1Wholesale and retail trade 8.2 0.0Other services 9.7 0.0Total jobs - 0.0
REVENUES AND EXPENDITURES
Revenue Collections (millions)State sales & use tax (est. 2011) $1.5Individual income tax (2010) 1.7 State motor fuel tax (est. 2011) 0.4Local property tax (2008) 3.8
State Expenditures (millions)Education (2011) $9.0Medicaid (2011) 12.4State payroll (2011) 7.7
Number of state employees (2011) 159
LAND USE Equalized assessed value 2009 1999-09 (millions) changeFarm $ 9.1 -6.1%Residential 14.4 -6.8Industrial 8.2 -18.3Commercial 5.9 10.1Total $37.6 -7.2%
2007 1997-07 changeNumber of farms 143 -13.9%Acres of farms 47,626 -33.2
Foreign-owned Parcels Acresagricultural land (2010) 7 2,263
ELECTIONS
Primary Dem. Rep. Total2002 2,097 340 2,5302004 1,780 341 2,1212006 2,102 228 2,3302008 2,115 411 2,5262010 1,454 269 1,7272012 345 435 781
Registered Number Percent General voters voting voting2002 8,749 3,451 39.4%2004 7,399 4,252 57.52006 7,760 3,126 40.32008 7,926 4,030 50.82010 7,806 2,910 37.32012 5,435 3,562 65.5
Office Dem. Rep.2002 Governor 63.5% 34.9%2004 President 52.1 47.32006 Governor 67.4 24.22008 President 55.6 43.02010 Governor 49.8 45.32012 President 56.1 42.5
Stark

Illinois County Data Book / 15
Bond CountyCongressional Districts: 13, 15Senate District: 54House District: 107County Seat: GreenvilleEstablished: January 4, 1817Area: 380 square miles
POPULATION
2000 Census 17,6332010 Census 17,768Percent change (2000-2010) 0.8%
Race (2010)White (non-Hispanic) 88.9%Black or African American 6.0American Indian or Alaskan Native 0.4Asian and Pacific Islander 0.4
Hispanic origin, any race 3.1%
Age (2010)Under 18 20.5%18 to 64 64.465 and over 15.0Median age (2010) 39.7 years
Education (age 25 or over) (2010)12 or more years 88.0%16 or more years 24.7
Single female households with children < 18 (2010) 7.5%Single male households with children < 18 (2010) 4.2Children under 18 in poverty (2010) 10.6
ECONOMY 2010 2000-10 changeIncome per capita $33,406 40.8%
Labor Force 8,436 1.7%Unemployed 10.1% 129.5
Under $25,000- $100,000 Annual household $25,000 $99,999 and overincome (2010) 24.6% 58.9% 16.6%
% of total jobsJobs by Industry (2010) county stateConstruction 5.2% 0.1%Farm 8.7 0.8Information, finance, real estate 7.4 0.1Government 15.3 0.1Manufacturing and transportation 10.5 0.1Business and education 2.9 0.0Health and social services 0.0 0.0Forestry, mining, utilities 0.4 0.0Wholesale and retail trade 13.0 0.1Other services 13.2 0.1Total jobs - 0.1
REVENUES AND EXPENDITURES
Revenue Collections (millions)State sales & use tax (est. 2011) $6.9Individual income tax (2010) 6.9 State motor fuel tax (est. 2011) 0.9Local property tax (2008) 14.9
State Expenditures (millions)Education (2011) $11.1Medicaid (2011) 13.5State payroll (2011) 9.9
Number of state employees (2011) 167
LAND USE Equalized assessed value 2009 1999-09 (millions) changeFarm $ 58.5 35.1%Residential 91.8 77.7Industrial 8.8 13.1Commercial 25.4 89.8Total $184.6 58.9%
2007 1997-07 changeNumber of farms 673 9.3%Acres of farms 224,760 24.8
Foreign-owned Parcels Acresagricultural land (2010) 2 120
ELECTIONS
Primary Dem. Rep. Total2002 1,203 1,287 2,6542004 1,114 1,021 2,2372006 663 1,214 1,8772008 1,940 1,557 3,4992010 688 1,086 1,7862012 454 1,355 1,809
Registered Number Percent General voters voting voting2002 10,071 6,120 60.8%2004 11,334 7,805 68.92006 10,486 5,990 57.12008 11,756 8,034 68.32010 11,886 5,618 47.32012 12,456 7,449 59.8
Office Dem. Rep.2002 Governor 48.4% 49.8%2004 President 43.8 55.22006 Governor 40.1 52.32008 President 48.5 49.82010 Governor 33.6 60.82012 President 41.2 55.8
Stark

16 / Illinois County Data Book
Boone CountyCongressional District: 16Senate District: 35House Districts: 69, 70County Seat: BelvidereEstablished: March 4, 1837Area: 281 square miles
POPULATION
2000 Census 41,7862010 Census 54,165Percent change (2000-2010) 29.6%
Race (2010)White (non-Hispanic) 75.2%Black or African American 1.8American Indian or Alaskan Native 0.1Asian and Pacific Islander 1.3
Hispanic origin, any race 20.2%
Age (2010)Under 18 29.0%18 to 64 59.365 and over 11.7Median age (2010) 36.8 years
Education (age 25 or over) (2010)12 or more years 85.4%16 or more years 20.8
Single female households with children < 18 (2010) 8.4%Single male households with children < 18 (2010) 3.8Children under 18 in poverty (2010) 15.3
ECONOMY 2010 2000-10 changeIncome per capita $31,465 11.4%
Labor Force 26,520 20.3%Unemployed 15.9% 224.5
Under $25,000- $100,000 Annual household $25,000 $99,999 and overincome (2010) 16.9% 59.6% 23.5%
% of total jobsJobs by Industry (2010) county stateConstruction 6.5% 0.4%Farm 3.8 0.9Information, finance, real estate 9.4 0.2Government 12.0 0.3Manufacturing and transportation 27.0 0.6Business and education 9.0 0.1Health and social services 5.7 0.1Forestry, mining, utilities 0.0 0.0Wholesale and retail trade 12.3 0.2Other services 13.8 0.3Total jobs - 0.3
REVENUES AND EXPENDITURES
Revenue Collections (millions)State sales & use tax (est. 2011) $23.8Individual income tax (2010) 29.9 State motor fuel tax (est. 2011) 3.8Local property tax (2008) 82.7
State Expenditures (millions)Education (2011) $36.1Medicaid (2011) 26.9State payroll (2011) 9.9
Number of state employees (2011) 186
LAND USE Equalized assessed value 2009 1999-09 (millions) changeFarm $ 106.2 24.3%Residential 973.1 130.1Industrial 66.2 96.7Commercial 110.0 78.3Total $1,255.5 108.0%
2007 1997-07 changeNumber of farms 540 10.2%Acres of farms 137,162 -3.0
Foreign-owned Parcels Acresagricultural land (2010) 5 573
ELECTIONS
Primary Dem. Rep. Total2002 1,510 5,314 7,0722004 2,865 6,942 10,3012006 1,290 4,575 6,0662008 4,836 6,597 11,5452010 1,143 5,430 6,5962012 957 6,282 7,288
Registered Number Percent General voters voting voting2002 24,846 11,691 47.1%2004 29,480 19,572 66.42006 31,627 15,711 49.72008 32,771 22,317 68.12010 33,464 15,111 45.22012 32,411 21,509 66.4
Office Dem. Rep.2002 Governor 41.2% 54.1%2004 President 42.4 57.02006 Governor 38.8 38.02008 President 51.1 47.02010 Governor 29.5 60.72012 President 46.3 51.9

Illinois County Data Book / 17
Brown CountyCongressional District: 18Senate District: 47House District: 93County Seat: Mt. SterlingEstablished: February 1, 1839Area: 306 square miles
POPULATION
2000 Census 6,9502010 Census 6,937Percent change (2000-2010) -0.2%
Race (2010)White (non-Hispanic) 74.8%Black or African American 18.4American Indian or Alaskan Native 0.1Asian and Pacific Islander 0.3
Hispanic origin, any race 5.8%
Age (2010)Under 18 16.1%18 to 64 71.665 and over 12.4Median age (2010) 37.3 years
Education (age 25 or over) (2010)12 or more years 75.6%16 or more years 10.9
Single female households with children < 18 (2010) 8.3%Single male households with children < 18 (2010) 3.3Children under 18 in poverty (2010) 15.0
ECONOMY 2010 2000-10 changeIncome per capita $26,544 60.3%
Labor Force 3,570 28.2%Unemployed 5.3% 51.4
Under $25,000- $100,000 Annual household $25,000 $99,999 and overincome (2010) 28.8% 59.2% 12.0%
% of total jobsJobs by Industry (2010) county stateConstruction 6.7% 0.1%Farm 9.0 0.5Information, finance, real estate 0.0 0.0Government 12.0 0.1Manufacturing and transportation 13.4 0.1Business and education 0.0 0.0Health and social services 0.0 0.0Forestry, mining, utilities 0.8 0.1Wholesale and retail trade 4.1 0.0Other services 0.0 0.0Total jobs - 0.1
REVENUES AND EXPENDITURES
Revenue Collections (millions)State sales & use tax (est. 2011) $2.7Individual income tax (2010) 2.7 State motor fuel tax (est. 2011) 0.6Local property tax (2008) 4.9
State Expenditures (millions)Education (2011) $3.5Medicaid (2011) with Schuyler County 7.8State payroll (2011) 12.6
Number of state employees (2011) 214
LAND USE Equalized assessed value 2009 1999-09 (millions) changeFarm $ 21.9 -15.8%Residential 21.6 54.7Industrial 0.2 -5.5Commercial 13.4 21.8Total $57.2 11.6%
2007 1997-07 changeNumber of farms 422 11.9%Acres of farms 151,058 -0.7
Foreign-owned Parcels Acresagricultural land (2010) 0 0
ELECTIONS
Primary Dem. Rep. Total2002 495 632 1,1272004 334 342 6762006 243 374 6172008 659 788 1,4502010 258 571 8322012 168 589 757
Registered Number Percent General voters voting voting2002 3,416 2,316 67.8%2004 3,691 2,614 70.82006 3,525 2,147 60.92008 3,383 2,625 77.62010 3,489 2,227 63.82012 3,985 2,415 60.6
Office Dem. Rep.2002 Governor 42.3% 56.0%2004 President 34.6 65.02006 Governor 33.8 56.92008 President 38.4 60.12010 Governor 23.3 70.02012 President 33.3 64.0
18 / Illinois County Data Book
Bureau CountyCongressional District: 16Senate Districts: 37, 38House Districts: 73, 74, 76County Seat: PrincetonEstablished: February 28, 1837Area: 869 square miles
POPULATION
2000 Census 35,5032010 Census 34,978Percent change (2000-2010) -1.5%
Race (2010)White (non-Hispanic) 90.0%Black or African American 0.5American Indian or Alaskan Native 0.2Asian and Pacific Islander 0.6
Hispanic origin, any race 7.7%
Age (2010)Under 18 23.3%18 to 64 58.665 and over 18.1Median age (2010) 42.5 years
Education (age 25 or over) (2010)12 or more years 89.2%16 or more years 16.1
Single female households with children < 18 (2010) 8.3%Single male households with children < 18 (2010) 3.9Children under 18 in poverty (2010) 15.3
ECONOMY 2010 2000-10 changeIncome per capita $35,735 37.1%
Labor Force 19,394 1.4%Unemployed 11.5% 130.0
Under $25,000- $100,000 Annual household $25,000 $99,999 and overincome (2010) 25.7% 62.2% 12.2%
% of total jobsJobs by Industry (2010) county stateConstruction 5.2% 0.3%Farm 10.0 2.2Information, finance, real estate 8.7 0.2Government 14.0 0.3Manufacturing and transportation 18.0 0.4Business and education 3.9 0.1Health and social services 0.0 0.0Forestry, mining, utilities 0.1 0.0Wholesale and retail trade 13.1 0.2Other services 11.2 0.2Total jobs - 0.2
REVENUES AND EXPENDITURES
Revenue Collections (millions)State sales & use tax (est. 2011) $17.1Individual income tax (2010) 17.0 State motor fuel tax (est. 2011) 2.8Local property tax (2008) 45.6
State Expenditures (millions)Education (2011) $21.3Medicaid (2011) 19.3State payroll (2011) 14.3
Number of state employees (2011) 286
LAND USE Equalized assessed value 2009 1999-09 (millions) changeFarm $ 195.0 -4.2%Residential 253.8 41.4Industrial 42.4 183.6Commercial 105.8 45.7Total $597.0 26.8%
2007 1997-07 changeNumber of farms 1,189 2.9%Acres of farms 478,389 -1.2
Foreign-owned Parcels Acresagricultural land (2010) 1 10
ELECTIONS
Primary Dem. Rep. Total2002 2,335 5,531 8,0072004 3,093 2,786 6,5402006 1,647 2,798 4,9102008 4,074 3,215 7,3012010 1,332 2,685 4,0342012 1,165 4,342 5,841
Registered Number Percent General voters voting voting2002 24,322 13,889 57.1%2004 28,442 18,018 63.32006 25,226 12,349 49.02008 26,861 17,291 64.42010 23,782 12,969 54.52012 23,588 16,786 71.2
Office Dem. Rep.2002 Governor 43.4% 52.2%2004 President 44.5 54.92006 Governor 40.5 44.72008 President 51.9 46.22010 Governor 34.4 57.52012 President 48.9 49.1

Illinois County Data Book / 19
Calhoun CountyCongressional District: 13Senate District: 50House District: 100County Seat: HardinEstablished: January 10, 1825Area: 254 square miles
POPULATION
2000 Census 5,0842010 Census 5,089Percent change (2000-2010) 0.1%
Race (2010)White (non-Hispanic) 98.3%Black or African American 0.1American Indian or Alaskan Native 0.2Asian and Pacific Islander 0.2
Hispanic origin, any race 0.8%
Age (2010)Under 18 21.9%18 to 64 58.065 and over 20.1Median age (2010) 44.6 years
Education (age 25 or over) (2010)12 or more years 84.3%16 or more years 12.5
Single female households with children < 18 (2010) 5.9%Single male households with children < 18 (2010) 2.4Children under 18 in poverty (2010) 12.3
ECONOMY 2010 2000-10 changeIncome per capita $32,366 39.6%
Labor Force 2,540 0.1%Unemployed 10.9% 98.2
Under $25,000- $100,000 Annual household $25,000 $99,999 and overincome (2010) 25.9% 61.4% 12.7%
% of total jobsJobs by Industry (2010) county stateConstruction 0.0% 0.0%Farm 20.5 0.5Information, finance, real estate 0.0 0.0Government 13.6 0.0Manufacturing and transportation 3.9 0.0Business and education 0.0 0.0Health and social services 0.0 0.0Forestry, mining, utilities 0.0 0.0Wholesale and retail trade 10.9 0.0Other services 8.4 0.0Total jobs - 0.0
REVENUES AND EXPENDITURES
Revenue Collections (millions)State sales & use tax (est. 2011) $1.5Individual income tax (2010) 2.2 State motor fuel tax (est. 2011) 0.4Local property tax (2008) 4.8
State Expenditures (millions)Education (2011) $2.7Medicaid (2011) (with Jersey County) 19.1State payroll (2011) 4.3
Number of state employees (2011) 72
LAND USE Equalized assessed value 2009 1999-09 (millions) changeFarm $ 27.3 21.5%Residential 34.2 127.3Industrial 0.0 51.2Commercial 10.9 50.0Total $72.4 61.7%
2007 1997-07 changeNumber of farms 464 7.2%Acres of farms 87,938 -11.6
Foreign-owned Parcels Acresagricultural land (2010) 0 0
ELECTIONS
Primary Dem. Rep. Total2002 837 385 1,2222004 645 218 8632006 1,330 306 1,6362008 1,203 389 1,5922010 1,506 394 1,9012012 1,492 312 1,804
Registered Number Percent General voters voting voting2002 3,589 2,374 66.1%2004 3,870 2,825 73.02006 3,983 2,486 62.42008 3,952 2,773 70.22010 3,817 2,418 63.32012 3,679 2,654 72.1
Office Dem. Rep.2002 Governor 55.7% 42.5%2004 President 50.5 48.72006 Governor 53.7 42.72008 President 52.7 45.22010 Governor 41.8 53.42012 President 41.9 55.9

20 / Illinois County Data Book
Carroll CountyCongressional District: 17Senate Districts: 36, 45House Districts: 71, 89County Seat: Mt. CarrollEstablished: February 22, 1839Area: 444 square miles
POPULATION
2000 Census 16,6742010 Census 15,387Percent change (2000-2010) -7.7%
Race (2010)White (non-Hispanic) 94.9%Black or African American 0.8American Indian or Alaskan Native 0.2Asian and Pacific Islander 0.4
Hispanic origin, any race 2.8%
Age (2010)Under 18 20.5%18 to 64 58.365 and over 21.2Median age (2010) 46.5 years
Education (age 25 or over) (2010)12 or more years 86.9%16 or more years 15.9
Single female households with children < 18 (2010) 7.5%Single male households with children < 18 (2010) 3.7Children under 18 in poverty (2010) 18.4
ECONOMY 2010 2000-10 changeIncome per capita $33,529 31.1%
Labor Force 8,321 -3.5%Unemployed 11.4% 96.6
Under $25,000- $100,000 Annual household $25,000 $99,999 and overincome (2010) 25.9% 62.2% 12.0%
% of total jobsJobs by Industry (2010) county stateConstruction 5.8% 0.1%Farm 11.5 1.0Information, finance, real estate 11.2 0.1Government 12.9 0.1Manufacturing and transportation 9.3 0.1Business and education 4.2 0.0Health and social services 0.0 0.0Forestry, mining, utilities 0.0 0.0Wholesale and retail trade 14.6 0.1Other services 14.0 0.1Total jobs - 0.1
REVENUES AND EXPENDITURES
Revenue Collections (millions)State sales & use tax (est. 2011) $9.1Individual income tax (2010) 7.4 State motor fuel tax (est. 2011) 1.4Local property tax (2008) 25.6
State Expenditures (millions)Education (2011) $9.0Medicaid (2011) 10.2State payroll (2011) 7.7
Number of state employees (2011) 141
LAND USE Equalized assessed value 2009 1999-09 (millions) changeFarm $ 77.2 5.1%Residential 252.1 106.1Industrial 11.5 49.6Commercial 29.6 33.6Total $370.4 64.2%
2007 1997-07 changeNumber of farms 676 8.2%Acres of farms 265,153 9.0
Foreign-owned Parcels Acresagricultural land (2010) 4 884
ELECTIONS
Primary Dem. Rep. Total2002 624 3,491 4,1152004 879 1,757 2,7142006 517 1,976 2,4932008 1,802 1,660 3,4692010 737 1,757 2,8142012 491 2,775 3,272
Registered Number Percent General voters voting voting2002 11,878 6,153 51.8%2004 12,817 8,189 63.92006 12,734 6,142 48.22008 12,012 7,734 64.42010 11,895 5,242 44.12012 11,182 7,429 66.4
Office Dem. Rep.2002 Governor 43.6% 52.1%2004 President 43.5 55.72006 Governor 39.8 50.22008 President 51.7 46.92010 Governor 27.9 64.82012 President 49.6 48.1

Illinois County Data Book / 21
Cass CountyCongressional District: 18Senate District: 47House District: 93County Seat: VirginiaEstablished: March 3, 1837Area: 376 square miles
POPULATION
2000 Census 13,6952010 Census 13,642Percent change (2000-2010) -0.4%
Race (2010)White (non-Hispanic) 79.4%Black or African American 2.8American Indian or Alaskan Native 0.1Asian and Pacific Islander 0.3
Hispanic origin, any race 16.8%
Age (2010)Under 18 24.9%18 to 64 59.465 and over 15.7Median age (2010) 38.7 years
Education (age 25 or over) (2010)12 or more years 80.6%16 or more years 12.3
Single female households with children < 18 (2010) 10.2%Single male households with children < 18 (2010) 4.3Children under 18 in poverty (2010) 14.2
ECONOMY 2010 2000-10 changeIncome per capita $32,450 37.0%
Labor Force 7,707 8.7%Unemployed 7.9% 68.1
Under $25,000- $100,000 Annual household $25,000 $99,999 and overincome (2010) 24.8% 65.7% 9.5%
% of total jobsJobs by Industry (2010) county stateConstruction 3.9% 0.1%Farm 6.2 0.6Information, finance, real estate 7.9 0.1Government 12.4 0.1Manufacturing and transportation 35.4 0.3Business and education 2.4 0.0Health and social services 0.0 0.0Forestry, mining, utilities 0.5 0.1Wholesale and retail trade 8.8 0.1Other services 0.0 0.0Total jobs - 0.1
REVENUES AND EXPENDITURES
Revenue Collections (millions)State sales & use tax (est. 2011) $7.4Individual income tax (2010) 6.2 State motor fuel tax (est. 2011) 1.5Local property tax (2008) 11.8
State Expenditures (millions)Education (2011) $12.5Medicaid (2011) 11.3State payroll (2011) 19.8
Number of state employees (2011) 372
LAND USE Equalized assessed value 2009 1999-09 (millions) changeFarm $ 41.1 -11.2%Residential 57.3 40.8Industrial 2.0 53.0Commercial 27.6 27.2Total $128.1 16.4%
2007 1997-07 changeNumber of farms 433 3.8%Acres of farms 173,543 -9.7
Foreign-owned Parcels Acresagricultural land (2010) 1 267
ELECTIONS
Primary Dem. Rep. Total2002 1,199 1,960 3,1592004 1,245 895 2,6912006 591 700 1,2912008 1,245 943 2,1882010 2,875 708 3,5842012 366 902 1,268
Registered Number Percent General voters voting voting2002 9,023 5,629 62.4%2004 9,279 5,891 63.52006 9,037 4,631 51.22008 9,650 5,479 56.82010 9,830 3,964 40.32012 9,391 4,922 52.4
Office Dem. Rep.2002 Governor 49.3% 48.3%2004 President 43.7 55.52006 Governor 36.3 52.72008 President 49.7 48.42010 Governor 28.2 63.02012 President 42.2 55.7
22 / Illinois County Data Book
Champaign CountyCongressional Districts: 13, 15Senate Districts: 51, 52House Districts: 101, 102, 103, 104County Seat: UrbanaEstablished: February 20, 1833Area: 997 square miles
POPULATION
2000 Census 179,6692010 Census 201,081Percent change (2000-2010) 11.9%
Race (2010)White (non-Hispanic) 70.9%Black or African American 12.2American Indian or Alaskan Native 0.2Asian and Pacific Islander 9.0
Hispanic origin, any race 5.3%
Age (2010)Under 18 19.4%18 to 64 70.665 and over 10.0Median age (2010) 28.9 years
Education (age 25 or over) (2010)12 or more years 92.3%16 or more years 41.2
Single female households with children < 18 (2010) 11.7%Single male households with children < 18 (2010) 3.3Children under 18 in poverty (2010) 20.2
ECONOMY 2010 2000-10 changeIncome per capita $33,963 30.8%
Labor Force 104,379 5.4%Unemployed 9.0% 157.1
Under $25,000- $100,000 Annual household $25,000 $99,999 and overincome (2010) 29.5% 53.3% 17.2%
% of total jobsJobs by Industry (2010) county stateConstruction 3.6% 1.4%Farm 1.1 1.7Information, finance, real estate 9.4 1.3Government 30.0 4.1Manufacturing and transportation 5.8 0.8Business and education 10.5 1.0Health and social services 10.8 1.6Forestry, mining, utilities 0.0 0.0Wholesale and retail trade 12.1 1.5Other services 13.7 1.7Total jobs - 1.7
REVENUES AND EXPENDITURES
Revenue Collections (millions)State sales & use tax (est. 2011) $153.6Individual income tax (2010) 103.7 State motor fuel tax (est. 2011) 15.3Local property tax (2008) 267.7
State Expenditures (millions)Education (2011) $ 66.2Medicaid (2011) (with Ford County) 114.3State payroll (2011) 36.0
Number of state employees (2011) 712
LAND USE Equalized assessed value 2009 1999-09 (millions) changeFarm $ 242.6 1.4%Residential 2,191.1 88.0Industrial 62.6 28.6Commercial 1,242.1 103.4Total $3,738.4 81.1%
2007 1997-07 changeNumber of farms 1,389 1.3%Acres of farms 550,481 -3.0
Foreign-owned Parcels Acresagricultural land (2010) 47 8,557
ELECTIONS
Primary Dem. Rep. Total2002 9,924 18,552 28,6392004 11,945 14,111 26,1922006 7,196 14,332 22,6952008 23,160 15,521 39,1562010 7,685 14,538 22,4662012 8,075 17,884 26,212
Registered Number Percent General voters voting voting2002 99,225 54,302 54.7%2004 122,739 84,153 68.62006 113,905 53,869 47.32008 123,150 84,804 68.92010 122,441 54,818 44.82012 112,933 78,939 69.9
Office Dem. Rep.2002 Governor 44.4% 52.3%2004 President 50.4 48.42006 Governor 29.0 53.52008 President 57.8 40.32010 Governor 39.3 54.72012 President 52.1 45.1

Illinois County Data Book / 23
Christian CountyCongressional District: 13Senate District: 48House Districts: 95, 96County Seat: TaylorvilleEstablished: February 15, 1830Area: 709 square miles
POPULATION
2000 Census 35,3722010 Census 34,800Percent change (2000-2010) -1.6%
Race (2010)White (non-Hispanic) 95.8%Black or African American 1.4American Indian or Alaskan Native 0.1Asian and Pacific Islander 0.5
Hispanic origin, any race 1.4%
Age (2010)Under 18 22.3%18 to 64 60.165 and over 17.5Median age (2010) 41.6 years
Education (age 25 or over) (2010)12 or more years 85.8%16 or more years 12.1
Single female households with children < 18 (2010) 9.4%Single male households with children < 18 (2010) 5.0Children under 18 in poverty (2010) 28.6
ECONOMY 2010 2000-10 changeIncome per capita $35,771 46.6%
Labor Force 18,054 3.4%Unemployed 10.1% 87.0
Under $25,000- $100,000 Annual household $25,000 $99,999 and overincome (2010) 29.9% 60.0% 10.1%
% of total jobsJobs by Industry (2010) county stateConstruction 7.4% 0.4%Farm 5.4 1.1Information, finance, real estate 9.0 0.2Government 11.8 0.2Manufacturing and transportation 10.5 0.2Business and education 5.9 0.1Health and social services 13.5 0.3Forestry, mining, utilities 0.6 0.2Wholesale and retail trade 16.0 0.3Other services 13.1 0.2Total jobs - 0.2
REVENUES AND EXPENDITURES
Revenue Collections (millions)State sales & use tax (est. 2011) $23.7Individual income tax (2010) 16.4 State motor fuel tax (est. 2011) 4.2Local property tax (2008) 31.9
State Expenditures (millions)Education (2011) $22.4Medicaid (2011) 33.0State payroll (2011) 49.1
Number of state employees (2011) 897
LAND USE Equalized assessed value 2009 1999-09 (millions) changeFarm $ 167.9 5.7%Residential 181.0 28.1Industrial 28.4 22.7Commercial 72.4 49.7Total $449.8 21.0%
2007 1997-07 changeNumber of farms 910 11.0%Acres of farms 449,512 15.3
Foreign-owned Parcels Acresagricultural land (2010) 36 3,817
ELECTIONS
Primary Dem. Rep. Total2002 5,157 2,280 7,4502004 4,862 1,560 6,6002006 1,531 1,571 3,1272008 5,677 2,147 7,8482010 4,834 2,162 7,0682012 2,120 2,437 4,557
Registered Number Percent General voters voting voting2002 22,506 12,593 56.0%2004 23,406 15,771 67.42006 23,329 11,922 51.12008 22,088 15,253 69.12010 22,692 12,780 56.32012 21,826 14,847 68.0
Office Dem. Rep.2002 Governor 51.3% 46.4%2004 President 40.0 59.22006 Governor 35.9 52.72008 President 45.8 52.12010 Governor 30.7 60.02012 President 37.4 60.4

24 / Illinois County Data Book
Clark CountyCongressional District: 15Senate District: 55House District: 110County Seat: MarshallEstablished: March 22, 1819Area: 502 square miles
POPULATION
2000 Census 17,0082010 Census 16,335Percent change (2000-2010) -4.0%
Race (2010)White (non-Hispanic) 97.5%Black or African American 0.3American Indian or Alaskan Native 0.1Asian and Pacific Islander 0.3
Hispanic origin, any race 1.1%
Age (2010)Under 18 22.8%18 to 64 59.265 and over 18.0Median age (2010) 42.3 years
Education (age 25 or over) (2010)12 or more years 88.0%16 or more years 16.4
Single female households with children < 18 (2010) 8.3%Single male households with children < 18 (2010) 3.8Children under 18 in poverty (2010) 15.3
ECONOMY 2010 2000-10 changeIncome per capita $33,430 48.8%
Labor Force 8,166 -6.3%Unemployed 12.7% 154.0
Under $25,000- $100,000 Annual household $25,000 $99,999 and overincome (2010) 26.6% 62.1% 11.4%
% of total jobsJobs by Industry (2010) county stateConstruction 7.6% 0.2%Farm 7.9 0.7Information, finance, real estate 8.8 0.1Government 13.2 0.1Manufacturing and transportation 14.3 0.1Business and education 2.7 0.0Health and social services 6.7 0.1Forestry, mining, utilities 5.5 0.7Wholesale and retail trade 12.8 0.1Other services 14.7 0.1Total jobs - 0.1
REVENUES AND EXPENDITURES
Revenue Collections (millions)State sales & use tax (est. 2011) $8.9Individual income tax (2010) 7.6 State motor fuel tax (est. 2011) 1.6Local property tax (2008) 13.3
State Expenditures (millions)Education (2011) $14.0Medicaid (2011) (with Edgar County) 32.1State payroll (2011) 7.1
Number of state employees (2011) 141
LAND USE Equalized assessed value 2009 1999-09 (millions) changeFarm $ 41.2 -21.3%Residential 106.7 53.9Industrial 3.9 10.1Commercial 31.4 42.1Total $183.1 24.4%
2007 1997-07 changeNumber of farms 588 -2.5%Acres of farms 238,706 -11.2
Foreign-owned Parcels Acresagricultural land (2010) 0 0
ELECTIONS
Primary Dem. Rep. Total2002 1,249 3,115 4,3682004 938 1,165 2,1312006 623 1,187 1,8102008 1,996 2,203 4,1992010 596 1,677 2,2792012 605 2,599 3,224
Registered Number Percent General voters voting voting2002 11,905 6,721 56.5%2004 12,294 8,212 66.82006 12,263 5,825 47.52008 12,882 8,382 65.12010 12,914 6,236 48.32012 12,679 7,955 62.7
Office Dem. Rep.2002 Governor 41.2% 56.5%2004 President 35.9 63.52006 Governor 33.9 59.62008 President 45.1 53.22010 Governor 26.5 68.92012 President 33.0 65.4

Illinois County Data Book / 25
Clay CountyCongressional District: 15Senate District: 55House District: 109County Seat: LouisvilleEstablished: December 23, 1824Area: 469 square miles
POPULATION
2000 Census 14,5602010 Census 13,815Percent change (2000-2010) -5.1%
Race (2010)White (non-Hispanic) 97.2%Black or African American 0.3American Indian or Alaskan Native 0.2Asian and Pacific Islander 0.5
Hispanic origin, any race 1.1%
Age (2010)Under 18 22.9%18 to 64 59.265 and over 17.9Median age (2010) 42.2 years
Education (age 25 or over) (2010)12 or more years 86.2%16 or more years 13.8
Single female households with children < 18 (2010) 8.6%Single male households with children < 18 (2010) 4.4Children under 18 in poverty (2010) 21.4
ECONOMY 2010 2000-10 changeIncome per capita $32,427 49.0%
Labor Force 6,553 -8.7%Unemployed 12.4% 103.3
Under $25,000- $100,000 Annual household $25,000 $99,999 and overincome (2010) 32.7% 56.6% 10.8%
% of total jobsJobs by Industry (2010) county stateConstruction 3.6% 0.1%Farm 8.6 0.9Information, finance, real estate 8.6 0.1Government 12.4 0.1Manufacturing and transportation 19.6 0.2Business and education 1.8 0.0Health and social services 0.0 0.0Forestry, mining, utilities 8.8 1.2Wholesale and retail trade 13.3 0.1Other services 8.8 0.1Total jobs - 0.1
REVENUES AND EXPENDITURES
Revenue Collections (millions)State sales & use tax (est. 2011) $8.2Individual income tax (2010) 5.6 State motor fuel tax (est. 2011) 1.0Local property tax (2008) 9.8
State Expenditures (millions)Education (2011) $12.4Medicaid (2011) 16.5State payroll (2011) 6.9
Number of state employees (2011) 135
LAND USE Equalized assessed value 2009 1999-09 (millions) changeFarm $ 35.8 5.4%Residential 45.7 30.9Industrial 23.7 156.8Commercial 25.0 19.6Total $130.1 31.5%
2007 1997-07 changeNumber of farms 707 12.8%Acres of farms 209,834 -12.1
Foreign-owned Parcels Acresagricultural land (2010) 0 0
ELECTIONS
Primary Dem. Rep. Total2002 834 961 1,7952004 1,668 1,138 2,8342006 882 1,231 2,2742008 2,302 1,278 3,5822010 608 1,314 1,9422012 315 1,473 1,788
Registered Number Percent General voters voting voting2002 10,310 5,551 53.8%2004 9,715 6,770 69.72006 9,384 5,062 53.92008 9,665 6,577 68.02010 9,850 4,992 50.72012 10,043 6,017 59.9
Office Dem. Rep.2002 Governor 38.7% 58.4%2004 President 32.1 67.42006 Governor 32.2 59.62008 President 37.6 60.82010 Governor 23.9 71.82012 President 26.8 70.9

26 / Illinois County Data Book
Clinton CountyCongressional District: 15Senate District: 54House Districts: 107, 108County Seat: CarlyleEstablished: December 27, 1824Area: 474 square miles
POPULATION
2000 Census 35,5352010 Census 37,762Percent change (2000-2010) 6.3%
Race (2010)White (non-Hispanic) 92.1%Black or African American 3.5American Indian or Alaskan Native 0.2Asian and Pacific Islander 0.5
Hispanic origin, any race 2.8%
Age (2010)Under 18 22.7%18 to 64 62.865 and over 14.5Median age (2010) 39.3 years
Education (age 25 or over) (2010)12 or more years 85.8%16 or more years 18.9
Single female households with children < 18 (2010) 7.0%Single male households with children < 18 (2010) 3.3Children under 18 in poverty (2010) 9.2
ECONOMY 2010 2000-10 changeIncome per capita $37,178 38.1%
Labor Force 19,279 5.2%Unemployed 8.2% 115.8
Under $25,000- $100,000 Annual household $25,000 $99,999 and overincome (2010) 18.8% 63.1% 18.1%
% of total jobsJobs by Industry (2010) county stateConstruction 8.7% 0.5%Farm 6.7 1.5Information, finance, real estate 11.4 0.2Government 13.9 0.3Manufacturing and transportation 6.1 0.1Business and education 7.8 0.1Health and social services 10.8 0.2Forestry, mining, utilities 0.0 0.0Wholesale and retail trade 14.6 0.3Other services 13.1 0.2Total jobs - 0.2
REVENUES AND EXPENDITURES
Revenue Collections (millions)State sales & use tax (est. 2011) $26.2Individual income tax (2010) 20.3 State motor fuel tax (est. 2011) 3.8Local property tax (2008) 38.1
State Expenditures (millions)Education (2011) $18.7Medicaid (2011) 24.2State payroll (2011) 25.1
Number of state employees (2011) 465
LAND USE Equalized assessed value 2009 1999-09 (millions) changeFarm $ 66.1 29.7%Residential 402.6 102.4Industrial 16.4 29.7Commercial 83.8 90.6Total $568.8 85.6%
2007 1997-07 changeNumber of farms 1,031 19.9%Acres of farms 268,441 14.9
Foreign-owned Parcels Acresagricultural land (2010) 1 160
ELECTIONS
Primary Dem. Rep. Total2002 1,857 2,236 4,4332004 1,354 1,354 2,7562006 854 1,400 2,3132008 3,722 3,017 6,8512010 1,010 2,402 3,4222012 523 3,072 3,634
Registered Number Percent General voters voting voting2002 25,110 12,800 51.0%2004 26,841 17,263 64.32006 25,250 12,652 50.12008 27,262 17,492 64.22010 32,161 13,205 41.12012 23,801 16,590 69.7
Office Dem. Rep.2002 Governor 50.1% 47.8%2004 President 39.7 59.72006 Governor 39.3 54.42008 President 44.2 54.02010 Governor 28.3 66.22012 President 34.0 64.0

Illinois County Data Book / 27
Coles CountyCongressional District: 15Senate District: 55House District: 110County Seat: CharlestonEstablished: December 25, 1830Area: 508 square miles
POPULATION
2000 Census 53,1962010 Census 53,873Percent change (2000-2010) 1.3%
Race (2010)White (non-Hispanic) 91.6%Black or African American 3.8American Indian or Alaskan Native 0.1Asian and Pacific Islander 1.0
Hispanic origin, any race 2.1%
Age (2010)Under 18 18.5%18 to 64 67.865 and over 13.8Median age (2010) 31.6 years
Education (age 25 or over) (2010)12 or more years 89.3%16 or more years 23.3
Single female households with children < 18 (2010) 10.8%Single male households with children < 18 (2010) 4.1Children under 18 in poverty (2010) 20.6
ECONOMY 2010 2000-10 changeIncome per capita $31,696 37.0%
Labor Force 27,167 -3.5%Unemployed 9.8% 133.3
Under $25,000- $100,000 Annual household $25,000 $99,999 and overincome (2010) 34.5% 53.9% 11.7%
% of total jobsJobs by Industry (2010) county stateConstruction 4.1% 0.4%Farm 2.1 0.8Information, finance, real estate 8.0 0.3Government 21.2 0.7Manufacturing and transportation 10.4 0.4Business and education 11.6 0.3Health and social services 12.8 0.5Forestry, mining, utilities 0.9 0.5Wholesale and retail trade 12.2 0.4Other services 12.5 0.4Total jobs - 0.4
REVENUES AND EXPENDITURES
Revenue Collections (millions)State sales & use tax (est. 2011) $42.7Individual income tax (2010) 22.4 State motor fuel tax (est. 2011) 5.4Local property tax (2008) 50.2
State Expenditures (millions)Education (2011) $25.0Medicaid (2011) 45.3State payroll (2011) 9.7
Number of state employees (2011) 237
LAND USE Equalized assessed value 2009 1999-09 (millions) changeFarm $ 90.9 -21.4%Residential 355.9 39.8Industrial 22.5 -5.3Commercial 146.8 24.5Total $616.0 20.4%
2007 1997-07 changeNumber of farms 729 7.0%Acres of farms 254,869 -0.8
Foreign-owned Parcels Acresagricultural land (2010) 4 599
ELECTIONS
Primary Dem. Rep. Total2002 3,047 4,530 7,5772004 2,441 2,847 5,3272006 1,015 5,716 6,7452008 5,225 4,931 10,1802010 2,545 5,969 8,9572012 1,646 6,202 7,853
Registered Number Percent General voters voting voting2002 30,541 15,406 50.4%2004 39,561 22,911 57.92006 30,632 14,447 47.22008 32,867 23,287 70.92010 31,489 15,087 47.92012 32,119 21,532 67.0
Office Dem. Rep.2002 Governor 42.8% 54.6%2004 President 42.0 57.12006 Governor 30.7 54.32008 President 50.8 47.62010 Governor 27.6 65.52012 President 43.4 54.5
28 / Illinois County Data Book
Cook CountyCongressional Districts: 1-11Senate Districts: 1-20, 22-30, 39-41House Districts: 1-40, 43-45, 47, 48,
51-59, 77, 78, 80, 82County Seat: ChicagoEstablished: January 15, 1831Area: 946 square miles
POPULATION
2000 Census 5,376,7412010 Census 5,194,675Percent change (2000-2010) -3.4%
Race (2010)White (non-Hispanic) 43.9%Black or African American 24.4American Indian or Alaskan Native 0.1Asian and Pacific Islander 6.2
Hispanic origin, any race 24.0%
Age (2010)Under 18 23.7%18 to 64 64.365 and over 11.9Median age (2010) 35.3 years
Education (age 25 or over) (2010)12 or more years 83.2%16 or more years 33.2
Single female households with children < 18 (2010) 12.3%Single male households with children < 18 (2010) 3.2Children under 18 in poverty (2010) 22.4
ECONOMY 2010 2000-10 changeIncome per capita $45,311 32.0%
Labor Force 2,582,931 -5.3%Unemployed 10.8% 125.0
Under $25,000- $100,000 Annual household $25,000 $99,999 and overincome (2010) 23.7% 53.3% 23.0%
% of total jobsJobs by Industry (2010) county stateConstruction 3.7% 37.4%Farm 0.0 0.6Information, finance, real estate 14.3 51.2Government 10.7 37.8Manufacturing and transportation 11.1 40.5Business and education 21.6 53.9Health and social services 11.9 46.5Forestry, mining, utilities 0.2 12.9Wholesale and retail trade 11.8 37.5Other services 14.7 45.7Total jobs - 44.0
REVENUES AND EXPENDITURES
Revenue Collections (millions)State sales & use tax (est. 2011) $3,536.4Individual income tax (2010) 3,614.0 State motor fuel tax (est. 2011) 384.3Local property tax (2008) 10,718.8
State Expenditures (millions)Education (2011) $2,848.8Medicaid (2011) 6,147.4State payroll (2011) 1,008.7
Number of state employees (2011) 16,772
LAND USE Equalized assessed value 2009 1999-09 (millions) changeFarm $ 5.0 -59.0%Residential 116,989.7 195.0Industrial 19,091.2 34.9Commercial 57,232.3 80.7Total $193,318.2 126.1%
2007 1997-07 changeNumber of farms 184 -22.4%Acres of farms 8,198 -79.2
Foreign-owned Parcels Acresagricultural land (2010) 5 315
ELECTIONS
Primary Dem. Rep. Total2002 791,605 189,246 987,6782004 764,163 145,447 921,0862006 619,309 138,182 762,2732008 1,091,008 180,309 1,274,5692010 596,147 161,878 761,6262012 440,873 200,750 644,701
Registered Number Percent General voters voting voting2002 2,730,878 1,423,403 52.1%2004 2,794,260 2,088,727 74.82006 2,710,118 1,350,915 49.82008 2,933,502 2,162,240 73.72010 2,704,993 1,424,959 52.72012 2,781,182 2,030,563 73.0
Office Dem. Rep.2002 Governor 65.9% 31.8%2004 President 70.2 29.12006 Governor 65.2 26.42008 President 76.2 22.82010 Governor 64.4 28.62012 President 74.0 24.6

Illinois County Data Book / 29
Crawford CountyCongressional District: 15Senate District: 55House District: 110County Seat: RobinsonEstablished: December 31, 1816Area: 444 square miles
POPULATION
2000 Census 20,4522010 Census 19,817Percent change (2000-2010) -3.1%
Race (2010)White (non-Hispanic) 91.9%Black or African American 4.7American Indian or Alaskan Native 0.2Asian and Pacific Islander 0.5
Hispanic origin, any race 1.8%
Age (2010)Under 18 20.5%18 to 64 62.765 and over 16.8Median age (2010) 41.7 years
Education (age 25 or over) (2010)12 or more years 86.5%16 or more years 13.5
Single female households with children < 18 (2010) 7.7%Single male households with children < 18 (2010) 3.9Children under 18 in poverty (2010) 27.0
ECONOMY 2010 2000-10 changeIncome per capita $35,061 56.3%
Labor Force 9,451 -1.4%Unemployed 10.0% 75.4
Under $25,000- $100,000 Annual household $25,000 $99,999 and overincome (2010) 27.3% 60.0% 12.7%
% of total jobsJobs by Industry (2010) county stateConstruction 6.5% 0.2%Farm 5.4 0.7Information, finance, real estate 7.5 0.1Government 18.8 0.2Manufacturing and transportation 21.1 0.3Business and education 3.0 0.0Health and social services 0.0 0.0Forestry, mining, utilities 5.5 1.0Wholesale and retail trade 12.6 0.1Other services 10.7 0.1Total jobs - 0.1
REVENUES AND EXPENDITURES
Revenue Collections (millions)State sales & use tax (est. 2011) $12.0Individual income tax (2010) 9.3 State motor fuel tax (est. 2011) 2.2Local property tax (2008) 22.4
State Expenditures (millions)Education (2011) $ 9.9Medicaid (2011) (with Jasper County) 19.0State payroll (2011) 16.6
Number of state employees (2011) 285
LAND USE Equalized assessed value 2009 1999-09 (millions) changeFarm $ 39.5 -15.5%Residential 98.6 33.3Industrial 180.3 131.8Commercial 35.6 66.0Total $354.0 61.0%
2007 1997-07 changeNumber of farms 615 30.0%Acres of farms 205,356 -1.7
Foreign-owned Parcels Acresagricultural land (2010) 1 60
ELECTIONS
Primary Dem. Rep. Total2002 1,762 2,470 4,3762004 1,003 1,190 2,1932006 758 1,351 2,1462008 2,072 2,361 4,4572010 585 1,690 2,2862012 588 2,671 3,259
Registered Number Percent General voters voting voting2002 15,408 7,636 49.6%2004 14,427 9,391 65.12006 13,392 7,185 53.72008 14,197 9,246 65.12010 14,133 7,020 49.72012 14,232 8,675 61.0
Office Dem. Rep.2002 Governor 46.7% 51.1%2004 President 34.2 65.22006 Governor 27.0 66.12008 President 42.5 55.52010 Governor 24.5 70.42012 President 33.2 64.9

30 / Illinois County Data Book
Cumberland CountyCongressional District: 15Senate District: 55House District: 110County Seat: ToledoEstablished: March 2, 1843Area: 346 square miles
POPULATION
2000 Census 11,2532010 Census 11,048Percent change (2000-2010) -1.8%
Race (2010)White (non-Hispanic) 97.9%Black or African American 0.3American Indian or Alaskan Native 0.2Asian and Pacific Islander 0.2
Hispanic origin, any race 0.7%
Age (2010)Under 18 23.5%18 to 64 59.865 and over 16.6Median age (2010) 40.9 years
Education (age 25 or over) (2010)12 or more years 88.1%16 or more years 13.0
Single female households with children < 18 (2010) 6.6%Single male households with children < 18 (2010) 4.5Children under 18 in poverty (2010) 19.4
ECONOMY 2010 2000-10 changeIncome per capita $33,444 42.5%
Labor Force 5,462 -6.4%Unemployed 10.8% 125.0
Under $25,000- $100,000 Annual household $25,000 $99,999 and overincome (2010) 29.8% 60.1% 10.1%
% of total jobsJobs by Industry (2010) county stateConstruction 5.2% 0.1%Farm 12.4 0.8Information, finance, real estate 0.0 0.0Government 10.7 0.1Manufacturing and transportation 12.3 0.1Business and education 3.3 0.0Health and social services 11.7 0.1Forestry, mining, utilities 0.0 0.0Wholesale and retail trade 15.1 0.1Other services 6.5 0.0Total jobs - 0.1
REVENUES AND EXPENDITURES
Revenue Collections (millions)State sales & use tax (est. 2011) $3.0Individual income tax (2010) 4.3 State motor fuel tax (est. 2011) 0.6Local property tax (2008) 8.4
State Expenditures (millions)Education (2011) $ 8.7Medicaid (2011) (with Effingham County) 33.4State payroll (2011) 5.0
Number of state employees (2011) 101
LAND USE Equalized assessed value 2009 1999-09 (millions) changeFarm $ 35.4 -7.3%Residential 58.2 49.6Industrial 5.2 80.7Commercial 10.6 55.2Total $109.3 26.0%
2007 1997-07 changeNumber of farms 654 19.6%Acres of farms 144,981 -14.6
Foreign-owned Parcels Acresagricultural land (2010) 1 17
ELECTIONS
Primary Dem. Rep. Total2002 1,614 1,218 2,8322004 1,088 857 1,9452006 923 828 1,7522008 1,246 1,366 2,6162010 748 1,334 2,2722012 427 1,583 2,026
Registered Number Percent General voters voting voting2002 7,947 4,299 54.1%2004 7,888 5,482 69.52006 8,783 4,064 46.32008 9,065 5,390 59.52010 7,708 4,393 57.02012 7,926 5,360 67.6
Office Dem. Rep.2002 Governor 37.9% 58.4%2004 President 34.4 64.62006 Governor 30.2 56.32008 President 38.6 59.32010 Governor 22.6 69.62012 President 31.0 66.3

Illinois County Data Book / 31
DeKalb CountyCongressional Districts: 14, 16Senate Districts: 35, 45House Districts: 70, 90County Seat: SycamoreEstablished: March 4, 1837Area: 634 square miles
POPULATION
2000 Census 88,9692010 Census 105,160Percent change (2000-2010) 18.2%
Race (2010)White (non-Hispanic) 79.7%Black or African American 6.3American Indian or Alaskan Native 0.1Asian and Pacific Islander 2.3
Hispanic origin, any race 10.1%
Age (2010)Under 18 22.3%18 to 64 67.865 and over 9.8Median age (2010) 29.3 years
Education (age 25 or over) (2010)12 or more years 90.7%16 or more years 28.0
Single female households with children < 18 (2010) 10.7%Single male households with children < 18 (2010) 3.6Children under 18 in poverty (2010) 13.2
ECONOMY 2010 2000-10 changeIncome per capita $30,725 16.0%
Labor Force 59,257 15.6%Unemployed 9.8% 172.2
Under $25,000- $100,000 Annual household $25,000 $99,999 and overincome (2010) 22.1% 57.8% 20.1%
% of total jobsJobs by Industry (2010) county stateConstruction 4.7% 0.8%Farm 2.2 1.5Information, finance, real estate 9.1 0.5Government 26.4 1.5Manufacturing and transportation 10.5 0.6Business and education 9.5 0.4Health and social services 10.1 0.6Forestry, mining, utilities 0.6 0.5Wholesale and retail trade 11.0 0.6Other services 13.1 0.7Total jobs - 0.7
REVENUES AND EXPENDITURES
Revenue Collections (millions)State sales & use tax (est. 2011) $120.6Individual income tax (2010) 50.0 State motor fuel tax (est. 2011) 30.3Local property tax (2008) 181.8
State Expenditures (millions)Education (2011) $47.3Medicaid (2011) 46.7State payroll (2011) 20.1
Number of state employees (2011) 378
LAND USE Equalized assessed value 2009 1999-09 (millions) changeFarm $ 214.2 9.6%Residential 1,537.5 111.3Industrial 93.5 83.8Commercial 501.1 99.4Total $2,346.3 91.5%
2007 1997-07 changeNumber of farms 930 12.3%Acres of farms 370,772 0.7
Foreign-owned Parcels Acresagricultural land (2010) 29 6,388
ELECTIONS
Primary Dem. Rep. Total2002 5,273 10,253 16,7032004 5,391 9,302 15,1392006 3,491 8,278 12,4392008 12,798 10,291 23,6122010 4,764 9,034 14,0242012 1,983 10,426 12,534
Registered Number Percent General voters voting voting2002 48,745 24,800 50.9%2004 55,380 40,995 74.02006 54,766 26,336 48.12008 60,718 45,178 74.42010 57,102 29,197 51.12012 57,915 41,428 71.5
Office Dem. Rep.2002 Governor 41.9% 53.6%2004 President 47.3 51.72006 Governor 34.3 46.52008 President 57.5 40.82010 Governor 37.8 52.02012 President 51.6 46.1

32 / Illinois County Data Book
DeWitt CountyCongressional Districts: 13, 15Senate District: 47House District: 94County Seat: ClintonEstablished: March 1, 1839Area: 398 square miles
POPULATION
2000 Census 16,7982010 Census 16,561Percent change (2000-2010) -1.4%
Race (2010)White (non-Hispanic) 95.7%Black or African American 0.5American Indian or Alaskan Native 0.1Asian and Pacific Islander 0.4
Hispanic origin, any race 2.1%
Age (2010)Under 18 23.1%18 to 64 60.265 and over 16.7Median age (2010) 41.7 years
Education (age 25 or over) (2010)12 or more years 90.3%16 or more years 15.7
Single female households with children < 18 (2010) 8.6%Single male households with children < 18 (2010) 4.2Children under 18 in poverty (2010) 12.2
ECONOMY 2010 2000-10 changeIncome per capita $36,338 38.9%
Labor Force 8,971 -2.1%Unemployed 9.0% 63.6
Under $25,000- $100,000 Annual household $25,000 $99,999 and overincome (2010) 23.6% 62.9% 13.5%
% of total jobsJobs by Industry (2010) county stateConstruction 7.0% 0.2%Farm 6.2 0.6Information, finance, real estate 6.9 0.1Government 14.5 0.1Manufacturing and transportation 7.3 0.1Business and education 6.3 0.0Health and social services 0.0 0.0Forestry, mining, utilities 0.5 0.1Wholesale and retail trade 18.6 0.1Other services 12.6 0.1Total jobs - 0.1
REVENUES AND EXPENDITURES
Revenue Collections (millions)State sales & use tax (est. 2011) $11.1Individual income tax (2010) 8.8 State motor fuel tax (est. 2011) 2.6Local property tax (2008) 28.6
State Expenditures (millions)Education (2011) $ 5.4Medicaid (2011) (with Logan & Menard Counties) 48.4State payroll (2011) 4.8
Number of state employees (2011) 118
LAND USE Equalized assessed value 2009 1999-09 (millions) changeFarm $ 90.9 -4.3%Residential 120.1 34.4Industrial 250.6 -50.5Commercial 54.7 117.4Total $516.2 -27.8%
2007 1997-07 changeNumber of farms 508 9.7%Acres of farms 198,680 -3.0
Foreign-owned Parcels Acresagricultural land (2010) 160 22,637
ELECTIONS
Primary Dem. Rep. Total2002 768 3,652 4,4342004 1,604 3,423 5,6672006 541 2,028 2,5692008 1,748 3,094 4,8852010 565 3,245 3,8562012 604 3,876 4,624
Registered Number Percent General voters voting voting2002 11,987 5,583 46.6%2004 13,055 7,853 60.22006 12,732 6,034 47.42008 11,468 7,886 68.82010 11,733 5,815 49.62012 11,628 7,414 63.8
Office Dem. Rep.2002 Governor 43.7% 53.7%2004 President 36.4 63.12006 Governor 32.3 50.32008 President 42.4 55.72010 Governor 23.6 68.22012 President 35.4 62.3

Illinois County Data Book / 33
Douglas CountyCongressional District: 15Senate District: 51House District: 102County Seat: TuscolaEstablished: February 8, 1859Area: 417 square miles
POPULATION
2000 Census 19,9222010 Census 19,980Percent change (2000-2010) 0.3%
Race (2010)White (non-Hispanic) 92.2%Black or African American 0.3American Indian or Alaskan Native 0.2Asian and Pacific Islander 0.4
Hispanic origin, any race 6.1%
Age (2010)Under 18 25.9%18 to 64 58.365 and over 15.8Median age (2010) 38.7 years
Education (age 25 or over) (2010)12 or more years 81.7%16 or more years 14.9
Single female households with children < 18 (2010) 7.1%Single male households with children < 18 (2010) 3.1Children under 18 in poverty (2010) 14.0
ECONOMY 2010 2000-10 changeIncome per capita $34,321 35.4%
Labor Force 10,198 -1.3%Unemployed 9.5% 137.5
Under $25,000- $100,000 Annual household $25,000 $99,999 and overincome (2010) 22.7% 65.0% 12.3%
% of total jobsJobs by Industry (2010) county stateConstruction 5.6% 0.2%Farm 5.5 0.8Information, finance, real estate 7.6 0.1Government 9.7 0.1Manufacturing and transportation 28.2 0.4Business and education 1.9 0.0Health and social services 0.0 0.0Forestry, mining, utilities 0.0 0.0Wholesale and retail trade 16.3 0.2Other services 12.1 0.1Total jobs - 0.2
REVENUES AND EXPENDITURES
Revenue Collections (millions)State sales & use tax (est. 2011) $14.1Individual income tax (2010) 9.9 State motor fuel tax (est. 2011) 1.6Local property tax (2008) 25.4
State Expenditures (millions)Education (2011) $ 9.1Medicaid (2011) 13.8State payroll (2011) 4.4
Number of state employees (2011) 98
LAND USE Equalized assessed value 2009 1999-09 (millions) changeFarm $ 91.4 -17.3%Residential 166.2 66.1Industrial 16.0 35.4Commercial 66.2 35.5Total $339.8 25.3%
2007 1997-07 changeNumber of farms 657 4.3%Acres of farms 261,513 4.8
Foreign-owned Parcels Acresagricultural land (2010) 19 3,628
ELECTIONS
Primary Dem. Rep. Total2002 962 2,784 3,7462004 877 2,299 3,2022006 404 3,855 4,2712008 1,748 2,444 4,2222010 482 3,681 4,1842012 344 3,381 3,731
Registered Number Percent General voters voting voting2002 12,422 6,231 50.2%2004 12,747 8,597 67.42006 12,494 6,089 48.72008 12,193 8,443 69.22010 11,980 6,545 54.62012 11,801 7,961 67.5
Office Dem. Rep.2002 Governor 38.8% 58.5%2004 President 32.4 66.82006 Governor 26.5 60.42008 President 38.6 59.92010 Governor 19.3 74.12012 President 30.8 67.5

34 / Illinois County Data Book
DuPage CountyCongressional Districts: 3, 5, 6, 8, 11, 14Senate Districts: 23-25, 28, 39, 41-43House Districts: 41, 42, 45-49, 56,
77, 81, 82, 84, 85County Seat: WheatonEstablished: February 9, 1839Area: 334 square miles
POPULATION
2000 Census 904,1612010 Census 916,924Percent change (2000-2010) 1.4%
Race (2010)White (non-Hispanic) 70.5%Black or African American 4.5American Indian or Alaskan Native 0.1Asian and Pacific Islander 10.0
Hispanic origin, any race 13.3%
Age (2010)Under 18 24.8%18 to 64 63.665 and over 11.6Median age (2010) 38.2 years
Education (age 25 or over) (2010)12 or more years 92.0%16 or more years 45.3
Single female households with children < 18 (2010) 6.9%Single male households with children < 18 (2010) 2.2Children under 18 in poverty (2010) 7.1
ECONOMY 2010 2000-10 changeIncome per capita $52,854 11.9%
Labor Force 519,907 -1.8%Unemployed 8.5% 157.6
Under $25,000- $100,000 Annual household $25,000 $99,999 and overincome (2010) 11.9% 51.8% 36.4%
% of total jobsJobs by Industry (2010) county stateConstruction 4.4% 9.5%Farm 0.0 0.3Information, finance, real estate 13.3 10.3Government 7.6 5.8Manufacturing and transportation 11.3 8.9Business and education 24.1 13.0Health and social services 9.1 7.7Forestry, mining, utilities 0.5 6.0Wholesale and retail trade 17.5 12.1Other services 12.2 8.3Total jobs - 9.5
REVENUES AND EXPENDITURES
Revenue Collections (millions)State sales & use tax (est. 2011) $1,029.4Individual income tax (2010) 912.0 State motor fuel tax (est. 2011) 147.9Local property tax (2008) 2,364.3
State Expenditures (millions)Education (2011) $201.4Medicaid (2011) 414.6State payroll (2011) 134.2
Number of state employees (2011) 2,094
LAND USE Equalized assessed value 2009 1999-09 (millions) changeFarm $ 1.8 -52.8%Residential 32,988.4 105.4Industrial 3,152.1 67.6Commercial 7,368.3 60.2Total $43,510.7 93.0%
2007 1997-07 changeNumber of farms 73 -21.5%Acres of farms 7,948 -53.5
Foreign-owned Parcels Acresagricultural land (2010) 10 269
ELECTIONS
Primary Dem. Rep. Total2002 55,077 126,767 185,8742004 63,951 86,993 154,1732006 44,268 98,230 149,3992008 132,816 109,358 244,0322010 41,082 94,780 136,7502012 30,321 106,686 138,281
Registered Number Percent General voters voting voting2002 491,151 273,268 55.6%2004 530,732 404,117 76.12006 529,726 268,988 50.82008 551,280 420,397 76.32010 558,929 288,680 51.62012 560,718 403,312 71.9
Office Dem. Rep.2002 Governor 33.9% 63.3%2004 President 44.8 54.42006 Governor 38.7 50.52008 President 54.7 43.92010 Governor 38.6 54.32012 President 49.7 48.6

Illinois County Data Book / 35
Edgar CountyCongressional District: 15Senate Districts: 51, 55House Districts: 102, 110County Seat: ParisEstablished: January 3, 1823Area: 624 square miles
POPULATION
2000 Census 19,7042010 Census 18,576Percent change (2000-2010) -5.7%
Race (2010)White (non-Hispanic) 97.7%Black or African American 0.3American Indian or Alaskan Native 0.1Asian and Pacific Islander 0.2
Hispanic origin, any race 1.0%
Age (2010)Under 18 22.2%18 to 64 59.165 and over 18.7Median age (2010) 43.2 years
Education (age 25 or over) (2010)12 or more years 88.4%16 or more years 16.8
Single female households with children < 18 (2010) 9.1%Single male households with children < 18 (2010) 3.9Children under 18 in poverty (2010) 19.2
ECONOMY 2010 2000-10 changeIncome per capita $33,040 33.9%
Labor Force 10,237 3.7%Unemployed 11.0% 144.4
Under $25,000- $100,000 Annual household $25,000 $99,999 and overincome (2010) 29.7% 58.9% 11.3%
% of total jobsJobs by Industry (2010) county stateConstruction 4.0% 0.1%Farm 8.0 0.9Information, finance, real estate 10.3 0.1Government 14.5 0.1Manufacturing and transportation 21.4 0.2Business and education 6.0 0.0Health and social services 0.0 0.0Forestry, mining, utilities 0.0 0.0Wholesale and retail trade 9.4 0.1Other services 10.6 0.1Total jobs - 0.1
REVENUES AND EXPENDITURES
Revenue Collections (millions)State sales & use tax (est. 2011) $10.0Individual income tax (2010) 8.1 State motor fuel tax (est. 2011) 1.2Local property tax (2008) 18.2
State Expenditures (millions)Education (2011) $12.8Medicaid (2011) (with Clark County) 32.1State payroll (2011) 12.7
Number of state employees (2011) 214
LAND USE Equalized assessed value 2009 1999-09 (millions) changeFarm $ 120.3 -11.0%Residential 95.3 54.3Industrial 16.7 43.9Commercial 24.1 100.8Total $256.4 16.2%
2007 1997-07 changeNumber of farms 670 -12.5%Acres of farms 352,535 0.0
Foreign-owned Parcels Acresagricultural land (2010) 2 254
ELECTIONS
Primary Dem. Rep. Total2002 1,366 3,539 4,9192004 898 1,708 2,6092006 728 1,392 2,1202008 1,555 3,209 4,7732010 671 2,331 3,0042012 393 2,504 2,899
Registered Number Percent General voters voting voting2002 12,476 8,155 65.4%2004 12,730 8,772 68.92006 12,205 6,499 53.22008 13,004 8,345 64.22010 13,238 7,143 54.02012 13,228 7,869 59.5
Office Dem. Rep.2002 Governor 41.7% 55.3%2004 President 36.7 62.42006 Governor 33.2 56.72008 President 45.3 53.32010 Governor 23.3 70.92012 President 32.8 65.6
36 / Illinois County Data Book
Edwards CountyCongressional District: 15Senate District: 55House District: 109County Seat: AlbionEstablished: November 28, 1814Area: 222 square miles
POPULATION
2000 Census 6,9712010 Census 6,721Percent change (2000-2010) -3.6%
Race (2010)White (non-Hispanic) 97.5%Black or African American 0.4American Indian or Alaskan Native 0.1Asian and Pacific Islander 0.3
Hispanic origin, any race 0.9%
Age (2010)Under 18 22.9%18 to 64 59.465 and over 17.7Median age (2010) 42.7 years
Education (age 25 or over) (2010)12 or more years 89.0%16 or more years 13.1
Single female households with children < 18 (2010) 6.6%Single male households with children < 18 (2010) 3.8Children under 18 in poverty (2010) 17.1
ECONOMY 2010 2000-10 changeIncome per capita $30,054 41.3%
Labor Force 3,161 -13.3%Unemployed 9.5% 79.2
Under $25,000- $100,000 Annual household $25,000 $99,999 and overincome (2010) 31.3% 59.5% 9.2%
% of total jobsJobs by Industry (2010) county stateConstruction 4.8% 0.1%Farm 8.0 0.4Information, finance, real estate 0.0 0.0Government 8.2 0.0Manufacturing and transportation 0.0 0.0Business and education 2.4 0.0Health and social services 3.5 0.0Forestry, mining, utilities 0.0 0.0Wholesale and retail trade 13.1 0.1Other services 6.6 0.0Total jobs - 0.1
REVENUES AND EXPENDITURES
Revenue Collections (millions)State sales & use tax (est. 2011) $3.4Individual income tax (2010) 3.0 State motor fuel tax (est. 2011) 0.6Local property tax (2008) 4.5
State Expenditures (millions)Education (2011) $ 5.1Medicaid (2011) (with Wabash County) 14.4State payroll (2011) 2.9
Number of state employees (2011) 53
LAND USE Equalized assessed value 2009 1999-09 (millions) changeFarm $ 15.4 -22.2%Residential 22.2 16.2Industrial 10.7 65.3Commercial 6.7 15.2Total $55.0 7.4%
2007 1997-07 changeNumber of farms 365 10.9%Acres of farms 116,690 3.3
Foreign-owned Parcels Acresagricultural land (2010) 1 30
ELECTIONS
Primary Dem. Rep. Total2002 319 1,417 1,7362004 294 1,186 1,4802006 250 826 1,0762008 607 1,032 1,6412010 158 780 9432012 157 973 1,130
Registered Number Percent General voters voting voting2002 5,243 2,888 55.1%2004 5,372 3,487 64.92006 4,660 2,741 58.82008 4,576 3,418 74.72010 4,622 2,296 49.72012 4,536 3,291 72.6
Office Dem. Rep.2002 Governor 27.9% 70.5%2004 President 27.6 71.72006 Governor 22.5 69.72008 President 34.0 63.82010 Governor 16.8 79.82012 President 23.4 74.5

Illinois County Data Book / 37
Effingham CountyCongressional District: 15Senate Districts: 54, 55House Districts: 107, 109County Seat: EffinghamEstablished: February 15, 1831Area: 479 square miles
POPULATION
2000 Census 34,2642010 Census 34,242Percent change (2000-2010) -0.1%
Race (2010)White (non-Hispanic) 96.8%Black or African American 0.2American Indian or Alaskan Native 0.1Asian and Pacific Islander 0.4
Hispanic origin, any race 1.7%
Age (2010)Under 18 24.7%18 to 64 60.265 and over 15.2Median age (2010) 39.2 years
Education (age 25 or over) (2010)12 or more years 89.4%16 or more years 20.0
Single female households with children < 18 (2010) 8.2%Single male households with children < 18 (2010) 3.7Children under 18 in poverty (2010) 14.1
ECONOMY 2010 2000-10 changeIncome per capita $36,131 42.6%
Labor Force 18,284 -0.3%Unemployed 8.4% 86.7
Under $25,000- $100,000 Annual household $25,000 $99,999 and overincome (2010) 24.9% 59.9% 15.1%
% of total jobsJobs by Industry (2010) county stateConstruction 5.7% 0.5%Farm 4.3 1.4Information, finance, real estate 7.6 0.2Government 7.9 0.2Manufacturing and transportation 18.5 0.5Business and education 4.4 0.1Health and social services 13.9 0.4Forestry, mining, utilities 1.5 0.6Wholesale and retail trade 18.0 0.5Other services 15.2 0.4Total jobs - 0.3
REVENUES AND EXPENDITURES
Revenue Collections (millions)State sales & use tax (est. 2011) $44.2Individual income tax (2010) 20.7 State motor fuel tax (est. 2011) 6.7Local property tax (2008) 37.0
State Expenditures (millions)Education (2011) $21.8Medicaid (2011) (with Cumberland County) 33.4State payroll (2011) 18.8
Number of state employees (2011) 349
LAND USE Equalized assessed value 2009 1999-09 (millions) changeFarm $ 72.8 6.1%Residential 333.5 62.6Industrial 33.3 88.2Commercial 168.2 39.3Total $607.9 47.5%
2007 1997-07 changeNumber of farms 1,150 11.1%Acres of farms 242,009 -5.8
Foreign-owned Parcels Acresagricultural land (2010) 0 0
ELECTIONS
Primary Dem. Rep. Total2002 2,359 3,375 5,8352004 3,389 2,724 6,3452006 1,808 2,130 3,9682008 3,467 4,135 7,9362010 1,564 3,872 5,6662012 1,733 4,735 6,468
Registered Number Percent General voters voting voting2002 20,533 13,155 64.1%2004 22,043 16,812 76.32006 22,306 12,829 57.52008 22,353 16,999 76.02010 22,838 13,202 57.82012 23,115 16,825 72.8
Office Dem. Rep.2002 Governor 31.3% 64.4%2004 President 27.0 72.32006 Governor 23.8 66.02008 President 31.3 67.32010 Governor 18.3 75.82012 President 23.2 75.2

38 / Illinois County Data Book
Fayette CountyCongressional District: 15Senate District: 54House District: 107County Seat: VandaliaEstablished: February 14, 1821Area: 717 square miles
POPULATION
2000 Census 21,8022010 Census 22,140Percent change (2000-2010) 1.6%
Race (2010)White (non-Hispanic) 93.0%Black or African American 4.4American Indian or Alaskan Native 0.1Asian and Pacific Islander 0.2
Hispanic origin, any race 1.4%
Age (2010)Under 18 22.5%18 to 64 61.465 and over 16.2Median age (2010) 39.9 years
Education (age 25 or over) (2010)12 or more years 82.9%16 or more years 14.3
Single female households with children < 18 (2010) 8.4%Single male households with children < 18 (2010) 4.4Children under 18 in poverty (2010) 22.6
ECONOMY 2010 2000-10 changeIncome per capita $26,836 41.0%
Labor Force 10,407 1.6%Unemployed 11.9% 88.9
Under $25,000- $100,000 Annual household $25,000 $99,999 and overincome (2010) 30.3% 57.4% 12.3%
% of total jobsJobs by Industry (2010) county stateConstruction 5.7% 0.2%Farm 11.2 1.3Information, finance, real estate 6.7 0.1Government 15.0 0.2Manufacturing and transportation 8.4 0.1Business and education 5.7 0.0Health and social services 0.0 0.0Forestry, mining, utilities 3.5 0.6Wholesale and retail trade 15.8 0.2Other services 13.0 0.1Total jobs - 0.1
REVENUES AND EXPENDITURES
Revenue Collections (millions)State sales & use tax (est. 2011) $13.7Individual income tax (2010) 8.4 State motor fuel tax (est. 2011) 1.8Local property tax (2008) 15.2
State Expenditures (millions)Education (2011) $16.1Medicaid (2011) 21.2State payroll (2011) 25.8
Number of state employees (2011) 430
LAND USE Equalized assessed value 2009 1999-09 (millions) changeFarm $ 57.9 1.3%Residential 76.7 39.5Industrial 21.4 53.3Commercial 31.0 71.8Total $187.0 29.7%
2007 1997-07 changeNumber of farms 1,132 1.2%Acres of farms 303,258 -9.0
Foreign-owned Parcels Acresagricultural land (2010) 3 110
ELECTIONS
Primary Dem. Rep. Total2002 1,811 2,027 3,9132004 1,591 1,648 3,2532006 1,091 1,742 2,9262008 2,328 2,430 4,7702010 1,028 1,830 2,8912012 473 2,060 2,533
Registered Number Percent General voters voting voting2002 14,628 8,232 56.3%2004 14,659 9,828 67.02006 14,902 7,990 53.62008 15,589 9,815 63.02010 15,406 6,891 44.72012 15,072 9,086 60.3
Office Dem. Rep.2002 Governor 46.3% 50.6%2004 President 37.4 61.62006 Governor 29.4 62.32008 President 41.0 56.82010 Governor 23.6 69.02012 President 31.8 66.3
Illinois County Data Book / 39
Ford CountyCongressional Districts: 15, 16Senate District: 53House District: 106County Seat: PaxtonEstablished: February 17, 1859Area: 486 square miles
POPULATION
2000 Census 14,2412010 Census 14,081Percent change (2000-2010) -1.1%
Race (2010)White (non-Hispanic) 96.0%Black or African American 0.6American Indian or Alaskan Native 0.2Asian and Pacific Islander 0.3
Hispanic origin, any race 2.1%
Age (2010)Under 18 23.8%18 to 64 57.565 and over 18.7Median age (2010) 42.4 years
Education (age 25 or over) (2010)12 or more years 87.3%16 or more years 17.8
Single female households with children < 18 (2010) 8.9%Single male households with children < 18 (2010) 3.8Children under 18 in poverty (2010) 8.3
ECONOMY 2010 2000-10 changeIncome per capita $41,320 46.3%
Labor Force 6,915 -5.5%Unemployed 10.4% 173.7
Under $25,000- $100,000 Annual household $25,000 $99,999 and overincome (2010) 22.9% 63.0% 14.1%
% of total jobsJobs by Industry (2010) county stateConstruction 5.8% 0.1%Farm 7.1 0.7Information, finance, real estate 8.4 0.1Government 13.1 0.1Manufacturing and transportation 8.1 0.1Business and education 9.1 0.1Health and social services 0.0 0.0Forestry, mining, utilities 0.0 0.0Wholesale and retail trade 15.6 0.1Other services 11.4 0.1Total jobs - 0.1
REVENUES AND EXPENDITURES
Revenue Collections (millions)State sales & use tax (est. 2011) $8.0Individual income tax (2010) 7.3 State motor fuel tax (est. 2011) 1.7Local property tax (2008) 17.9
State Expenditures (millions)Education (2011) $ 9.5Medicaid (2011) (with Champaign County) 114.3State payroll (2011) 3.8
Number of state employees (2011) 85
LAND USE Equalized assessed value 2009 1999-09 (millions) changeFarm $ 62.9 -28.9%Residential 105.5 50.0Industrial 18.3 31.3Commercial 41.8 204.3Total $228.6 22.6%
2007 1997-07 changeNumber of farms 524 -4.7%Acres of farms 270,720 -14.0
Foreign-owned Parcels Acresagricultural land (2010) 10 6,623
ELECTIONS
Primary Dem. Rep. Total2002 450 2,483 2,9332004 453 1,398 1,8512006 232 2,619 2,8512008 967 2,261 3,2372010 307 2,522 2,8342012 167 2,757 2,924
Registered Number Percent General voters voting voting2002 8,642 4,897 56.7%2004 9,508 6,533 68.72006 9,976 4,491 45.02008 9,059 6,435 71.02010 8,908 4,699 52.82012 8,875 6,069 68.4
Office Dem. Rep.2002 Governor 33.7% 63.4%2004 President 29.5 69.62006 Governor 24.2 62.92008 President 34.9 63.92010 Governor 19.5 74.32012 President 27.6 70.4

40 / Illinois County Data Book
Franklin CountyCongressional District: 12Senate District: 59House District: 117County Seat: BentonEstablished: January 2, 1818Area: 412 square miles
POPULATION
2000 Census 39,0182010 Census 39,561Percent change (2000-2010) 1.4%
Race (2010)White (non-Hispanic) 96.9%Black or African American 0.3American Indian or Alaskan Native 0.2Asian and Pacific Islander 0.3
Hispanic origin, any race 1.2%
Age (2010)Under 18 22.7%18 to 64 59.065 and over 18.4Median age (2010) 41.8 years
Education (age 25 or over) (2010)12 or more years 83.8%16 or more years 12.4
Single female households with children < 18 (2010) 9.9%Single male households with children < 18 (2010) 4.5Children under 18 in poverty (2010) 30.5
ECONOMY 2010 2000-10 changeIncome per capita $28,987 44.2%
Labor Force 18,027 2.7%Unemployed 13.0% 85.7
Under $25,000- $100,000 Annual household $25,000 $99,999 and overincome (2010) 34.9% 57.9% 7.2%
% of total jobsJobs by Industry (2010) county stateConstruction 6.0% 0.3%Farm 5.1 0.9Information, finance, real estate 8.9 0.1Government 15.8 0.3Manufacturing and transportation 10.9 0.2Business and education 5.5 0.1Health and social services 10.6 0.2Forestry, mining, utilities 2.3 0.6Wholesale and retail trade 15.5 0.2Other services 15.7 0.2Total jobs - 0.2
REVENUES AND EXPENDITURES
Revenue Collections (millions)State sales & use tax (est. 2011) $23.0Individual income tax (2010) 14.7 State motor fuel tax (est. 2011) 4.0Local property tax (2008) 22.8
State Expenditures (millions)Education (2011) $36.6Medicaid (2011) 43.7State payroll (2011) 30.1
Number of state employees (2011) 561
LAND USE Equalized assessed value 2009 1999-09 (millions) changeFarm $ 42.3 43.1%Residential 160.2 55.5Industrial 22.2 69.3Commercial 68.0 77.9Total $292.7 59.1%
2007 1997-07 changeNumber of farms 785 19.3%Acres of farms 207,877 15.8
Foreign-owned Parcels Acresagricultural land (2010) 5 5,918
ELECTIONS
Primary Dem. Rep. Total2002 6,457 2,382 8,8392004 7,617 1,488 9,1052006 6,535 1,870 8,4352008 8,995 2,711 11,7202010 6,839 1,894 8,7522012 5,583 3,165 8,759
Registered Number Percent General voters voting voting2002 29,655 14,907 50.3%2004 30,215 19,535 64.72006 30,466 13,812 45.32008 28,247 18,970 67.22010 29,513 13,334 45.22012 29,925 18,184 60.8
Office Dem. Rep.2002 Governor 58.3% 40.0%2004 President 45.6 53.72006 Governor 50.9 32.02008 President 47.6 50.42010 Governor 43.5 48.52012 President 40.5 57.3

Illinois County Data Book / 41
Fulton CountyCongressional District: 17Senate Districts: 46, 47House Districts: 91, 93County Seat: LewistownEstablished: January 28, 1823Area: 866 square miles
POPULATION
2000 Census 38,2502010 Census 37,069Percent change (2000-2010) -3.1%
Race (2010)White (non-Hispanic) 92.8%Black or African American 3.4American Indian or Alaskan Native 0.2Asian and Pacific Islander 0.3
Hispanic origin, any race 2.4%
Age (2010)Under 18 20.9%18 to 64 61.065 and over 18.1Median age (2010) 41.9 years
Education (age 25 or over) (2010)12 or more years 83.6%16 or more years 13.4
Single female households with children < 18 (2010) 8.9%Single male households with children < 18 (2010) 4.7Children under 18 in poverty (2010) 22.2
ECONOMY 2010 2000-10 changeIncome per capita $32,075 43.5%
Labor Force 18,586 5.2%Unemployed 11.8% 110.7
Under $25,000- $100,000 Annual household $25,000 $99,999 and overincome (2010) 27.9% 63.0% 9.0%
% of total jobsJobs by Industry (2010) county stateConstruction 5.7% 0.2%Farm 7.1 1.2Information, finance, real estate 8.2 0.1Government 19.8 0.3Manufacturing and transportation 4.6 0.1Business and education 3.1 0.0Health and social services 16.1 0.3Forestry, mining, utilities 0.4 0.1Wholesale and retail trade 15.9 0.2Other services 15.5 0.2Total jobs - 0.2
REVENUES AND EXPENDITURES
Revenue Collections (millions)State sales & use tax (est. 2011) $18.6Individual income tax (2010) 15.0 State motor fuel tax (est. 2011) 2.7Local property tax (2008) 31.4
State Expenditures (millions)Education (2011) $20.6Medicaid (2011) 36.8State payroll (2011) 27.6
Number of state employees (2011) 454
LAND USE Equalized assessed value 2009 1999-09 (millions) changeFarm $ 86.1 -10.7%Residential 225.2 46.6Industrial 25.7 20.2Commercial 59.2 77.5Total $396.2 30.0%
2007 1997-07 changeNumber of farms 1,005 -8.7%Acres of farms 385,302 -9.3
Foreign-owned Parcels Acresagricultural land (2010) 1 782
ELECTIONS
Primary Dem. Rep. Total2002 4,194 2,186 6,3922004 6,792 2,103 9,1682006 6,147 1,794 8,1772008 6,458 2,567 9,0332010 3,759 2,004 5,7722012 2,351 2,627 5,166
Registered Number Percent General voters voting voting2002 25,195 13,291 52.8%2004 26,504 17,155 64.72006 26,591 13,257 49.92008 26,982 16,489 61.12010 24,904 11,833 47.52012 25,496 15,495 60.8
Office Dem. Rep.2002 Governor 55.0% 41.7%2004 President 53.3 45.92006 Governor 45.8 38.22008 President 59.6 38.32010 Governor 40.8 49.72012 President 54.2 43.2

42 / Illinois County Data Book
Gallatin CountyCongressional District: 15Senate District: 59House District: 118County Seat: ShawneetownEstablished: September 14, 1812Area: 324 square miles
POPULATION
2000 Census 6,4452010 Census 5,589Percent change (2000-2010) -13.3%
Race (2010)White (non-Hispanic) 97.1%Black or African American 0.2American Indian or Alaskan Native 0.3Asian and Pacific Islander 0.1
Hispanic origin, any race 1.2%
Age (2010)Under 18 21.2%18 to 64 58.365 and over 20.5Median age (2010) 44.4 years
Education (age 25 or over) (2010)12 or more years 77.7%16 or more years 10.1
Single female households with children < 18 (2010) 7.8%Single male households with children < 18 (2010) 4.1Children under 18 in poverty (2010) 22.9
ECONOMY 2010 2000-10 changeIncome per capita $33,573 62.3%
Labor Force 2,666 -7.2%Unemployed 10.1% 62.9
Under $25,000- $100,000 Annual household $25,000 $99,999 and overincome (2010) 33.9% 57.3% 8.8%
% of total jobsJobs by Industry (2010) county stateConstruction 6.5% 0.0%Farm 13.8 0.4Information, finance, real estate 0.0 0.0Government 14.3 0.0Manufacturing and transportation 14.7 0.0Business and education 3.3 0.0Health and social services 7.6 0.0Forestry, mining, utilities 3.0 0.1Wholesale and retail trade 8.1 0.0Other services 7.5 0.0Total jobs - 0.0
REVENUES AND EXPENDITURES
Revenue Collections (millions)State sales & use tax (est. 2011) $1.3Individual income tax (2010) 2.6 State motor fuel tax (est. 2011) 0.2Local property tax (2008) 3.4
State Expenditures (millions)Education (2011) $4.2Medicaid (2011) (with Saline County) 41.5State payroll (2011) 2.5
Number of state employees (2011) 49
LAND USE Equalized assessed value 2009 1999-09 (millions) changeFarm $ 17.9 -36.9%Residential 14.1 10.6Industrial 10.0 85.5Commercial 5.9 63.2Total $48.0 -4.4%
2007 1997-07 changeNumber of farms 210 -11.8%Acres of farms 185,753 -2.8
Foreign-owned Parcels Acresagricultural land (2010) 0 0
ELECTIONS
Primary Dem. Rep. Total2002 2,972 289 3,2622004 2,101 239 2,3402006 2,274 249 2,5242008 1,844 358 2,2032010 1,719 272 1,9912012 1,633 316 1,949
Registered Number Percent General voters voting voting2002 4,710 3,269 69.4%2004 4,542 3,343 73.62006 4,483 2,653 59.22008 4,316 2,948 68.32010 4,234 2,299 54.32012 4,052 2,648 65.4
Office Dem. Rep.2002 Governor 61.6% 36.1%2004 President 48.8 50.22006 Governor 62.1 30.62008 President 55.5 42.42010 Governor 40.1 52.12012 President 40.0 58.0

Illinois County Data Book / 43
Greene CountyCongressional District: 13Senate District: 50House District: 100County Seat: CarrolltonEstablished: January 20, 1821Area: 543 square miles
POPULATION
2000 Census 14,7612010 Census 13,886Percent change (2000-2010) -5.9%
Race (2010)White (non-Hispanic) 97.3%Black or African American 0.9American Indian or Alaskan Native 0.1Asian and Pacific Islander 0.1
Hispanic origin, any race 0.8%
Age (2010)Under 18 23.0%18 to 64 59.865 and over 17.2Median age (2010) 41.6 years
Education (age 25 or over) (2010)12 or more years 85.2%16 or more years 13.5
Single female households with children < 18 (2010) 7.4%Single male households with children < 18 (2010) 4.4Children under 18 in poverty (2010) 22.1
ECONOMY 2010 2000-10 changeIncome per capita $29,953 54.6%
Labor Force 6,899 -0.6%Unemployed 9.8% 81.5
Under $25,000- $100,000 Annual household $25,000 $99,999 and overincome (2010) 30.2% 62.2% 7.7%
% of total jobsJobs by Industry (2010) county stateConstruction 6.1% 0.1%Farm 12.4 0.8Information, finance, real estate 9.5 0.1Government 16.1 0.1Manufacturing and transportation 4.8 0.0Business and education 5.1 0.0Health and social services 0.0 0.0Forestry, mining, utilities 0.0 0.0Wholesale and retail trade 17.9 0.1Other services 12.2 0.1Total jobs - 0.1
REVENUES AND EXPENDITURES
Revenue Collections (millions)State sales & use tax (est. 2011) $5.3Individual income tax (2010) 5.5 State motor fuel tax (est. 2011) 1.0Local property tax (2008) 11.1
State Expenditures (millions)Education (2011) $10.5Medicaid (2011) 11.0State payroll (2011) 13.8
Number of state employees (2011) 263
LAND USE Equalized assessed value 2009 1999-09 (millions) changeFarm $ 66.0 -20.2%Residential 59.8 80.3Industrial 2.1 -5.3Commercial 23.0 38.8Total $151.0 12.1%
2007 1997-07 changeNumber of farms 600 -16.7%Acres of farms 273,088 -16.6
Foreign-owned Parcels Acresagricultural land (2010) 3 4,859
ELECTIONS
Primary Dem. Rep. Total2002 2,178 1,227 3,5062004 1,955 749 2,7042006 1,780 1,004 2,7842008 1,596 1,212 2,8112010 1,068 1,150 2,2232012 1,236 1,564 2,800
Registered Number Percent General voters voting voting2002 8,530 5,087 59.6%2004 10,084 6,311 62.62006 9,411 5,023 53.42008 9,446 5,881 62.32010 8,753 4,540 51.92012 9,018 5,737 63.6
Office Dem. Rep.2002 Governor 49.7% 47.4%2004 President 40.5 58.72006 Governor 41.9 51.12008 President 45.1 52.62010 Governor 29.7 62.42012 President 36.0 61.4

44 / Illinois County Data Book
Grundy CountyCongressional District: 16Senate Districts: 38, 40House Districts: 75, 79County Seat: MorrisEstablished: February 17, 1841Area: 420 square miles
POPULATION
2000 Census 37,5352010 Census 50,063Percent change (2000-2010) 33.4%
Race (2010)White (non-Hispanic) 88.9%Black or African American 1.2American Indian or Alaskan Native 0.1Asian and Pacific Islander 0.7
Hispanic origin, any race 8.2%
Age (2010)Under 18 27.3%18 to 64 61.665 and over 11.1Median age (2010) 36.1 years
Education (age 25 or over) (2010)12 or more years 90.7%16 or more years 18.3
Single female households with children < 18 (2010) 8.2%Single male households with children < 18 (2010) 4.0Children under 18 in poverty (2010) 8.0
ECONOMY 2010 2000-10 changeIncome per capita $33,260 12.8%
Labor Force 27,830 31.9%Unemployed 12.4% 134.0
Under $25,000- $100,000 Annual household $25,000 $99,999 and overincome (2010) 14.1% 61.8% 24.1%
% of total jobsJobs by Industry (2010) county stateConstruction 9.1% 0.6%Farm 2.0 0.5Information, finance, real estate 10.5 0.3Government 12.0 0.3Manufacturing and transportation 11.7 0.3Business and education 8.8 0.2Health and social services 10.2 0.3Forestry, mining, utilities 0.3 0.1Wholesale and retail trade 12.2 0.3Other services 14.3 0.3Total jobs - 0.3
REVENUES AND EXPENDITURES
Revenue Collections (millions)State sales & use tax (est. 2011) $92.7Individual income tax (2010) 30.2 State motor fuel tax (est. 2011) 12.2Local property tax (2008) 121.7
State Expenditures (millions)Education (2011) $15.8Medicaid (2011) (with LaSalle County) 95.6State payroll (2011) 16.4
Number of state employees (2011) 313
LAND USE Equalized assessed value 2009 1999-09 (millions) changeFarm $ 81.6 -6.4%Residential 971.3 149.0Industrial 762.7 29.4Commercial 319.4 243.4Total $2,135.0 84.1%
2007 1997-07 changeNumber of farms 450 -2.8%Acres of farms 215,474 7.0
Foreign-owned Parcels Acresagricultural land (2010) 7 5,010
ELECTIONS
Primary Dem. Rep. Total2002 2,464 3,564 6,1372004 3,084 4,124 7,7972006 3,339 4,070 8,2702008 5,830 4,673 10,6352010 2,396 4,138 6,9522012 1,987 4,906 6,932
Registered Number Percent General voters voting voting2002 24,689 13,719 55.6%2004 28,571 19,926 69.72006 28,508 14,580 51.12008 30,234 22,356 73.92010 29,708 16,973 57.12012 30,820 21,419 69.5
Office Dem. Rep.2002 Governor 41.7% 54.9%2004 President 42.7 56.52006 Governor 42.2 43.52008 President 49.9 48.22010 Governor 34.9 54.92012 President 44.5 53.4

Illinois County Data Book / 45
Hamilton CountyCongressional District: 15Senate District: 59House Districts: 117, 118County Seat: McLeansboroEstablished: February 8, 1821Area: 435 square miles
POPULATION
2000 Census 8,6212010 Census 8,457Percent change (2000-2010) -1.9%
Race (2010)White (non-Hispanic) 97.4%Black or African American 0.4American Indian or Alaskan Native 0.1Asian and Pacific Islander 0.2
Hispanic origin, any race 1.2%
Age (2010)Under 18 22.8%18 to 64 57.465 and over 19.8Median age (2010) 43.1 years
Education (age 25 or over) (2010)12 or more years 80.8%16 or more years 12.7
Single female households with children < 18 (2010) 7.8%Single male households with children < 18 (2010) 4.0Children under 18 in poverty (2010) 21.5
ECONOMY 2010 2000-10 changeIncome per capita $31,976 61.1%
Labor Force 4,298 7.7%Unemployed 9.5% 86.3
Under $25,000- $100,000 Annual household $25,000 $99,999 and overincome (2010) 32.3% 57.7% 10.0%
% of total jobsJobs by Industry (2010) county stateConstruction 5.4% 0.1%Farm 18.4 0.8Information, finance, real estate 7.5 0.0Government 19.4 0.1Manufacturing and transportation 6.3 0.0Business and education 0.4 0.0Health and social services 6.0 0.0Forestry, mining, utilities 8.7 0.5Wholesale and retail trade 10.3 0.0Other services 11.7 0.0Total jobs - 0.0
REVENUES AND EXPENDITURES
Revenue Collections (millions)State sales & use tax (est. 2011) $2.8Individual income tax (2010) 3.4 State motor fuel tax (est. 2011) 0.5Local property tax (2008) 5.3
State Expenditures (millions)Education (2011) $7.1Medicaid (2011) 8.6State payroll (2011) 6.6
Number of state employees (2011) 122
LAND USE Equalized assessed value 2009 1999-09 (millions) changeFarm $ 24.9 -12.0%Residential 22.0 52.3Industrial 9.1 76.6Commercial 6.3 87.0Total $62.3 21.5%
2007 1997-07 changeNumber of farms 685 21.7%Acres of farms 219,873 2.4
Foreign-owned Parcels Acresagricultural land (2010) 7 5,370
ELECTIONS
Primary Dem. Rep. Total2002 1,738 739 2,4772004 1,874 757 2,6312006 1,292 1,349 2,6422008 2,266 997 3,2662010 1,071 775 1,8492012 1,214 957 2,171
Registered Number Percent General voters voting voting2002 6,371 4,399 69.0%2004 6,583 4,630 70.32006 6,459 4,040 62.52008 6,432 4,452 69.22010 5,853 3,644 62.32012 5,746 4,055 70.6
Office Dem. Rep.2002 Governor 51.3% 47.0%2004 President 40.2 58.82006 Governor 50.2 37.62008 President 42.1 55.22010 Governor 34.6 58.92012 President 32.2 65.1

46 / Illinois County Data Book
Hancock CountyCongressional District: 18Senate District: 47House District: 94County Seat: CarthageEstablished: January 13, 1825Area: 795 square miles
POPULATION
2000 Census 20,1212010 Census 19,104Percent change (2000-2010) -5.1%
Race (2010)White (non-Hispanic) 97.4%Black or African American 0.3American Indian or Alaskan Native 0.2Asian and Pacific Islander 0.3
Hispanic origin, any race 1.0%
Age (2010)Under 18 22.0%18 to 64 58.265 and over 19.8Median age (2010) 44.6 years
Education (age 25 or over) (2010)12 or more years 90.1%16 or more years 19.1
Single female households with children < 18 (2010) 6.7%Single male households with children < 18 (2010) 3.5Children under 18 in poverty (2010) 17.8
ECONOMY 2010 2000-10 changeIncome per capita $32,992 36.7%
Labor Force 9,500 -12.5%Unemployed 11.8% 156.5
Under $25,000- $100,000 Annual household $25,000 $99,999 and overincome (2010) 28.6% 61.0% 10.4%
% of total jobsJobs by Industry (2010) county stateConstruction 6.3% 0.2%Farm 13.2 1.3Information, finance, real estate 9.3 0.1Government 16.7 0.1Manufacturing and transportation 8.0 0.1Business and education 7.1 0.0Health and social services 0.0 0.0Forestry, mining, utilities 0.5 0.1Wholesale and retail trade 13.9 0.1Other services 6.7 0.1Total jobs - 0.1
REVENUES AND EXPENDITURES
Revenue Collections (millions)State sales & use tax (est. 2011) $6.7Individual income tax (2010) 8.2 State motor fuel tax (est. 2011) 1.7Local property tax (2008) 20.5
State Expenditures (millions)Education (2011) $15.0Medicaid (2011) 12.4State payroll (2011) 6.0
Number of state employees (2011) 117
LAND USE Equalized assessed value 2009 1999-09 (millions) changeFarm $ 104.5 -3.7%Residential 119.3 59.5Industrial 2.5 34.3Commercial 45.9 63.6Total $272.1 27.7%
2007 1997-07 changeNumber of farms 1,063 -6.5%Acres of farms 392,898 -10.4
Foreign-owned Parcels Acresagricultural land (2010) 2 1,084
ELECTIONS
Primary Dem. Rep. Total2002 1,445 2,529 4,2062004 1,092 2,170 3,2622006 1,036 2,363 3,7502008 2,490 2,745 5,3622010 620 1,987 2,6102012 437 3,835 4,272
Registered Number Percent General voters voting voting2002 13,399 8,327 62.1%2004 13,713 10,354 75.52006 13,363 7,785 58.32008 13,674 9,570 70.02010 13,461 6,943 51.62012 12,529 9,275 74.0
Office Dem. Rep.2002 Governor 37.2% 59.8%2004 President 40.2 59.02006 Governor 40.0 46.52008 President 43.7 54.52010 Governor 23.9 70.12012 President 40.1 57.9

Illinois County Data Book / 47
Hardin CountyCongressional District: 15Senate District: 59House District: 118County Seat: ElizabethtownEstablished: March 2, 1839Area: 178 square miles
POPULATION
2000 Census 4,8002010 Census 4,320Percent change (2000-2010) -10.0%
Race (2010)White (non-Hispanic) 96.6%Black or African American 0.3American Indian or Alaskan Native 0.6Asian and Pacific Islander 0.6
Hispanic origin, any race 1.3%
Age (2010)Under 18 20.3%18 to 64 59.465 and over 20.3Median age (2010) 46.3 years
Education (age 25 or over) (2010)12 or more years 77.0%16 or more years 11.0
Single female households with children < 18 (2010) 7.9%Single male households with children < 18 (2010) 3.4Children under 18 in poverty (2010) 37.4
ECONOMY 2010 2000-10 changeIncome per capita $27,949 52.3%
Labor Force 1,789 -8.2%Unemployed 11.7% 74.6
Under $25,000- $100,000 Annual household $25,000 $99,999 and overincome (2010) 45.2% 49.7% 5.1%
% of total jobsJobs by Industry (2010) county stateConstruction 0.0% 0.0%Farm 7.6 0.2Information, finance, real estate 0.0 0.0Government 14.8 0.0Manufacturing and transportation 5.6 0.0Business and education 4.8 0.0Health and social services 19.4 0.0Forestry, mining, utilities 7.8 0.2Wholesale and retail trade 7.8 0.0Other services 7.0 0.0Total jobs - 0.0
REVENUES AND EXPENDITURES
Revenue Collections (millions)State sales & use tax (est. 2011) $1.1Individual income tax (2010) 1.4 State motor fuel tax (est. 2011) 0.2Local property tax (2008) 1.7
State Expenditures (millions)Education (2011) $3.5Medicaid (2011) (with Pope County) 8.7State payroll (2011) 4.4
Number of state employees (2011) 81
LAND USE Equalized assessed value 2009 1999-09 (millions) changeFarm $ 7.4 50.0%Residential 15.0 64.6Industrial 2.5 -13.3Commercial 2.3 71.2Total $27.3 48.7%
2007 1997-07 changeNumber of farms 145 -15.7%Acres of farms 34,733 -11.5
Foreign-owned Parcels Acresagricultural land (2010) 2 650
ELECTIONS
Primary Dem. Rep. Total2002 898 895 1,7932004 827 639 1,4682006 953 637 1,5902008 1,036 714 1,7502010 741 696 1,4372012 576 719 1,295
Registered Number Percent General voters voting voting2002 3,793 2,488 65.6%2004 3,958 2,664 67.32006 3,959 2,275 57.52008 3,910 2,332 59.62010 3,833 2,194 57.22012 3,528 2,421 68.6
Office Dem. Rep.2002 Governor 53.6% 44.6%2004 President 37.9 61.62006 Governor 59.3 33.72008 President 39.6 59.02010 Governor 32.3 61.92012 President 31.8 65.9

48 / Illinois County Data Book
Henderson CountyCongressional District: 17Senate District: 47House District: 94County Seat: OquawkaEstablished: January 20, 1841Area: 379 square miles
POPULATION
2000 Census 8,2132010 Census 7,331Percent change (2000-2010) -10.7%
Race (2010)White (non-Hispanic) 97.3%Black or African American 0.2American Indian or Alaskan Native 0.2Asian and Pacific Islander 0.3
Hispanic origin, any race 1.1%
Age (2010)Under 18 20.4%18 to 64 58.765 and over 20.9Median age (2010) 47.2 years
Education (age 25 or over) (2010)12 or more years 87.2%16 or more years 14.9
Single female households with children < 18 (2010) 6.8%Single male households with children < 18 (2010) 3.7Children under 18 in poverty (2010) 13.3
ECONOMY 2010 2000-10 changeIncome per capita $32,519 38.5%
Labor Force 3,824 -10.8%Unemployed 10.1% 140.5
Under $25,000- $100,000 Annual household $25,000 $99,999 and overincome (2010) 28.6% 60.5% 10.9%
% of total jobsJobs by Industry (2010) county stateConstruction 0.0% 0.0%Farm 15.3 0.5Information, finance, real estate 0.0 0.0Government 15.9 0.0Manufacturing and transportation 4.9 0.0Business and education 2.9 0.0Health and social services 7.3 0.0Forestry, mining, utilities 0.0 0.0Wholesale and retail trade 15.5 0.0Other services 10.1 0.0Total jobs - 0.0
REVENUES AND EXPENDITURES
Revenue Collections (millions)State sales & use tax (est. 2011) $1.9Individual income tax (2010) 3.1 State motor fuel tax (est. 2011) 0.4Local property tax (2008) 8.6
State Expenditures (millions)Education (2011) $4.1Medicaid (2011) (with Warren County) 17.1State payroll (2011) 2.2
Number of state employees (2011) 42
LAND USE Equalized assessed value 2009 1999-09 (millions) changeFarm $ 49.9 -8.4%Residential 42.9 43.9Industrial 5.5 45.7Commercial 11.6 49.9Total $109.9 14.7%
2007 1997-07 changeNumber of farms 400 -3.4%Acres of farms 170,443 -15.7
Foreign-owned Parcels Acresagricultural land (2010) 1 240
ELECTIONS
Primary Dem. Rep. Total2002 648 988 1,6362004 467 485 9522006 862 609 1,5132008 1,126 793 1,9192010 592 847 1,4472012 236 726 962
Registered Number Percent General voters voting voting2002 5,414 3,366 62.2%2004 5,412 4,197 77.52006 5,297 3,031 57.22008 5,527 3,875 70.12010 5,231 3,574 68.32012 5,019 3,639 72.5
Office Dem. Rep.2002 Governor 47.1% 49.6%2004 President 54.6 44.72006 Governor 54.7 39.92008 President 58.1 40.42010 Governor 37.9 55.12012 President 55.4 43.2

Illinois County Data Book / 49
Henry CountyCongressional District: 17Senate Districts: 36, 37House Districts: 71, 74County Seat: CambridgeEstablished: January 13, 1825Area: 823 square miles
POPULATION
2000 Census 51,0202010 Census 50,486Percent change (2000-2010) -1.0%
Race (2010)White (non-Hispanic) 92.1%Black or African American 1.5American Indian or Alaskan Native 0.1Asian and Pacific Islander 0.4
Hispanic origin, any race 4.8%
Age (2010)Under 18 24.0%18 to 64 59.065 and over 17.1Median age (2010) 41.8 years
Education (age 25 or over) (2010)12 or more years 87.9%16 or more years 20.6
Single female households with children < 18 (2010) 8.3%Single male households with children < 18 (2010) 3.5Children under 18 in poverty (2010) 16.9
ECONOMY 2010 2000-10 changeIncome per capita $35,419 36.2%
Labor Force 27,277 -0.1%Unemployed 9.1% 85.7
Under $25,000- $100,000 Annual household $25,000 $99,999 and overincome (2010) 22.5% 62.5% 15.0%
% of total jobsJobs by Industry (2010) county stateConstruction 7.6% 0.5%Farm 6.6 1.8Information, finance, real estate 11.1 0.3Government 16.9 0.4Manufacturing and transportation 11.0 0.3Business and education 7.5 0.1Health and social services 7.3 0.2Forestry, mining, utilities 0.1 0.0Wholesale and retail trade 15.7 0.3Other services 14.6 0.3Total jobs - 0.3
REVENUES AND EXPENDITURES
Revenue Collections (millions)State sales & use tax (est. 2011) $29.0Individual income tax (2010) 27.5 State motor fuel tax (est. 2011) 5.3Local property tax (2008) 60.4
State Expenditures (millions)Education (2011) $33.2Medicaid (2011) (with Stark County) 32.8State payroll (2011) 21.4
Number of state employees (2011) 386
LAND USE Equalized assessed value 2009 1999-09 (millions) changeFarm $ 151.2 24.3%Residential 486.6 34.0Industrial 32.5 45.8Commercial 140.8 173.1Total $811.1 45.2%
2007 1997-07 changeNumber of farms 1,473 9.6%Acres of farms 489,903 7.3
Foreign-owned Parcels Acresagricultural land (2010) 10 2,690
ELECTIONS
Primary Dem. Rep. Total2002 2,733 4,317 7,3482004 2,896 2,896 6,2852006 1,924 3,338 5,8502008 5,968 4,685 10,7622010 2,230 5,754 8,4382012 1,546 4,528 6,170
Registered Number Percent General voters voting voting2002 35,931 17,135 47.7%2004 38,100 25,378 66.62006 36,633 18,295 49.92008 37,351 24,995 66.92010 35,322 18,444 52.22012 36,186 24,594 68.0
Office Dem. Rep.2002 Governor 43.0% 54.5%2004 President 47.1 52.32006 Governor 45.5 46.72008 President 53.2 45.42010 Governor 33.1 60.32012 President 50.7 47.6
50 / Illinois County Data Book
Iroquois CountyCongressional District: 16Senate District: 53House District: 106County Seat: WatsekaEstablished: February 26, 1833Area: 1,117 square miles
POPULATION
2000 Census 31,3342010 Census 29,718Percent change (2000-2010) -5.2%
Race (2010)White (non-Hispanic) 92.4%Black or African American 0.8American Indian or Alaskan Native 0.1Asian and Pacific Islander 0.3
Hispanic origin, any race 5.3%
Age (2010)Under 18 23.6%18 to 64 57.565 and over 18.9Median age (2010) 43.4 years
Education (age 25 or over) (2010)12 or more years 87.2%16 or more years 13.7
Single female households with children < 18 (2010) 7.5%Single male households with children < 18 (2010) 3.6Children under 18 in poverty (2010) 14.1
ECONOMY 2010 2000-10 changeIncome per capita $35,790 47.0%
Labor Force 16,960 3.3%Unemployed 10.1% 129.5
Under $25,000- $100,000 Annual household $25,000 $99,999 and overincome (2010) 22.3% 64.9% 12.8%
% of total jobsJobs by Industry (2010) county stateConstruction 6.9% 0.3%Farm 11.4 2.0Information, finance, real estate 10.5 0.2Government 11.3 0.2Manufacturing and transportation 6.4 0.1Business and education 2.6 0.0Health and social services 0.0 0.0Forestry, mining, utilities 1.2 0.3Wholesale and retail trade 16.2 0.2Other services 11.6 0.2Total jobs - 0.2
REVENUES AND EXPENDITURES
Revenue Collections (millions)State sales & use tax (est. 2011) $19.8Individual income tax (2010) 14.5 State motor fuel tax (est. 2011) 2.7Local property tax (2008) 39.2
State Expenditures (millions)Education (2011) $22.7Medicaid (2011) 23.4State payroll (2011) 12.9
Number of state employees (2011) 274
LAND USE Equalized assessed value 2009 1999-09 (millions) changeFarm $ 117.7 -34.0%Residential 251.4 48.5Industrial 17.5 20.6Commercial 55.4 18.5Total $442.0 8.1%
2007 1997-07 changeNumber of farms 1,471 5.6%Acres of farms 677,803 1.6
Foreign-owned Parcels Acresagricultural land (2010) 9 2,490
ELECTIONS
Primary Dem. Rep. Total2002 1,022 5,097 6,2072004 992 3,009 4,2322006 625 5,498 6,2082008 1,854 4,262 6,1712010 718 6,687 7,6742012 337 5,528 5,865
Registered Number Percent General voters voting voting2002 18,998 11,078 58.3%2004 20,588 13,894 67.52006 20,017 9,504 47.52008 20,695 13,697 66.22010 19,847 10,703 53.92012 18,860 12,881 68.3
Office Dem. Rep.2002 Governor 33.1% 63.4%2004 President 27.7 71.72006 Governor 23.7 60.62008 President 34.1 64.02010 Governor 18.9 73.42012 President 26.7 71.3

Illinois County Data Book / 51
Jackson CountyCongressional District: 12Senate Districts: 58, 59House Districts: 115, 118County Seat: MurphysboroEstablished: January 10, 1816Area: 588 square miles
POPULATION
2000 Census 59,6122010 Census 60,218Percent change (2000-2010) 1.0%
Race (2010)White (non-Hispanic) 76.0%Black or African American 14.1American Indian or Alaskan Native 0.3Asian and Pacific Islander 3.2
Hispanic origin, any race 4.0%
Age (2010)Under 18 17.8%18 to 64 70.565 and over 11.6
Median age (2010) 29.1 years
Education (age 25 or over) (2010)12 or more years 89.5%16 or more years 35.4
Single female households with children < 18 (2010) 12.6%Single male households with children < 18 (2010) 3.4Children under 18 in poverty (2010) 32.1
ECONOMY 2010 2000-10 changeIncome per capita $32,186 48.9%
Labor Force 32,737 8.0%Unemployed 8.0% 81.8
Under $25,000- $100,000 Annual household $25,000 $99,999 and overincome (2010) 42.1% 47.4% 10.5%
% of total jobsJobs by Industry (2010) county stateConstruction 4.6% 0.6%Farm 2.0 1.0Information, finance, real estate 7.0 0.3Government 36.1 1.5Manufacturing and transportation 3.9 0.2Business and education 4.9 0.1Health and social services 10.5 0.5Forestry, mining, utilities 1.7 1.1Wholesale and retail trade 12.5 0.5Other services 12.9 0.5Total jobs - 0.5
REVENUES AND EXPENDITURES
Revenue Collections (millions)State sales & use tax (est. 2011) $49.1Individual income tax (2010) 22.0 State motor fuel tax (est. 2011) 4.7Local property tax (2008) 53.7
State Expenditures (millions)Education (2011) $33.1Medicaid (2011) 45.0State payroll (2011) 51.5
Number of state employees (2011) 948
LAND USE Equalized assessed value 2009 1999-09 (millions) changeFarm $ 56.7 48.0%Residential 412.1 70.7Industrial 47.2 188.9Commercial 230.6 102.8Total $746.6 82.2%
2007 1997-07 changeNumber of farms 810 19.1%Acres of farms 224,414 10.8
Foreign-owned Parcels Acresagricultural land (2010) 4 1,151
ELECTIONS
Primary Dem. Rep. Total2002 4,656 2,744 7,5312004 6,959 2,499 9,6022006 3,607 3,641 7,9252008 8,122 3,893 12,1312010 3,763 2,971 6,8732012 2,755 3,653 6,408
Registered Number Percent General voters voting voting2002 35,670 16,755 47.0%2004 43,381 26,524 61.12006 45,362 16,143 35.62008 45,225 25,795 57.02010 42,164 16,696 39.62012 42,361 24,307 57.4
Office Dem. Rep.2002 Governor 50.6% 46.0%2004 President 55.4 43.32006 Governor 36.8 37.52008 President 59.7 37.92010 Governor 45.2 44.22012 President 55.5 41.1

52 / Illinois County Data Book
Jasper CountyCongressional District: 15Senate District: 55House District: 109County Seat: NewtonEstablished: February 15, 1831Area: 494 square miles
POPULATION
2000 Census 10,1172010 Census 9,698Percent change (2000-2010) -4.1%
Race (2010)White (non-Hispanic) 98.1%Black or African American 0.1American Indian or Alaskan Native 0.1Asian and Pacific Islander 0.3
Hispanic origin, any race 0.8%
Age (2010)Under 18 22.7%18 to 64 59.965 and over 17.4Median age (2010) 42.7 years
Education (age 25 or over) (2010)12 or more years 88.2%16 or more years 13.0
Single female households with children < 18 (2010) 5.7%Single male households with children < 18 (2010) 3.2Children under 18 in poverty (2010) 10.6
ECONOMY 2010 2000-10 changeIncome per capita $33,576 49.0%
Labor Force 4,965 -6.9%Unemployed 9.7% 94.0
Under $25,000- $100,000 Annual household $25,000 $99,999 and overincome (2010) 26.7% 63.2% 10.1%
% of total jobsJobs by Industry (2010) county stateConstruction 5.2% 0.1%Farm 19.9 1.1Information, finance, real estate 6.8 0.0Government 15.8 0.1Manufacturing and transportation 4.6 0.0Business and education 3.3 0.0Health and social services 4.5 0.0Forestry, mining, utilities 6.0 0.4Wholesale and retail trade 12.2 0.1Other services 6.5 0.0Total jobs - 0.1
REVENUES AND EXPENDITURES
Revenue Collections (millions)State sales & use tax (est. 2011) $5.1Individual income tax (2010) 5.0 State motor fuel tax (est. 2011) 0.9Local property tax (2008) 14.1
State Expenditures (millions)Education (2011) $2.4Medicaid (2011) (with Crawford County) 19.0State payroll (2011) 4.9
Number of state employees (2011) 97
LAND USE Equalized assessed value 2009 1999-09 (millions) changeFarm $ 46.7 -16.8%Residential 37.9 28.8Industrial 133.7 88.5Commercial 9.6 9.3Total $228.0 37.9%
2007 1997-07 changeNumber of farms 882 21.0%Acres of farms 243,451 -3.5
Foreign-owned Parcels Acresagricultural land (2010) 0 0
ELECTIONS
Primary Dem. Rep. Total2002 1,045 744 1,7902004 922 653 1,5752006 1,394 967 2,4762008 1,526 1,229 2,7772010 1,041 1,307 2,3502012 418 1,331 1,749
Registered Number Percent General voters voting voting2002 7,228 4,230 58.5%2004 7,359 5,395 73.32006 7,373 4,136 56.12008 7,511 5,229 69.62010 7,586 4,126 54.42012 6,827 5,121 75.0
Office Dem. Rep.2002 Governor 38.6% 55.7%2004 President 33.4 66.12006 Governor 27.2 64.62008 President 40.2 57.82010 Governor 24.9 70.22012 President 28.5 69.7

Illinois County Data Book / 53
Jefferson CountyCongressional District: 12Senate District: 58House District: 115County Seat: Mt. VernonEstablished: March 26, 1819Area: 571 square miles
POPULATION
2000 Census 40,0452010 Census 38,827Percent change (2000-2010) -3.0%
Race (2010)White (non-Hispanic) 87.4%Black or African American 8.2American Indian or Alaskan Native 0.2Asian and Pacific Islander 0.7
Hispanic origin, any race 2.1%
Age (2010)Under 18 22.1%18 to 64 61.765 and over 16.2Median age (2010) 40.6 years
Education (age 25 or over) (2010)12 or more years 83.7%16 or more years 14.1
Single female households with children < 18 (2010) 10.8%Single male households with children < 18 (2010) 4.0Children under 18 in poverty (2010) 24.8
ECONOMY 2010 2000-10 changeIncome per capita $32,435 49.1%
Labor Force 20,281 6.2%Unemployed 9.7% 79.6
Under $25,000- $100,000 Annual household $25,000 $99,999 and overincome (2010) 30.4% 58.9% 10.6%
% of total jobsJobs by Industry (2010) county stateConstruction 3.3% 0.3%Farm 4.4 1.4Information, finance, real estate 7.5 0.2Government 12.0 0.3Manufacturing and transportation 21.5 0.6Business and education 4.6 0.1Health and social services 0.0 0.0Forestry, mining, utilities 0.0 0.0Wholesale and retail trade 10.9 0.3Other services 12.4 0.3Total jobs - 0.3
REVENUES AND EXPENDITURES
Revenue Collections (millions)State sales & use tax (est. 2011) $36.7Individual income tax (2010) 17.6 State motor fuel tax (est. 2011) 4.2Local property tax (2008) 29.6
State Expenditures (millions)Education (2011) $29.1Medicaid (2011) (with Washington & Wayne Counties) 63.2State payroll (2011) 21.3
Number of state employees (2011) 400
LAND USE Equalized assessed value 2009 1999-09 (millions) changeFarm $ 80.0 21.7%Residential 188.6 49.4Industrial 32.1 43.2Commercial 128.3 47.1Total $429.0 42.3%
2007 1997-07 changeNumber of farms 1,156 20.2%Acres of farms 232,531 1.3
Foreign-owned Parcels Acresagricultural land (2010) 2 118
ELECTIONS
Primary Dem. Rep. Total2002 5,421 1,803 7,2322004 2,879 1,607 4,4972006 3,512 1,939 5,4512008 7,589 3,144 10,7442010 2,085 2,497 4,6242012 4,259 3,969 8,241
Registered Number Percent General voters voting voting2002 24,667 13,347 54.1%2004 26,860 17,083 63.62006 27,269 12,924 47.42008 25,816 17,454 67.62010 24,750 12,663 51.22012 24,396 16,605 68.1
Office Dem. Rep.2002 Governor 49.5% 48.4%2004 President 39.6 59.92006 Governor 46.6 42.52008 President 43.5 54.32010 Governor 32.5 60.52012 President 37.3 60.1

54 / Illinois County Data Book
Jersey CountyCongressional District: 13Senate Districts: 50, 56House Districts: 100, 111County Seat: JerseyvilleEstablished: February 28, 1839Area: 369 square miles
POPULATION
2000 Census 21,6682010 Census 22,985Percent change (2000-2010) 6.1%
Race (2010)White (non-Hispanic) 96.9%Black or African American 0.4American Indian or Alaskan Native 0.2Asian and Pacific Islander 0.4
Hispanic origin, any race 1.0%
Age (2010)Under 18 22.8%18 to 64 61.565 and over 15.7Median age (2010) 40.5 years
Education (age 25 or over) (2010)12 or more years 87.1%16 or more years 16.0
Single female households with children < 18 (2010) 7.5%Single male households with children < 18 (2010) 3.5Children under 18 in poverty (2010) 8.4
ECONOMY 2010 2000-10 changeIncome per capita $36,056 40.9%
Labor Force 11,740 5.4%Unemployed 9.4% 104.3
Under $25,000- $100,000 Annual household $25,000 $99,999 and overincome (2010) 20.4% 63.9% 15.7%
% of total jobsJobs by Industry (2010) county stateConstruction 7.8% 0.2%Farm 6.4 0.7Information, finance, real estate 8.4 0.1Government 14.7 0.1Manufacturing and transportation 4.1 0.0Business and education 7.6 0.0Health and social services 0.0 0.0Forestry, mining, utilities 1.0 0.1Wholesale and retail trade 17.0 0.1Other services 17.8 0.1Total jobs - 0.1
REVENUES AND EXPENDITURES
Revenue Collections (millions)State sales & use tax (est. 2011) $14.0Individual income tax (2010) 11.2 State motor fuel tax (est. 2011) 1.9Local property tax (2008) 20.2
State Expenditures (millions)Education (2011) $10.4Medicaid (2011) (with Calhoun County) 19.1State payroll (2011) 7.8
Number of state employees (2011) 150
LAND USE Equalized assessed value 2009 1999-09 (millions) changeFarm $ 57.1 19.1%Residential 227.6 82.1Industrial 1.9 37.5Commercial 65.6 96.7Total $352.1 69.6%
2007 1997-07 changeNumber of farms 519 7.9%Acres of farms 189,462 15.4
Foreign-owned Parcels Acresagricultural land (2010) 2 1,420
ELECTIONS
Primary Dem. Rep. Total2002 2,005 1,672 3,6772004 1,393 1,111 2,6162006 1,435 2,122 3,5612008 2,748 2,040 4,8032010 905 1,697 2,6252012 893 1,846 2,739
Registered Number Percent General voters voting voting2002 14,015 7,947 56.7%2004 15,208 10,394 68.32006 15,730 7,874 50.12008 17,113 10,723 62.72010 17,250 7,825 45.42012 17,744 10,119 57.0
Office Dem. Rep.2002 Governor 50.8% 46.5%2004 President 45.3 53.62006 Governor 47.6 45.62008 President 47.6 50.42010 Governor 32.7 61.62012 President 36.8 60.6

Illinois County Data Book / 55
Jo Daviess CountyCongressional District: 17Senate District: 45House District: 89County Seat: GalenaEstablished: February 17, 1827Area: 601 square miles
POPULATION
2000 Census 22,2892010 Census 22,678Percent change (2000-2010) 1.7%
Race (2010)White (non-Hispanic) 95.6%Black or African American 0.4American Indian or Alaskan Native 0.1Asian and Pacific Islander 0.3
Hispanic origin, any race 2.7%
Age (2010)Under 18 20.8%18 to 64 57.965 and over 21.3Median age (2010) 47.1 years
Education (age 25 or over) (2010)12 or more years 89.1%16 or more years 23.0
Single female households with children < 18 (2010) 6.1%Single male households with children < 18 (2010) 3.3Children under 18 in poverty (2010) 11.5
ECONOMY 2010 2000-10 changeIncome per capita $39,574 38.9%
Labor Force 13,140 2.8%Unemployed 8.9% 107.0
Under $25,000- $100,000 Annual household $25,000 $99,999 and overincome (2010) 21.2% 64.7% 14.1%
% of total jobsJobs by Industry (2010) county stateConstruction 7.4% 0.3%Farm 8.4 1.3Information, finance, real estate 8.6 0.1Government 11.1 0.2Manufacturing and transportation 13.8 0.2Business and education 3.8 0.0Health and social services 0.0 0.0Forestry, mining, utilities 0.0 0.0Wholesale and retail trade 10.9 0.1Other services 22.6 0.3Total jobs - 0.2
REVENUES AND EXPENDITURES
Revenue Collections (millions)State sales & use tax (est. 2011) $16.8Individual income tax (2010) 12.0 State motor fuel tax (est. 2011) 2.7Local property tax (2008) 44.8
State Expenditures (millions)Education (2011) $5.1Medicaid (2011) 7.9State payroll (2011) 4.4
Number of state employees (2011) 97
LAND USE Equalized assessed value 2009 1999-09 (millions) changeFarm $ 213.5 64.3%Residential 494.3 102.8Industrial 19.3 14.7Commercial 93.6 77.3Total $820.8 85.1%
2007 1997-07 changeNumber of farms 1,016 8.0%Acres of farms 281,457 2.1
Foreign-owned Parcels Acresagricultural land (2010) 2 487
ELECTIONS
Primary Dem. Rep. Total2002 887 3,228 4,1182004 1,420 4,823 6,5142006 750 4,811 5,5682008 2,622 2,862 5,5082010 658 3,374 4,0442012 681 3,992 4,735
Registered Number Percent General voters voting voting2002 15,387 8,641 56.2%2004 16,472 11,867 72.02006 16,311 8,248 50.62008 16,529 11,878 71.92010 16,347 8,279 50.62012 16,171 11,565 71.5
Office Dem. Rep.2002 Governor 38.7% 57.7%2004 President 45.8 53.32006 Governor 42.1 47.92008 President 54.5 44.02010 Governor 35.2 59.02012 President 49.6 48.4

56 / Illinois County Data Book
Johnson CountyCongressional District: 15Senate District: 59House District: 118County Seat: ViennaEstablished: September 14, 1812Area: 346 square miles
POPULATION
2000 Census 12,8782010 Census 12,582Percent change (2000-2010) -2.3%
Race (2010)White (non-Hispanic) 87.9%Black or African American 8.0American Indian or Alaskan Native 0.2Asian and Pacific Islander 0.2
Hispanic origin, any race 3.0%
Age (2010)Under 18 19.4%18 to 64 63.465 and over 17.2Median age (2010) 42.2 years
Education (age 25 or over) (2010)12 or more years 78.0%16 or more years 12.8
Single female households with children < 18 (2010) 6.6%Single male households with children < 18 (2010) 3.0Children under 18 in poverty (2010) 19.0
ECONOMY 2010 2000-10 changeIncome per capita $25,000 47.0%
Labor Force 5,213 7.4%Unemployed 11.1% 76.2
Under $25,000- $100,000 Annual household $25,000 $99,999 and overincome (2010) 30.6% 60.9% 8.5%
% of total jobsJobs by Industry (2010) county stateConstruction 7.3% 0.1%Farm 11.4 0.6Information, finance, real estate 0.0 0.0Government 19.9 0.1Manufacturing and transportation 4.5 0.0Business and education 9.5 0.0Health and social services 0.0 0.0Forestry, mining, utilities 0.0 0.0Wholesale and retail trade 10.9 0.0Other services 0.0 0.0Total jobs - 0.1
REVENUES AND EXPENDITURES
Revenue Collections (millions)State sales & use tax (est. 2011) $4.0Individual income tax (2010) 4.3 State motor fuel tax (est. 2011) 0.8Local property tax (2008) 7.0
State Expenditures (millions)Education (2011) $ 9.4Medicaid (2011) (with Union County) 33.3State payroll (2011) 30.4
Number of state employees (2011) 512
LAND USE Equalized assessed value 2009 1999-09 (millions) changeFarm $ 30.6 32.4%Residential 58.9 58.1Industrial 2.0 46.3Commercial 13.7 135.8Total $105.2 55.8%
2007 1997-07 changeNumber of farms 568 10.3%Acres of farms 100,499 -3.7
Foreign-owned Parcels Acresagricultural land (2010) 3 280
ELECTIONS
Primary Dem. Rep. Total2002 1,049 1,828 2,8772004 1,164 1,853 3,0192006 618 2,907 3,5262008 1,333 2,582 3,9222010 520 2,507 3,0292012 483 2,407 2,897
Registered Number Percent General voters voting voting2002 7,669 5,113 66.7%2004 7,463 5,944 79.62006 7,512 4,590 61.12008 7,984 6,012 75.32010 8,083 4,777 59.12012 8,172 5,754 70.4
Office Dem. Rep.2002 Governor 41.7% 56.6%2004 President 30.9 68.22006 Governor 38.5 47.42008 President 31.7 66.32010 Governor 28.1 64.72012 President 27.7 69.9

Illinois County Data Book / 57
Kane CountyCongressional Districts: 6, 8, 11, 14Senate Districts: 22, 25, 26, 33, 35, 42House Districts: 43, 49, 50, 52, 65,
66, 70, 83, 84County Seat: GenevaEstablished: January 16, 1836Area: 521 square miles
POPULATION
2000 Census 404,1192010 Census 515,269Percent change (2000-2010) 27.5%
Race (2010)White (non-Hispanic) 59.0%Black or African American 5.4American Indian or Alaskan Native 0.1Asian and Pacific Islander 3.4
Hispanic origin, any race 30.7%
Age (2010)Under 18 29.0%18 to 64 61.465 and over 9.6Median age (2010) 34.5 years
Education (age 25 or over) (2010)12 or more years 83.2%16 or more years 31.8
Single female households with children < 18 (2010) 8.5%Single male households with children < 18 (2010) 3.3Children under 18 in poverty (2010) 13.5
ECONOMY 2010 2000-10 changeIncome per capita $36,047 15.8%
Labor Force 275,207 24.1%Unemployed 10.5% 144.2
Under $25,000- $100,000 Annual household $25,000 $99,999 and overincome (2010) 14.4% 55.3% 30.3%
% of total jobsJobs by Industry (2010) county stateConstruction 5.0% 4.0%Farm 0.6 1.8Information, finance, real estate 12.1 3.5Government 12.2 3.5Manufacturing and transportation 13.8 4.1Business and education 17.1 3.4Health and social services 10.5 3.3Forestry, mining, utilities 0.4 1.7Wholesale and retail trade 14.7 3.7Other services 13.8 3.4Total jobs - 3.5
REVENUES AND EXPENDITURES
Revenue Collections (millions)State sales & use tax (est. 2011) $ 353.3Individual income tax (2010) 339.8 State motor fuel tax (est. 2011) 42.1Local property tax (2008) 1,089.2
State Expenditures (millions)Education (2011) $299.6Medicaid (2011) 308.8State payroll (2011) 103.6
Number of state employees (2011) 1,688
LAND USE Equalized assessed value 2009 1999-09 (millions) changeFarm $ 266.6 37.3%Residential 12,169.6 136.0Industrial 1,015.2 107.5Commercial 2,342.0 145.8Total $15,793.4 132.5%
2007 1997-07 changeNumber of farms 759 16.8%Acres of farms 192,372 -8.4
Foreign-owned Parcels Acresagricultural land (2010) 4 931
ELECTIONS
Primary Dem. Rep. Total2002 22,572 49,959 75,4132004 22,526 35,772 59,3282006 16,876 45,445 66,3312008 52,633 47,883 101,3322010 15,799 36,458 52,5302012 11,343 41,063 52,803
Registered Number Percent General voters voting voting2002 225,878 109,331 48.4%2004 257,086 171,336 66.62006 252,171 116,249 46.12008 263,876 194,981 73.92010 260,429 129,050 49.62012 272,843 182,747 67.0
Office Dem. Rep.2002 Governor 38.6% 57.6%2004 President 44.1 55.02006 Governor 40.2 45.42008 President 55.2 43.42010 Governor 38.2 53.82012 President 49.7 48.6

58 / Illinois County Data Book
Kankakee CountyCongressional District: 2Senate Districts: 17, 40House Districts: 34, 79County Seat: KankakeeEstablished: February 11, 1853Area: 678 square miles
POPULATION
2000 Census 103,8332010 Census 113,449Percent change (2000-2010) 9.3%
Race (2010)White (non-Hispanic) 73.4%Black or African American 15.0American Indian or Alaskan Native 0.2Asian and Pacific Islander 0.9
Hispanic origin, any race 9.0%
Age (2010)Under 18 25.3%18 to 64 61.265 and over 13.4Median age (2010) 36.7 years
Education (age 25 or over) (2010)12 or more years 85.2%16 or more years 17.4
Single female households with children < 18 (2010) 12.9%Single male households with children < 18 (2010) 3.9Children under 18 in poverty (2010) 20.6
ECONOMY 2010 2000-10 changeIncome per capita $32,261 28.5%
Labor Force 56,643 8.1%Unemployed 13.3% 189.1
Under $25,000- $100,000 Annual household $25,000 $99,999 and overincome (2010) 24.0% 60.1% 15.9%
% of total jobsJobs by Industry (2010) county stateConstruction 4.0% 0.7%Farm 2.4 1.6Information, finance, real estate 8.7 0.5Government 12.5 0.7Manufacturing and transportation 12.7 0.8Business and education 8.2 0.3Health and social services 16.2 1.1Forestry, mining, utilities 0.2 0.2Wholesale and retail trade 17.0 0.9Other services 14.2 0.7Total jobs - 0.7
REVENUES AND EXPENDITURES
Revenue Collections (millions)State sales & use tax (est. 2011) $188.7Individual income tax (2010) 52.4 State motor fuel tax (est. 2011) 11.2Local property tax (2008) 149.2
State Expenditures (millions)Education (2011) $ 78.9Medicaid (2011) 103.4State payroll (2011) 97.6
Number of state employees (2011) 1,979
LAND USE Equalized assessed value 2009 1999-09 (millions) changeFarm $ 193.3 32.2%Residential 1,337.1 84.3Industrial 95.4 51.8Commercial 395.9 47.7Total $2,021.7 68.1%
2007 1997-07 changeNumber of farms 835 0.5%Acres of farms 385,808 9.7
Foreign-owned Parcels Acresagricultural land (2010) 1 74
ELECTIONS
Primary Dem. Rep. Total2002 6,490 8,133 15,8032004 6,816 4,390 11,7692006 3,581 5,629 10,3222008 11,291 7,498 18,8492010 3,932 7,067 11,0562012 4,500 7,755 12,428
Registered Number Percent General voters voting voting2002 56,797 30,145 53.1%2004 61,607 45,297 73.52006 62,344 31,431 50.42008 65,279 48,333 74.02010 64,306 32,999 51.32012 64,366 45,864 71.3
Office Dem. Rep.2002 Governor 46.1% 51.1%2004 President 44.4 54.92006 Governor 40.3 46.72008 President 51.5 46.92010 Governor 37.1 52.92012 President 47.5 50.8

Illinois County Data Book / 59
Kendall CountyCongressional Districts: 11, 14Senate Districts: 25, 38, 42, 49House Districts: 50, 75, 84, 97County Seat: YorkvilleEstablished: February 19, 1841Area: 321 square miles
POPULATION
2000 Census 54,5442010 Census 114,736Percent change (2000-2010) 110.4%
Race (2010)White (non-Hispanic) 74.2%Black or African American 5.5American Indian or Alaskan Native 0.1Asian and Pacific Islander 3.0
Hispanic origin, any race 15.6%
Age (2010)Under 18 31.4%18 to 64 61.365 and over 7.3Median age (2010) 32.9 years
Education (age 25 or over) (2010)12 or more years 92.0%16 or more years 32.3
Single female households with children < 18 (2010) 7.1%Single male households with children < 18 (2010) 2.9Children under 18 in poverty (2010) 4.6
ECONOMY 2010 2000-10 changeIncome per capita $34,740 9.6%
Labor Force 65,984 103.9%Unemployed 9.5% 187.9
Under $25,000- $100,000 Annual household $25,000 $99,999 and overincome (2010) 7.6% 57.2% 35.2%
% of total jobsJobs by Industry (2010) county stateConstruction 5.8% 0.6%Farm 1.7 0.7Information, finance, real estate 9.1 0.3Government 15.5 0.6Manufacturing and transportation 18.2 0.7Business and education 10.0 0.3Health and social services 5.7 0.2Forestry, mining, utilities 0.1 0.1Wholesale and retail trade 14.9 0.5Other services 14.9 0.5Total jobs - 0.5
REVENUES AND EXPENDITURES
Revenue Collections (millions)State sales & use tax (est. 2011) $76.0Individual income tax (2010) 80.0 State motor fuel tax (est. 2011) 7.9Local property tax (2008) 246.5
State Expenditures (millions)Education (2011) $56.1Medicaid (2011) 29.5State payroll (2011) 21.3
Number of state employees (2011) 383
LAND USE Equalized assessed value 2009 1999-09 (millions) changeFarm $ 108.6 6.7%Residential 2,772.6 292.2Industrial 105.3 105.4Commercial 383.2 292.7Total $3,369.7 251.9%
2007 1997-07 changeNumber of farms 424 -3.9%Acres of farms 166,872 -0.4
Foreign-owned Parcels Acresagricultural land (2010) 17 2,554
ELECTIONS
Primary Dem. Rep. Total2002 3,138 11,523 15,3912004 3,559 6,881 10,6052006 3,352 13,655 17,9002008 10,993 11,889 22,9232010 3,292 10,098 13,4592012 2,594 11,540 14,370
Registered Number Percent General voters voting voting2002 44,165 20,874 47.3%2004 48,962 33,345 68.12006 54,857 25,709 46.92008 67,307 46,875 69.62010 65,153 31,538 48.42012 68,453 47,565 69.5
Office Dem. Rep.2002 Governor 34.6% 61.6%2004 President 38.4 60.82006 Governor 39.4 47.22008 President 53.1 45.82010 Governor 35.8 55.02012 President 47.5 50.8

60 / Illinois County Data Book
Knox CountyCongressional District: 17Senate Districts: 37, 47House Districts: 74, 93County Seat: GalesburgEstablished: January 13, 1825Area: 716 square miles
POPULATION
2000 Census 55,8362010 Census 52,919Percent change (2000-2010) -5.2%
Race (2010)White (non-Hispanic) 85.3%Black or African American 7.1American Indian or Alaskan Native 0.1Asian and Pacific Islander 0.6
Hispanic origin, any race 4.8%
Age (2010)Under 18 20.6%18 to 64 61.065 and over 18.4Median age (2010) 42.0 years
Education (age 25 or over) (2010)12 or more years 85.2%16 or more years 15.2
Single female households with children < 18 (2010) 12.2%Single male households with children < 18 (2010) 3.8Children under 18 in poverty (2010) 24.7
ECONOMY 2010 2000-10 changeIncome per capita $33,014 40.2%
Labor Force 26,054 -6.9%Unemployed 9.7% 98.0
Under $25,000- $100,000 Annual household $25,000 $99,999 and overincome (2010) 32.4% 58.8% 8.8%
% of total jobsJobs by Industry (2010) county stateConstruction 3.3% 0.3%Farm 3.6 1.2Information, finance, real estate 8.6 0.3Government 13.7 0.4Manufacturing and transportation 10.0 0.3Business and education 5.6 0.1Health and social services 0.0 0.0Forestry, mining, utilities 0.4 0.2Wholesale and retail trade 16.9 0.5Other services 14.3 0.4Total jobs - 0.4
REVENUES AND EXPENDITURES
Revenue Collections (millions)State sales & use tax (est. 2011) $36.9Individual income tax (2010) 22.7 State motor fuel tax (est. 2011) 4.9Local property tax (2008) 55.7
State Expenditures (millions)Education (2011) $30.4Medicaid (2011) 62.5State payroll (2011) 24.2
Number of state employees (2011) 413
LAND USE Equalized assessed value 2009 1999-09 (millions) changeFarm $ 111.1 -15.4%Residential 400.0 45.5Industrial 39.5 24.6Commercial 151.3 32.1Total $701.9 27.1%
2007 1997-07 changeNumber of farms 904 -2.6%Acres of farms 362,951 -6.9
Foreign-owned Parcels Acresagricultural land (2010) 3 1,109
ELECTIONS
Primary Dem. Rep. Total2002 3,584 5,059 8,6552004 4,012 3,705 8,6762006 3,647 4,040 7,6872008 7,440 4,771 12,2402010 2,360 3,844 6,2262012 1,724 4,307 6,307
Registered Number Percent General voters voting voting2002 37,687 19,062 50.6%2004 36,847 24,945 67.72006 34,254 17,802 52.02008 34,898 24,284 69.62010 34,258 16,943 49.52012 33,417 23,501 70.3
Office Dem. Rep.2002 Governor 43.4% 54.2%2004 President 54.2 45.02006 Governor 47.1 44.72008 President 59.2 39.32010 Governor 38.8 54.52012 President 57.8 40.4

Illinois County Data Book / 61
Lake CountyCongressional Districts: 6, 10, 14Senate Districts: 26, 29-32House Districts: 51, 52, 57-62, 64County Seat: WaukeganEstablished: March 1, 1839Area: 448 square miles
POPULATION
2000 Census 644,3562010 Census 703,462Percent change (2000-2010) 9.2%
Race (2010)White (non-Hispanic) 65.2%Black or African American 6.7American Indian or Alaskan Native 0.2Asian and Pacific Islander 6.3
Hispanic origin, any race 19.9%
Age (2010)Under 18 27.4%18 to 64 62.265 and over 10.4Median age (2010) 36.7 years
Education (age 25 or over) (2010)12 or more years 88.5%16 or more years 41.3
Single female households with children < 18 (2010) 8.3%Single male households with children < 18 (2010) 2.9Children under 18 in poverty (2010) 9.6
ECONOMY 2010 2000-10 changeIncome per capita $53,905 15.7%
Labor Force 361,430 6.8%Unemployed 10.5% 183.8
Under $25,000- $100,000 Annual household $25,000 $99,999 and overincome (2010) 12.6% 49.5% 37.9%
% of total jobsJobs by Industry (2010) county stateConstruction 3.9% 5.3%Farm 0.1 0.7Information, finance, real estate 12.6 6.1Government 13.8 6.6Manufacturing and transportation 12.8 6.4Business and education 18.2 6.1Health and social services 8.7 4.6Forestry, mining, utilities 0.4 2.7Wholesale and retail trade 16.5 7.1Other services 12.7 5.4Total jobs - 6.0
REVENUES AND EXPENDITURES
Revenue Collections (millions)State sales & use tax (est. 2011) $637.1Individual income tax (2010) 772.6 State motor fuel tax (est. 2011) 86.3Local property tax (2008) 2,029.0
State Expenditures (millions)Education (2011) $324.0Medicaid (2011) 323.1State payroll (2011) 81.6
Number of state employees (2011) 1,469
LAND USE Equalized assessed value 2009 1999-09 (millions) changeFarm $ 149.4 27.0%Residential 24,850.2 96.9Industrial 1,094.3 46.5Commercial 4,354.3 67.7Total $30,448.1 89.4%
2007 1997-07 changeNumber of farms 396 18.2%Acres of farms 34,525 -32.2
Foreign-owned Parcels Acresagricultural land (2010) 6 440
ELECTIONS
Primary Dem. Rep. Total2002 49,050 71,029 126,2852004 47,205 46,222 97,8002006 28,039 50,762 81,7242008 93,174 53,839 147,4242010 36,133 47,551 83,9082012 29,961 60,270 91,138
Registered Number Percent General voters voting voting2002 335,313 176,597 52.7%2004 382,835 276,609 72.32006 369,853 190,718 51.62008 405,041 301,077 74.32010 404,637 207,499 51.32012 406,567 289,385 71.2
Office Dem. Rep.2002 Governor 43.8% 52.8%2004 President 48.8 50.52006 Governor 45.9 42.42008 President 59.3 39.62010 Governor 42.4 50.12012 President 53.5 45.1

62 / Illinois County Data Book
LaSalle CountyCongressional District: 16Senate Districts: 37, 38, 45House Districts: 73, 75, 76, 90County Seat: OttawaEstablished: January 15, 1831Area: 1,135 square miles
POPULATION
2000 Census 111,5092010 Census 113,924Percent change (2000-2010) 2.2%
Race (2010)White (non-Hispanic) 88.3%Black or African American 1.8American Indian or Alaskan Native 0.2Asian and Pacific Islander 0.7
Hispanic origin, any race 8.0%
Age (2010)Under 18 23.0%18 to 64 60.665 and over 16.4Median age (2010) 41.0 years
Education (age 25 or over) (2010)12 or more years 87.8%16 or more years 15.8
Single female households with children < 18 (2010) 9.0%Single male households with children < 18 (2010) 4.2Children under 18 in poverty (2010) 15.3
ECONOMY 2010 2000-10 changeIncome per capita $35,345 34.9%
Labor Force 60,161 6.7%Unemployed 13.2% 144.4
Under $25,000- $100,000 Annual household $25,000 $99,999 and overincome (2010) 23.0% 61.1% 15.8%
% of total jobsJobs by Industry (2010) county stateConstruction 4.6% 0.8%Farm 2.8 1.9Information, finance, real estate 8.5 0.5Government 12.6 0.8Manufacturing and transportation 14.6 0.9Business and education 8.7 0.4Health and social services 10.5 0.7Forestry, mining, utilities 3.0 2.8Wholesale and retail trade 19.7 1.1Other services 14.8 0.8Total jobs - 0.8
REVENUES AND EXPENDITURES
Revenue Collections (millions)State sales & use tax (est. 2011) $ 91.5Individual income tax (2010) 59.9 State motor fuel tax (est. 2011) 14.3Local property tax (2008) 182.8
State Expenditures (millions)Education (2011) $50.0Medicaid (2011) (with Grundy County) 95.6State payroll (2011) 69.8
Number of state employees (2011) 1,220
LAND USE Equalized assessed value 2009 1999-09 (millions) changeFarm $ 278.9 7.8%Residential 1,390.8 67.0Industrial 644.5 765.3Commercial 507.6 -10.2Total $2,821.8 63.0%
2007 1997-07 changeNumber of farms 1,622 2.6%Acres of farms 643,291 9.5
Foreign-owned Parcels Acresagricultural land (2010) 22 9,168
ELECTIONS
Primary Dem. Rep. Total2002 7,656 8,753 17,2302004 8,073 6,251 15,2792006 5,417 6,894 13,3842008 13,977 9,633 24,3722010 6,216 8,093 15,3142012 4,017 10,238 14,651
Registered Number Percent General voters voting voting2002 70,741 38,100 53.9%2004 74,592 51,168 68.62006 73,127 34,221 46.82008 73,689 50,775 68.92010 73,051 34,423 47.12012 71,565 47,748 66.7
Office Dem. Rep.2002 Governor 50.2% 45.2%2004 President 47.8 51.52006 Governor 45.5 40.62008 President 54.7 43.62010 Governor 39.7 51.12012 President 48.8 49.2
Illinois County Data Book / 63
Lawrence CountyCongressional District: 15Senate District: 55House Districts: 109, 110County Seat: LawrencevilleEstablished: January 16, 1821Area: 372 square miles
POPULATION
2000 Census 15,4522010 Census 16,833Percent change (2000-2010) 8.9%
Race (2010)White (non-Hispanic) 86.1%Black or African American 9.4American Indian or Alaskan Native 0.2Asian and Pacific Islander 0.2
Hispanic origin, any race 3.3%
Age (2010)Under 18 19.1%18 to 64 65.065 and over 15.9Median age (2010) 39.7 years
Education (age 25 or over) (2010)12 or more years 81.1%16 or more years 11.1
Single female households with children < 18 (2010) 8.2%Single male households with children < 18 (2010) 3.9Children under 18 in poverty (2010) 26.9
ECONOMY 2010 2000-10 changeIncome per capita $28,250 15.0%
Labor Force 8,167 0.9%Unemployed 9.3% 63.2
Under $25,000- $100,000 Annual household $25,000 $99,999 and overincome (2010) 34.6% 55.0% 10.4%
% of total jobsJobs by Industry (2010) county stateConstruction 5.7% 0.1%Farm 6.8 0.5Information, finance, real estate 11.3 0.1Government 16.1 0.1Manufacturing and transportation 9.5 0.1Business and education 5.3 0.0Health and social services 0.0 0.0Forestry, mining, utilities 0.0 0.0Wholesale and retail trade 12.9 0.1Other services 5.1 0.0Total jobs - 0.1
REVENUES AND EXPENDITURES
Revenue Collections (millions)State sales & use tax (est. 2011) $7.3Individual income tax (2010) 6.1 State motor fuel tax (est. 2011) 1.0Local property tax (2008) 8.5
State Expenditures (millions)Education (2011) $12.3Medicaid (2011) 14.1State payroll (2011) 9.1
Number of state employees (2011) 154
LAND USE Equalized assessed value 2009 1999-09 (millions) changeFarm $ 24.0 -18.2%Residential 50.9 9.5Industrial 19.3 237.4Commercial 19.7 40.8Total $113.9 19.2%
2007 1997-07 changeNumber of farms 421 12.0%Acres of farms 194,035 6.3
Foreign-owned Parcels Acresagricultural land (2010) 1 13
ELECTIONS
Primary Dem. Rep. Total2002 1,738 1,963 3,8832004 857 886 1,7432006 1,028 1,588 2,6162008 1,600 1,505 3,1102010 1,211 1,839 3,1342012 484 1,420 1,904
Registered Number Percent General voters voting voting2002 11,114 5,622 50.6%2004 11,300 6,796 60.12006 10,028 5,299 52.82008 10,497 6,661 63.52010 10,770 5,314 49.32012 10,504 6,084 57.9
Office Dem. Rep.2002 Governor 49.7% 48.1%2004 President 37.4 61.92006 Governor 40.0 54.42008 President 46.1 52.12010 Governor 32.0 63.02012 President 33.6 64.4
64 / Illinois County Data Book
Lee CountyCongressional District: 16Senate Districts: 37, 45House Districts: 74, 90County Seat: DixonEstablished: February 27, 1839Area: 725 square miles
POPULATION
2000 Census 36,0622010 Census 36,031Percent change (2000-2010) -0.1%
Race (2010)White (non-Hispanic) 88.3%Black or African American 4.7American Indian or Alaskan Native 0.1Asian and Pacific Islander 0.7
Hispanic origin, any race 5.0%
Age (2010)Under 18 21.5%18 to 64 62.965 and over 15.7Median age (2010) 42.0 years
Education (age 25 or over) (2010)12 or more years 85.7%16 or more years 15.0
Single female households with children < 18 (2010) 9.5%Single male households with children < 18 (2010) 3.9Children under 18 in poverty (2010) 11.8
ECONOMY 2010 2000-10 changeIncome per capita $32,671 38.2%
Labor Force 18,306 3.5%Unemployed 11.2% 160.5
Under $25,000- $100,000 Annual household $25,000 $99,999 and overincome (2010) 23.0% 62.4% 14.7%
% of total jobsJobs by Industry (2010) county stateConstruction 4.3% 0.2%Farm 5.1 1.1Information, finance, real estate 7.4 0.1Government 13.8 0.3Manufacturing and transportation 12.7 0.2Business and education 4.3 0.1Health and social services 15.0 0.3Forestry, mining, utilities 0.0 0.0Wholesale and retail trade 18.7 0.3Other services 12.2 0.2Total jobs - 0.2
REVENUES AND EXPENDITURES
Revenue Collections (millions)State sales & use tax (est. 2011) $20.9Individual income tax (2010) 17.7 State motor fuel tax (est. 2011) 3.3Local property tax (2008) 49.0
State Expenditures (millions)Education (2011) $12.8Medicaid (2011) (with Ogle County) 59.5State payroll (2011) 44.4
Number of state employees (2011) 756
LAND USE Equalized assessed value 2009 1999-09 (millions) changeFarm $ 165.7 7.0%Residential 362.1 51.3Industrial 56.6 123.3Commercial 89.0 64.6Total $673.3 42.2%
2007 1997-07 changeNumber of farms 898 -0.7%Acres of farms 395,624 0.7
Foreign-owned Parcels Acresagricultural land (2010) 13 3,586
ELECTIONS
Primary Dem. Rep. Total2002 1,896 3,978 6,0552004 1,887 3,081 5,1642006 1,019 4,754 5,7792008 3,532 4,638 8,2622010 1,169 3,346 4,5432012 771 5,187 6,035
Registered Number Percent General voters voting voting2002 22,247 12,120 54.5%2004 22,296 16,326 73.22006 24,922 11,177 44.82008 26,428 16,499 62.42010 25,723 11,075 43.12012 21,843 15,439 70.7
Office Dem. Rep.2002 Governor 43.5% 53.0%2004 President 40.4 58.62006 Governor 34.7 51.52008 President 47.6 50.62010 Governor 29.8 62.72012 President 45.3 52.7
Illinois County Data Book / 65
Livingston CountyCongressional District: 16Senate Districts: 38, 53House Districts: 76, 105, 106County Seat: PontiacEstablished: February 27, 1837Area: 1,044 square miles
POPULATION
2000 Census 39,6782010 Census 38,950Percent change (2000-2010) -1.8%
Race (2010)White (non-Hispanic) 89.6%Black or African American 4.8American Indian or Alaskan Native 0.1Asian and Pacific Islander 0.5
Hispanic origin, any race 3.9%
Age (2010)Under 18 22.5%18 to 64 61.765 and over 15.8Median age (2010) 40.8 years
Education (age 25 or over) (2010)12 or more years 84.1%16 or more years 13.5
Single female households with children < 18 (2010) 8.9%Single male households with children < 18 (2010) 4.2Children under 18 in poverty (2010) 15.4
ECONOMY 2010 2000-10 changeIncome per capita $39,402 50.9%
Labor Force 19,125 -1.9%Unemployed 10.6% 171.8
Under $25,000- $100,000 Annual household $25,000 $99,999 and overincome (2010) 23.2% 62.5% 14.3%
% of total jobsJobs by Industry (2010) county stateConstruction 5.1% 0.3%Farm 6.6 1.6Information, finance, real estate 7.2 0.2Government 14.8 0.3Manufacturing and transportation 10.7 0.2Business and education 5.7 0.1Health and social services 10.8 0.3Forestry, mining, utilities 0.0 0.0Wholesale and retail trade 16.4 0.3Other services 10.9 0.2Total jobs - 0.3
REVENUES AND EXPENDITURES
Revenue Collections (millions)State sales & use tax (est. 2011) $26.9Individual income tax (2010) 19.6 State motor fuel tax (est. 2011) 5.0Local property tax (2008) 52.4
State Expenditures (millions)Education (2011) $24.2Medicaid (2011) 27.3State payroll (2011) 45.4
Number of state employees (2011) 789
LAND USE Equalized assessed value 2009 1999-09 (millions) changeFarm $ 153.5 -21.6%Residential 336.9 52.0Industrial 20.8 39.1Commercial 104.2 54.4Total $615.3 23.1%
2007 1997-07 changeNumber of farms 1,319 -4.4%Acres of farms 628,502 2.4
Foreign-owned Parcels Acresagricultural land (2010) 5 347
ELECTIONS
Primary Dem. Rep. Total2002 1,224 7,579 8,8092004 1,882 6,649 9,4692006 560 3,900 4,4682008 2,698 5,358 8,1332010 1,014 6,580 7,7762012 593 6,850 7,477
Registered Number Percent General voters voting voting2002 22,455 12,263 54.6%2004 26,267 16,131 61.42006 23,340 11,044 47.32008 23,826 15,752 66.12010 21,968 12,844 58.52012 21,718 15,162 69.8
Office Dem. Rep.2002 Governor 36.4% 61.1%2004 President 35.1 64.32006 Governor 28.0 60.32008 President 39.6 58.82010 Governor 27.8 65.62012 President 33.4 64.9

66 / Illinois County Data Book
Logan CountyCongressional District: 18Senate District: 44House District: 87County Seat: LincolnEstablished: February 15, 1839Area: 618 square miles
POPULATION
2000 Census 31,1832010 Census 30,305Percent change (2000-2010) -2.8%
Race (2010)White (non-Hispanic) 87.7%Black or African American 7.4American Indian or Alaskan Native 0.2Asian and Pacific Islander 0.6
Hispanic origin, any race 2.9%
Age (2010)Under 18 20.0%18 to 64 64.365 and over 15.7Median age (2010) 39.4 years
Education (age 25 or over) (2010)12 or more years 85.4%16 or more years 17.0
Single female households with children < 18 (2010) 10.0%Single male households with children < 18 (2010) 4.7Children under 18 in poverty (2010) 15.1
ECONOMY 2010 2000-10 changeIncome per capita $32,529 42.1%
Labor Force 13,528 -10.0%Unemployed 9.4% 135.0
Under $25,000- $100,000 Annual household $25,000 $99,999 and overincome (2010) 23.8% 62.2% 14.0%
% of total jobsJobs by Industry (2010) county stateConstruction 3.7% 0.2%Farm 5.2 0.9Information, finance, real estate 8.9 0.1Government 16.5 0.2Manufacturing and transportation 12.0 0.2Business and education 7.3 0.1Health and social services 10.3 0.2Forestry, mining, utilities 0.4 0.1Wholesale and retail trade 16.8 0.2Other services 15.4 0.2Total jobs - 0.2
REVENUES AND EXPENDITURES
Revenue Collections (millions)State sales & use tax (est. 2011) $18.1Individual income tax (2010) 12.9 State motor fuel tax (est. 2011) 3.2Local property tax (2008) 32.7
State Expenditures (millions)Education (2011) $11.8Medicaid (2011) (with DeWitt & Menard Counties) 48.4State payroll (2011) 46.2
Number of state employees (2011) 816
LAND USE Equalized assessed value 2009 1999-09 (millions) changeFarm $ 131.1 -13.4%Residential 206.6 28.9Industrial 12.4 23.0Commercial 74.6 57.3Total $424.7 15.1%
2007 1997-07 changeNumber of farms 710 -3.9%Acres of farms 320,356 -15.9
Foreign-owned Parcels Acresagricultural land (2010) 14 3,908
ELECTIONS
Primary Dem. Rep. Total2002 1,321 6,397 7,7182004 1,226 4,783 6,1602006 620 3,884 4,5202008 2,047 5,303 7,3572010 622 4,767 5,4172012 374 4,083 4,475
Registered Number Percent General voters voting voting2002 19,142 11,476 60.0%2004 20,569 13,542 65.82006 19,094 10,248 53.72008 19,859 13,029 65.62010 20,088 9,008 44.82012 19,471 12,182 62.6
Office Dem. Rep.2002 Governor 40.3% 57.6%2004 President 31.7 67.72006 Governor 22.9 63.02008 President 40.7 57.62010 Governor 22.0 71.02012 President 33.0 65.1

Illinois County Data Book / 67
McDonough CountyCongressional District: 18Senate District: 47House District: 93County Seat: MacombEstablished: January 25, 1826Area: 589 square miles
POPULATION
2000 Census 32,9132010 Census 32,612Percent change (2000-2010) -0.9%
Race (2010)White (non-Hispanic) 88.9%Black or African American 4.9American Indian or Alaskan Native 0.2Asian and Pacific Islander 1.8
Hispanic origin, any race 2.7%
Age (2010)Under 18 16.1%18 to 64 69.765 and over 14.2Median age (2010) 28.9 years
Education (age 25 or over) (2010)12 or more years 91.2%16 or more years 32.6
Single female households with children < 18 (2010) 10.0%Single male households with children < 18 (2010) 3.4Children under 18 in poverty (2010) 21.7
ECONOMY 2010 2000-10 changeIncome per capita $30,571 42.4%
Labor Force 16,847 0.0%Unemployed 8.4% 95.3
Under $25,000- $100,000 Annual household $25,000 $99,999 and overincome (2010) 39.9% 51.6% 8.5%
% of total jobsJobs by Industry (2010) county stateConstruction 3.4% 0.2%Farm 4.4 1.0Information, finance, real estate 7.1 0.1Government 33.8 0.7Manufacturing and transportation 8.9 0.2Business and education 2.2 0.0Health and social services 0.0 0.0Forestry, mining, utilities 0.0 0.0Wholesale and retail trade 13.9 0.2Other services 14.0 0.2Total jobs - 0.2
REVENUES AND EXPENDITURES
Revenue Collections (millions)State sales & use tax (est. 2011) $20.2Individual income tax (2010) 12.3 State motor fuel tax (est. 2011) 2.6Local property tax (2008) 30.6
State Expenditures (millions)Education (2011) $12.8Medicaid (2011) 18.3State payroll (2011) 11.5
Number of state employees (2011) 206
LAND USE Equalized assessed value 2009 1999-09 (millions) changeFarm $ 95.0 -13.6%Residential 183.7 62.2Industrial 8.4 14.1Commercial 81.1 65.3Total $368.2 31.7%
2007 1997-07 changeNumber of farms 761 -7.6%Acres of farms 307,725 -9.5
Foreign-owned Parcels Acresagricultural land (2010) 6 890
ELECTIONS
Primary Dem. Rep. Total2002 1,422 5,312 6,7472004 1,707 4,196 5,9152006 807 3,185 3,9932008 3,252 3,266 6,5282010 910 3,280 4,2062012 913 3,465 4,865
Registered Number Percent General voters voting voting2002 18,451 11,073 60.0%2004 20,629 15,038 72.92006 19,105 10,136 53.12008 19,569 13,158 67.22010 17,909 9,433 52.72012 19,154 12,619 65.9
Office Dem. Rep.2002 Governor 38.9% 57.8%2004 President 47.7 51.32006 Governor 31.3 54.12008 President 52.0 46.42010 Governor 30.2 61.92012 President 47.9 49.4

68 / Illinois County Data Book
McHenry CountyCongressional Districts: 6, 14Senate Districts: 26, 32, 33House Districts: 52, 63-66County Seat: WoodstockEstablished: January 16, 1836Area: 604 square miles
POPULATION
2000 Census 260,0772010 Census 308,760Percent change (2000-2010) 18.7%
Race (2010)White (non-Hispanic) 83.7%Black or African American 1.0American Indian or Alaskan Native 0.1Asian and Pacific Islander 2.5
Hispanic origin, any race 11.4%
Age (2010)Under 18 27.3%18 to 64 62.665 and over 10.1Median age (2010) 38.0 years
Education (age 25 or over) (2010)12 or more years 91.7%16 or more years 32.1
Single female households with children < 18 (2010) 6.8%Single male households with children < 18 (2010) 2.8Children under 18 in poverty (2010) 8.3
ECONOMY 2010 2000-10 changeIncome per capita $39,395 15.7%
Labor Force 175,705 16.1%Unemployed 10.0% 177.8
Under $25,000- $100,000 Annual household $25,000 $99,999 and overincome (2010) 11.8% 55.0% 33.2%
% of total jobsJobs by Industry (2010) county stateConstruction 7.4% 2.8%Farm 1.2 1.9Information, finance, real estate 8.7 1.2Government 13.0 1.7Manufacturing and transportation 12.8 1.8Business and education 13.5 1.3Health and social services 9.2 1.4Forestry, mining, utilities 0.4 0.7Wholesale and retail trade 17.2 2.1Other services 14.5 1.7Total jobs - 1.7
REVENUES AND EXPENDITURES
Revenue Collections (millions)State sales & use tax (est. 2011) $210.9Individual income tax (2010) 233.4 State motor fuel tax (est. 2011) 33.7Local property tax (2008) 735.2
State Expenditures (millions)Education (2011) $ 93.3Medicaid (2011) 101.6State payroll (2011) 38.4
Number of state employees (2011) 646
LAND USE Equalized assessed value 2009 1999-09 (millions) changeFarm $ 276.7 45.2%Residential 8,513.6 114.1Industrial 429.8 55.7Commercial 1,215.6 108.8Total $10,435.7 107.7%
2007 1997-07 changeNumber of farms 1,035 12.4%Acres of farms 215,584 -11.1
Foreign-owned Parcels Acresagricultural land (2010) 8 3,346
ELECTIONS
Primary Dem. Rep. Total2002 11,042 30,636 42,7192004 18,054 31,153 52,8682006 11,893 33,885 50,2512008 33,490 31,598 65,2322010 9,769 26,084 36,0782012 5,585 33,268 39,242
Registered Number Percent General voters voting voting2002 169,530 77,529 45.7%2004 186,394 128,454 68.92006 186,323 82,725 44.42008 199,378 140,002 70.22010 202,033 95,339 47.22012 203,225 134,550 66.2
Office Dem. Rep.2002 Governor 35.0% 59.3%2004 President 39.3 59.72006 Governor 37.4 48.32008 President 51.9 46.62010 Governor 33.6 56.92012 President 44.7 53.5

Illinois County Data Book / 69
McLean CountyCongressional Districts: 13, 18Senate Districts: 44, 51, 53House Districts: 88, 101, 105County Seat: BloomingtonEstablished: December 25, 1830Area: 1,184 square miles
POPULATION
2000 Census 150,4332010 Census 169,572Percent change (2000-2010) 12.7%
Race (2010)White (non-Hispanic) 81.9%Black or African American 7.2American Indian or Alaskan Native 0.2Asian and Pacific Islander 4.3
Hispanic origin, any race 4.4%
Age (2010)Under 18 22.7%18 to 64 67.165 and over 10.2Median age (2010) 32.1 years
Education (age 25 or over) (2010)12 or more years 93.4%16 or more years 40.4
Single female households with children < 18 (2010) 10.0%Single male households with children < 18 (2010) 3.1Children under 18 in poverty (2010) 11.4
ECONOMY 2010 2000-10 changeIncome per capita $40,084 34.4%
Labor Force 92,253 8.0%Unemployed 7.8% 129.4
Under $25,000- $100,000 Annual household $25,000 $99,999 and overincome (2010) 21.0% 55.5% 23.5%
% of total jobsJobs by Industry (2010) county stateConstruction 3.7% 1.3%Farm 1.3 1.8Information, finance, real estate 16.7 2.1Government 14.1 1.7Manufacturing and transportation 6.0 0.8Business and education 8.0 0.7Health and social services 10.3 1.4Forestry, mining, utilities 0.2 0.5Wholesale and retail trade 12.0 1.3Other services 14.6 1.6Total jobs - 1.5
REVENUES AND EXPENDITURES
Revenue Collections (millions)State sales & use tax (est. 2011) $140.5Individual income tax (2010) 109.2 State motor fuel tax (est. 2011) 15.6Local property tax (2008) 267.4
State Expenditures (millions)Education (2011) $57.3Medicaid (2011) 70.7State payroll (2011) 36.4
Number of state employees (2011) 672
LAND USE Equalized assessed value 2009 1999-09 (millions) changeFarm $ 241.5 -14.5%Residential 2,260.4 79.3Industrial 86.6 137.8Commercial 1,009.3 64.9Total $3,597.9 64.2%
2007 1997-07 changeNumber of farms 1,513 2.6%Acres of farms 675,984 -3.0
Foreign-owned Parcels Acresagricultural land (2010) 68 79,810
ELECTIONS
Primary Dem. Rep. Total2002 6,272 19,164 25,6182004 8,333 17,340 26,6402006 2,474 16,508 19,0972008 18,349 19,297 38,1162010 4,431 16,642 21,2572012 3,005 21,980 25,137
Registered Number Percent General voters voting voting2002 89,651 43,349 48.4%2004 96,530 71,960 74.52006 99,949 44,171 44.22008 100,157 76,231 76.12010 97,274 52,944 54.42012 102,522 73,827 72.0
Office Dem. Rep.2002 Governor 39.4% 57.9%2004 President 41.7 57.62006 Governor 30.0 54.72008 President 49.8 48.52010 Governor 30.1 63.12012 President 43.4 54.4

70 / Illinois County Data Book
Macon CountyCongressional District: 13Senate Districts: 48, 51House Districts: 96, 101, 102County Seat: DecaturEstablished: January 19, 1829Area: 581 square miles
POPULATION
2000 Census 114,7062010 Census 110,768Percent change (2000-2010) -3.4%
Race (2010)White (non-Hispanic) 78.4%Black or African American 16.2American Indian or Alaskan Native 0.2Asian and Pacific Islander 1.0
Hispanic origin, any race 1.9%
Age (2010)Under 18 22.8%18 to 64 60.865 and over 16.4Median age (2010) 40.3 years
Education (age 25 or over) (2010)12 or more years 86.9%16 or more years 20.5
Single female households with children < 18 (2010) 14.0%Single male households with children < 18 (2010) 3.6Children under 18 in poverty (2010) 26.1
ECONOMY 2010 2000-10 changeIncome per capita $38,945 39.8%
Labor Force 54,732 -2.0%Unemployed 12.0% 126.4
Under $25,000- $100,000 Annual household $25,000 $99,999 and overincome (2010) 27.2% 57.8% 14.9%
% of total jobsJobs by Industry (2010) county stateConstruction 6.3% 1.3%Farm 1.0 0.8Information, finance, real estate 7.9 0.6Government 10.2 0.7Manufacturing and transportation 22.1 1.6Business and education 10.0 0.5Health and social services 12.9 1.0Forestry, mining, utilities 1.4 1.5Wholesale and retail trade 13.9 0.9Other services 14.3 0.9Total jobs - 0.9
REVENUES AND EXPENDITURES
Revenue Collections (millions)State sales & use tax (est. 2011) $93.0Individual income tax (2010) 58.1 State motor fuel tax (est. 2011) 11.8Local property tax (2008) 129.6
State Expenditures (millions)Education (2011) $ 67.0Medicaid (2011) 101.3State payroll (2011) 11.5
Number of state employees (2011) 206
LAND USE Equalized assessed value 2009 1999-09 (millions) changeFarm $ 125.1 -7.5%Residential 1,026.0 53.6Industrial 109.2 35.6Commercial 388.1 41.2Total $1,648.3 42.3%
2007 1997-07 changeNumber of farms 708 6.5%Acres of farms 290,603 -10.0
Foreign-owned Parcels Acresagricultural land (2010) 19 2,562
ELECTIONS
Primary Dem. Rep. Total2002 10,602 9,892 20,7912004 10,665 6,527 17,6042006 3,377 5,215 8,5942008 15,384 11,048 26,9932010 5,269 7,938 13,3032012 6,200 9,499 15,745
Registered Number Percent General voters voting voting2002 76,170 38,488 50.5%2004 78,737 52,029 66.12006 84,882 35,480 41.82008 73,597 51,644 70.22010 72,975 37,186 51.02012 76,201 49,308 64.7
Office Dem. Rep.2002 Governor 49.4% 48.8%2004 President 45.1 54.32006 Governor 40.8 47.22008 President 49.8 48.72010 Governor 32.8 60.12012 President 46.6 51.8

Illinois County Data Book / 71
Macoupin CountyCongressional District: 13Senate Districts: 48, 50House Districts: 95, 100County Seat: CarlinvilleEstablished: January 17, 1829Area: 864 square miles
POPULATION
2000 Census 49,0192010 Census 47,765Percent change (2000-2010) -2.6%
Race (2010)White (non-Hispanic) 97.0%Black or African American 0.8American Indian or Alaskan Native 0.2Asian and Pacific Islander 0.3
Hispanic origin, any race 0.9%
Age (2010)Under 18 22.6%18 to 64 60.365 and over 17.1Median age (2010) 41.7 years
Education (age 25 or over) (2010)12 or more years 86.8%16 or more years 15.0
Single female households with children < 18 (2010) 8.0%Single male households with children < 18 (2010) 4.2Children under 18 in poverty (2010) 17.4
ECONOMY 2010 2000-10 changeIncome per capita $34,484 42.4%
Labor Force 23,969 -1.7%Unemployed 10.6% 135.6
Under $25,000- $100,000 Annual household $25,000 $99,999 and overincome (2010) 26.1% 60.8% 13.1%
% of total jobsJobs by Industry (2010) county stateConstruction 7.1% 0.4%Farm 7.0 1.5Information, finance, real estate 9.8 0.2Government 15.9 0.3Manufacturing and transportation 8.7 0.2Business and education 3.3 0.0Health and social services 0.0 0.0Forestry, mining, utilities 0.5 0.1Wholesale and retail trade 17.4 0.3Other services 14.2 0.2Total jobs - 0.2
REVENUES AND EXPENDITURES
Revenue Collections (millions)State sales & use tax (est. 2011) $21.2Individual income tax (2010) 22.1 State motor fuel tax (est. 2011) 4.7Local property tax (2008) 37.3
State Expenditures (millions)Education (2011) $41.6Medicaid (2011) 37.6State payroll (2011) 43.2
Number of state employees (2011) 787
LAND USE Equalized assessed value 2009 1999-09 (millions) changeFarm $ 107.6 -5.9%Residential 374.9 77.4Industrial 13.0 77.2Commercial 68.6 57.0Total $564.1 49.8%
2007 1997-07 changeNumber of farms 1,187 -1.6%Acres of farms 394,228 -0.4
Foreign-owned Parcels Acresagricultural land (2010) 10 1,276
ELECTIONS
Primary Dem. Rep. Total2002 5,071 2,273 7,3632004 7,612 2,193 10,8162006 7,815 1,473 9,2892008 7,215 3,209 10,4402010 4,888 2,789 8,1072012 4,313 3,126 7,498
Registered Number Percent General voters voting voting2002 35,024 16,443 46.9%2004 34,818 22,925 65.82006 34,560 17,693 51.22008 32,910 22,606 68.72010 34,443 16,809 48.82012 31,882 21,236 66.6
Office Dem. Rep.2002 Governor 55.5% 41.9%2004 President 49.1 50.12006 Governor 45.2 47.02008 President 54.0 44.22010 Governor 36.8 56.52012 President 45.0 52.1
72 / Illinois County Data Book
Madison CountyCongressional Districts: 12, 13, 15Senate Districts: 48, 50, 54, 56, 57House Districts: 95, 100, 108, 111-113County Seat: EdwardsvilleEstablished: September 14, 1812Area: 725 square miles
POPULATION
2000 Census 258,9412010 Census 269,282Percent change (2000-2010) 4.0%
Race (2010)White (non-Hispanic) 86.7%Black or African American 7.8American Indian or Alaskan Native 0.2Asian and Pacific Islander 0.9
Hispanic origin, any race 2.7%
Age (2010)Under 18 22.7%18 to 64 63.065 and over 14.3Median age (2010) 38.6 years
Education (age 25 or over) (2010)12 or more years 89.4%16 or more years 23.0
Single female households with children < 18 (2010) 10.2%Single male households with children < 18 (2010) 3.8Children under 18 in poverty (2010) 19.3
ECONOMY 2010 2000-10 changeIncome per capita $36,781 37.7%
Labor Force 138,104 4.1%Unemployed 9.9% 125.0
Under $25,000- $100,000 Annual household $25,000 $99,999 and overincome (2010) 23.5% 58.2% 18.2%
% of total jobsJobs by Industry (2010) county stateConstruction 6.6% 2.6%Farm 1.2 1.9Information, finance, real estate 9.8 1.4Government 13.8 1.9Manufacturing and transportation 14.0 2.0Business and education 10.7 1.0Health and social services 11.8 1.8Forestry, mining, utilities 0.8 1.6Wholesale and retail trade 14.6 1.8Other services 16.8 2.1Total jobs - 1.7
REVENUES AND EXPENDITURES
Revenue Collections (millions)State sales & use tax (est. 2011) $201.5Individual income tax (2010) 148.1 State motor fuel tax (est. 2011) 29.2Local property tax (2008) 340.8
State Expenditures (millions)Education (2011) $140.6Medicaid (2011) 204.6State payroll (2011) 72.0
Number of state employees (2011) 1,181
LAND USE Equalized assessed value 2009 1999-09 (millions) changeFarm $ 152.8 250.9%Residential 3,423.6 90.1Industrial 302.9 27.7Commercial 1,063.0 125.0Total $4,942.3 93.5%
2007 1997-07 changeNumber of farms 1,229 2.8%Acres of farms 312,936 10.3
Foreign-owned Parcels Acresagricultural land (2010) 6 711
ELECTIONS
Primary Dem. Rep. Total2002 26,612 13,179 42,6602004 22,401 8,008 31,8632006 14,499 9,981 27,1012008 40,758 19,454 60,4032010 13,023 14,224 27,3832012 9,958 18,768 28,914
Registered Number Percent General voters voting voting2002 165,301 79,631 48.2%2004 185,466 124,468 67.12006 172,933 80,580 46.62008 178,014 129,880 73.02010 177,371 83,208 46.92012 179,256 123,834 69.1
Office Dem. Rep.2002 Governor 56.0% 42.1%2004 President 51.3 48.02006 Governor 55.3 39.32008 President 53.7 44.62010 Governor 40.3 54.12012 President 48.1 49.5

Illinois County Data Book / 73
Marion CountyCongressional District: 15Senate District: 54House District: 107County Seat: SalemEstablished: January 24, 1823Area: 572 square miles
POPULATION
2000 Census 41,6912010 Census 39,437Percent change (2000-2010) -5.4%
Race (2010)White (non-Hispanic) 92.4%Black or African American 3.9American Indian or Alaskan Native 0.3Asian and Pacific Islander 0.6
Hispanic origin, any race 1.4%
Age (2010)Under 18 23.4%18 to 64 59.065 and over 17.6Median age (2010) 41.4 years
Education (age 25 or over) (2010)12 or more years 84.1%16 or more years 13.6
Single female households with children < 18 (2010) 11.6%Single male households with children < 18 (2010) 4.1Children under 18 in poverty (2010) 23.9
ECONOMY 2010 2000-10 changeIncome per capita $32,614 43.2%
Labor Force 18,320 -11.6%Unemployed 12.2% 110.3
Under $25,000- $100,000 Annual household $25,000 $99,999 and overincome (2010) 32.3% 58.2% 9.5%
% of total jobsJobs by Industry (2010) county stateConstruction 4.6% 0.3%Farm 5.3 1.2Information, finance, real estate 6.9 0.1Government 14.0 0.3Manufacturing and transportation 19.5 0.4Business and education 2.6 0.0Health and social services 17.6 0.4Forestry, mining, utilities 3.3 1.0Wholesale and retail trade 11.5 0.2Other services 12.0 0.2Total jobs - 0.2
REVENUES AND EXPENDITURES
Revenue Collections (millions)State sales & use tax (est. 2011) $22.3Individual income tax (2010) 15.6 State motor fuel tax (est. 2011) 3.9Local property tax (2008) 30.2
State Expenditures (millions)Education (2011) $37.4Medicaid (2011) 53.9State payroll (2011) 44.7
Number of state employees (2011) 870
LAND USE Equalized assessed value 2009 1999-09 (millions) changeFarm $ 50.2 16.0%Residential 185.9 41.8Industrial 47.7 118.6Commercial 78.2 45.7Total $362.0 44.9%
2007 1997-07 changeNumber of farms 1,077 22.1%Acres of farms 260,679 4.5
Foreign-owned Parcels Acresagricultural land (2010) 1 204
ELECTIONS
Primary Dem. Rep. Total2002 6,486 2,607 9,7742004 4,386 1,717 6,2622006 2,170 1,708 4,2592008 6,069 3,129 9,2332010 4,529 2,194 6,7442012 1,133 2,797 3,958
Registered Number Percent General voters voting voting2002 30,353 13,595 44.8%2004 30,672 17,304 56.42006 30,063 12,629 42.02008 26,084 17,562 67.32010 28,274 12,227 43.22012 24,817 15,952 64.3
Office Dem. Rep.2002 Governor 54.5% 42.8%2004 President 44.7 54.72006 Governor 41.5 51.22008 President 48.1 50.12010 Governor 34.7 58.52012 President 39.5 58.7

74 / Illinois County Data Book
Marshall CountyCongressional District: 18Senate District: 37House District: 73County Seat: LaconEstablished: January 19, 1839Area: 386 square miles
POPULATION
2000 Census 13,1802010 Census 12,640Percent change (2000-2010) -4.1%
Race (2010)White (non-Hispanic) 95.9%Black or African American 0.3American Indian or Alaskan Native 0.1Asian and Pacific Islander 0.4
Hispanic origin, any race 2.5%
Age (2010)Under 18 21.7%18 to 64 58.865 and over 19.5Median age (2010) 44.8 years
Education (age 25 or over) (2010)12 or more years 90.2%16 or more years 17.1
Single female households with children < 18 (2010) 6.5%Single male households with children < 18 (2010) 3.4Children under 18 in poverty (2010) 11.4
ECONOMY 2010 2000-10 changeIncome per capita $38,655 45.1%
Labor Force 6,968 -0.5%Unemployed 9.9% 135.7
Under $25,000- $100,000 Annual household $25,000 $99,999 and overincome (2010) 24.0% 62.0% 14.0%
% of total jobsJobs by Industry (2010) county stateConstruction 4.8% 0.1%Farm 8.8 0.6Information, finance, real estate 8.0 0.0Government 11.5 0.1Manufacturing and transportation 21.9 0.1Business and education 3.0 0.0Health and social services 9.4 0.1Forestry, mining, utilities 2.5 0.2Wholesale and retail trade 13.7 0.1Other services 14.0 0.1Total jobs - 0.1
REVENUES AND EXPENDITURES
Revenue Collections (millions)State sales & use tax (est. 2011) $5.2Individual income tax (2010) 6.1 State motor fuel tax (est. 2011) 1.0Local property tax (2008) 19.2
State Expenditures (millions)Education (2011) $ 3.0Medicaid (2011) (with Putnam County) 11.5State payroll (2011) 3.4
Number of state employees (2011) 79
LAND USE Equalized assessed value 2009 1999-09 (millions) changeFarm $ 87.0 15.1%Residential 154.9 128.4Industrial 16.5 55.5Commercial 45.8 153.7Total $304.2 76.8%
2007 1997-07 changeNumber of farms 500 1.2%Acres of farms 204,584 -10.1
Foreign-owned Parcels Acresagricultural land (2010) 2 416
ELECTIONS
Primary Dem. Rep. Total2002 994 2,011 3,2032004 818 1,220 2,0632006 421 1,326 1,7782008 1,408 2,035 3,4862010 456 1,453 1,9222012 250 1,643 1,908
Registered Number Percent General voters voting voting2002 8,990 5,122 57.0%2004 9,395 6,641 70.72006 8,736 4,673 53.52008 8,777 6,402 72.92010 8,613 4,379 50.82012 8,454 5,928 70.1
Office Dem. Rep.2002 Governor 40.9% 55.7%2004 President 42.6 56.72006 Governor 35.3 48.52008 President 48.6 49.72010 Governor 26.9 63.42012 President 42.0 56.2
Illinois County Data Book / 75
Mason CountyCongressional District: 18Senate District: 47House District: 93County Seat: HavanaEstablished: January 20, 1841Area: 539 square miles
POPULATION
2000 Census 16,0382010 Census 14,666Percent change (2000-2010) -8.6%
Race (2010)White (non-Hispanic) 97.5%Black or African American 0.4American Indian or Alaskan Native 0.2Asian and Pacific Islander 0.3
Hispanic origin, any race 0.8%
Age (2010)Under 18 22.0%18 to 64 58.965 and over 19.1Median age (2010) 44.0 years
Education (age 25 or over) (2010)12 or more years 83.3%16 or more years 16.5
Single female households with children < 18 (2010) 9.2%Single male households with children < 18 (2010) 4.1Children under 18 in poverty (2010) 23.6
ECONOMY 2010 2000-10 changeIncome per capita $35,690 44.6%
Labor Force 7,629 -3.5%Unemployed 12.7% 115.3
Under $25,000- $100,000 Annual household $25,000 $99,999 and overincome (2010) 26.9% 61.3% 11.8%
% of total jobsJobs by Industry (2010) county stateConstruction 4.6% 0.1%Farm 8.1 0.6Information, finance, real estate 8.9 0.1Government 23.1 0.1Manufacturing and transportation 3.4 0.0Business and education 2.5 0.0Health and social services 6.5 0.0Forestry, mining, utilities 0.0 0.0Wholesale and retail trade 15.4 0.1Other services 14.3 0.1Total jobs - 0.1
REVENUES AND EXPENDITURES
Revenue Collections (millions)State sales & use tax (est. 2011) $ 8.0Individual income tax (2010) 7.0 State motor fuel tax (est. 2011) 1.2Local property tax (2008) 16.9
State Expenditures (millions)Education (2011) $13.1Medicaid (2011) 11.4State payroll (2011) 17.4
Number of state employees (2011) 314
LAND USE Equalized assessed value 2009 1999-09 (millions) changeFarm $ 31.1 -30.8%Residential 99.8 36.8Industrial 27.0 10.6Commercial 18.6 47.0Total $176.5 13.9%
2007 1997-07 changeNumber of farms 447 -8.0%Acres of farms 273,362 -6.2
Foreign-owned Parcels Acresagricultural land (2010) 2 2,204
ELECTIONS
Primary Dem. Rep. Total2002 2,643 1,415 4,0582004 2,289 873 3,1662006 1,086 999 2,0852008 2,476 1,309 3,7862010 933 1,081 2,0152012 1,943 1,184 3,142
Registered Number Percent General voters voting voting2002 10,659 6,137 57.6%2004 11,321 7,345 64.92006 10,611 5,122 48.32008 10,527 6,889 65.42010 10,510 4,995 47.52012 10,422 6,348 60.9
Office Dem. Rep.2002 Governor 50.1% 47.2%2004 President 44.8 54.42006 Governor 37.9 48.12008 President 52.0 46.12010 Governor 32.6 58.12012 President 45.7 52.1

76 / Illinois County Data Book
Massac CountyCongressional District: 15Senate District: 59House District: 118County Seat: MetropolisEstablished: February 8, 1843Area: 239 square miles
POPULATION
2000 Census 15,1612010 Census 15,429Percent change (2000-2010) 1.8%
Race (2010)White (non-Hispanic) 89.8%Black or African American 5.8American Indian or Alaskan Native 0.4Asian and Pacific Islander 0.3
Hispanic origin, any race 1.9%
Age (2010)Under 18 22.8%18 to 64 58.865 and over 18.4Median age (2010) 42.1 years
Education (age 25 or over) (2010)12 or more years 85.0%16 or more years 14.1
Single female households with children < 18 (2010) 10.3%Single male households with children < 18 (2010) 3.4Children under 18 in poverty (2010) 21.5
ECONOMY 2010 2000-10 changeIncome per capita $30,407 42.3%
Labor Force 7,478 3.7%Unemployed 9.5% 75.9
Under $25,000- $100,000 Annual household $25,000 $99,999 and overincome (2010) 29.1% 62.8% 8.0%
% of total jobsJobs by Industry (2010) county stateConstruction 4.4% 0.1%Farm 6.3 0.5Information, finance, real estate 6.0 0.0Government 17.4 0.1Manufacturing and transportation 11.3 0.1Business and education 1.9 0.0Health and social services 0.0 0.0Forestry, mining, utilities 0.9 0.1Wholesale and retail trade 8.0 0.0Other services 6.9 0.0Total jobs - 0.1
REVENUES AND EXPENDITURES
Revenue Collections (millions)State sales & use tax (est. 2011) $ 6.1Individual income tax (2010) 5.8 State motor fuel tax (est. 2011) 1.1Local property tax (2008) 12.3
State Expenditures (millions)Education (2011) $11.0Medicaid (2011) 16.6State payroll (2011) 7.1
Number of state employees (2011) 142
LAND USE Equalized assessed value 2009 1999-09 (millions) changeFarm $ 21.9 7.7%Residential 90.0 50.0Industrial 35.4 4.9Commercial 40.2 138.8Total $187.6 43.2%
2007 1997-07 changeNumber of farms 400 0.0%Acres of farms 89,693 -13.6
Foreign-owned Parcels Acresagricultural land (2010) 2 2,345
ELECTIONS
Primary Dem. Rep. Total2002 1,247 1,753 3,0052004 1,043 1,922 2,9762006 700 2,155 2,8552008 2,090 2,258 4,3482010 665 1,636 2,3032012 403 1,744 2,152
Registered Number Percent General voters voting voting2002 10,928 5,569 51.0%2004 12,045 7,506 62.32006 12,688 5,447 42.92008 11,759 7,320 62.32010 12,350 5,047 40.92012 10,756 6,590 61.3
Office Dem. Rep.2002 Governor 53.7% 45.2%2004 President 37.8 61.72006 Governor 55.4 36.32008 President 37.5 60.82010 Governor 30.9 64.82012 President 32.2 65.9

Illinois County Data Book / 77
Menard CountyCongressional District: 18Senate District: 44House District: 87County Seat: PetersburgEstablished: February 15, 1839Area: 314 square miles
POPULATION
2000 Census 12,4862010 Census 12,705Percent change (2000-2010) 1.8%
Race (2010)White (non-Hispanic) 97.0%Black or African American 0.6American Indian or Alaskan Native 0.2Asian and Pacific Islander 0.2
Hispanic origin, any race 1.0%
Age (2010)Under 18 23.6%18 to 64 60.865 and over 15.6Median age (2010) 42.6 years
Education (age 25 or over) (2010)12 or more years 90.3%16 or more years 24.2
Single female households with children < 18 (2010) 8.7%Single male households with children < 18 (2010) 4.0Children under 18 in poverty (2010) 10.4
ECONOMY 2010 2000-10 changeIncome per capita $39,163 40.0%
Labor Force 7,074 0.9%Unemployed 7.9% 119.4
Under $25,000- $100,000 Annual household $25,000 $99,999 and overincome (2010) 19.2% 61.7% 19.1%
% of total jobsJobs by Industry (2010) county stateConstruction 9.0% 0.1%Farm 11.2 0.6Information, finance, real estate 9.4 0.0Government 19.4 0.1Manufacturing and transportation 1.7 0.0Business and education 8.8 0.0Health and social services 0.0 0.0Forestry, mining, utilities 0.0 0.0Wholesale and retail trade 15.5 0.1Other services 13.6 0.1Total jobs - 0.1
REVENUES AND EXPENDITURES
Revenue Collections (millions)State sales & use tax (est. 2011) $ 3.9Individual income tax (2010) 7.4 State motor fuel tax (est. 2011) 1.0Local property tax (2008) 16.0
State Expenditures (millions)Education (2011) $9.5Medicaid (2011) (with DeWitt & Logan Counties) 48.4State payroll (2011) 49.1
Number of state employees (2011) 850
LAND USE Equalized assessed value 2009 1999-09 (millions) changeFarm $ 56.4 -9.8%Residential 147.8 60.9Industrial 2.7 -4.8Commercial 16.0 67.4Total $222.9 33.6%
2007 1997-07 changeNumber of farms 411 16.8%Acres of farms 168,594 -1.0
Foreign-owned Parcels Acresagricultural land (2010) 1 301
ELECTIONS
Primary Dem. Rep. Total2002 645 3,355 4,0792004 629 3,137 3,7832006 289 1,701 1,9902008 1,215 1,970 3,2222010 459 1,616 2,0832012 190 1,657 1,847
Registered Number Percent General voters voting voting2002 8,584 5,769 67.2%2004 9,433 6,622 70.22006 8,954 5,183 57.92008 9,594 6,531 68.12010 9,744 4,951 50.82012 8,751 6,213 71.0
Office Dem. Rep.2002 Governor 37.3% 60.7%2004 President 32.5 67.12006 Governor 17.3 70.92008 President 41.9 56.82010 Governor 27.2 65.02012 President 34.1 64.2

78 / Illinois County Data Book
Mercer CountyCongressional District: 17Senate District: 37House District: 74County Seat: AledoEstablished: January 13, 1825Area: 561 square miles
POPULATION
2000 Census 16,9572010 Census 16,434Percent change (2000-2010) -3.1%
Race (2010)White (non-Hispanic) 96.8%Black or African American 0.3American Indian or Alaskan Native 0.1Asian and Pacific Islander 0.3
Hispanic origin, any race 1.9%
Age (2010)Under 18 22.6%18 to 64 59.165 and over 18.3Median age (2010) 43.7 years
Education (age 25 or over) (2010)12 or more years 88.7%16 or more years 14.5
Single female households with children < 18 (2010) 6.3%Single male households with children < 18 (2010) 3.3Children under 18 in poverty (2010) 14.9
ECONOMY 2010 2000-10 changeIncome per capita $37,153 50.6%
Labor Force 8,745 -1.1%Unemployed 10.8% 92.9
Under $25,000- $100,000 Annual household $25,000 $99,999 and overincome (2010) 19.3% 67.0% 13.7%
% of total jobsJobs by Industry (2010) county stateConstruction 5.4% 0.1%Farm 12.9 0.9Information, finance, real estate 10.8 0.1Government 21.2 0.1Manufacturing and transportation 9.0 0.1Business and education 7.1 0.0Health and social services 4.8 0.0Forestry, mining, utilities 1.4 0.1Wholesale and retail trade 12.1 0.1Other services 13.0 0.1Total jobs - 0.1
REVENUES AND EXPENDITURES
Revenue Collections (millions)State sales & use tax (est. 2011) $ 5.9Individual income tax (2010) 9.0 State motor fuel tax (est. 2011) 1.3Local property tax (2008) 19.3
State Expenditures (millions)Education (2011) $5.9Medicaid (2011) 5.3State payroll (2011) 4.1
Number of state employees (2011) 80
LAND USE Equalized assessed value 2009 1999-09 (millions) changeFarm $ 79.0 -4.3%Residential 131.6 67.0Industrial 0.2 -16.5Commercial 28.4 106.7Total $239.2 36.4%
2007 1997-07 changeNumber of farms 785 4.1%Acres of farms 306,306 -1.1
Foreign-owned Parcels Acresagricultural land (2010) 0 0
ELECTIONS
Primary Dem. Rep. Total2002 1,371 1,436 2,8242004 2,130 1,420 3,6882006 1,010 1,194 2,2352008 2,682 1,526 4,2162010 1,050 1,274 2,3482012 1,461 2,137 3,896
Registered Number Percent General voters voting voting2002 13,080 7,119 54.4%2004 14,325 9,217 64.32006 14,145 6,363 45.02008 14,087 8,943 63.52010 14,295 6,892 48.22012 12,020 8,652 72.0
Office Dem. Rep.2002 Governor 45.8% 51.2%2004 President 50.3 49.12006 Governor 51.4 42.82008 President 55.2 43.32010 Governor 35.9 55.52012 President 52.8 45.4

Illinois County Data Book / 79
Monroe CountyCongressional District: 12Senate District: 58House District: 116County Seat: WaterlooEstablished: January 6, 1816Area: 388 square miles
POPULATION
2000 Census 27,6192010 Census 32,957Percent change (2000-2010) 19.3%
Race (2010)White (non-Hispanic) 97.1%Black or African American 0.2American Indian or Alaskan Native 0.2Asian and Pacific Islander 0.4
Hispanic origin, any race 1.4%
Age (2010)Under 18 24.5%18 to 64 61.465 and over 14.1Median age (2010) 41.0 years
Education (age 25 or over) (2010)12 or more years 91.0%16 or more years 24.7
Single female households with children < 18 (2010) 5.6%Single male households with children < 18 (2010) 2.9Children under 18 in poverty (2010) 4.3
ECONOMY 2010 2000-10 changeIncome per capita $41,909 35.2%
Labor Force 18,238 17.6%Unemployed 7.9% 139.4
Under $25,000- $100,000 Annual household $25,000 $99,999 and overincome (2010) 14.6% 56.0% 29.4%
% of total jobsJobs by Industry (2010) county stateConstruction 6.6% 0.3%Farm 4.9 0.8Information, finance, real estate 15.3 0.2Government 12.0 0.2Manufacturing and transportation 2.7 0.0Business and education 8.8 0.1Health and social services 7.5 0.1Forestry, mining, utilities 1.4 0.3Wholesale and retail trade 13.9 0.2Other services 18.8 0.2Total jobs - 0.2
REVENUES AND EXPENDITURES
Revenue Collections (millions)State sales & use tax (est. 2011) $23.8Individual income tax (2010) 24.3 State motor fuel tax (est. 2011) 4.9Local property tax (2008) 47.5
State Expenditures (millions)Education (2011) $ 9.5Medicaid (2011) (with Randolph County) 32.8State payroll (2011) 8.0
Number of state employees (2011) 151
LAND USE Equalized assessed value 2009 1999-09 (millions) changeFarm $ 81.3 50.2%Residential 625.0 134.9Industrial 15.4 112.6Commercial 105.6 94.6Total $827.4 116.7%
2007 1997-07 changeNumber of farms 678 21.9%Acres of farms 178,134 -4.6
Foreign-owned Parcels Acresagricultural land (2010) 0 0
ELECTIONS
Primary Dem. Rep. Total2002 1,666 1,830 3,4962004 1,337 1,334 2,6712006 1,931 2,701 6,4942008 4,272 3,655 8,0652010 1,271 2,914 4,2762012 1,191 3,080 4,501
Registered Number Percent General voters voting voting2002 20,886 10,711 51.3%2004 21,992 16,708 76.02006 22,375 11,127 49.72008 24,280 18,241 75.12010 23,792 12,037 50.62012 23,827 17,582 73.8
Office Dem. Rep.2002 Governor 46.5% 51.5%2004 President 41.5 57.82006 Governor 49.5 45.72008 President 44.0 54.62010 Governor 32.3 64.02012 President 35.7 62.5
80 / Illinois County Data Book
Montgomery CountyCongressional District: 13Senate District: 48House District: 95County Seat: HillsboroEstablished: February 12, 1821Area: 704 square miles
POPULATION
2000 Census 30,6522010 Census 30,104Percent change (2000-2010) -1.8%
Race (2010)White (non-Hispanic) 94.1%Black or African American 3.2American Indian or Alaskan Native 0.1Asian and Pacific Islander 0.4
Hispanic origin, any race 1.5%
Age (2010)Under 18 21.2%18 to 64 61.565 and over 17.3Median age (2010) 41.9 years
Education (age 25 or over) (2010)12 or more years 83.5%16 or more years 13.3
Single female households with children < 18 (2010) 8.9%Single male households with children < 18 (2010) 4.4Children under 18 in poverty (2010) 22.7
ECONOMY 2010 2000-10 changeIncome per capita $31,713 42.4%
Labor Force 13,641 -3.6%Unemployed 13.3% 133.3
Under $25,000- $100,000 Annual household $25,000 $99,999 and overincome (2010) 30.1% 58.9% 11.0%
% of total jobsJobs by Industry (2010) county stateConstruction 5.1% 0.2%Farm 7.3 1.2Information, finance, real estate 9.5 0.1Government 14.1 0.2Manufacturing and transportation 7.0 0.1Business and education 6.6 0.1Health and social services 0.0 0.0Forestry, mining, utilities 5.3 1.2Wholesale and retail trade 17.4 0.2Other services 13.3 0.2Total jobs - 0.2
REVENUES AND EXPENDITURES
Revenue Collections (millions)State sales & use tax (est. 2011) $22.7Individual income tax (2010) 13.6 State motor fuel tax (est. 2011) 4.1Local property tax (2008) 30.5
State Expenditures (millions)Education (2011) $18.2Medicaid (2011) 29.9State payroll (2011) 42.5
Number of state employees (2011) 731
LAND USE Equalized assessed value 2009 1999-09 (millions) changeFarm $ 84.3 -11.3%Residential 163.2 61.7Industrial 73.2 45.7Commercial 78.8 81.7Total $399.5 37.9%
2007 1997-07 changeNumber of farms 1,029 5.0%Acres of farms 347,765 -3.7
Foreign-owned Parcels Acresagricultural land (2010) 5 1,261
ELECTIONS
Primary Dem. Rep. Total2002 3,010 1,953 4,9892004 3,004 1,683 5,0072006 1,221 1,335 2,5562008 3,723 2,378 6,1702010 2,235 2,334 5,2232012 1,270 2,253 3,624
Registered Number Percent General voters voting voting2002 21,021 10,613 50.5%2004 18,066 13,387 74.12006 18,105 11,213 61.92008 19,055 13,039 68.42010 18,162 9,911 54.62012 18,344 12,314 67.1
Office Dem. Rep.2002 Governor 55.0% 42.9%2004 President 46.2 53.02006 Governor 36.8 53.42008 President 50.4 47.82010 Governor 33.9 58.92012 President 41.7 55.8
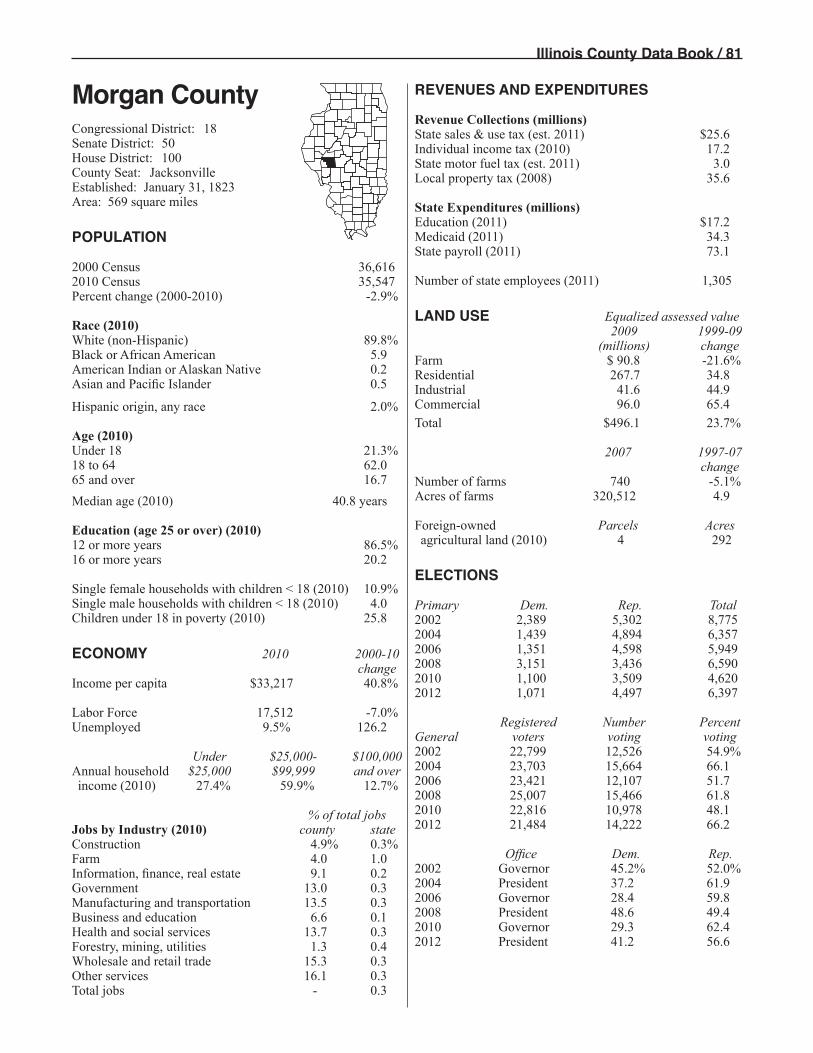
Illinois County Data Book / 81
Morgan CountyCongressional District: 18Senate District: 50House District: 100County Seat: JacksonvilleEstablished: January 31, 1823Area: 569 square miles
POPULATION
2000 Census 36,6162010 Census 35,547Percent change (2000-2010) -2.9%
Race (2010)White (non-Hispanic) 89.8%Black or African American 5.9American Indian or Alaskan Native 0.2Asian and Pacific Islander 0.5
Hispanic origin, any race 2.0%
Age (2010)Under 18 21.3%18 to 64 62.065 and over 16.7Median age (2010) 40.8 years
Education (age 25 or over) (2010)12 or more years 86.5%16 or more years 20.2
Single female households with children < 18 (2010) 10.9%Single male households with children < 18 (2010) 4.0Children under 18 in poverty (2010) 25.8
ECONOMY 2010 2000-10 changeIncome per capita $33,217 40.8%
Labor Force 17,512 -7.0%Unemployed 9.5% 126.2
Under $25,000- $100,000 Annual household $25,000 $99,999 and overincome (2010) 27.4% 59.9% 12.7%
% of total jobsJobs by Industry (2010) county stateConstruction 4.9% 0.3%Farm 4.0 1.0Information, finance, real estate 9.1 0.2Government 13.0 0.3Manufacturing and transportation 13.5 0.3Business and education 6.6 0.1Health and social services 13.7 0.3Forestry, mining, utilities 1.3 0.4Wholesale and retail trade 15.3 0.3Other services 16.1 0.3Total jobs - 0.3
REVENUES AND EXPENDITURES
Revenue Collections (millions)State sales & use tax (est. 2011) $25.6Individual income tax (2010) 17.2 State motor fuel tax (est. 2011) 3.0Local property tax (2008) 35.6
State Expenditures (millions)Education (2011) $17.2Medicaid (2011) 34.3State payroll (2011) 73.1
Number of state employees (2011) 1,305
LAND USE Equalized assessed value 2009 1999-09 (millions) changeFarm $ 90.8 -21.6%Residential 267.7 34.8Industrial 41.6 44.9Commercial 96.0 65.4Total $496.1 23.7%
2007 1997-07 changeNumber of farms 740 -5.1%Acres of farms 320,512 4.9
Foreign-owned Parcels Acresagricultural land (2010) 4 292
ELECTIONS
Primary Dem. Rep. Total2002 2,389 5,302 8,7752004 1,439 4,894 6,3572006 1,351 4,598 5,9492008 3,151 3,436 6,5902010 1,100 3,509 4,6202012 1,071 4,497 6,397
Registered Number Percent General voters voting voting2002 22,799 12,526 54.9%2004 23,703 15,664 66.12006 23,421 12,107 51.72008 25,007 15,466 61.82010 22,816 10,978 48.12012 21,484 14,222 66.2
Office Dem. Rep.2002 Governor 45.2% 52.0%2004 President 37.2 61.92006 Governor 28.4 59.82008 President 48.6 49.42010 Governor 29.3 62.42012 President 41.2 56.6

82 / Illinois County Data Book
Moultrie CountyCongressional District: 15Senate District: 51House District: 102County Seat: SullivanEstablished: February 16, 1843Area: 336 square miles
POPULATION
2000 Census 14,2872010 Census 14,846Percent change (2000-2010) 3.9%
Race (2010)White (non-Hispanic) 97.8%Black or African American 0.3American Indian or Alaskan Native 0.2Asian and Pacific Islander 0.2
Hispanic origin, any race 0.9%
Age (2010)Under 18 24.9%18 to 64 57.465 and over 17.6Median age (2010) 40.3 years
Education (age 25 or over) (2010)12 or more years 83.8%16 or more years 13.8
Single female households with children < 18 (2010) 7.7%Single male households with children < 18 (2010) 3.5Children under 18 in poverty (2010) 17.2
ECONOMY 2010 2000-10 changeIncome per capita $35,321 47.9%
Labor Force 7,953 6.7%Unemployed 8.8% 109.5
Under $25,000- $100,000 Annual household $25,000 $99,999 and overincome (2010) 22.9% 63.7% 13.4%
% of total jobsJobs by Industry (2010) county stateConstruction 7.8% 0.2%Farm 8.0 0.6Information, finance, real estate 7.4 0.1Government 10.7 0.1Manufacturing and transportation 18.8 0.1Business and education 6.0 0.0Health and social services 0.0 0.0Forestry, mining, utilities 0.0 0.0Wholesale and retail trade 13.2 0.1Other services 14.1 0.1Total jobs - 0.1
REVENUES AND EXPENDITURES
Revenue Collections (millions)State sales & use tax (est. 2011) $ 7.6Individual income tax (2010) 7.9 State motor fuel tax (est. 2011) 1.2Local property tax (2008) 16.3
State Expenditures (millions)Education (2011) $ 7.7Medicaid (2011) (with Piatt County) 20.1State payroll (2011) 4.0
Number of state employees (2011) 94
LAND USE Equalized assessed value 2009 1999-09 (millions) changeFarm $ 77.8 -13.6%Residential 93.9 53.7Industrial 5.4 28.1Commercial 33.1 66.1Total $210.2 19.9%
2007 1997-07 changeNumber of farms 520 12.1%Acres of farms 167,791 -2.8
Foreign-owned Parcels Acresagricultural land (2010) 10 2,639
ELECTIONS
Primary Dem. Rep. Total2002 1,913 1,506 3,4632004 1,018 1,199 2,2172006 499 965 1,4702008 1,621 1,381 3,0112010 898 1,309 2,2392012 432 1,663 2,095
Registered Number Percent General voters voting voting2002 8,630 5,349 62.0%2004 9,857 6,515 66.12006 9,295 4,952 53.32008 8,782 6,312 71.92010 8,904 4,964 55.82012 8,672 6,114 70.5
Office Dem. Rep.2002 Governor 44.4% 53.0%2004 President 36.9 62.32006 Governor 35.0 50.32008 President 42.6 55.42010 Governor 23.2 69.42012 President 35.4 62.5

Illinois County Data Book / 83
Ogle CountyCongressional District: 16Senate District: 45House Districts: 89, 90County Seat: OregonEstablished: January 16, 1836Area: 759 square miles
POPULATION
2000 Census 51,0322010 Census 53,497Percent change (2000-2010) 4.8%
Race (2010)White (non-Hispanic) 88.6%Black or African American 0.9American Indian or Alaskan Native 0.2Asian and Pacific Islander 0.5
Hispanic origin, any race 8.9%
Age (2010)Under 18 24.8%18 to 64 60.165 and over 15.2Median age (2010) 40.7 years
Education (age 25 or over) (2010)12 or more years 87.4%16 or more years 17.8
Single female households with children < 18 (2010) 8.5%Single male households with children < 18 (2010) 4.0Children under 18 in poverty (2010) 12.4
ECONOMY 2010 2000-10 changeIncome per capita $33,578 27.5%
Labor Force 27,496 1.9%Unemployed 13.6% 209.1
Under $25,000- $100,000 Annual household $25,000 $99,999 and overincome (2010) 18.9% 65.0% 16.1%
% of total jobsJobs by Industry (2010) county stateConstruction 5.8% 0.4%Farm 5.2 1.6Information, finance, real estate 9.7 0.3Government 13.4 0.4Manufacturing and transportation 22.1 0.6Business and education 4.3 0.1Health and social services 7.0 0.2Forestry, mining, utilities 0.9 0.4Wholesale and retail trade 11.0 0.3Other services 11.3 0.3Total jobs - 0.3
REVENUES AND EXPENDITURES
Revenue Collections (millions)State sales & use tax (est. 2011) $ 23.2Individual income tax (2010) 27.9 State motor fuel tax (est. 2011) 4.9Local property tax (2008) 111.5
State Expenditures (millions)Education (2011) $27.3Medicaid (2011) (with Lee County) 59.5State payroll (2011) 18.1
Number of state employees (2011) 314
LAND USE Equalized assessed value 2009 1999-09 (millions) changeFarm $ 177.8 3.5%Residential 692.7 67.1Industrial 548.2 8.4Commercial 103.8 60.2Total $1,522.6 31.6%
2007 1997-07 changeNumber of farms 1,274 15.9%Acres of farms 366,470 -3.4
Foreign-owned Parcels Acresagricultural land (2010) 24 6,485
ELECTIONS
Primary Dem. Rep. Total2002 1,950 9,121 11,1702004 2,487 6,950 9,4562006 1,594 9,185 11,1932008 5,383 7,842 13,3222010 1,287 7,502 8,8812012 880 9,005 9,937
Registered Number Percent General voters voting voting2002 34,396 15,738 45.8%2004 36,472 24,207 66.42006 36,994 16,223 43.92008 40,453 25,062 62.02010 40,973 17,461 42.62012 34,994 23,533 67.2
Office Dem. Rep.2002 Governor 37.4% 57.7%2004 President 37.4 61.92006 Governor 31.5 44.72008 President 45.3 52.92010 Governor 26.4 65.82012 President 40.7 57.4

84 / Illinois County Data Book
Peoria CountyCongressional Districts: 17, 18Senate Districts: 37, 46House Districts: 73, 91, 92County Seat: PeoriaEstablished: January 13, 1825Area: 620 square miles
POPULATION
2000 Census 183,4332010 Census 186,494Percent change (2000-2010) 1.7%
Race (2010)White (non-Hispanic) 72.7%Black or African American 17.5American Indian or Alaskan Native 0.2Asian and Pacific Islander 3.2
Hispanic origin, any race 3.8%
Age (2010)Under 18 24.1%18 to 64 62.065 and over 13.9Median age (2010) 36.8 years
Education (age 25 or over) (2010)12 or more years 88.7%16 or more years 28.1
Single female households with children < 18 (2010) 14.1%Single male households with children < 18 (2010) 3.4Children under 18 in poverty (2010) 21.8
ECONOMY 2010 2000-10 changeIncome per capita $42,354 48.5%
Labor Force 97,056 6.3%Unemployed 11.0% 144.4
Under $25,000- $100,000 Annual household $25,000 $99,999 and overincome (2010) 24.7% 57.4% 17.9%
% of total jobsJobs by Industry (2010) county stateConstruction 4.2% 1.6%Farm 0.7 1.0Information, finance, real estate 9.4 1.3Government 9.6 1.3Manufacturing and transportation 9.4 1.3Business and education 19.0 1.8Health and social services 19.6 2.9Forestry, mining, utilities 0.9 1.8Wholesale and retail trade 13.3 1.6Other services 14.0 1.7Total jobs - 1.7
REVENUES AND EXPENDITURES
Revenue Collections (millions)State sales & use tax (est. 2011) $163.1Individual income tax (2010) 114.2 State motor fuel tax (est. 2011) 18.3Local property tax (2008) 257.1
State Expenditures (millions)Education (2011) $ 95.6Medicaid (2011) (with Woodford County) 177.8State payroll (2011) 43.9
Number of state employees (2011) 765
LAND USE Equalized assessed value 2009 1999-09 (millions) changeFarm $ 124.8 18.4%Residential 2,242.1 68.3Industrial 134.8 30.7Commercial 836.3 76.7Total $3,338.0 65.8%
2007 1997-07 changeNumber of farms 877 -5.1%Acres of farms 259,204 -3.0
Foreign-owned Parcels Acresagricultural land (2010) 2 120
ELECTIONS
Primary Dem. Rep. Total2002 14,249 15,234 30,0312004 14,434 12,689 28,0422006 8,159 10,399 18,7722008 22,935 19,832 42,8872010 7,486 14,871 22,6372012 5,431 16,705 22,502
Registered Number Percent General voters voting voting2002 111,963 56,206 50.2%2004 120,530 84,454 70.12006 119,412 55,418 46.42008 124,116 83,008 66.92010 121,725 53,848 44.22012 115,999 79,473 68.5
Office Dem. Rep.2002 Governor 44.2% 53.3%2004 President 49.7 49.62006 Governor 39.8 44.02008 President 56.2 42.32010 Governor 38.2 55.12012 President 51.3 46.9

Illinois County Data Book / 85
Perry CountyCongressional District: 12Senate District: 58House Districts: 115, 116County Seat: PinckneyvilleEstablished: January 29, 1827Area: 441 square miles
POPULATION
2000 Census 23,0942010 Census 22,350Percent change (2000-2010) -3.2%
Race (2010)White (non-Hispanic) 87.1%Black or African American 8.3American Indian or Alaskan Native 0.2Asian and Pacific Islander 0.4
Hispanic origin, any race 2.7%
Age (2010)Under 18 20.7%18 to 64 63.565 and over 15.7Median age (2010) 39.4 years
Education (age 25 or over) (2010)12 or more years 81.5%16 or more years 13.5
Single female households with children < 18 (2010) 10.1%Single male households with children < 18 (2010) 4.0Children under 18 in poverty (2010) 22.6
ECONOMY 2010 2000-10 changeIncome per capita $25,535 41.2%
Labor Force 9,437 -8.4%Unemployed 12.0% 69.0
Under $25,000- $100,000 Annual household $25,000 $99,999 and overincome (2010) 30.9% 61.1% 8.0%
% of total jobsJobs by Industry (2010) county stateConstruction 6.9% 0.2%Farm 6.9 0.7Information, finance, real estate 8.9 0.1Government 16.9 0.1Manufacturing and transportation 11.2 0.1Business and education 4.2 0.0Health and social services 11.4 0.1Forestry, mining, utilities 0.0 0.0Wholesale and retail trade 11.1 0.1Other services 15.3 0.1Total jobs - 0.1
REVENUES AND EXPENDITURES
Revenue Collections (millions)State sales & use tax (est. 2011) $10.4Individual income tax (2010) 8.2 State motor fuel tax (est. 2011) 1.5Local property tax (2008) 13.6
State Expenditures (millions)Education (2011) $14.2Medicaid (2011) 16.4State payroll (2011) 28.3
Number of state employees (2011) 661
LAND USE Equalized assessed value 2009 1999-09 (millions) changeFarm $ 32.7 -6.8%Residential 96.2 43.3Industrial 17.8 29.2Commercial 22.8 33.3Total $169.6 27.4%
2007 1997-07 changeNumber of farms 589 6.9%Acres of farms 200,354 16.5
Foreign-owned Parcels Acresagricultural land (2010) 3 793
ELECTIONS
Primary Dem. Rep. Total2002 2,943 2,179 6,0222004 2,994 1,041 4,1242006 1,723 1,207 3,0082008 3,111 1,683 4,8072010 2,507 1,194 3,7102012 932 1,570 2,532
Registered Number Percent General voters voting voting2002 15,548 8,953 57.6%2004 15,550 10,541 67.82006 14,518 7,926 54.62008 15,054 10,148 67.42010 14,989 7,663 51.12012 14,172 9,685 68.3
Office Dem. Rep.2002 Governor 53.8% 43.4%2004 President 45.8 53.62006 Governor 48.0 36.02008 President 47.0 50.92010 Governor 39.8 51.82012 President 40.0 57.7

86 / Illinois County Data Book
Piatt CountyCongressional District: 13Senate District: 51House District: 101County Seat: MonticelloEstablished: January 27, 1841Area: 440 square miles
POPULATION
2000 Census 16,3652010 Census 16,729Percent change (2000-2010) 2.2%
Race (2010)White (non-Hispanic) 97.3%Black or African American 0.3American Indian or Alaskan Native 0.2Asian and Pacific Islander 0.3
Hispanic origin, any race 1.0%
Age (2010)Under 18 24.0%18 to 64 59.865 and over 16.2Median age (2010) 42.6 years
Education (age 25 or over) (2010)12 or more years 89.8%16 or more years 22.9
Single female households with children < 18 (2010) 6.8%Single male households with children < 18 (2010) 3.0Children under 18 in poverty (2010) 10.8
ECONOMY 2010 2000-10 changeIncome per capita $44,537 44.0%
Labor Force 8,672 -4.1%Unemployed 8.8% 144.4
Under $25,000- $100,000 Annual household $25,000 $99,999 and overincome (2010) 17.2% 64.1% 18.7%
% of total jobsJobs by Industry (2010) county stateConstruction 6.0% 0.1%Farm 7.9 0.6Information, finance, real estate 11.0 0.1Government 17.5 0.1Manufacturing and transportation 4.8 0.0Business and education 9.4 0.0Health and social services 7.9 0.1Forestry, mining, utilities 1.5 0.2Wholesale and retail trade 15.0 0.1Other services 6.4 0.0Total jobs - 0.1
REVENUES AND EXPENDITURES
Revenue Collections (millions)State sales & use tax (est. 2011) $8.2Individual income tax (2010) 10.5 State motor fuel tax (est. 2011) 2.0Local property tax (2008) 24.2
State Expenditures (millions)Education (2011) $6.7Medicaid (2011) (with Moultrie County) 20.1State payroll (2011) 4.5
Number of state employees (2011) 94
LAND USE Equalized assessed value 2009 1999-09 (millions) changeFarm $ 99.2 -9.9%Residential 220.1 81.3Industrial 8.9 48.4Commercial 37.5 105.4Total $365.6 43.0%
2007 1997-07 changeNumber of farms 480 7.1%Acres of farms 267,265 5.5
Foreign-owned Parcels Acresagricultural land (2010) 33 7,327
ELECTIONS
Primary Dem. Rep. Total2002 984 2,896 3,8802004 1,073 1,660 2,8892006 432 2,028 2,4602008 1,973 2,122 4,1132010 674 3,334 4,0242012 547 3,131 3,720
Registered Number Percent General voters voting voting2002 11,768 6,515 55.4%2004 12,097 8,793 72.72006 12,323 6,722 54.52008 11,921 9,065 76.02010 11,990 6,895 57.52012 11,817 8,785 74.3
Office Dem. Rep.2002 Governor 41.0% 56.5%2004 President 36.4 62.82006 Governor 26.4 57.52008 President 42.9 55.52010 Governor 23.9 68.72012 President 35.5 62.2

Illinois County Data Book / 87
Pike CountyCongressional District: 18Senate District: 50House District: 100County Seat: PittsfieldEstablished: January 31, 1821Area: 830 square miles
POPULATION
2000 Census 17,3842010 Census 16,430Percent change (2000-2010) -5.5%
Race (2010)White (non-Hispanic) 96.2%Black or African American 1.7American Indian or Alaskan Native 0.1Asian and Pacific Islander 0.3
Hispanic origin, any race 1.0%
Age (2010)Under 18 22.6%18 to 64 58.365 and over 19.1Median age (2010) 42.5 years
Education (age 25 or over) (2010)12 or more years 86.0%16 or more years 12.7
Single female households with children < 18 (2010) 8.1%Single male households with children < 18 (2010) 4.4Children under 18 in poverty (2010) 23.7
ECONOMY 2010 2000-10 changeIncome per capita $31,695 52.9%
Labor Force 8,688 2.1%Unemployed 8.9% 61.8
Under $25,000- $100,000 Annual household $25,000 $99,999 and overincome (2010) 29.2% 61.4% 9.4%
% of total jobsJobs by Industry (2010) county stateConstruction 6.2% 0.1%Farm 15.5 1.4Information, finance, real estate 11.0 0.1Government 15.1 0.1Manufacturing and transportation 1.4 0.0Business and education 2.4 0.0Health and social services 0.0 0.0Forestry, mining, utilities 0.0 0.0Wholesale and retail trade 16.4 0.1Other services 11.6 0.1Total jobs - 0.1
REVENUES AND EXPENDITURES
Revenue Collections (millions)State sales & use tax (est. 2011) $ 8.6Individual income tax (2010) 6.4 State motor fuel tax (est. 2011) 1.3Local property tax (2008) 14.5
State Expenditures (millions)Education (2011) $13.2Medicaid (2011) (with Scott County) 17.7State payroll (2011) 17.3
Number of state employees (2011) 326
LAND USE Equalized assessed value 2009 1999-09 (millions) changeFarm $ 73.1 -19.4%Residential 71.9 44.2Industrial 10.5 48.7Commercial 30.3 58.9Total $185.8 11.5%
2007 1997-07 changeNumber of farms 967 -5.9%Acres of farms 389,808 -15.5
Foreign-owned Parcels Acresagricultural land (2010) 1 54
ELECTIONS
Primary Dem. Rep. Total2002 2,166 1,810 3,9762004 1,348 1,276 2,6242006 687 1,156 1,8432008 1,780 1,827 3,6172010 850 1,357 2,2322012 1,871 2,169 4,116
Registered Number Percent General voters voting voting2002 11,851 7,289 61.5%2004 12,477 8,334 66.82006 12,397 6,244 50.42008 12,991 7,712 59.42010 11,418 6,525 57.12012 11,851 7,377 62.2
Office Dem. Rep.2002 Governor 42.9% 54.5%2004 President 35.7 63.12006 Governor 37.1 51.62008 President 39.7 58.52010 Governor 23.8 69.02012 President 31.3 66.7

88 / Illinois County Data Book
Pope CountyCongressional District: 15Senate District: 59House District: 118County Seat: GolcondaEstablished: January 10, 1816Area: 371 square miles
POPULATION
2000 Census 4,4132010 Census 4,470Percent change (2000-2010) 1.3%
Race (2010)White (non-Hispanic) 90.7%Black or African American 6.0American Indian or Alaskan Native 0.6Asian and Pacific Islander 0.3
Hispanic origin, any race 1.4%
Age (2010)Under 18 18.2%18 to 64 60.265 and over 21.6Median age (2010) 46.6 years
Education (age 25 or over) (2010)12 or more years 85.1%16 or more years 8.3
Single female households with children < 18 (2010) 6.5%Single male households with children < 18 (2010) 3.1Children under 18 in poverty (2010) 18.4
ECONOMY 2010 2000-10 changeIncome per capita $26,128 40.2%
Labor Force 1,927 -5.3%Unemployed 11.4% 70.1
Under $25,000- $100,000 Annual household $25,000 $99,999 and overincome (2010) 27.2% 65.5% 7.3%
% of total jobsJobs by Industry (2010) county stateConstruction 0.0% 0.0%Farm 23.3 0.4Information, finance, real estate 0.0 0.0Government 22.6 0.0Manufacturing and transportation 11.5 0.0Business and education 1.1 0.0Health and social services 0.0 0.0Forestry, mining, utilities 0.0 0.0Wholesale and retail trade 4.5 0.0Other services 5.7 0.0Total jobs - 0.0
REVENUES AND EXPENDITURES
Revenue Collections (millions)State sales & use tax (est. 2011) $0.8Individual income tax (2010) 1.1 State motor fuel tax (est. 2011) 0.2Local property tax (2008) 2.7
State Expenditures (millions)Education (2011) $2.5Medicaid (2011) (with Hardin County) 8.7State payroll (2011) 4.9
Number of state employees (2011) 85
LAND USE Equalized assessed value 2009 1999-09 (millions) changeFarm $ 17.8 20.8%Residential 19.1 128.8Industrial 0.9 12.8Commercial 0.6 106.8Total $38.5 58.7%
2007 1997-07 changeNumber of farms 346 22.7%Acres of farms 60,809 -15.8
Foreign-owned Parcels Acresagricultural land (2010) 1 976
ELECTIONS
Primary Dem. Rep. Total2002 767 895 1,6622004 594 694 1,2882006 667 605 1,2722008 654 644 1,3042010 502 883 1,3882012 542 692 1,234
Registered Number Percent General voters voting voting2002 3,673 2,159 58.8%2004 3,823 2,464 64.52006 3,535 2,105 59.52008 3,399 2,272 66.82010 3,397 2,089 61.52012 3,021 2,254 74.6
Office Dem. Rep.2002 Governor 49.2% 49.1%2004 President 37.7 61.62006 Governor 51.6 38.72008 President 37.9 60.22010 Governor 28.3 65.42012 President 29.3 68.0

Illinois County Data Book / 89
Pulaski CountyCongressional District: 12Senate District: 59House District: 118County Seat: Mound CityEstablished: March 3, 1843Area: 201 square miles
POPULATION
2000 Census 7,3482010 Census 6,161Percent change (2000-2010) -16.2%
Race (2010)White (non-Hispanic) 63.9%Black or African American 32.1American Indian or Alaskan Native 0.4Asian and Pacific Islander 0.3
Hispanic origin, any race 1.6%
Age (2010)Under 18 22.8%18 to 64 59.065 and over 18.2Median age (2010) 43.2 years
Education (age 25 or over) (2010)12 or more years 78.9%16 or more years 11.9
Single female households with children < 18 (2010) 12.5%Single male households with children < 18 (2010) 3.7Children under 18 in poverty (2010) 32.0
ECONOMY 2010 2000-10 changeIncome per capita $30,844 76.4%
Labor Force 2,824 -8.9%Unemployed 11.5% 59.7
Under $25,000- $100,000 Annual household $25,000 $99,999 and overincome (2010) 39.5% 50.1% 10.4%
% of total jobsJobs by Industry (2010) county stateConstruction 4.2% 0.0%Farm 9.5 0.3Information, finance, real estate 0.5 0.0Government 31.0 0.1Manufacturing and transportation 4.5 0.0Business and education 0.0 0.0Health and social services 0.0 0.0Forestry, mining, utilities 1.4 0.1Wholesale and retail trade 5.7 0.0Other services 10.5 0.0Total jobs - 0.0
REVENUES AND EXPENDITURES
Revenue Collections (millions)State sales & use tax (est. 2011) $2.0Individual income tax (2010) 1.9 State motor fuel tax (est. 2011) 0.5Local property tax (2008) 2.4
State Expenditures (millions)Education (2011) $7.5Medicaid (2011) 7.3State payroll (2011) 7.7
Number of state employees (2011) 144
LAND USE Equalized assessed value 2009 1999-09 (millions) changeFarm $ 7.9 -23.1%Residential 11.3 39.7Industrial 6.4 51.8Commercial 6.3 178.6Total $31.8 28.6%
2007 1997-07 changeNumber of farms 276 15.5%Acres of farms 101,189 21.7
Foreign-owned Parcels Acresagricultural land (2010) 5 2,274
ELECTIONS
Primary Dem. Rep. Total2002 917 1,193 2,1352004 692 760 1,4522006 587 1,474 2,0612008 1,118 888 2,0072010 635 833 1,4702012 273 617 890
Registered Number Percent General voters voting voting2002 6,066 3,124 51.5%2004 6,311 3,108 49.22006 6,597 2,921 44.32008 6,679 3,333 49.92010 5,961 2,972 49.92012 5,835 3,044 52.2
Office Dem. Rep.2002 Governor 53.8% 44.5%2004 President 44.1 55.32006 Governor 57.3 34.32008 President 50.1 48.72010 Governor 37.8 56.92012 President 46.3 52.1

90 / Illinois County Data Book
Putnam CountyCongressional District: 16Senate District: 38House District: 76County Seat: HennepinEstablished: January 13, 1825Area: 160 square miles
POPULATION
2000 Census 6,0862010 Census 6,006Percent change (2000-2010) -1.3%
Race (2010)White (non-Hispanic) 94.1%Black or African American 0.5American Indian or Alaskan Native 0.1Asian and Pacific Islander 0.2
Hispanic origin, any race 4.2%
Age (2010)Under 18 21.3%18 to 64 60.965 and over 17.8Median age (2010) 45.2 years
Education (age 25 or over) (2010)12 or more years 88.7%16 or more years 15.0
Single female households with children < 18 (2010) 5.6%Single male households with children < 18 (2010) 3.8Children under 18 in poverty (2010) 21.8
ECONOMY 2010 2000-10 changeIncome per capita $37,707 48.9%
Labor Force 3,215 2.2%Unemployed 12.3% 141.2
Under $25,000- $100,000 Annual household $25,000 $99,999 and overincome (2010) 20.0% 60.3% 19.7%
% of total jobsJobs by Industry (2010) county stateConstruction 0.0% 0.0%Farm 6.6 0.2Information, finance, real estate 1.2 0.0Government 14.5 0.0Manufacturing and transportation 16.4 0.0Business and education 6.7 0.0Health and social services 0.0 0.0Forestry, mining, utilities 2.1 0.1Wholesale and retail trade 13.0 0.0Other services 10.5 0.0Total jobs - 0.0
REVENUES AND EXPENDITURES
Revenue Collections (millions)State sales & use tax (est. 2011) $21.3Individual income tax (2010) 3.7 State motor fuel tax (est. 2011) 0.5Local property tax (2008) 10.4
State Expenditures (millions)Education (2011) $1.4Medicaid (2011) (with Marshall County) 11.5State payroll (2011) 3.7
Number of state employees (2011) 71
LAND USE Equalized assessed value 2009 1999-09 (millions) changeFarm $ 34.3 17.4%Residential 98.3 107.7Industrial 20.0 93.1Commercial 54.4 418.1Total $207.1 112.5%
2007 1997-07 changeNumber of farms 167 -12.1%Acres of farms 62,705 -18.5
Foreign-owned Parcels Acresagricultural land (2010) 2 78
ELECTIONS
Primary Dem. Rep. Total2002 787 515 1,3022004 1,251 636 2,3952006 712 427 1,1392008 1,092 617 1,7142010 1,117 413 1,5302012 824 649 1,473
Registered Number Percent General voters voting voting2002 4,670 2,746 58.8%2004 4,587 3,482 75.92006 4,513 2,313 51.32008 4,663 3,369 72.22010 4,296 2,371 55.22012 4,248 3,178 74.8
Office Dem. Rep.2002 Governor 51.4% 43.9%2004 President 50.8 48.42006 Governor 45.9 41.92008 President 56.9 41.32010 Governor 39.4 51.62012 President 49.7 47.9

Illinois County Data Book / 91
Randolph CountyCongressional District: 12Senate District: 58House District: 116County Seat: ChesterEstablished: October 5, 1795Area: 578 square miles
POPULATION
2000 Census 33,8932010 Census 33,476Percent change (2000-2010) -1.2%
Race (2010)White (non-Hispanic) 86.4%Black or African American 9.7American Indian or Alaskan Native 0.1Asian and Pacific Islander 0.3
Hispanic origin, any race 2.6%
Age (2010)Under 18 19.8%18 to 64 64.265 and over 16.0Median age (2010) 41.0 years
Education (age 25 or over) (2010)12 or more years 78.5%16 or more years 12.0
Single female households with children < 18 (2010) 8.8%Single male households with children < 18 (2010) 3.8Children under 18 in poverty (2010) 11.9
ECONOMY 2010 2000-10 changeIncome per capita $28,008 40.8%
Labor Force 15,451 1.6%Unemployed 9.1% 78.4
Under $25,000- $100,000 Annual household $25,000 $99,999 and overincome (2010) 25.2% 63.3% 11.6%
% of total jobsJobs by Industry (2010) county stateConstruction 4.0% 0.2%Farm 5.3 1.0Information, finance, real estate 5.4 0.1Government 20.9 0.3Manufacturing and transportation 24.9 0.4Business and education 1.5 0.0Health and social services 0.0 0.0Forestry, mining, utilities 2.1 0.5Wholesale and retail trade 13.4 0.2Other services 11.0 0.2Total jobs - 0.2
REVENUES AND EXPENDITURES
Revenue Collections (millions)State sales & use tax (est. 2011) $32.0Individual income tax (2010) 14.0 State motor fuel tax (est. 2011) 3.8Local property tax (2008) 25.4
State Expenditures (millions)Education (2011) $17.5Medicaid (2011) (with Monroe County) 32.8State payroll (2011) 59.0
Number of state employees (2011) 1,135
LAND USE Equalized assessed value 2009 1999-09 (millions) changeFarm $ 69.7 24.8%Residential 202.5 56.8Industrial 108.6 112.7Commercial 60.7 89.7Total $441.5 64.7%
2007 1997-07 changeNumber of farms 833 -1.2%Acres of farms 252,926 -3.6
Foreign-owned Parcels Acresagricultural land (2010) 30 1,673
ELECTIONS
Primary Dem. Rep. Total2002 6,697 1,402 8,1012004 4,922 973 5,9142006 4,826 1,187 6,0132008 4,976 2,165 7,1492010 2,987 1,547 4,5432012 3,641 2,156 5,797
Registered Number Percent General voters voting voting2002 25,105 12,111 48.2%2004 25,571 15,686 61.32006 23,607 12,052 51.12008 24,624 15,401 62.52010 21,130 11,902 56.32012 21,863 14,609 66.8
Office Dem. Rep.2002 Governor 59.4% 39.1%2004 President 45.3 54.02006 Governor 50.7 40.22008 President 48.6 49.62010 Governor 39.5 53.42012 President 40.0 57.6

92 / Illinois County Data Book
Richland CountyCongressional District: 15Senate District: 55House District: 109County Seat: OlneyEstablished: February 24, 1841Area: 360 square miles
POPULATION
2000 Census 16,1492010 Census 16,233Percent change (2000-2010) 0.5%
Race (2010)White (non-Hispanic) 96.6%Black or African American 0.5American Indian or Alaskan Native 0.2Asian and Pacific Islander 0.7
Hispanic origin, any race 1.3%
Age (2010)Under 18 22.2%18 to 64 58.665 and over 19.2Median age (2010) 42.1 years
Education (age 25 or over) (2010)12 or more years 89.1%16 or more years 18.1
Single female households with children < 18 (2010) 8.4%Single male households with children < 18 (2010) 3.7Children under 18 in poverty (2010) 15.1
ECONOMY 2010 2000-10 changeIncome per capita $30,190 31.1%
Labor Force 7,341 -6.6%Unemployed 10.4% 67.7
Under $25,000- $100,000 Annual household $25,000 $99,999 and overincome (2010) 29.8% 59.0% 11.2%
% of total jobsJobs by Industry (2010) county stateConstruction 3.1% 0.1%Farm 6.1 0.7Information, finance, real estate 8.4 0.1Government 11.9 0.1Manufacturing and transportation 17.1 0.2Business and education 4.9 0.0Health and social services 0.0 0.0Forestry, mining, utilities 6.6 1.0Wholesale and retail trade 14.7 0.1Other services 11.6 0.1Total jobs - 0.1
REVENUES AND EXPENDITURES
Revenue Collections (millions)State sales & use tax (est. 2011) $10.5Individual income tax (2010) 7.2 State motor fuel tax (est. 2011) 1.3Local property tax (2008) 12.7
State Expenditures (millions)Education (2011) $11.2Medicaid (2011) 15.2State payroll (2011) 11.8
Number of state employees (2011) 194
LAND USE Equalized assessed value 2009 1999-09 (millions) changeFarm $ 28.9 -7.6%Residential 93.4 29.3Industrial 24.1 289.8Commercial 31.0 -32.7Total $177.3 13.8%
2007 1997-07 changeNumber of farms 579 17.0%Acres of farms 202,860 2.9
Foreign-owned Parcels Acresagricultural land (2010) 1 39
ELECTIONS
Primary Dem. Rep. Total2002 971 1,009 1,9802004 1,282 1,824 3,1062006 594 1,305 1,8992008 1,758 1,923 3,7422010 690 1,528 2,2642012 491 1,702 2,208
Registered Number Percent General voters voting voting2002 12,315 6,405 52.0%2004 13,047 8,000 61.32006 13,236 6,268 47.42008 13,684 7,751 56.62010 13,826 5,217 37.72012 11,555 7,365 63.7
Office Dem. Rep.2002 Governor 43.6% 54.3%2004 President 32.6 66.52006 Governor 28.0 59.62008 President 41.6 56.62010 Governor 24.5 71.42012 President 32.4 65.3
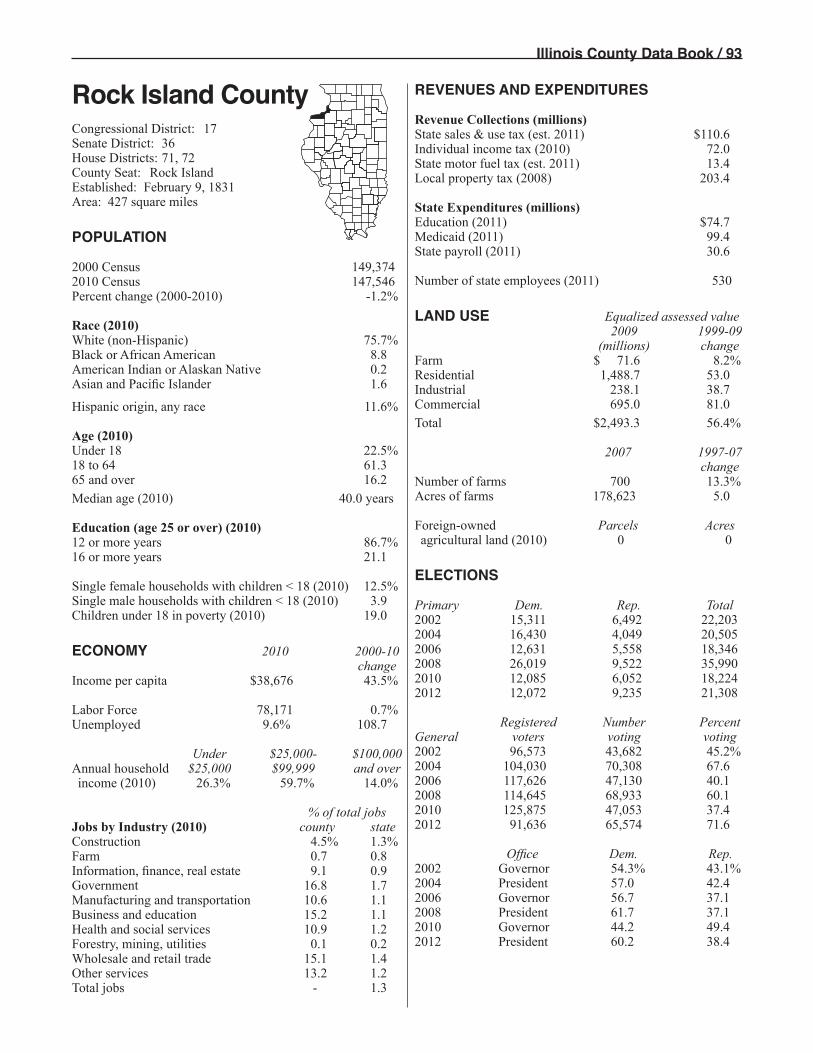
Illinois County Data Book / 93
Rock Island CountyCongressional District: 17Senate District: 36House Districts: 71, 72County Seat: Rock IslandEstablished: February 9, 1831Area: 427 square miles
POPULATION
2000 Census 149,3742010 Census 147,546Percent change (2000-2010) -1.2%
Race (2010)White (non-Hispanic) 75.7%Black or African American 8.8American Indian or Alaskan Native 0.2Asian and Pacific Islander 1.6
Hispanic origin, any race 11.6%
Age (2010)Under 18 22.5%18 to 64 61.365 and over 16.2Median age (2010) 40.0 years
Education (age 25 or over) (2010)12 or more years 86.7%16 or more years 21.1
Single female households with children < 18 (2010) 12.5%Single male households with children < 18 (2010) 3.9Children under 18 in poverty (2010) 19.0
ECONOMY 2010 2000-10 changeIncome per capita $38,676 43.5%
Labor Force 78,171 0.7%Unemployed 9.6% 108.7
Under $25,000- $100,000 Annual household $25,000 $99,999 and overincome (2010) 26.3% 59.7% 14.0%
% of total jobsJobs by Industry (2010) county stateConstruction 4.5% 1.3%Farm 0.7 0.8Information, finance, real estate 9.1 0.9Government 16.8 1.7Manufacturing and transportation 10.6 1.1Business and education 15.2 1.1Health and social services 10.9 1.2Forestry, mining, utilities 0.1 0.2Wholesale and retail trade 15.1 1.4Other services 13.2 1.2Total jobs - 1.3
REVENUES AND EXPENDITURES
Revenue Collections (millions)State sales & use tax (est. 2011) $110.6Individual income tax (2010) 72.0 State motor fuel tax (est. 2011) 13.4Local property tax (2008) 203.4
State Expenditures (millions)Education (2011) $74.7Medicaid (2011) 99.4State payroll (2011) 30.6
Number of state employees (2011) 530
LAND USE Equalized assessed value 2009 1999-09 (millions) changeFarm $ 71.6 8.2%Residential 1,488.7 53.0Industrial 238.1 38.7Commercial 695.0 81.0Total $2,493.3 56.4%
2007 1997-07 changeNumber of farms 700 13.3%Acres of farms 178,623 5.0
Foreign-owned Parcels Acresagricultural land (2010) 0 0
ELECTIONS
Primary Dem. Rep. Total2002 15,311 6,492 22,2032004 16,430 4,049 20,5052006 12,631 5,558 18,3462008 26,019 9,522 35,9902010 12,085 6,052 18,2242012 12,072 9,235 21,308
Registered Number Percent General voters voting voting2002 96,573 43,682 45.2%2004 104,030 70,308 67.62006 117,626 47,130 40.12008 114,645 68,933 60.12010 125,875 47,053 37.42012 91,636 65,574 71.6
Office Dem. Rep.2002 Governor 54.3% 43.1%2004 President 57.0 42.42006 Governor 56.7 37.12008 President 61.7 37.12010 Governor 44.2 49.42012 President 60.2 38.4

94 / Illinois County Data Book
St. Clair CountyCongressional District: 12Senate Districts: 54, 56-58House Districts: 108, 112-114, 116County Seat: BellevilleEstablished: April 27, 1790Area: 664 square miles
POPULATION
2000 Census 256,0822010 Census 270,056Percent change (2000-2010) 5.5%
Race (2010)White (non-Hispanic) 62.9%Black or African American 30.3American Indian or Alaskan Native 0.2Asian and Pacific Islander 1.3
Hispanic origin, any race 3.3%
Age (2010)Under 18 25.4%18 to 64 62.165 and over 12.5Median age (2010) 36.9 years
Education (age 25 or over) (2010)12 or more years 87.4%16 or more years 23.9
Single female households with children < 18 (2010) 14.9%Single male households with children < 18 (2010) 3.6Children under 18 in poverty (2010) 24.7
ECONOMY 2010 2000-10 changeIncome per capita $35,646 40.4%
Labor Force 126,769 6.0%Unemployed 10.9% 113.7
Under $25,000- $100,000 Annual household $25,000 $99,999 and overincome (2010) 26.5% 55.9% 17.6%
% of total jobsJobs by Industry (2010) county stateConstruction 4.3% 1.7%Farm 0.8 1.3Information, finance, real estate 8.6 1.2Government 20.1 2.8Manufacturing and transportation 9.5 1.4Business and education 12.1 1.2Health and social services 13.2 2.0Forestry, mining, utilities 0.5 1.1Wholesale and retail trade 14.0 1.8Other services 16.7 2.0Total jobs - 1.7
REVENUES AND EXPENDITURES
Revenue Collections (millions)State sales & use tax (est. 2011) $196.7Individual income tax (2010) 124.9 State motor fuel tax (est. 2011) 27.7Local property tax (2008) 328.5
State Expenditures (millions)Education (2011) $209.2Medicaid (2011) 219.4State payroll (2011) 63.3
Number of state employees (2011) 1,109
LAND USE Equalized assessed value 2009 1999-09 (millions) changeFarm $ 301.2 45.6%Residential 2,624.5 106.0Industrial 99.5 19.8Commercial 1,180.8 102.4Total $4,206.1 95.8%
2007 1997-07 changeNumber of farms 895 6.0%Acres of farms 306,533 15.9
Foreign-owned Parcels Acresagricultural land (2010) 2 202
ELECTIONS
Primary Dem. Rep. Total2002 23,713 8,829 33,6602004 26,757 9,152 37,9522006 20,659 5,852 27,4722008 43,470 15,078 58,6172010 21,094 11,293 32,9862012 18,305 15,746 34,203
Registered Number Percent General voters voting voting2002 169,173 69,684 41.2%2004 192,432 114,559 59.52006 189,124 70,725 37.42008 201,095 126,682 63.02010 194,486 82,250 42.32012 188,420 120,502 64.0
Office Dem. Rep.2002 Governor 57.3% 41.0%2004 President 55.1 44.42006 Governor 55.6 39.52008 President 60.6 38.12010 Governor 48.4 46.72012 President 56.3 42.0

Illinois County Data Book / 95
Saline CountyCongressional District: 15Senate District: 59House District: 118County Seat: HarrisburgEstablished: February 25, 1847Area: 383 square miles
POPULATION
2000 Census 26,7332010 Census 24,913Percent change (2000-2010) -6.8%
Race (2010)White (non-Hispanic) 92.4%Black or African American 3.9American Indian or Alaskan Native 0.3Asian and Pacific Islander 0.4
Hispanic origin, any race 1.4%
Age (2010)Under 18 22.9%18 to 64 58.765 and over 18.4Median age (2010) 41.7 years
Education (age 25 or over) (2010)12 or more years 82.1%16 or more years 14.3
Single female households with children < 18 (2010) 9.7%Single male households with children < 18 (2010) 4.2Children under 18 in poverty (2010) 26.5
ECONOMY 2010 2000-10 changeIncome per capita $32,568 57.5%
Labor Force 12,842 8.9%Unemployed 10.0% 42.9
Under $25,000- $100,000 Annual household $25,000 $99,999 and overincome (2010) 35.4% 55.5% 9.1%
% of total jobsJobs by Industry (2010) county stateConstruction 5.4% 0.2%Farm 3.8 0.6Information, finance, real estate 8.0 0.1Government 16.4 0.2Manufacturing and transportation 7.5 0.1Business and education 3.2 0.0Health and social services 13.7 0.2Forestry, mining, utilities 12.4 2.7Wholesale and retail trade 14.4 0.2Other services 12.2 0.2Total jobs - 0.2
REVENUES AND EXPENDITURES
Revenue Collections (millions)State sales & use tax (est. 2011) $18.8Individual income tax (2010) 10.3 State motor fuel tax (est. 2011) 2.5Local property tax (2008) 17.7
State Expenditures (millions)Education (2011) $23.8Medicaid (2011) (with Gallatin County) 41.5State payroll (2011) 24.3
Number of state employees (2011) 394
LAND USE Equalized assessed value 2009 1999-09 (millions) changeFarm $ 26.1 -4.9%Residential 105.6 42.7Industrial 27.9 5.4Commercial 57.0 59.6Total $216.5 32.4%
2007 1997-07 changeNumber of farms 497 12.7%Acres of farms 117,233 -10.3
Foreign-owned Parcels Acresagricultural land (2010) 0 0
ELECTIONS
Primary Dem. Rep. Total2002 4,596 1,825 6,4212004 4,848 2,040 7,0542006 3,584 1,548 5,1322008 5,358 2,157 7,5252010 1,887 1,696 3,5912012 1,492 2,267 3,816
Registered Number Percent General voters voting voting2002 16,703 10,313 61.7%2004 16,824 11,988 71.32006 16,992 9,487 55.82008 17,179 11,691 68.12010 16,780 8,292 49.42012 16,467 10,956 66.5
Office Dem. Rep.2002 Governor 51.4% 46.9%2004 President 39.8 59.72006 Governor 51.7 36.02008 President 44.5 53.42010 Governor 37.9 55.12012 President 34.5 63.5

96 / Illinois County Data Book
Sangamon CountyCongressional Districts: 13, 18Senate Districts: 44, 48, 50House Districts: 87, 96, 99, 100County Seat: SpringfieldEstablished: January 30, 1821Area: 868 square miles
POPULATION
2000 Census 188,9512010 Census 197,465Percent change (2000-2010) 4.5%
Race (2010)White (non-Hispanic) 82.5%Black or African American 11.7American Indian or Alaskan Native 0.2Asian and Pacific Islander 1.6
Hispanic origin, any race 1.8%
Age (2010)Under 18 23.7%18 to 64 62.465 and over 13.9Median age (2010) 39.2 years
Education (age 25 or over) (2010)12 or more years 91.0%16 or more years 31.0
Single female households with children < 18 (2010) 13.1%Single male households with children < 18 (2010) 3.9Children under 18 in poverty (2010) 19.7
ECONOMY 2010 2000-10 changeIncome per capita $42,075 37.6%
Labor Force 109,517 3.9%Unemployed 8.2% 121.6
Under $25,000- $100,000 Annual household $25,000 $99,999 and overincome (2010) 22.8% 58.3% 18.9%
% of total jobsJobs by Industry (2010) county stateConstruction 4.4% 1.8%Farm 0.9 1.4Information, finance, real estate 11.7 1.7Government 21.5 3.1Manufacturing and transportation 4.3 0.6Business and education 13.6 1.4Health and social services 14.7 2.3Forestry, mining, utilities 0.2 0.4Wholesale and retail trade 13.3 1.7Other services 14.8 1.9Total jobs - 1.8
REVENUES AND EXPENDITURES
Revenue Collections (millions)State sales & use tax (est. 2011) $189.7Individual income tax (2010) 126.2 State motor fuel tax (est. 2011) 25.2Local property tax (2008) 262.8
State Expenditures (millions)Education (2011) $ 99.4Medicaid (2011) 151.5State payroll (2011) 869.8
Number of state employees (2011) 14,686
LAND USE Equalized assessed value 2009 1999-09 (millions) changeFarm $ 176.7 -15.1%Residential 2,447.4 53.8Industrial 29.2 44.7Commercial 1,042.3 49.6Total $3,695.7 46.8%
2007 1997-07 changeNumber of farms 1,153 16.1%Acres of farms 518,153 11.0
Foreign-owned Parcels Acresagricultural land (2010) 5 1,068
ELECTIONS
Primary Dem. Rep. Total2002 14,963 31,403 50,8692004 13,477 14,122 27,8732006 8,284 15,323 24,2762008 21,299 18,775 40,6072010 8,730 16,926 25,8382012 5,879 20,261 26,255
Registered Number Percent General voters voting voting2002 124,339 82,243 66.1%2004 126,669 97,327 76.82006 131,579 76,504 58.12008 138,299 100,679 72.82010 136,649 74,124 54.22012 132,634 95,166 71.8
Office Dem. Rep.2002 Governor 43.1% 54.9%2004 President 40.5 58.62006 Governor 21.0 67.72008 President 51.4 47.02010 Governor 34.3 58.02012 President 44.7 53.3

Illinois County Data Book / 97
Schuyler CountyCongressional District: 18Senate District: 47House District: 93County Seat: RushvilleEstablished: January 13, 1825Area: 437 square miles
POPULATION
2000 Census 7,1892010 Census 7,544Percent change (2000-2010) 4.9%
Race (2010)White (non-Hispanic) 94.9%Black or African American 3.2American Indian or Alaskan Native 0.2Asian and Pacific Islander 0.1
Hispanic origin, any race 1.2%
Age (2010)Under 18 20.9%18 to 64 60.565 and over 18.5Median age (2010) 43.6 years
Education (age 25 or over) (2010)12 or more years 89.2%16 or more years 17.7
Single female households with children < 18 (2010) 7.3%Single male households with children < 18 (2010) 4.2Children under 18 in poverty (2010) 16.8
ECONOMY 2010 2000-10 changeIncome per capita $32,347 40.4%
Labor Force 4,247 6.5%Unemployed 7.9% 51.9
Under $25,000- $100,000 Annual household $25,000 $99,999 and overincome (2010) 24.8% 69.1% 6.1%
% of total jobsJobs by Industry (2010) county stateConstruction 7.4% 0.1%Farm 15.2 0.6Information, finance, real estate 8.4 0.0Government 18.8 0.1Manufacturing and transportation 3.8 0.0Business and education 4.4 0.0Health and social services 5.9 0.0Forestry, mining, utilities 0.0 0.0Wholesale and retail trade 11.6 0.0Other services 5.8 0.0Total jobs - 0.0
REVENUES AND EXPENDITURES
Revenue Collections (millions)State sales & use tax (est. 2011) $3.1Individual income tax (2010) 3.2 State motor fuel tax (est. 2011) 0.6Local property tax (2008) 7.7
State Expenditures (millions)Education (2011) $ 6.2Medicaid (2011) (with Brown County) 7.8State payroll (2011) 11.8
Number of state employees (2011) 206
LAND USE Equalized assessed value 2009 1999-09 (millions) changeFarm $ 36.1 -1.4%Residential 39.7 66.2Industrial 1.5 -7.0Commercial 11.4 76.1Total $88.7 29.3%
2007 1997-07 changeNumber of farms 534 11.9%Acres of farms 207,457 -0.7
Foreign-owned Parcels Acresagricultural land (2010) 1 7
ELECTIONS
Primary Dem. Rep. Total2002 520 1,029 1,5492004 456 572 1,0282006 427 1,046 1,4802008 1,020 990 2,0132010 480 776 1,2712012 465 1,089 1,554
Registered Number Percent General voters voting voting2002 5,625 3,829 68.1%2004 5,499 4,075 74.12006 5,513 3,216 58.32008 5,473 3,876 70.82010 5,618 3,035 54.02012 5,283 3,951 74.8
Office Dem. Rep.2002 Governor 40.5% 56.6%2004 President 39.5 59.62006 Governor 35.7 51.22008 President 49.7 47.92010 Governor 28.4 63.62012 President 44.4 53.2

98 / Illinois County Data Book
Scott CountyCongressional District: 18Senate District: 50House District: 100County Seat: WinchesterEstablished: February 16, 1839Area: 251 square miles
POPULATION
2000 Census 5,5372010 Census 5,355Percent change (2000-2010) -3.3%
Race (2010)White (non-Hispanic) 98.0%Black or African American 0.1American Indian or Alaskan Native 0.2Asian and Pacific Islander 0.2
Hispanic origin, any race 0.8%
Age (2010)Under 18 23.8%18 to 64 58.265 and over 18.0Median age (2010) 42.7 years
Education (age 25 or over) (2010)12 or more years 88.3%16 or more years 18.0
Single female households with children < 18 (2010) 8.5%Single male households with children < 18 (2010) 4.5Children under 18 in poverty (2010) 9.5
ECONOMY 2010 2000-10 changeIncome per capita $32,852 55.6%
Labor Force 2,752 -7.8%Unemployed 9.8% 100.0
Under $25,000- $100,000 Annual household $25,000 $99,999 and overincome (2010) 22.4% 61.6% 16.0%
% of total jobsJobs by Industry (2010) county stateConstruction 5.9% 0.0%Farm 16.3 0.4Information, finance, real estate 6.3 0.0Government 19.7 0.0Manufacturing and transportation 0.0 0.0Business and education 0.0 0.0Health and social services 0.0 0.0Forestry, mining, utilities 0.0 0.0Wholesale and retail trade 16.8 0.0Other services 5.5 0.0Total jobs - 0.0
REVENUES AND EXPENDITURES
Revenue Collections (millions)State sales & use tax (est. 2011) $1.7Individual income tax (2010) 2.2 State motor fuel tax (est. 2011) 0.4Local property tax (2008) 4.2
State Expenditures (millions)Education (2011) $ 4.6Medicaid (2011) (with Pike County) 17.7State payroll (2011) 8.1
Number of state employees (2011) 160
LAND USE Equalized assessed value 2009 1999-09 (millions) changeFarm $ 29.6 5.1%Residential 19.0 7.5Industrial 7.4 43.9Commercial 3.5 23.6Total $59.5 10.5%
2007 1997-07 changeNumber of farms 350 7.0%Acres of farms 135,731 -6.7
Foreign-owned Parcels Acresagricultural land (2010) 1 458
ELECTIONS
Primary Dem. Rep. Total2002 361 1,347 1,7082004 385 793 1,1782006 172 539 7112008 639 739 1,3782010 300 535 8362012 219 1,204 1,423
Registered Number Percent General voters voting voting2002 3,752 2,485 66.2%2004 4,011 2,653 66.12006 3,890 2,089 53.72008 3,976 2,643 66.52010 3,996 1,828 45.72012 4,098 2,616 63.8
Office Dem. Rep.2002 Governor 43.2% 53.7%2004 President 35.2 64.32006 Governor 31.0 59.32008 President 41.9 56.02010 Governor 23.7 69.42012 President 35.6 62.1

Illinois County Data Book / 99
Shelby CountyCongressional District: 15Senate District: 51House District: 102County Seat: ShelbyvilleEstablished: January 23, 1827Area: 759 square miles
POPULATION
2000 Census 22,8932010 Census 22,363Percent change (2000-2010) -2.3%
Race (2010)White (non-Hispanic) 98.0%Black or African American 0.2American Indian or Alaskan Native 0.2Asian and Pacific Islander 0.3
Hispanic origin, any race 0.8%
Age (2010)Under 18 22.6%18 to 64 58.565 and over 18.9Median age (2010) 43.5 years
Education (age 25 or over) (2010)12 or more years 87.7%16 or more years 14.7
Single female households with children < 18 (2010) 6.7%Single male households with children < 18 (2010) 3.6Children under 18 in poverty (2010) 16.7
ECONOMY 2010 2000-10 changeIncome per capita $32,291 43.6%
Labor Force 11,134 -4.9%Unemployed 10.4% 108.0
Under $25,000- $100,000 Annual household $25,000 $99,999 and overincome (2010) 27.6% 62.3% 10.1%
% of total jobsJobs by Industry (2010) county stateConstruction 4.4% 0.1%Farm 14.2 1.4Information, finance, real estate 7.5 0.1Government 13.0 0.1Manufacturing and transportation 13.3 0.1Business and education 3.9 0.0Health and social services 9.9 0.1Forestry, mining, utilities 0.0 0.0Wholesale and retail trade 12.8 0.1Other services 13.0 0.1Total jobs - 0.1
REVENUES AND EXPENDITURES
Revenue Collections (millions)State sales & use tax (est. 2011) $ 8.8Individual income tax (2010) 10.0 State motor fuel tax (est. 2011) 1.7Local property tax (2008) 22.4
State Expenditures (millions)Education (2011) $14.6Medicaid (2011) 15.1State payroll (2011) 10.2
Number of state employees (2011) 212
LAND USE Equalized assessed value 2009 1999-09 (millions) changeFarm $ 116.4 8.7%Residential 126.8 47.2Industrial 26.6 156.0Commercial 33.1 54.5Total $302.9 34.6%
2007 1997-07 changeNumber of farms 1,185 -5.2%Acres of farms 387,288 -7.5
Foreign-owned Parcels Acresagricultural land (2010) 2 553
ELECTIONS
Primary Dem. Rep. Total2002 2,376 1,954 4,5142004 2,738 1,259 4,0292006 2,605 1,211 3,8262008 3,070 2,241 5,3152010 1,501 2,108 3,6392012 874 2,825 3,699
Registered Number Percent General voters voting voting2002 15,011 8,579 57.2%2004 17,509 10,648 60.82006 16,402 7,889 48.12008 15,158 11,004 72.62010 15,610 8,309 53.22012 14,916 10,515 70.5
Office Dem. Rep.2002 Governor 39.9% 57.1%2004 President 35.4 63.82006 Governor 29.6 55.22008 President 39.1 58.92010 Governor 22.2 68.92012 President 32.2 65.8

100 / Illinois County Data Book
Stark CountyCongressional Districts: 16, 18Senate District: 37House District: 73County Seat: ToulonEstablished: March 2, 1839Area: 288 square miles
POPULATION
2000 Census 6,3322010 Census 5,994Percent change (2000-2010) -5.3%
Race (2010)White (non-Hispanic) 97.2%Black or African American 0.5American Indian or Alaskan Native 0.2Asian and Pacific Islander 0.3
Hispanic origin, any race 1.0%
Age (2010)Under 18 23.5%18 to 64 56.565 and over 19.9Median age (2010) 43.8 years
Education (age 25 or over) (2010)12 or more years 88.0%16 or more years 15.2
Single female households with children < 18 (2010) 6.3%Single male households with children < 18 (2010) 3.4Children under 18 in poverty (2010) 17.0
ECONOMY 2010 2000-10 changeIncome per capita $34,554 32.4%
Labor Force 2,823 -2.3%Unemployed 11.2% 83.6
Under $25,000- $100,000 Annual household $25,000 $99,999 and overincome (2010) 23.1% 60.8% 16.1%
% of total jobsJobs by Industry (2010) county stateConstruction 4.0% 0.0%Farm 16.0 0.4Information, finance, real estate 12.3 0.0Government 16.0 0.0Manufacturing and transportation 15.2 0.0Business and education 0.0 0.0Health and social services 8.0 0.0Forestry, mining, utilities 0.0 0.0Wholesale and retail trade 14.7 0.0Other services 3.4 0.0Total jobs - 0.0
REVENUES AND EXPENDITURES
Revenue Collections (millions)State sales & use tax (est. 2011) $2.1Individual income tax (2010) 2.7 State motor fuel tax (est. 2011) 0.3Local property tax (2008) 8.7
State Expenditures (millions)Education (2011) $ 3.6Medicaid (2011) (with Henry County) 32.8State payroll (2011) 3.2
Number of state employees (2011) 62
LAND USE Equalized assessed value 2009 1999-09 (millions) changeFarm $ 53.4 -16.7%Residential 35.4 44.0Industrial 11.2 322.9Commercial 6.2 76.5Total $106.2 11.9%
2007 1997-07 changeNumber of farms 372 5.1%Acres of farms 169,775 -5.5
Foreign-owned Parcels Acresagricultural land (2010) 1 220
ELECTIONS
Primary Dem. Rep. Total2002 310 846 1,1562004 308 518 8292006 188 621 8192008 610 860 1,4702010 244 1,067 1,3692012 97 810 907
Registered Number Percent General voters voting voting2002 4,702 2,355 50.1%2004 4,898 3,137 64.02006 4,919 2,222 45.22008 5,212 2,945 56.52010 4,752 1,969 41.42012 4,133 2,701 65.4
Office Dem. Rep.2002 Governor 36.8% 60.1%2004 President 38.8 60.12006 Governor 32.7 52.72008 President 46.7 52.02010 Governor 27.9 63.82012 President 41.1 57.4

Illinois County Data Book / 101
Stephenson CountyCongressional District: 17Senate District: 45House District: 89County Seat: FreeportEstablished: March 4, 1837Area: 564 square miles
POPULATION
2000 Census 48,9792010 Census 47,711Percent change (2000-2010) -2.6%
Race (2010)White (non-Hispanic) 85.1%Black or African American 8.9American Indian or Alaskan Native 0.1Asian and Pacific Islander 0.6
Hispanic origin, any race 2.9%
Age (2010)Under 18 22.7%18 to 64 58.665 and over 18.8Median age (2010) 43.1 years
Education (age 25 or over) (2010)12 or more years 88.5%16 or more years 17.2
Single female households with children < 18 (2010) 10.7%Single male households with children < 18 (2010) 3.6Children under 18 in poverty (2010) 24.1
ECONOMY 2010 2000-10 changeIncome per capita $34,955 29.5%
Labor Force 24,667 -5.1%Unemployed 11.8% 122.6
Under $25,000- $100,000 Annual household $25,000 $99,999 and overincome (2010) 29.1% 60.4% 10.5%
% of total jobsJobs by Industry (2010) county stateConstruction 6.7% 0.6%Farm 5.3 1.7Information, finance, real estate 14.4 0.4Government 11.8 0.3Manufacturing and transportation 15.3 0.5Business and education 7.6 0.2Health and social services 11.7 0.4Forestry, mining, utilities 1.0 0.5Wholesale and retail trade 11.6 0.3Other services 12.5 0.3Total jobs - 0.4
REVENUES AND EXPENDITURES
Revenue Collections (millions)State sales & use tax (est. 2011) $31.1Individual income tax (2010) 20.8 State motor fuel tax (est. 2011) 3.9Local property tax (2008) 61.2
State Expenditures (millions)Education (2011) $28.4Medicaid (2011) 38.3State payroll (2011) 7.9
Number of state employees (2011) 140
LAND USE Equalized assessed value 2009 1999-09 (millions) changeFarm $ 128.1 13.3%Residential 409.9 33.1Industrial 20.8 21.9Commercial 129.3 53.4Total $688.1 31.7%
2007 1997-07 changeNumber of farms 1,178 9.0%Acres of farms 337,932 9.5
Foreign-owned Parcels Acresagricultural land (2010) 4 9,524
ELECTIONS
Primary Dem. Rep. Total2002 2,146 8,758 11,0452004 2,897 6,207 9,4592006 1,274 5,014 6,3702008 5,139 4,946 10,1112010 1,663 4,489 6,3032012 1,668 5,666 7,369
Registered Number Percent General voters voting voting2002 29,748 14,486 48.7%2004 32,772 21,811 66.62006 32,043 13,763 43.02008 34,535 21,798 63.12010 34,930 15,008 43.02012 33,328 21,239 63.7
Office Dem. Rep.2002 Governor 38.3% 57.5%2004 President 41.8 57.32006 Governor 38.8 43.42008 President 52.5 45.92010 Governor 28.6 63.32012 President 48.3 49.9

102 / Illinois County Data Book
Tazewell CountyCongressional Districts: 17, 18Senate Districts: 44, 46House Districts: 87, 88, 91County Seat: PekinEstablished: January 31, 1827Area: 649 square miles
POPULATION
2000 Census 128,4852010 Census 135,394Percent change (2000-2010) 5.4%
Race (2010)White (non-Hispanic) 95.0%Black or African American 1.0American Indian or Alaskan Native 0.2Asian and Pacific Islander 0.8
Hispanic origin, any race 1.9%
Age (2010)Under 18 23.5%18 to 64 60.965 and over 15.6Median age (2010) 39.8 years
Education (age 25 or over) (2010)12 or more years 90.2%16 or more years 23.1
Single female households with children < 18 (2010) 8.9%Single male households with children < 18 (2010) 3.5Children under 18 in poverty (2010) 11.2
ECONOMY 2010 2000-10 changeIncome per capita $38,469 34.8%
Labor Force 73,755 9.7%Unemployed 10.2% 148.8
Under $25,000- $100,000 Annual household $25,000 $99,999 and overincome (2010) 19.6% 62.0% 18.4%
% of total jobsJobs by Industry (2010) county stateConstruction 6.1% 1.4%Farm 1.3 1.2Information, finance, real estate 8.3 0.7Government 10.8 0.9Manufacturing and transportation 26.1 2.2Business and education 5.0 0.3Health and social services 7.8 0.7Forestry, mining, utilities 0.7 0.9Wholesale and retail trade 13.9 1.0Other services 15.5 1.1Total jobs - 1.0
REVENUES AND EXPENDITURES
Revenue Collections (millions)State sales & use tax (est. 2011) $116.1Individual income tax (2010) 77.3 State motor fuel tax (est. 2011) 18.9Local property tax (2008) 166.7
State Expenditures (millions)Education (2011) $55.2Medicaid (2011) 88.6State payroll (2011) 29.8
Number of state employees (2011) 495
LAND USE Equalized assessed value 2009 1999-09 (millions) changeFarm $ 131.7 3.8%Residential 1,745.2 70.6Industrial 95.6 78.2Commercial 480.9 66.4Total $2,453.5 64.4%
2007 1997-07 changeNumber of farms 998 9.8%Acres of farms 329,268 0.3
Foreign-owned Parcels Acresagricultural land (2010) 5 2,644
ELECTIONS
Primary Dem. Rep. Total2002 9,605 13,362 23,6692004 8,508 10,605 19,5152006 4,838 10,077 15,1612008 15,171 17,177 32,4122010 4,933 13,777 18,7512012 3,281 17,362 20,837
Registered Number Percent General voters voting voting2002 90,507 41,870 46.3%2004 93,272 63,788 68.42006 93,838 44,098 47.02008 99,868 64,319 64.42010 89,514 46,268 51.72012 89,276 61,568 69.0
Office Dem. Rep.2002 Governor 39.6% 57.5%2004 President 41.4 57.82006 Governor 37.5 46.32008 President 46.0 52.12010 Governor 28.9 64.12012 President 40.0 57.9

Illinois County Data Book / 103
Union CountyCongressional District: 12Senate Districts: 58, 59House Districts: 115, 118County Seat: JonesboroEstablished: January 2, 1818Area: 416 square miles
POPULATION
2000 Census 18,2932010 Census 17,808Percent change (2000-2010) -2.7%
Race (2010)White (non-Hispanic) 92.4%Black or African American 0.8American Indian or Alaskan Native 0.3Asian and Pacific Islander 0.3
Hispanic origin, any race 4.8%
Age (2010)Under 18 21.5%18 to 64 60.365 and over 18.2Median age (2010) 42.9 years
Education (age 25 or over) (2010)12 or more years 79.1%16 or more years 17.8
Single female households with children < 18 (2010) 8.1%Single male households with children < 18 (2010) 3.4Children under 18 in poverty (2010) 22.5
ECONOMY 2010 2000-10 changeIncome per capita $31,193 54.2%
Labor Force 8,301 -0.8%Unemployed 12.2% 84.8
Under $25,000- $100,000 Annual household $25,000 $99,999 and overincome (2010) 32.9% 58.8% 8.3%
% of total jobsJobs by Industry (2010) county stateConstruction 5.1% 0.1%Farm 9.8 0.9Information, finance, real estate 6.9 0.1Government 20.4 0.2Manufacturing and transportation 6.5 0.1Business and education 3.4 0.0Health and social services 16.9 0.1Forestry, mining, utilities 0.9 0.1Wholesale and retail trade 14.0 0.1Other services 11.5 0.1Total jobs - 0.1
REVENUES AND EXPENDITURES
Revenue Collections (millions)State sales & use tax (est. 2011) $ 9.8Individual income tax (2010) 7.1 State motor fuel tax (est. 2011) 1.2Local property tax (2008) 10.9
State Expenditures (millions)Education (2011) $15.3Medicaid (2011) (with Johnson County) 33.3State payroll (2011) 41.8
Number of state employees (2011) 755
LAND USE Equalized assessed value 2009 1999-09 (millions) changeFarm $ 48.1 47.5%Residential 90.8 89.4Industrial 4.9 51.6Commercial 29.4 87.4Total $173.2 74.1%
2007 1997-07 changeNumber of farms 620 4.9%Acres of farms 122,362 -10.1
Foreign-owned Parcels Acresagricultural land (2010) 3 630
ELECTIONS
Primary Dem. Rep. Total2002 2,714 1,315 4,0292004 4,715 979 5,7432006 3,214 1,088 4,3052008 4,951 1,437 6,4032010 2,388 1,624 4,0862012 2,387 2,166 4,686
Registered Number Percent General voters voting voting2002 15,721 7,059 44.9%2004 16,206 9,199 56.82006 16,237 7,086 43.62008 15,337 9,306 60.72010 15,156 6,745 44.52012 11,970 8,413 70.3
Office Dem. Rep.2002 Governor 49.2% 48.2%2004 President 41.0 58.52006 Governor 43.8 38.82008 President 43.0 54.92010 Governor 36.2 55.32012 President 37.9 59.9

104 / Illinois County Data Book
Vermilion CountyCongressional District: 15Senate Districts: 51-53House Districts: 102, 104, 106County Seat: DanvilleEstablished: January 18, 1826Area: 899 square miles
POPULATION
2000 Census 83,9192010 Census 81,625Percent change (2000-2010) -2.7%
Race (2010)White (non-Hispanic) 80.4%Black or African American 12.7American Indian or Alaskan Native 0.2Asian and Pacific Islander 0.7
Hispanic origin, any race 4.2%
Age (2010)Under 18 24.4%18 to 64 59.365 and over 16.3Median age (2010) 39.8 years
Education (age 25 or over) (2010)12 or more years 84.9%16 or more years 13.7
Single female households with children < 18 (2010) 14.1%Single male households with children < 18 (2010) 4.5Children under 18 in poverty (2010) 30.0
ECONOMY 2010 2000-10 changeIncome per capita $31,520 42.8%
Labor Force 37,116 -4.5%Unemployed 12.4% 110.2
Under $25,000- $100,000 Annual household $25,000 $99,999 and overincome (2010) 31.6% 59.2% 9.3%
% of total jobsJobs by Industry (2010) county stateConstruction 3.6% 0.4%Farm 2.6 1.2Information, finance, real estate 7.7 0.3Government 16.6 0.7Manufacturing and transportation 17.6 0.8Business and education 5.2 0.2Health and social services 10.2 0.5Forestry, mining, utilities 0.4 0.3Wholesale and retail trade 17.2 0.6Other services 13.8 0.5Total jobs - 0.5
REVENUES AND EXPENDITURES
Revenue Collections (millions)State sales & use tax (est. 2011) $49.1Individual income tax (2010) 31.2 State motor fuel tax (est. 2011) 6.8Local property tax (2008) 77.8
State Expenditures (millions)Education (2011) $67.2Medicaid (2011) 79.9State payroll (2011) 29.5
Number of state employees (2011) 510
LAND USE Equalized assessed value 2009 1999-09 (millions) changeFarm $ 135.0 -12.7%Residential 476.2 45.6Industrial 68.9 60.1Commercial 217.8 32.2Total $897.9 30.2%
2007 1997-07 changeNumber of farms 1,014 3.0%Acres of farms 457,375 -5.7
Foreign-owned Parcels Acresagricultural land (2010) 15 6,388
ELECTIONS
Primary Dem. Rep. Total2002 4,716 8,104 12,8202004 4,086 4,381 8,4672006 2,624 4,366 6,9982008 8,094 6,065 14,1772010 2,495 6,070 8,5982012 1,758 6,718 8,476
Registered Number Percent General voters voting voting2002 49,556 24,889 50.2%2004 49,217 33,863 68.82006 50,038 23,716 47.42008 49,863 33,249 66.72010 48,711 22,833 46.92012 48,202 30,611 63.5
Office Dem. Rep.2002 Governor 48.2% 49.1%2004 President 43.7 55.62006 Governor 40.7 48.02008 President 49.4 48.82010 Governor 29.2 63.42012 President 42.5 55.7

Illinois County Data Book / 105
Wabash CountyCongressional District: 15Senate District: 55House District: 109County Seat: Mt. CarmelEstablished: December 27, 1824Area: 224 square miles
POPULATION
2000 Census 12,9372010 Census 11,947Percent change (2000-2010) -7.7%
Race (2010)White (non-Hispanic) 96.2%Black or African American 0.6American Indian or Alaskan Native 0.1Asian and Pacific Islander 0.6
Hispanic origin, any race 1.3%
Age (2010)Under 18 22.2%18 to 64 60.065 and over 17.8Median age (2010) 42.0 years
Education (age 25 or over) (2010)12 or more years 86.4%16 or more years 15.3
Single female households with children < 18 (2010) 8.0%Single male households with children < 18 (2010) 3.2Children under 18 in poverty (2010) 12.2
ECONOMY 2010 2000-10 changeIncome per capita $32,752 45.6%
Labor Force 6,061 -12.0%Unemployed 10.1% 90.6
Under $25,000- $100,000 Annual household $25,000 $99,999 and overincome (2010) 26.7% 61.3% 12.0%
% of total jobsJobs by Industry (2010) county stateConstruction 7.0% 0.1%Farm 4.7 0.3Information, finance, real estate 8.8 0.1Government 20.2 0.1Manufacturing and transportation 3.6 0.0Business and education 4.0 0.0Health and social services 0.0 0.0Forestry, mining, utilities 14.2 1.3Wholesale and retail trade 12.3 0.1Other services 13.5 0.1Total jobs - 0.1
REVENUES AND EXPENDITURES
Revenue Collections (millions)State sales & use tax (est. 2011) $6.6Individual income tax (2010) 5.9 State motor fuel tax (est. 2011) 1.3Local property tax (2008) 9.4
State Expenditures (millions)Education (2011) $ 8.3Medicaid (2011) (with Edwards County) 14.4State payroll (2011) 3.7
Number of state employees (2011) 67
LAND USE Equalized assessed value 2009 1999-09 (millions) changeFarm $ 19.0 -21.8%Residential 76.0 54.7Industrial 14.6 56.6Commercial 28.3 75.1Total $137.8 39.4%
2007 1997-07 changeNumber of farms 225 6.1%Acres of farms 114,361 -6.0
Foreign-owned Parcels Acresagricultural land (2010) 0 0
ELECTIONS
Primary Dem. Rep. Total2002 653 985 1,6382004 1,318 969 2,2872006 577 1,294 1,8962008 1,258 1,303 2,5612010 309 1,039 1,3512012 246 1,120 1,366
Registered Number Percent General voters voting voting2002 10,102 4,507 44.6%2004 10,440 6,171 59.12006 10,132 4,707 46.52008 9,391 5,860 62.42010 9,242 4,057 43.92012 9,132 5,182 56.7
Office Dem. Rep.2002 Governor 33.4% 65.1%2004 President 29.2 70.12006 Governor 30.8 65.22008 President 42.6 56.32010 Governor 26.8 69.52012 President 31.0 67.7

106 / Illinois County Data Book
Warren CountyCongressional District: 17Senate District: 47House Districts: 93, 94County Seat: MonmouthEstablished: January 13, 1825Area: 543 square miles
POPULATION
2000 Census 18,7352010 Census 17,707Percent change (2000-2010) -5.5%
Race (2010)White (non-Hispanic) 88.0%Black or African American 1.6American Indian or Alaskan Native 0.2Asian and Pacific Islander 0.6
Hispanic origin, any race 8.4%
Age (2010)Under 18 22.1%18 to 64 60.865 and over 17.0Median age (2010) 39.6 years
Education (age 25 or over) (2010)12 or more years 85.5%16 or more years 19.9
Single female households with children < 18 (2010) 8.9%Single male households with children < 18 (2010) 4.4Children under 18 in poverty (2010) 18.1
ECONOMY 2010 2000-10 changeIncome per capita $32,726 52.1%
Labor Force 9,298 -7.6%Unemployed 8.5% 88.9
Under $25,000- $100,000 Annual household $25,000 $99,999 and overincome (2010) 29.7% 61.4% 8.9%
% of total jobsJobs by Industry (2010) county stateConstruction 2.9% 0.1%Farm 7.9 0.9Information, finance, real estate 4.2 0.0Government 10.1 0.1Manufacturing and transportation 24.1 0.2Business and education 7.2 0.0Health and social services 0.0 0.0Forestry, mining, utilities 0.0 0.0Wholesale and retail trade 11.1 0.1Other services 5.9 0.1Total jobs - 0.1
REVENUES AND EXPENDITURES
Revenue Collections (millions)State sales & use tax (est. 2011) $ 8.9Individual income tax (2010) 7.0 State motor fuel tax (est. 2011) 1.7Local property tax (2008) 18.7
State Expenditures (millions)Education (2011) $14.7Medicaid (2011) (with Henderson County) 17.1State payroll (2011) 8.9
Number of state employees (2011) 168
LAND USE Equalized assessed value 2009 1999-09 (millions) changeFarm $ 98.1 -22.2%Residential 101.1 63.4Industrial 6.9 32.5Commercial 35.6 41.3Total $241.7 10.7%
2007 1997-07 changeNumber of farms 644 -9.3%Acres of farms 294,907 -6.4
Foreign-owned Parcels Acresagricultural land (2010) 5 409
ELECTIONS
Primary Dem. Rep. Total2002 853 3,431 4,3812004 1,106 2,327 3,6002006 563 3,170 3,7332008 1,944 2,260 4,2132010 497 2,094 2,5982012 477 2,363 2,918
Registered Number Percent General voters voting voting2002 12,861 6,394 49.7%2004 12,227 8,522 69.72006 11,164 6,040 54.12008 12,970 8,117 62.62010 11,953 6,134 51.32012 12,010 7,883 65.6
Office Dem. Rep.2002 Governor 38.3% 59.1%2004 President 46.6 52.92006 Governor 40.7 52.92008 President 53.4 45.32010 Governor 32.7 59.92012 President 51.9 46.4

Illinois County Data Book / 107
Washington CountyCongressional District: 15Senate Districts: 54, 58House Districts: 108, 115County Seat: NashvilleEstablished: January 2, 1818Area: 563 square miles
POPULATION
2000 Census 15,1482010 Census 14,716Percent change (2000-2010) -2.9%
Race (2010)White (non-Hispanic) 96.9%Black or African American 0.6American Indian or Alaskan Native 0.1Asian and Pacific Islander 0.3
Hispanic origin, any race 1.3%
Age (2010)Under 18 22.1%18 to 64 60.965 and over 17.0Median age (2010) 42.3 years
Education (age 25 or over) (2010)12 or more years 86.2%16 or more years 17.1
Single female households with children < 18 (2010) 5.9%Single male households with children < 18 (2010) 3.0Children under 18 in poverty (2010) 13.2
ECONOMY 2010 2000-10 changeIncome per capita $37,006 43.1%
Labor Force 8,275 -1.0%Unemployed 7.9% 97.5
Under $25,000- $100,000 Annual household $25,000 $99,999 and overincome (2010) 21.7% 64.3% 14.0%
% of total jobsJobs by Industry (2010) county stateConstruction 5.6% 0.1%Farm 11.1 1.1Information, finance, real estate 9.0 0.1Government 12.9 0.1Manufacturing and transportation 20.6 0.2Business and education 5.3 0.0Health and social services 0.0 0.0Forestry, mining, utilities 2.0 0.3Wholesale and retail trade 16.0 0.1Other services 4.8 0.0Total jobs - 0.1
REVENUES AND EXPENDITURES
Revenue Collections (millions)State sales & use tax (est. 2011) $10.1Individual income tax (2010) 8.5 State motor fuel tax (est. 2011) 2.6Local property tax (2008) 16.0
State Expenditures (millions)Education (2011) $ 7.1Medicaid (2011) (with Jefferson & Wayne Counties) 63.2State payroll (2011) 9.6
Number of state employees (2011) 188
LAND USE Equalized assessed value 2009 1999-09 (millions) changeFarm $ 52.7 7.4%Residential 107.9 85.5Industrial 14.0 4.9Commercial 27.8 42.4Total $202.4 44.4%
2007 1997-07 changeNumber of farms 779 0.3%Acres of farms 353,903 14.7
Foreign-owned Parcels Acresagricultural land (2010) 0 0
ELECTIONS
Primary Dem. Rep. Total2002 1,038 1,491 2,6032004 1,582 1,330 2,9562006 1,152 1,828 2,9802008 1,803 2,184 3,9892010 889 2,067 3,3992012 647 3,220 3,984
Registered Number Percent General voters voting voting2002 10,783 6,316 58.6%2004 12,331 8,174 66.32006 12,083 6,478 53.62008 12,396 8,040 64.92010 10,662 5,979 56.12012 10,073 7,518 74.6
Office Dem. Rep.2002 Governor 44.9% 53.1%2004 President 36.8 62.62006 Governor 38.9 53.22008 President 42.1 56.42010 Governor 25.6 67.62012 President 33.1 64.7
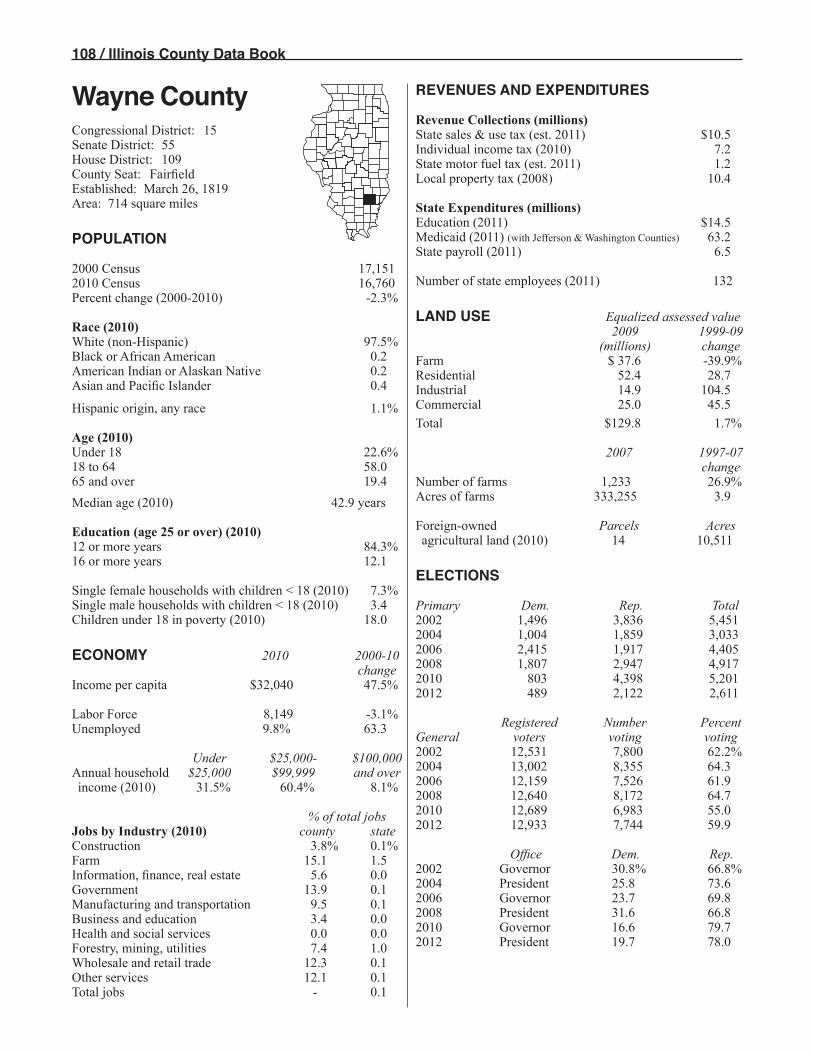
108 / Illinois County Data Book
Wayne CountyCongressional District: 15Senate District: 55House District: 109County Seat: FairfieldEstablished: March 26, 1819Area: 714 square miles
POPULATION
2000 Census 17,1512010 Census 16,760Percent change (2000-2010) -2.3%
Race (2010)White (non-Hispanic) 97.5%Black or African American 0.2American Indian or Alaskan Native 0.2Asian and Pacific Islander 0.4
Hispanic origin, any race 1.1%
Age (2010)Under 18 22.6%18 to 64 58.065 and over 19.4Median age (2010) 42.9 years
Education (age 25 or over) (2010)12 or more years 84.3%16 or more years 12.1
Single female households with children < 18 (2010) 7.3%Single male households with children < 18 (2010) 3.4Children under 18 in poverty (2010) 18.0
ECONOMY 2010 2000-10 changeIncome per capita $32,040 47.5%
Labor Force 8,149 -3.1%Unemployed 9.8% 63.3
Under $25,000- $100,000 Annual household $25,000 $99,999 and overincome (2010) 31.5% 60.4% 8.1%
% of total jobsJobs by Industry (2010) county stateConstruction 3.8% 0.1%Farm 15.1 1.5Information, finance, real estate 5.6 0.0Government 13.9 0.1Manufacturing and transportation 9.5 0.1Business and education 3.4 0.0Health and social services 0.0 0.0Forestry, mining, utilities 7.4 1.0Wholesale and retail trade 12.3 0.1Other services 12.1 0.1Total jobs - 0.1
REVENUES AND EXPENDITURES
Revenue Collections (millions)State sales & use tax (est. 2011) $10.5Individual income tax (2010) 7.2 State motor fuel tax (est. 2011) 1.2Local property tax (2008) 10.4
State Expenditures (millions)Education (2011) $14.5Medicaid (2011) (with Jefferson & Washington Counties) 63.2State payroll (2011) 6.5
Number of state employees (2011) 132
LAND USE Equalized assessed value 2009 1999-09 (millions) changeFarm $ 37.6 -39.9%Residential 52.4 28.7Industrial 14.9 104.5Commercial 25.0 45.5Total $129.8 1.7%
2007 1997-07 changeNumber of farms 1,233 26.9%Acres of farms 333,255 3.9
Foreign-owned Parcels Acresagricultural land (2010) 14 10,511
ELECTIONS
Primary Dem. Rep. Total2002 1,496 3,836 5,4512004 1,004 1,859 3,0332006 2,415 1,917 4,4052008 1,807 2,947 4,9172010 803 4,398 5,2012012 489 2,122 2,611
Registered Number Percent General voters voting voting2002 12,531 7,800 62.2%2004 13,002 8,355 64.32006 12,159 7,526 61.92008 12,640 8,172 64.72010 12,689 6,983 55.02012 12,933 7,744 59.9
Office Dem. Rep.2002 Governor 30.8% 66.8%2004 President 25.8 73.62006 Governor 23.7 69.82008 President 31.6 66.82010 Governor 16.6 79.72012 President 19.7 78.0

Illinois County Data Book / 109
White CountyCongressional District: 15Senate District: 55House District: 109County Seat: CarmiEstablished: December 9, 1815Area: 495 square miles
POPULATION
2000 Census 15,3712010 Census 14,665Percent change (2000-2010) -4.6%
Race (2010)White (non-Hispanic) 97.6%Black or African American 0.3American Indian or Alaskan Native 0.3Asian and Pacific Islander 0.2
Hispanic origin, any race 1.1%
Age (2010)Under 18 20.9%18 to 64 58.165 and over 21.0Median age (2010) 45.2 years
Education (age 25 or over) (2010)12 or more years 84.5%16 or more years 12.2
Single female households with children < 18 (2010) 8.0%Single male households with children < 18 (2010) 4.1Children under 18 in poverty (2010) 25.7
ECONOMY 2010 2000-10 changeIncome per capita $35,461 48.6%
Labor Force 7,813 4.3%Unemployed 8.8% 72.5
Under $25,000- $100,000 Annual household $25,000 $99,999 and overincome (2010) 34.2% 56.4% 9.4%
% of total jobsJobs by Industry (2010) county stateConstruction 3.8% 0.1%Farm 7.0 0.6Information, finance, real estate 7.2 0.1Government 12.4 0.1Manufacturing and transportation 8.2 0.1Business and education 3.8 0.0Health and social services 0.0 0.0Forestry, mining, utilities 18.4 2.3Wholesale and retail trade 11.8 0.1Other services 14.5 0.1Total jobs - 0.1
REVENUES AND EXPENDITURES
Revenue Collections (millions)State sales & use tax (est. 2011) $9.8Individual income tax (2010) 7.3 State motor fuel tax (est. 2011) 1.1Local property tax (2008) 9.9
State Expenditures (millions)Education (2011) $12.6Medicaid (2011) 13.6State payroll (2011) 4.0
Number of state employees (2011) 70
LAND USE Equalized assessed value 2009 1999-09 (millions) changeFarm $ 28.0 -34.4%Residential 58.9 50.7Industrial 31.3 98.6Commercial 23.4 50.2Total $141.6 25.1%
2007 1997-07 changeNumber of farms 481 11.3%Acres of farms 296,989 15.8
Foreign-owned Parcels Acresagricultural land (2010) 0 0
ELECTIONS
Primary Dem. Rep. Total2002 3,750 1,207 4,9682004 1,556 1,023 2,5852006 1,759 1,135 2,9932008 2,461 1,450 3,9112010 699 1,091 1,7902012 771 1,497 2,268
Registered Number Percent General voters voting voting2002 11,465 7,437 64.9%2004 11,580 8,367 72.32006 11,820 6,330 53.62008 11,566 7,571 65.52010 11,598 5,361 46.22012 10,918 7,149 65.5
Office Dem. Rep.2002 Governor 44.7% 53.1%2004 President 37.0 62.42006 Governor 33.3 60.32008 President 44.5 53.52010 Governor 28.6 67.02012 President 31.0 67.0

110 / Illinois County Data Book
Whiteside CountyCongressional District: 17Senate Districts: 36, 45House Districts: 71, 89County Seat: MorrisonEstablished: January 16, 1836Area: 685 square miles
POPULATION
2000 Census 60,6532010 Census 58,498Percent change (2000-2010) -3.6%
Race (2010)White (non-Hispanic) 85.9%Black or African American 1.2American Indian or Alaskan Native 0.2Asian and Pacific Islander 0.5
Hispanic origin, any race 11.0%
Age (2010)Under 18 23.5%18 to 64 59.065 and over 17.5Median age (2010) 41.8 years
Education (age 25 or over) (2010)12 or more years 85.5%16 or more years 16.1
Single female households with children < 18 (2010) 10.1%Single male households with children < 18 (2010) 4.4Children under 18 in poverty (2010) 17.6
ECONOMY 2010 2000-10 changeIncome per capita $34,898 39.8%
Labor Force 29,862 -3.3%Unemployed 11.0% 155.8
Under $25,000- $100,000 Annual household $25,000 $99,999 and overincome (2010) 23.8% 63.8% 12.4%
% of total jobsJobs by Industry (2010) county stateConstruction 4.0% 0.3%Farm 4.2 1.4Information, finance, real estate 6.9 0.2Government 16.4 0.5Manufacturing and transportation 14.3 0.4Business and education 7.8 0.2Health and social services 0.0 0.0Forestry, mining, utilities 0.0 0.0Wholesale and retail trade 17.9 0.5Other services 13.5 0.4Total jobs - 0.4
REVENUES AND EXPENDITURES
Revenue Collections (millions)State sales & use tax (est. 2011) $38.3Individual income tax (2010) 27.4 State motor fuel tax (est. 2011) 4.6Local property tax (2008) 62.2
State Expenditures (millions)Education (2011) $36.1Medicaid (2011) 56.3State payroll (2011) 34.3
Number of state employees (2011) 571
LAND USE Equalized assessed value 2009 1999-09 (millions) changeFarm $ 99.6 -12.6%Residential 518.5 37.9Industrial 32.5 21.3Commercial 128.1 53.6Total $778.8 29.7%
2007 1997-07 changeNumber of farms 1,132 9.0%Acres of farms 405,333 5.4
Foreign-owned Parcels Acresagricultural land (2010) 2 215
ELECTIONS
Primary Dem. Rep. Total2002 3,234 4,162 8,3512004 3,175 2,695 5,9022006 1,859 3,766 5,6322008 7,757 4,985 12,7772010 2,479 3,105 5,6352012 2,404 4,475 6,919
Registered Number Percent General voters voting voting2002 36,423 17,379 47.7%2004 39,965 27,694 69.32006 42,621 17,916 42.02008 43,590 27,142 62.32010 38,300 19,240 50.22012 38,166 25,994 68.1
Office Dem. Rep.2002 Governor 49.1% 47.9%2004 President 51.1 48.22006 Governor 47.0 43.52008 President 58.0 40.42010 Governor 37.1 55.82012 President 57.6 40.5

Illinois County Data Book / 111
Will CountyCongressional Districts: 1-3, 11, 14, 16Senate Districts: 15, 17, 19, 21, 38,
40-43, 49House Districts: 29, 34, 37, 38, 41, 75,
79-82, 84-86, 97, 98County Seat: JolietEstablished: January 12, 1836Area: 837 square miles
POPULATION
2000 Census 502,2662010 Census 677,560Percent change (2000-2010) 34.9%
Race (2010)White (non-Hispanic) 67.2%Black or African American 11.0American Indian or Alaskan Native 0.1Asian and Pacific Islander 4.5
Hispanic origin, any race 15.6%
Age (2010)Under 18 29.1%18 to 64 61.765 and over 9.3Median age (2010) 35.4 years
Education (age 25 or over) (2010)12 or more years 90.0%16 or more years 30.7
Single female households with children < 18 (2010) 7.9%Single male households with children < 18 (2010) 2.7Children under 18 in poverty (2010) 9.0
ECONOMY 2010 2000-10 changeIncome per capita $40,395 32.3%
Labor Force 366,596 31.5%Unemployed 10.7% 161.0
Under $25,000- $100,000 Annual household $25,000 $99,999 and overincome (2010) 11.9% 54.7% 33.4%
% of total jobsJobs by Industry (2010) county stateConstruction 6.2% 5.0%Farm 0.4 1.2Information, finance, real estate 10.7 3.1Government 14.0 4.0Manufacturing and transportation 12.0 3.5Business and education 13.1 2.6Health and social services 9.9 3.1Forestry, mining, utilities 1.0 4.2Wholesale and retail trade 17.8 4.5Other services 15.0 3.8Total jobs - 3.5
REVENUES AND EXPENDITURES
Revenue Collections (millions)State sales & use tax (est. 2011) $ 462.1Individual income tax (2010) 463.2 State motor fuel tax (est. 2011) 65.1Local property tax (2008) 1,501.0
State Expenditures (millions)Education (2011) $288.4Medicaid (2011) 296.6State payroll (2011) 171.6
Number of state employees (2011) 2,683
LAND USE Equalized assessed value 2009 1999-09 (millions) changeFarm $ 284.1 32.1%Residential 16,773.5 164.7Industrial 2,415.5 82.5Commercial 2,767.7 182.4Total $22,240.8 151.2%
2007 1997-07 changeNumber of farms 877 -3.6%Acres of farms 220,851 -24.8
Foreign-owned Parcels Acresagricultural land (2010) 12 1,050
ELECTIONS
Primary Dem. Rep. Total2002 41,919 50,564 97,4102004 40,964 39,222 84,8752006 37,403 55,158 105,0922008 88,646 53,422 144,0402010 31,273 46,105 79,0002012 23,022 53,727 78,877
Registered Number Percent General voters voting voting2002 295,501 150,153 50.8%2004 335,652 250,805 74.72006 344,584 162,745 47.22008 373,847 288,709 77.22010 371,079 196,857 53.02012 386,172 279,352 72.3
Office Dem. Rep.2002 Governor 43.9% 53.0%2004 President 46.9 52.42006 Governor 46.5 42.22008 President 56.0 42.82010 Governor 41.0 50.32012 President 52.0 46.5

112 / Illinois County Data Book
Williamson CountyCongressional District: 12Senate District: 59House District: 117County Seat: MarionEstablished: February 28, 1839Area: 424 square miles
POPULATION
2000 Census 61,2962010 Census 66,357Percent change (2000-2010) 8.3%
Race (2010)White (non-Hispanic) 91.5%Black or African American 3.8American Indian or Alaskan Native 0.3Asian and Pacific Islander 0.9
Hispanic origin, any race 2.0%
Age (2010)Under 18 22.1%18 to 64 61.565 and over 16.3Median age (2010) 40.1 years
Education (age 25 or over) (2010)12 or more years 88.2%16 or more years 21.7
Single female households with children < 18 (2010) 10.5%Single male households with children < 18 (2010) 4.3Children under 18 in poverty (2010) 24.3
ECONOMY 2010 2000-10 changeIncome per capita $33,143 46.1%
Labor Force 35,430 18.4%Unemployed 9.5% 53.2
Under $25,000- $100,000 Annual household $25,000 $99,999 and overincome (2010) 30.5% 57.8% 11.7%
% of total jobsJobs by Industry (2010) county stateConstruction 6.4% 0.7%Farm 1.7 0.7Information, finance, real estate 11.6 0.4Government 16.7 0.6Manufacturing and transportation 8.5 0.3Business and education 10.2 0.3Health and social services 14.7 0.6Forestry, mining, utilities 0.7 0.4Wholesale and retail trade 13.5 0.5Other services 15.0 0.5Total jobs - 0.5
REVENUES AND EXPENDITURES
Revenue Collections (millions)State sales & use tax (est. 2011) $60.4Individual income tax (2010) 29.3 State motor fuel tax (est. 2011) 8.4Local property tax (2008) 60.5
State Expenditures (millions)Education (2011) $40.4Medicaid (2011) 59.6State payroll (2011) 51.4
Number of state employees (2011) 905
LAND USE Equalized assessed value 2009 1999-09 (millions) changeFarm $ 91.9 144.7%Residential 530.6 72.0Industrial 77.1 111.8Commercial 295.3 106.7Total $995.0 89.4%
2007 1997-07 changeNumber of farms 616 5.3%Acres of farms 94,124 2.0
Foreign-owned Parcels Acresagricultural land (2010) 2 1,283
ELECTIONS
Primary Dem. Rep. Total2002 7,251 3,843 11,1952004 4,618 2,728 7,3462006 4,859 3,533 8,4422008 9,372 7,951 18,1982010 4,857 5,426 10,3242012 3,781 6,877 10,658
Registered Number Percent General voters voting voting2002 40,870 22,082 54.0%2004 44,417 30,162 67.92006 42,900 21,094 49.22008 43,676 30,519 69.92010 43,569 22,735 52.22012 43,614 29,519 67.7
Office Dem. Rep.2002 Governor 45.4% 52.1%2004 President 39.0 60.42006 Governor 41.6 40.22008 President 41.8 56.52010 Governor 38.6 54.62012 President 36.5 61.5
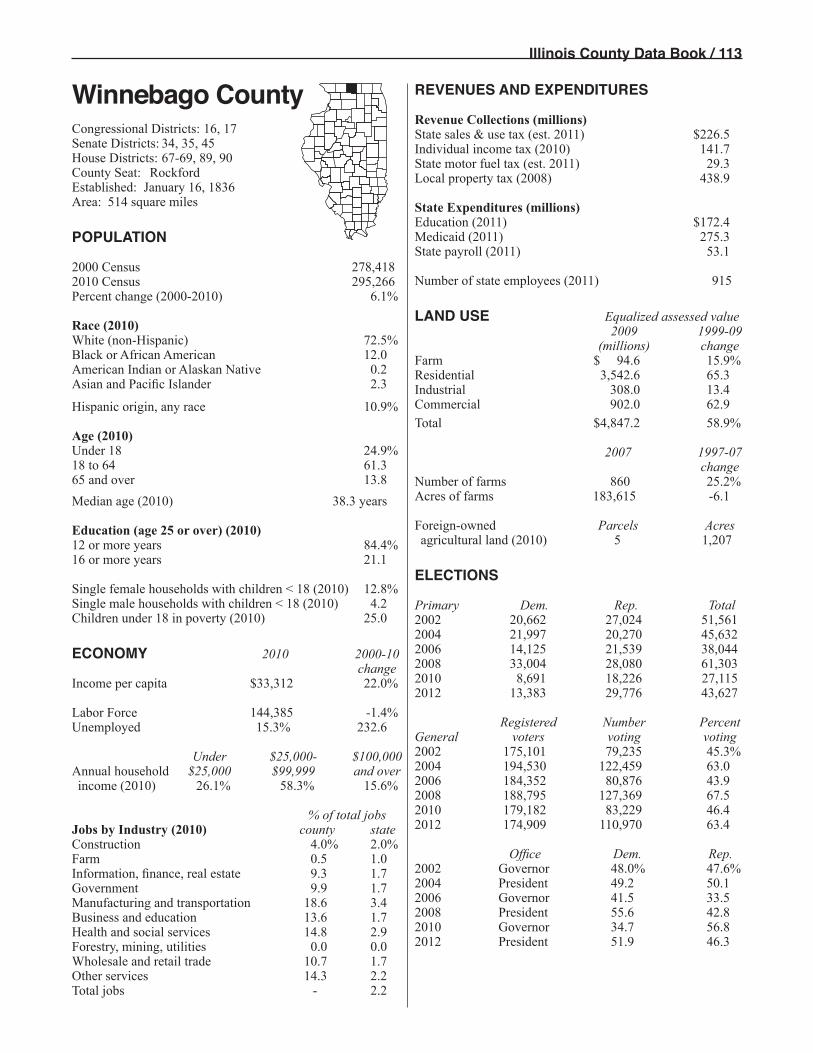
Illinois County Data Book / 113
Winnebago CountyCongressional Districts: 16, 17Senate Districts: 34, 35, 45House Districts: 67-69, 89, 90County Seat: RockfordEstablished: January 16, 1836Area: 514 square miles
POPULATION
2000 Census 278,4182010 Census 295,266Percent change (2000-2010) 6.1%
Race (2010)White (non-Hispanic) 72.5%Black or African American 12.0American Indian or Alaskan Native 0.2Asian and Pacific Islander 2.3
Hispanic origin, any race 10.9%
Age (2010)Under 18 24.9%18 to 64 61.365 and over 13.8Median age (2010) 38.3 years
Education (age 25 or over) (2010)12 or more years 84.4%16 or more years 21.1
Single female households with children < 18 (2010) 12.8%Single male households with children < 18 (2010) 4.2Children under 18 in poverty (2010) 25.0
ECONOMY 2010 2000-10 changeIncome per capita $33,312 22.0%
Labor Force 144,385 -1.4%Unemployed 15.3% 232.6
Under $25,000- $100,000 Annual household $25,000 $99,999 and overincome (2010) 26.1% 58.3% 15.6%
% of total jobsJobs by Industry (2010) county stateConstruction 4.0% 2.0%Farm 0.5 1.0Information, finance, real estate 9.3 1.7Government 9.9 1.7Manufacturing and transportation 18.6 3.4Business and education 13.6 1.7Health and social services 14.8 2.9Forestry, mining, utilities 0.0 0.0Wholesale and retail trade 10.7 1.7Other services 14.3 2.2Total jobs - 2.2
REVENUES AND EXPENDITURES
Revenue Collections (millions)State sales & use tax (est. 2011) $226.5Individual income tax (2010) 141.7 State motor fuel tax (est. 2011) 29.3Local property tax (2008) 438.9
State Expenditures (millions)Education (2011) $172.4Medicaid (2011) 275.3State payroll (2011) 53.1
Number of state employees (2011) 915
LAND USE Equalized assessed value 2009 1999-09 (millions) changeFarm $ 94.6 15.9%Residential 3,542.6 65.3Industrial 308.0 13.4Commercial 902.0 62.9Total $4,847.2 58.9%
2007 1997-07 changeNumber of farms 860 25.2%Acres of farms 183,615 -6.1
Foreign-owned Parcels Acresagricultural land (2010) 5 1,207
ELECTIONS
Primary Dem. Rep. Total2002 20,662 27,024 51,5612004 21,997 20,270 45,6322006 14,125 21,539 38,0442008 33,004 28,080 61,3032010 8,691 18,226 27,1152012 13,383 29,776 43,627
Registered Number Percent General voters voting voting2002 175,101 79,235 45.3%2004 194,530 122,459 63.02006 184,352 80,876 43.92008 188,795 127,369 67.52010 179,182 83,229 46.42012 174,909 110,970 63.4
Office Dem. Rep.2002 Governor 48.0% 47.6%2004 President 49.2 50.12006 Governor 41.5 33.52008 President 55.6 42.82010 Governor 34.7 56.82012 President 51.9 46.3

114 / Illinois County Data Book
Woodford CountyCongressional District: 18Senate Districts: 37, 53House Districts: 73, 106County Seat: EurekaEstablished: February 27, 1841Area: 528 square miles
POPULATION
2000 Census 35,4692010 Census 38,664Percent change (2000-2010) 9.0%
Race (2010)White (non-Hispanic) 96.5%Black or African American 0.5American Indian or Alaskan Native 0.2Asian and Pacific Islander 0.6
Hispanic origin, any race 1.4%
Age (2010)Under 18 25.8%18 to 64 59.465 and over 14.8Median age (2010) 39.6 years
Education (age 25 or over) (2010)12 or more years 92.4%16 or more years 26.0
Single female households with children < 18 (2010) 6.1%Single male households with children < 18 (2010) 2.8Children under 18 in poverty (2010) 10.6
ECONOMY 2010 2000-10 changeIncome per capita $40,316 43.8%
Labor Force 20,946 11.6%Unemployed 8.3% 137.1
Under $25,000- $100,000 Annual household $25,000 $99,999 and overincome (2010) 15.9% 57.8% 26.3%
% of total jobsJobs by Industry (2010) county stateConstruction 7.3% 0.3%Farm 6.6 1.3Information, finance, real estate 8.0 0.1Government 13.0 0.2Manufacturing and transportation 18.7 0.3Business and education 5.2 0.1Health and social services 10.5 0.2Forestry, mining, utilities 0.4 0.1Wholesale and retail trade 13.9 0.2Other services 12.9 0.2Total jobs - 0.2
REVENUES AND EXPENDITURES
Revenue Collections (millions)State sales & use tax (est. 2011) $17.9Individual income tax (2010) 26.4 State motor fuel tax (est. 2011) 5.2Local property tax (2008) 53.5
State Expenditures (millions)Education (2011) $ 25.5Medicaid (2011) (with Peoria County) 177.8State payroll (2011) 11.2
Number of state employees (2011) 195
LAND USE Equalized assessed value 2009 1999-09 (millions) changeFarm $ 138.6 0.5%Residential 521.9 79.8Industrial 13.2 19.4Commercial 76.5 59.0Total $750.2 53.9%
2007 1997-07 changeNumber of farms 932 1.0%Acres of farms 288,400 -3.8
Foreign-owned Parcels Acresagricultural land (2010) 1 299
ELECTIONS
Primary Dem. Rep. Total2002 1,349 6,597 7,9562004 1,755 5,313 7,3992006 675 5,504 6,1792008 3,214 7,516 10,7452010 984 5,350 6,3462012 561 6,798 7,458
Registered Number Percent General voters voting voting2002 23,826 13,018 54.6%2004 24,616 18,924 76.92006 24,587 13,059 53.12008 25,578 19,639 76.82010 25,333 14,156 55.92012 28,765 19,026 66.1
Office Dem. Rep.2002 Governor 31.2% 66.0%2004 President 31.9 67.52006 Governor 24.9 57.72008 President 35.9 62.62010 Governor 21.4 72.82012 President 29.5 68.7
CountyRankingsforSelectedSocial&Economic
Characteristics
Part 3Stark


Illinois County Data Book / 117
TABLE 1: AREAS OF ILLINOIS COUNTIES
By county In rank order
Square Square Square SquareCounty miles Rank County miles Rank County miles Rank County miles Rank
Adams 857 12 Lee 725 19 McLean 1,184 1 Coles 508 52Alexander 236 97 Livingston 1,044 4 LaSalle 1,135 2 Clark 502 53Bond 380 77 Logan 618 33 Iroquois 1,117 3 White 495 54Boone 281 93 Macon 581 38 Livingston 1,044 4 Jasper 494 55Brown 306 91 Macoupin 864 11 Champaign 997 5 Ford 486 56Bureau 869 8 Madison 725 20 Cook 946 6 Effingham 479 57Calhoun 254 94 Marion 572 40 Vermilion 899 7 Clinton 474 58Carroll 444 61 Marshall 386 75 Bureau 869 8 Clay 469 59Cass 376 79 Mason 539 48 Sangamon 868 9 Lake 448 60Champaign 997 5 Massac 239 96 Fulton 866 10 Carroll 444 61
Christian 709 24 McDonough 589 36 Macoupin 864 11 Crawford 444 62Clark 502 53 McHenry 604 34 Adams 857 12 Perry 441 63Clay 469 59 McLean 1,184 1 Will 837 13 Piatt 440 64Clinton 474 58 Menard 314 90 Pike 830 14 Schuyler 437 65Coles 508 52 Mercer 561 45 Henry 823 15 Hamilton 435 66Cook 946 6 Monroe 388 74 Hancock 795 16 Rock Island 427 67Crawford 444 62 Montgomery 704 25 Ogle 759 17 Williamson 424 68Cumberland 346 84 Morgan 569 42 Shelby 759 18 Grundy 420 69DeKalb 634 30 Moultrie 336 86 Lee 725 19 Douglas 417 70DeWitt 398 73 Ogle 759 17 Madison 725 20 Union 416 71
Douglas 417 70 Peoria 620 32 Fayette 717 21 Franklin 412 72DuPage 334 87 Perry 441 63 Knox 716 22 DeWitt 398 73Edgar 624 31 Piatt 440 64 Wayne 714 23 Monroe 388 74Edwards 222 99 Pike 830 14 Christian 709 24 Marshall 386 75Effingham 479 57 Pope 371 81 Montgomery 704 25 Saline 383 76Fayette 717 21 Pulaski 201 100 Whiteside 685 26 Bond 380 77Ford 486 56 Putnam 160 102 Kankakee 678 27 Henderson 379 78Franklin 412 72 Randolph 578 39 St. Clair 664 28 Cass 376 79Fulton 866 10 Richland 360 83 Tazewell 649 29 Lawrence 372 80Gallatin 324 88 Rock Island 427 67 DeKalb 634 30 Pope 371 81
Greene 543 46 Saline 383 76 Edgar 624 31 Jersey 369 82Grundy 420 69 Sangamon 868 9 Peoria 620 32 Richland 360 83Hamilton 435 66 Schuyler 437 65 Logan 618 33 Cumberland 346 84Hancock 795 16 Scott 251 95 McHenry 604 34 Johnson 346 84Hardin 178 101 Shelby 759 18 Jo Daviess 601 35 Moultrie 336 86Henderson 379 78 St. Clair 664 28 McDonough 589 36 DuPage 334 87Henry 823 15 Stark 288 92 Jackson 588 37 Gallatin 324 88Iroquois 1,117 3 Stephenson 564 43 Macon 581 38 Kendall 321 89Jackson 588 37 Tazewell 649 29 Randolph 578 39 Menard 314 90Jasper 494 55 Union 416 71 Marion 572 40 Brown 306 91
Jefferson 571 41 Vermilion 899 7 Jefferson 571 41 Stark 288 92Jersey 369 82 Wabash 224 98 Morgan 569 42 Boone 281 93Jo Daviess 601 35 Warren 543 47 Stephenson 564 43 Calhoun 254 94Johnson 346 84 Washington 563 44 Washington 563 44 Scott 251 95Kane 521 50 Wayne 714 23 Mercer 561 45 Massac 239 96Kankakee 678 27 White 495 54 Greene 543 46 Alexander 236 97Kendall 321 89 Whiteside 685 26 Warren 543 47 Wabash 224 98Knox 716 22 Will 837 13 Mason 539 48 Edwards 222 99Lake 448 60 Williamson 424 68 Woodford 528 49 Pulaski 201 100LaSalle 1,135 2 Winnebago 514 51 Kane 521 50 Hardin 178 101Lawrence 372 80 Woodford 528 49 Winnebago 514 51 Putnam 160 102

118 / Illinois County Data Book
TABLE 2: POPULATIONS OF ILLINOIS COUNTIES, 2000
By county In rank order
County Rank County Rank County Rank County Rank
Adams 68,277 21 Lee 36,062 40 Cook 5,376,741 1 Saline 26,733 52Alexander 9,590 89 Livingston 39,678 35 DuPage 904,161 2 Perry 23,094 53Bond 17,633 64 Logan 31,183 49 Lake 644,356 3 Shelby 22,893 54Boone 41,786 32 McDonough 32,913 47 Will 502,266 4 Jo Daviess 22,289 55Brown 6,950 95 McHenry 260,077 7 Kane 404,119 5 Fayette 21,802 56Bureau 35,503 42 McLean 150,433 13 Winnebago 278,418 6 Jersey 21,668 57Calhoun 5,084 100 Macon 114,706 16 McHenry 260,077 7 Crawford 20,452 58Carroll 16,674 70 Macoupin 49,019 30 Madison 258,941 8 Hancock 20,121 59Cass 13,695 82 Madison 258,941 8 St. Clair 256,082 9 Douglas 19,922 60Champaign 179,669 12 Marion 41,691 33 Sangamon 188,951 10 Edgar 19,704 61
Christian 35,372 44 Marshall 13,180 83 Peoria 183,433 11 Warren 18,735 62Clark 17,008 67 Mason 16,038 73 Champaign 179,669 12 Union 18,293 63Clay 14,560 79 Massac 15,161 76 McLean 150,433 13 Bond 17,633 64Clinton 35,535 41 Menard 12,486 86 Rock Island 149,374 14 Pike 17,384 65Coles 53,196 27 Mercer 16,957 68 Tazewell 128,485 15 Wayne 17,151 66Cook 5,376,741 1 Monroe 27,619 51 Macon 114,706 16 Clark 17,008 67Crawford 20,452 58 Montgomery 30,652 50 LaSalle 111,509 17 Mercer 16,957 68Cumberland 11,253 87 Morgan 36,616 39 Kankakee 103,833 18 DeWitt 16,798 69DeKalb 88,969 19 Moultrie 14,287 80 DeKalb 88,969 19 Carroll 16,674 70DeWitt 16,798 69 Ogle 51,032 28 Vermilion 83,919 20 Piatt 16,365 71
Douglas 19,922 60 Peoria 183,433 11 Adams 68,277 21 Richland 16,149 72DuPage 904,161 2 Perry 23,094 53 Williamson 61,296 22 Mason 16,038 73Edgar 19,704 61 Piatt 16,365 71 Whiteside 60,653 23 Lawrence 15,452 74Edwards 6,971 94 Pike 17,384 65 Jackson 59,612 24 White 15,371 75Effingham 34,264 45 Pope 4,413 102 Knox 55,836 25 Massac 15,161 76Fayette 21,802 56 Pulaski 7,348 92 Kendall 54,544 26 Washington 15,148 77Ford 14,241 81 Putnam 6,086 98 Coles 53,196 27 Greene 14,761 78Franklin 39,018 36 Randolph 33,893 46 Ogle 51,032 28 Clay 14,560 79Fulton 38,250 37 Richland 16,149 72 Henry 51,020 29 Moultrie 14,287 80Gallatin 6,445 96 Rock Island 149,374 14 Macoupin 49,019 30 Ford 14,241 81
Greene 14,761 78 St. Clair 256,082 9 Stephenson 48,979 31 Cass 13,695 82Grundy 37,535 38 Saline 26,733 52 Boone 41,786 32 Marshall 13,180 83Hamilton 8,621 90 Sangamon 188,951 10 Marion 41,691 33 Wabash 12,937 84Hancock 20,121 59 Schuyler 7,189 93 Jefferson 40,045 34 Johnson 12,878 85Hardin 4,800 101 Scott 5,537 99 Livingston 39,678 35 Menard 12,486 86Henderson 8,213 91 Shelby 22,893 54 Franklin 39,018 36 Cumberland 11,253 87Henry 51,020 29 Stark 6,332 97 Fulton 38,250 37 Jasper 10,117 88Iroquois 31,334 48 Stephenson 48,979 31 Grundy 37,535 38 Alexander 9,590 89Jackson 59,612 24 Tazewell 128,485 15 Morgan 36,616 39 Hamilton 8,621 90Jasper 10,117 88 Union 18,293 63 Lee 36,062 40 Henderson 8,213 91
Jefferson 40,045 34 Vermilion 83,919 20 Clinton 35,535 41 Pulaski 7,348 92Jersey 21,668 57 Wabash 12,937 84 Bureau 35,503 42 Schuyler 7,189 93Jo Daviess 22,289 55 Warren 18,735 62 Woodford 35,469 43 Edwards 6,971 94Johnson 12,878 85 Washington 15,148 77 Christian 35,372 44 Brown 6,950 95Kane 404,119 5 Wayne 17,151 66 Effingham 34,264 45 Gallatin 6,445 96Kankakee 103,833 18 White 15,371 75 Randolph 33,893 46 Stark 6,332 97Kendall 54,544 26 Whiteside 60,653 23 McDonough 32,913 47 Putnam 6,086 98Knox 55,836 25 Will 502,266 4 Iroquois 31,334 48 Scott 5,537 99Lake 644,356 3 Williamson 61,296 22 Logan 31,183 49 Calhoun 5,084 100LaSalle 111,509 17 Winnebago 278,418 6 Montgomery 30,652 50 Hardin 4,800 101Lawrence 15,452 74 Woodford 35,469 43 Monroe 27,619 51 Pope 4,413 102
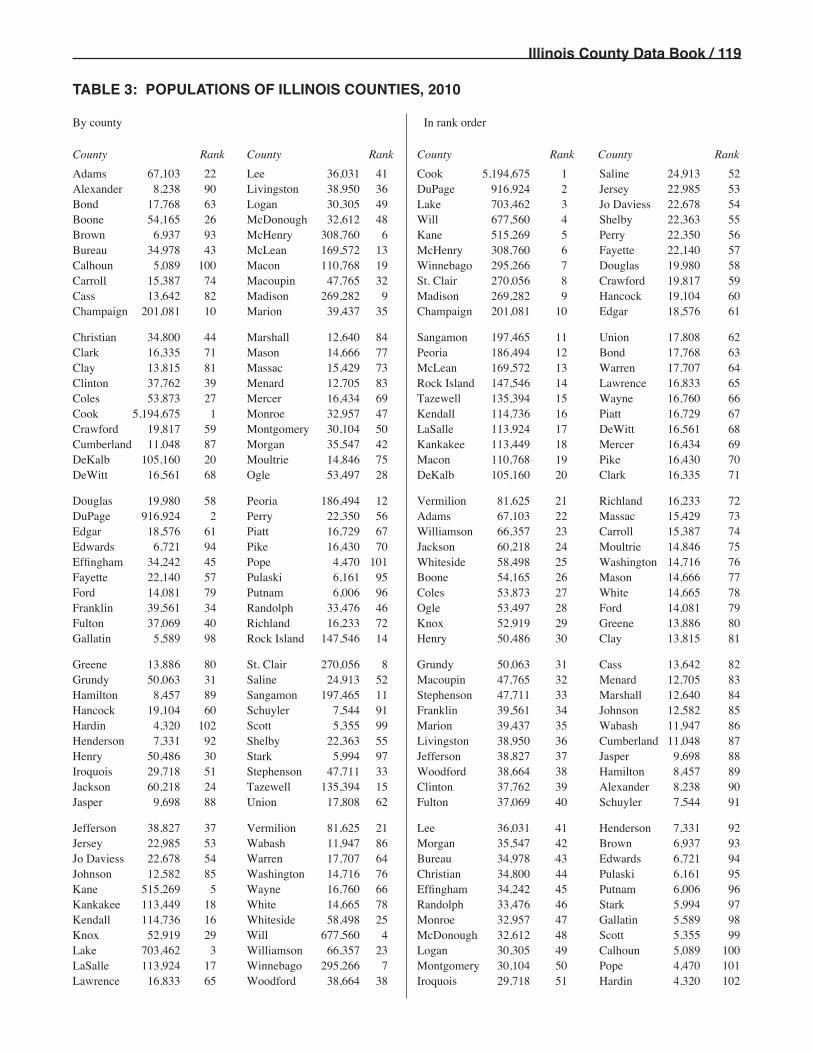
Illinois County Data Book / 119
TABLE 3: POPULATIONS OF ILLINOIS COUNTIES, 2010
By county In rank order
County Rank County Rank County Rank County Rank
Adams 67,103 22 Lee 36,031 41 Cook 5,194,675 1 Saline 24,913 52Alexander 8,238 90 Livingston 38,950 36 DuPage 916,924 2 Jersey 22,985 53Bond 17,768 63 Logan 30,305 49 Lake 703,462 3 Jo Daviess 22,678 54Boone 54,165 26 McDonough 32,612 48 Will 677,560 4 Shelby 22,363 55Brown 6,937 93 McHenry 308,760 6 Kane 515,269 5 Perry 22,350 56Bureau 34,978 43 McLean 169,572 13 McHenry 308,760 6 Fayette 22,140 57Calhoun 5,089 100 Macon 110,768 19 Winnebago 295,266 7 Douglas 19,980 58Carroll 15,387 74 Macoupin 47,765 32 St. Clair 270,056 8 Crawford 19,817 59Cass 13,642 82 Madison 269,282 9 Madison 269,282 9 Hancock 19,104 60Champaign 201,081 10 Marion 39,437 35 Champaign 201,081 10 Edgar 18,576 61
Christian 34,800 44 Marshall 12,640 84 Sangamon 197,465 11 Union 17,808 62Clark 16,335 71 Mason 14,666 77 Peoria 186,494 12 Bond 17,768 63Clay 13,815 81 Massac 15,429 73 McLean 169,572 13 Warren 17,707 64Clinton 37,762 39 Menard 12,705 83 Rock Island 147,546 14 Lawrence 16,833 65Coles 53,873 27 Mercer 16,434 69 Tazewell 135,394 15 Wayne 16,760 66Cook 5,194,675 1 Monroe 32,957 47 Kendall 114,736 16 Piatt 16,729 67Crawford 19,817 59 Montgomery 30,104 50 LaSalle 113,924 17 DeWitt 16,561 68Cumberland 11,048 87 Morgan 35,547 42 Kankakee 113,449 18 Mercer 16,434 69DeKalb 105,160 20 Moultrie 14,846 75 Macon 110,768 19 Pike 16,430 70DeWitt 16,561 68 Ogle 53,497 28 DeKalb 105,160 20 Clark 16,335 71
Douglas 19,980 58 Peoria 186,494 12 Vermilion 81,625 21 Richland 16,233 72DuPage 916,924 2 Perry 22,350 56 Adams 67,103 22 Massac 15,429 73Edgar 18,576 61 Piatt 16,729 67 Williamson 66,357 23 Carroll 15,387 74Edwards 6,721 94 Pike 16,430 70 Jackson 60,218 24 Moultrie 14,846 75Effingham 34,242 45 Pope 4,470 101 Whiteside 58,498 25 Washington 14,716 76Fayette 22,140 57 Pulaski 6,161 95 Boone 54,165 26 Mason 14,666 77Ford 14,081 79 Putnam 6,006 96 Coles 53,873 27 White 14,665 78Franklin 39,561 34 Randolph 33,476 46 Ogle 53,497 28 Ford 14,081 79Fulton 37,069 40 Richland 16,233 72 Knox 52,919 29 Greene 13,886 80Gallatin 5,589 98 Rock Island 147,546 14 Henry 50,486 30 Clay 13,815 81
Greene 13,886 80 St. Clair 270,056 8 Grundy 50,063 31 Cass 13,642 82Grundy 50,063 31 Saline 24,913 52 Macoupin 47,765 32 Menard 12,705 83Hamilton 8,457 89 Sangamon 197,465 11 Stephenson 47,711 33 Marshall 12,640 84Hancock 19,104 60 Schuyler 7,544 91 Franklin 39,561 34 Johnson 12,582 85Hardin 4,320 102 Scott 5,355 99 Marion 39,437 35 Wabash 11,947 86Henderson 7,331 92 Shelby 22,363 55 Livingston 38,950 36 Cumberland 11,048 87Henry 50,486 30 Stark 5,994 97 Jefferson 38,827 37 Jasper 9,698 88Iroquois 29,718 51 Stephenson 47,711 33 Woodford 38,664 38 Hamilton 8,457 89Jackson 60,218 24 Tazewell 135,394 15 Clinton 37,762 39 Alexander 8,238 90Jasper 9,698 88 Union 17,808 62 Fulton 37,069 40 Schuyler 7,544 91
Jefferson 38,827 37 Vermilion 81,625 21 Lee 36,031 41 Henderson 7,331 92Jersey 22,985 53 Wabash 11,947 86 Morgan 35,547 42 Brown 6,937 93Jo Daviess 22,678 54 Warren 17,707 64 Bureau 34,978 43 Edwards 6,721 94Johnson 12,582 85 Washington 14,716 76 Christian 34,800 44 Pulaski 6,161 95Kane 515,269 5 Wayne 16,760 66 Effingham 34,242 45 Putnam 6,006 96Kankakee 113,449 18 White 14,665 78 Randolph 33,476 46 Stark 5,994 97Kendall 114,736 16 Whiteside 58,498 25 Monroe 32,957 47 Gallatin 5,589 98Knox 52,919 29 Will 677,560 4 McDonough 32,612 48 Scott 5,355 99Lake 703,462 3 Williamson 66,357 23 Logan 30,305 49 Calhoun 5,089 100LaSalle 113,924 17 Winnebago 295,266 7 Montgomery 30,104 50 Pope 4,470 101Lawrence 16,833 65 Woodford 38,664 38 Iroquois 29,718 51 Hardin 4,320 102

120 / Illinois County Data Book
TABLE 4: PERCENTAGE POPULATION CHANGE, 2000-2010
By county In rank order
County Rank County Rank County Rank County Rank
Adams -1.7% 55 Lee -0.1% 43 Kendall 110.4% 1 DeWitt -1.4% 52Alexander -14.1 101 Livingston -1.8 58 Will 34.9 2 Bureau -1.5 53Bond 0.8 38 Logan -2.8 67 Grundy 33.4 3 Christian -1.6 54Boone 29.6 4 McDonough -0.9 46 Boone 29.6 4 Adams -1.7 55Brown -0.2 44 McHenry 18.7 7 Kane 27.5 5 Montgomery -1.8 56Bureau -1.5 53 McLean 12.7 9 Monroe 19.3 6 Cumberland -1.8 57Calhoun 0.1 41 Macon -3.4 77 McHenry 18.7 7 Livingston -1.8 58Carroll -7.7 96 Macoupin -2.6 63 DeKalb 18.2 8 Hamilton -1.9 59Cass -0.4 45 Madison 4.0 24 McLean 12.7 9 Wayne -2.3 60Champaign 11.9 10 Marion -5.4 89 Champaign 11.9 10 Johnson -2.3 61
Christian -1.6 54 Marshall -4.1 81 Kankakee 9.3 11 Shelby -2.3 62Clark -4.0 80 Mason -8.6 97 Lake 9.2 12 Macoupin -2.6 63Clay -5.1 85 Massac 1.8 28 Woodford 9.0 13 Stephenson -2.6 64Clinton 6.3 16 Menard 1.8 29 Lawrence 8.9 14 Union -2.7 65Coles 1.3 36 Mercer -3.1 71 Williamson 8.3 15 Vermilion -2.7 66Cook -3.4 76 Monroe 19.3 6 Clinton 6.3 16 Logan -2.8 67Crawford -3.1 73 Montgomery -1.8 56 Jersey 6.1 17 Washington -2.9 68Cumberland -1.8 57 Morgan -2.9 69 Winnebago 6.1 18 Morgan -2.9 69DeKalb 18.2 8 Moultrie 3.9 25 St. Clair 5.5 19 Jefferson -3.0 70DeWitt -1.4 52 Ogle 4.8 22 Tazewell 5.4 20 Mercer -3.1 71
Douglas 0.3 40 Peoria 1.7 31 Schuyler 4.9 21 Fulton -3.1 72DuPage 1.4 33 Perry -3.2 74 Ogle 4.8 22 Crawford -3.1 73Edgar -5.7 92 Piatt 2.2 26 Sangamon 4.5 23 Perry -3.2 74Edwards -3.6 79 Pike -5.5 91 Madison 4.0 24 Scott -3.3 75Effingham -0.1 42 Pope 1.3 35 Moultrie 3.9 25 Cook -3.4 76Fayette 1.6 32 Pulaski -16.2 102 Piatt 2.2 26 Macon -3.4 77Ford -1.1 48 Putnam -1.3 51 LaSalle 2.2 27 Whiteside -3.6 78Franklin 1.4 34 Randolph -1.2 50 Massac 1.8 28 Edwards -3.6 79Fulton -3.1 72 Richland 0.5 39 Menard 1.8 29 Clark -4.0 80Gallatin -13.3 100 Rock Island -1.2 49 Jo Daviess 1.7 30 Marshall -4.1 81
Greene -5.9 93 St. Clair 5.5 19 Peoria 1.7 31 Jasper -4.1 82Grundy 33.4 3 Saline -6.8 94 Fayette 1.6 32 White -4.6 83Hamilton -1.9 59 Sangamon 4.5 23 DuPage 1.4 33 Hancock -5.1 84Hancock -5.1 84 Schuyler 4.9 21 Franklin 1.4 34 Clay -5.1 85Hardin -10.0 98 Scott -3.3 75 Pope 1.3 35 Iroquois -5.2 86Henderson -10.7 99 Shelby -2.3 62 Coles 1.3 36 Knox -5.2 87Henry -1.0 47 Stark -5.3 88 Jackson 1.0 37 Stark -5.3 88Iroquois -5.2 86 Stephenson -2.6 64 Bond 0.8 38 Marion -5.4 89Jackson 1.0 37 Tazewell 5.4 20 Richland 0.5 39 Warren -5.5 90Jasper -4.1 82 Union -2.7 65 Douglas 0.3 40 Pike -5.5 91
Jefferson -3.0 70 Vermilion -2.7 66 Calhoun 0.1 41 Edgar -5.7 92Jersey 6.1 17 Wabash -7.7 95 Effingham -0.1 42 Greene -5.9 93Jo Daviess 1.7 30 Warren -5.5 90 Lee -0.1 43 Saline -6.8 94Johnson -2.3 61 Washington -2.9 68 Brown -0.2 44 Wabash -7.7 95Kane 27.5 5 Wayne -2.3 60 Cass -0.4 45 Carroll -7.7 96Kankakee 9.3 11 White -4.6 83 McDonough -0.9 46 Mason -8.6 97Kendall 110.4 1 Whiteside -3.6 78 Henry -1.0 47 Hardin -10.0 98Knox -5.2 87 Will 34.9 2 Ford -1.1 48 Henderson -10.7 99Lake 9.2 12 Williamson 8.3 15 Rock Island -1.2 49 Gallatin -13.3 100LaSalle 2.2 27 Winnebago 6.1 18 Randolph -1.2 50 Alexander -14.1 101Lawrence 8.9 14 Woodford 9.0 13 Putnam -1.3 51 Pulaski -16.2 102
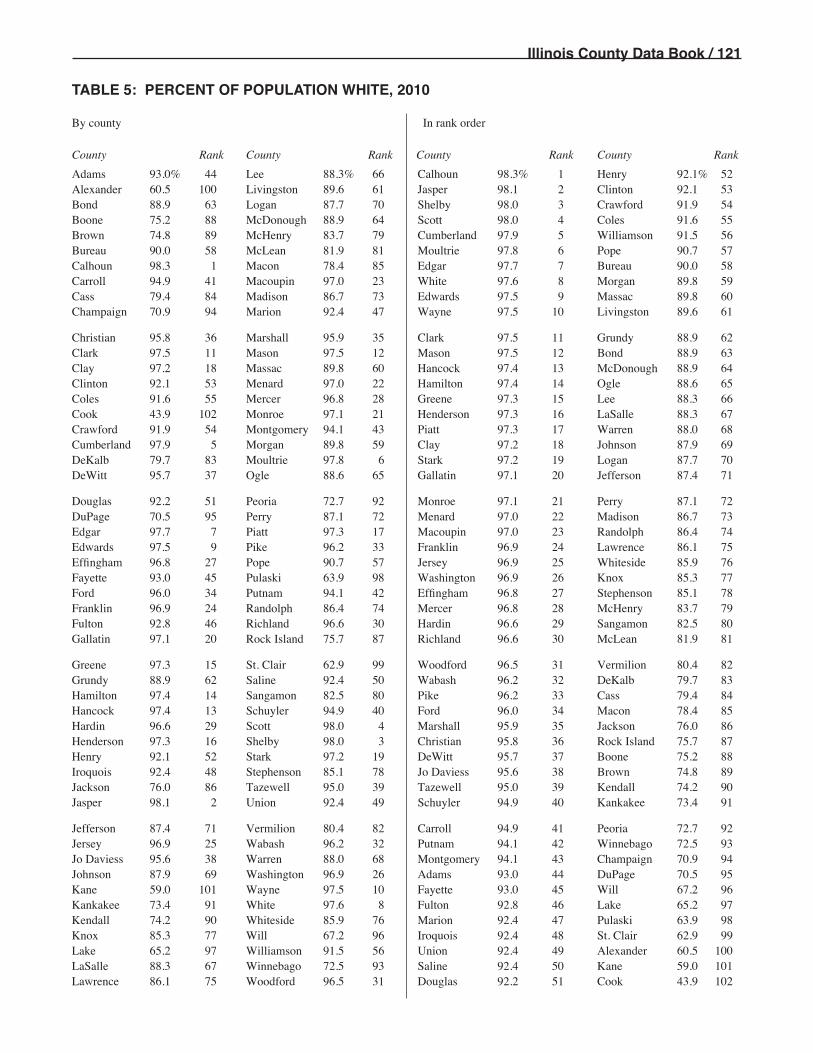
Illinois County Data Book / 121
TABLE 5: PERCENT OF POPULATION WHITE, 2010
By county In rank order
County Rank County Rank County Rank County Rank
Adams 93.0% 44 Lee 88.3% 66 Calhoun 98.3% 1 Henry 92.1% 52Alexander 60.5 100 Livingston 89.6 61 Jasper 98.1 2 Clinton 92.1 53Bond 88.9 63 Logan 87.7 70 Shelby 98.0 3 Crawford 91.9 54Boone 75.2 88 McDonough 88.9 64 Scott 98.0 4 Coles 91.6 55Brown 74.8 89 McHenry 83.7 79 Cumberland 97.9 5 Williamson 91.5 56Bureau 90.0 58 McLean 81.9 81 Moultrie 97.8 6 Pope 90.7 57Calhoun 98.3 1 Macon 78.4 85 Edgar 97.7 7 Bureau 90.0 58Carroll 94.9 41 Macoupin 97.0 23 White 97.6 8 Morgan 89.8 59Cass 79.4 84 Madison 86.7 73 Edwards 97.5 9 Massac 89.8 60Champaign 70.9 94 Marion 92.4 47 Wayne 97.5 10 Livingston 89.6 61
Christian 95.8 36 Marshall 95.9 35 Clark 97.5 11 Grundy 88.9 62Clark 97.5 11 Mason 97.5 12 Mason 97.5 12 Bond 88.9 63Clay 97.2 18 Massac 89.8 60 Hancock 97.4 13 McDonough 88.9 64Clinton 92.1 53 Menard 97.0 22 Hamilton 97.4 14 Ogle 88.6 65Coles 91.6 55 Mercer 96.8 28 Greene 97.3 15 Lee 88.3 66Cook 43.9 102 Monroe 97.1 21 Henderson 97.3 16 LaSalle 88.3 67Crawford 91.9 54 Montgomery 94.1 43 Piatt 97.3 17 Warren 88.0 68Cumberland 97.9 5 Morgan 89.8 59 Clay 97.2 18 Johnson 87.9 69DeKalb 79.7 83 Moultrie 97.8 6 Stark 97.2 19 Logan 87.7 70DeWitt 95.7 37 Ogle 88.6 65 Gallatin 97.1 20 Jefferson 87.4 71
Douglas 92.2 51 Peoria 72.7 92 Monroe 97.1 21 Perry 87.1 72DuPage 70.5 95 Perry 87.1 72 Menard 97.0 22 Madison 86.7 73Edgar 97.7 7 Piatt 97.3 17 Macoupin 97.0 23 Randolph 86.4 74Edwards 97.5 9 Pike 96.2 33 Franklin 96.9 24 Lawrence 86.1 75Effingham 96.8 27 Pope 90.7 57 Jersey 96.9 25 Whiteside 85.9 76Fayette 93.0 45 Pulaski 63.9 98 Washington 96.9 26 Knox 85.3 77Ford 96.0 34 Putnam 94.1 42 Effingham 96.8 27 Stephenson 85.1 78Franklin 96.9 24 Randolph 86.4 74 Mercer 96.8 28 McHenry 83.7 79Fulton 92.8 46 Richland 96.6 30 Hardin 96.6 29 Sangamon 82.5 80Gallatin 97.1 20 Rock Island 75.7 87 Richland 96.6 30 McLean 81.9 81
Greene 97.3 15 St. Clair 62.9 99 Woodford 96.5 31 Vermilion 80.4 82Grundy 88.9 62 Saline 92.4 50 Wabash 96.2 32 DeKalb 79.7 83Hamilton 97.4 14 Sangamon 82.5 80 Pike 96.2 33 Cass 79.4 84Hancock 97.4 13 Schuyler 94.9 40 Ford 96.0 34 Macon 78.4 85Hardin 96.6 29 Scott 98.0 4 Marshall 95.9 35 Jackson 76.0 86Henderson 97.3 16 Shelby 98.0 3 Christian 95.8 36 Rock Island 75.7 87Henry 92.1 52 Stark 97.2 19 DeWitt 95.7 37 Boone 75.2 88Iroquois 92.4 48 Stephenson 85.1 78 Jo Daviess 95.6 38 Brown 74.8 89Jackson 76.0 86 Tazewell 95.0 39 Tazewell 95.0 39 Kendall 74.2 90Jasper 98.1 2 Union 92.4 49 Schuyler 94.9 40 Kankakee 73.4 91
Jefferson 87.4 71 Vermilion 80.4 82 Carroll 94.9 41 Peoria 72.7 92Jersey 96.9 25 Wabash 96.2 32 Putnam 94.1 42 Winnebago 72.5 93Jo Daviess 95.6 38 Warren 88.0 68 Montgomery 94.1 43 Champaign 70.9 94Johnson 87.9 69 Washington 96.9 26 Adams 93.0 44 DuPage 70.5 95Kane 59.0 101 Wayne 97.5 10 Fayette 93.0 45 Will 67.2 96Kankakee 73.4 91 White 97.6 8 Fulton 92.8 46 Lake 65.2 97Kendall 74.2 90 Whiteside 85.9 76 Marion 92.4 47 Pulaski 63.9 98Knox 85.3 77 Will 67.2 96 Iroquois 92.4 48 St. Clair 62.9 99Lake 65.2 97 Williamson 91.5 56 Union 92.4 49 Alexander 60.5 100LaSalle 88.3 67 Winnebago 72.5 93 Saline 92.4 50 Kane 59.0 101Lawrence 86.1 75 Woodford 96.5 31 Douglas 92.2 51 Cook 43.9 102

122 / Illinois County Data Book
TABLE 6: PERCENT OF POPULATION BLACK OR AFRICAN AMERICAN, 2010
By county In rank order
County Rank County Rank County Rank County Rank
Adams 3.4% 46 Lee 4.7% 36 Alexander 35.3% 1 Pike 1.7% 52Alexander 35.3 1 Livingston 4.8 35 Pulaski 32.1 2 Warren 1.6 53Bond 6.0 29 Logan 7.4 23 St. Clair 30.3 3 Henry 1.5 54Boone 1.8 51 McDonough 4.9 34 Cook 24.4 4 Christian 1.4 55Brown 18.4 5 McHenry 1.0 59 Brown 18.4 5 Whiteside 1.2 56Bureau 0.5 70 McLean 7.2 24 Peoria 17.5 6 Grundy 1.2 57Calhoun 0.1 100 Macon 16.2 7 Macon 16.2 7 Tazewell 1.0 58Carroll 0.8 63 Macoupin 0.8 65 Kankakee 15.0 8 McHenry 1.0 59Cass 2.8 49 Madison 7.8 22 Jackson 14.1 9 Ogle 0.9 60Champaign 12.2 11 Marion 3.9 41 Vermilion 12.7 10 Greene 0.9 61
Christian 1.4 55 Marshall 0.3 81 Champaign 12.2 11 Union 0.8 62Clark 0.3 88 Mason 0.4 80 Winnebago 12.0 12 Carroll 0.8 63Clay 0.3 85 Massac 5.8 31 Sangamon 11.7 13 Iroquois 0.8 64Clinton 3.5 44 Menard 0.6 68 Will 11.0 14 Macoupin 0.8 65Coles 3.8 43 Mercer 0.3 89 Randolph 9.7 15 Washington 0.6 66Cook 24.4 4 Monroe 0.2 99 Lawrence 9.4 16 Wabash 0.6 67Crawford 4.7 37 Montgomery 3.2 48 Stephenson 8.9 17 Menard 0.6 68Cumberland 0.3 84 Morgan 5.9 30 Rock Island 8.8 18 Ford 0.6 69DeKalb 6.3 27 Moultrie 0.3 90 Perry 8.3 19 Bureau 0.5 70DeWitt 0.5 72 Ogle 0.9 60 Jefferson 8.2 20 Putnam 0.5 71
Douglas 0.3 92 Peoria 17.5 6 Johnson 8.0 21 DeWitt 0.5 72DuPage 4.5 38 Perry 8.3 19 Madison 7.8 22 Woodford 0.5 73Edgar 0.3 82 Piatt 0.3 83 Logan 7.4 23 Richland 0.5 74Edwards 0.4 76 Pike 1.7 52 McLean 7.2 24 Stark 0.5 75Effingham 0.2 95 Pope 6.0 28 Knox 7.1 25 Edwards 0.4 76Fayette 4.4 39 Pulaski 32.1 2 Lake 6.7 26 Jo Daviess 0.4 77Ford 0.6 69 Putnam 0.5 71 DeKalb 6.3 27 Jersey 0.4 78Franklin 0.3 87 Randolph 9.7 15 Pope 6.0 28 Hamilton 0.4 79Fulton 3.4 45 Richland 0.5 74 Bond 6.0 29 Mason 0.4 80Gallatin 0.2 96 Rock Island 8.8 18 Morgan 5.9 30 Marshall 0.3 81
Greene 0.9 61 St. Clair 30.3 3 Massac 5.8 31 Edgar 0.3 82Grundy 1.2 57 Saline 3.9 40 Kendall 5.5 32 Piatt 0.3 83Hamilton 0.4 79 Sangamon 11.7 13 Kane 5.4 33 Cumberland 0.3 84Hancock 0.3 91 Schuyler 3.2 47 McDonough 4.9 34 Clay 0.3 85Hardin 0.3 86 Scott 0.1 102 Livingston 4.8 35 Hardin 0.3 86Henderson 0.2 98 Shelby 0.2 97 Lee 4.7 36 Franklin 0.3 87Henry 1.5 54 Stark 0.5 75 Crawford 4.7 37 Clark 0.3 88Iroquois 0.8 64 Stephenson 8.9 17 DuPage 4.5 38 Mercer 0.3 89Jackson 14.1 9 Tazewell 1.0 58 Fayette 4.4 39 Moultrie 0.3 90Jasper 0.1 101 Union 0.8 62 Saline 3.9 40 Hancock 0.3 91
Jefferson 8.2 20 Vermilion 12.7 10 Marion 3.9 41 Douglas 0.3 92Jersey 0.4 78 Wabash 0.6 67 Williamson 3.8 42 White 0.3 93Jo Daviess 0.4 77 Warren 1.6 53 Coles 3.8 43 Wayne 0.2 94Johnson 8.0 21 Washington 0.6 66 Clinton 3.5 44 Effingham 0.2 95Kane 5.4 33 Wayne 0.2 94 Fulton 3.4 45 Gallatin 0.2 96Kankakee 15.0 8 White 0.3 93 Adams 3.4 46 Shelby 0.2 97Kendall 5.5 32 Whiteside 1.2 56 Schuyler 3.2 47 Henderson 0.2 98Knox 7.1 25 Will 11.0 14 Montgomery 3.2 48 Monroe 0.2 99Lake 6.7 26 Williamson 3.8 42 Cass 2.8 49 Calhoun 0.1 100LaSalle 1.8 50 Winnebago 12.0 12 LaSalle 1.8 50 Jasper 0.1 101Lawrence 9.4 16 Woodford 0.5 73 Boone 1.8 51 Scott 0.1 102
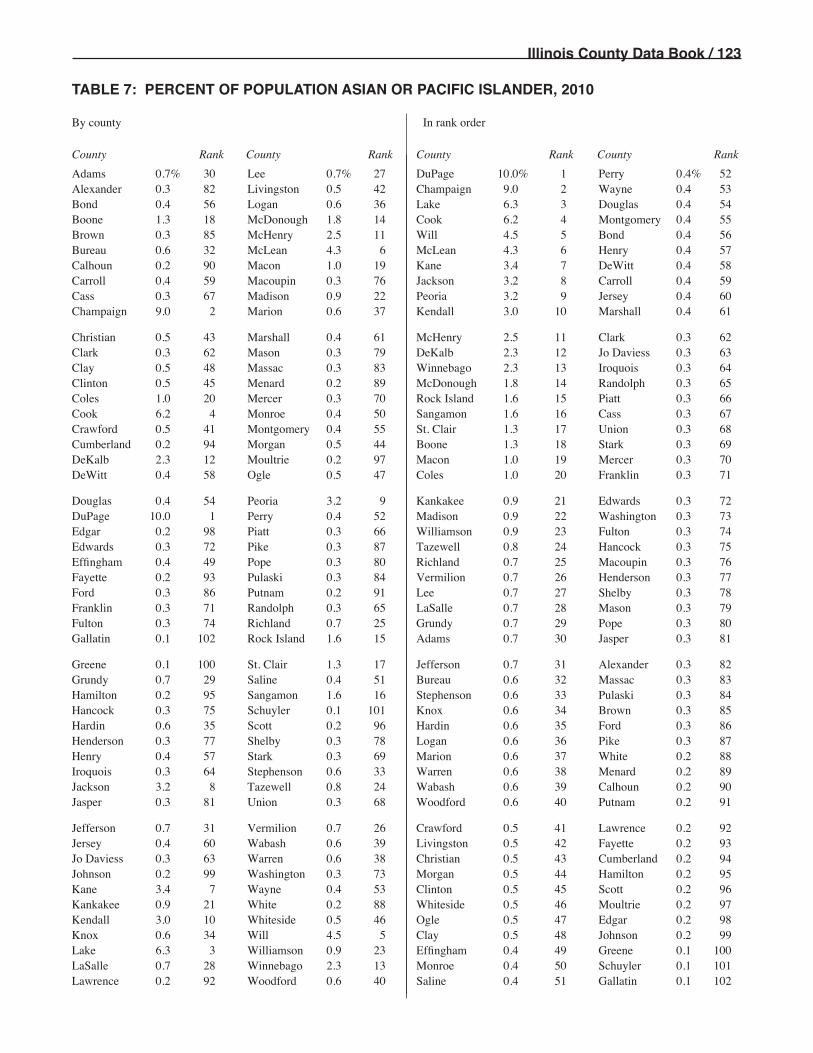
Illinois County Data Book / 123
TABLE 7: PERCENT OF POPULATION ASIAN OR PACIFIC ISLANDER, 2010
By county In rank order
County Rank County Rank County Rank County Rank
Adams 0.7% 30 Lee 0.7% 27 DuPage 10.0% 1 Perry 0.4% 52Alexander 0.3 82 Livingston 0.5 42 Champaign 9.0 2 Wayne 0.4 53Bond 0.4 56 Logan 0.6 36 Lake 6.3 3 Douglas 0.4 54Boone 1.3 18 McDonough 1.8 14 Cook 6.2 4 Montgomery 0.4 55Brown 0.3 85 McHenry 2.5 11 Will 4.5 5 Bond 0.4 56Bureau 0.6 32 McLean 4.3 6 McLean 4.3 6 Henry 0.4 57Calhoun 0.2 90 Macon 1.0 19 Kane 3.4 7 DeWitt 0.4 58Carroll 0.4 59 Macoupin 0.3 76 Jackson 3.2 8 Carroll 0.4 59Cass 0.3 67 Madison 0.9 22 Peoria 3.2 9 Jersey 0.4 60Champaign 9.0 2 Marion 0.6 37 Kendall 3.0 10 Marshall 0.4 61
Christian 0.5 43 Marshall 0.4 61 McHenry 2.5 11 Clark 0.3 62Clark 0.3 62 Mason 0.3 79 DeKalb 2.3 12 Jo Daviess 0.3 63Clay 0.5 48 Massac 0.3 83 Winnebago 2.3 13 Iroquois 0.3 64Clinton 0.5 45 Menard 0.2 89 McDonough 1.8 14 Randolph 0.3 65Coles 1.0 20 Mercer 0.3 70 Rock Island 1.6 15 Piatt 0.3 66Cook 6.2 4 Monroe 0.4 50 Sangamon 1.6 16 Cass 0.3 67Crawford 0.5 41 Montgomery 0.4 55 St. Clair 1.3 17 Union 0.3 68Cumberland 0.2 94 Morgan 0.5 44 Boone 1.3 18 Stark 0.3 69DeKalb 2.3 12 Moultrie 0.2 97 Macon 1.0 19 Mercer 0.3 70DeWitt 0.4 58 Ogle 0.5 47 Coles 1.0 20 Franklin 0.3 71
Douglas 0.4 54 Peoria 3.2 9 Kankakee 0.9 21 Edwards 0.3 72DuPage 10.0 1 Perry 0.4 52 Madison 0.9 22 Washington 0.3 73Edgar 0.2 98 Piatt 0.3 66 Williamson 0.9 23 Fulton 0.3 74Edwards 0.3 72 Pike 0.3 87 Tazewell 0.8 24 Hancock 0.3 75Effingham 0.4 49 Pope 0.3 80 Richland 0.7 25 Macoupin 0.3 76Fayette 0.2 93 Pulaski 0.3 84 Vermilion 0.7 26 Henderson 0.3 77Ford 0.3 86 Putnam 0.2 91 Lee 0.7 27 Shelby 0.3 78Franklin 0.3 71 Randolph 0.3 65 LaSalle 0.7 28 Mason 0.3 79Fulton 0.3 74 Richland 0.7 25 Grundy 0.7 29 Pope 0.3 80Gallatin 0.1 102 Rock Island 1.6 15 Adams 0.7 30 Jasper 0.3 81
Greene 0.1 100 St. Clair 1.3 17 Jefferson 0.7 31 Alexander 0.3 82Grundy 0.7 29 Saline 0.4 51 Bureau 0.6 32 Massac 0.3 83Hamilton 0.2 95 Sangamon 1.6 16 Stephenson 0.6 33 Pulaski 0.3 84Hancock 0.3 75 Schuyler 0.1 101 Knox 0.6 34 Brown 0.3 85Hardin 0.6 35 Scott 0.2 96 Hardin 0.6 35 Ford 0.3 86Henderson 0.3 77 Shelby 0.3 78 Logan 0.6 36 Pike 0.3 87Henry 0.4 57 Stark 0.3 69 Marion 0.6 37 White 0.2 88Iroquois 0.3 64 Stephenson 0.6 33 Warren 0.6 38 Menard 0.2 89Jackson 3.2 8 Tazewell 0.8 24 Wabash 0.6 39 Calhoun 0.2 90Jasper 0.3 81 Union 0.3 68 Woodford 0.6 40 Putnam 0.2 91
Jefferson 0.7 31 Vermilion 0.7 26 Crawford 0.5 41 Lawrence 0.2 92Jersey 0.4 60 Wabash 0.6 39 Livingston 0.5 42 Fayette 0.2 93Jo Daviess 0.3 63 Warren 0.6 38 Christian 0.5 43 Cumberland 0.2 94Johnson 0.2 99 Washington 0.3 73 Morgan 0.5 44 Hamilton 0.2 95Kane 3.4 7 Wayne 0.4 53 Clinton 0.5 45 Scott 0.2 96Kankakee 0.9 21 White 0.2 88 Whiteside 0.5 46 Moultrie 0.2 97Kendall 3.0 10 Whiteside 0.5 46 Ogle 0.5 47 Edgar 0.2 98Knox 0.6 34 Will 4.5 5 Clay 0.5 48 Johnson 0.2 99Lake 6.3 3 Williamson 0.9 23 Effingham 0.4 49 Greene 0.1 100LaSalle 0.7 28 Winnebago 2.3 13 Monroe 0.4 50 Schuyler 0.1 101Lawrence 0.2 92 Woodford 0.6 40 Saline 0.4 51 Gallatin 0.1 102

124 / Illinois County Data Book
TABLE 8: PERCENT OF POPULATION AMERICAN INDIAN OR ALASKAN NATIVE RACES, 2010
By county In rank order
County Rank County Rank County Rank County Rank
Adams 0.1% 67 Lee 0.1% 77 Pope 0.6% 1 Scott 0.2% 52Alexander 0.3 9 Livingston 0.1 82 Hardin 0.6 2 Piatt 0.2 53Bond 0.4 3 Logan 0.2 40 Bond 0.4 3 Kankakee 0.2 54Boone 0.1 86 McDonough 0.2 55 Pulaski 0.4 4 McDonough 0.2 55Brown 0.1 72 McHenry 0.1 68 Massac 0.4 5 Schuyler 0.2 56Bureau 0.2 36 McLean 0.2 48 Saline 0.3 6 Douglas 0.2 57Calhoun 0.2 43 Macon 0.2 37 Union 0.3 7 Wayne 0.2 58Carroll 0.2 16 Macoupin 0.2 15 Williamson 0.3 8 Richland 0.2 59Cass 0.1 97 Madison 0.2 26 Alexander 0.3 9 Cumberland 0.2 60Champaign 0.2 38 Marion 0.3 12 Jackson 0.3 10 Whiteside 0.2 61
Christian 0.1 94 Marshall 0.1 81 White 0.3 11 Johnson 0.2 62Clark 0.1 69 Mason 0.2 25 Marion 0.3 12 Lake 0.2 63Clay 0.2 21 Massac 0.4 5 Gallatin 0.3 13 Stark 0.2 64Clinton 0.2 24 Menard 0.2 22 Franklin 0.2 14 Montgomery 0.1 65Coles 0.1 70 Mercer 0.1 99 Macoupin 0.2 15 Fayette 0.1 66Cook 0.1 83 Monroe 0.2 47 Carroll 0.2 16 Adams 0.1 67Crawford 0.2 23 Montgomery 0.1 65 Ford 0.2 17 McHenry 0.1 68Cumberland 0.2 60 Morgan 0.2 34 Tazewell 0.2 18 Clark 0.1 69DeKalb 0.1 89 Moultrie 0.2 33 Jersey 0.2 19 Coles 0.1 70DeWitt 0.1 79 Ogle 0.2 49 Fulton 0.2 20 Pike 0.1 71
Douglas 0.2 57 Peoria 0.2 28 Clay 0.2 21 Brown 0.1 72DuPage 0.1 98 Perry 0.2 30 Menard 0.2 22 Greene 0.1 73Edgar 0.1 87 Piatt 0.2 53 Crawford 0.2 23 Stephenson 0.1 74Edwards 0.1 91 Pike 0.1 71 Clinton 0.2 24 Wabash 0.1 75Effingham 0.1 102 Pope 0.6 1 Mason 0.2 25 Knox 0.1 76Fayette 0.1 66 Pulaski 0.4 4 Madison 0.2 26 Lee 0.1 77Ford 0.2 17 Putnam 0.1 101 Henderson 0.2 27 Iroquois 0.1 78Franklin 0.2 14 Randolph 0.1 84 Peoria 0.2 28 DeWitt 0.1 79Fulton 0.2 20 Richland 0.2 59 St. Clair 0.2 29 Grundy 0.1 80Gallatin 0.3 13 Rock Island 0.2 31 Perry 0.2 30 Marshall 0.1 81
Greene 0.1 73 St. Clair 0.2 29 Rock Island 0.2 31 Livingston 0.1 82Grundy 0.1 80 Saline 0.3 6 Winnebago 0.2 32 Cook 0.1 83Hamilton 0.1 93 Sangamon 0.2 46 Moultrie 0.2 33 Randolph 0.1 84Hancock 0.2 41 Schuyler 0.2 56 Morgan 0.2 34 Jo Daviess 0.1 85Hardin 0.6 2 Scott 0.2 52 Warren 0.2 35 Boone 0.1 86Henderson 0.2 27 Shelby 0.2 45 Bureau 0.2 36 Edgar 0.1 87Henry 0.1 92 Stark 0.2 64 Macon 0.2 37 Jasper 0.1 88Iroquois 0.1 78 Stephenson 0.1 74 Champaign 0.2 38 DeKalb 0.1 89Jackson 0.3 10 Tazewell 0.2 18 Lawrence 0.2 39 Will 0.1 90Jasper 0.1 88 Union 0.3 7 Logan 0.2 40 Edwards 0.1 91
Jefferson 0.2 42 Vermilion 0.2 50 Hancock 0.2 41 Henry 0.1 92Jersey 0.2 19 Wabash 0.1 75 Jefferson 0.2 42 Hamilton 0.1 93Jo Daviess 0.1 85 Warren 0.2 35 Calhoun 0.2 43 Christian 0.1 94Johnson 0.2 62 Washington 0.1 100 LaSalle 0.2 44 Kane 0.1 95Kane 0.1 95 Wayne 0.2 58 Shelby 0.2 45 Kendall 0.1 96Kankakee 0.2 54 White 0.3 11 Sangamon 0.2 46 Cass 0.1 97Kendall 0.1 96 Whiteside 0.2 61 Monroe 0.2 47 DuPage 0.1 98Knox 0.1 76 Will 0.1 90 McLean 0.2 48 Mercer 0.1 99Lake 0.2 63 Williamson 0.3 8 Ogle 0.2 49 Washington 0.1 100LaSalle 0.2 44 Winnebago 0.2 32 Vermilion 0.2 50 Putnam 0.1 101Lawrence 0.2 39 Woodford 0.2 51 Woodford 0.2 51 Effingham 0.1 102

Illinois County Data Book / 125
TABLE 9: PERCENT OF POPULATION OF HISPANIC ORIGIN, ANY RACE, 2010
By county In rank order
County Rank County Rank County Rank County Rank
Adams 1.2% 80 Lee 5.0% 24 Kane 30.7% 1 Jefferson 2.1% 52Alexander 1.9 55 Livingston 3.9 32 Cook 24.0 2 Morgan 2.0 53Bond 3.1 36 Logan 2.9 39 Boone 20.2 3 Williamson 2.0 54Boone 20.2 3 McDonough 2.7 45 Lake 19.9 4 Alexander 1.9 55Brown 5.8 21 McHenry 11.4 10 Cass 16.8 5 Massac 1.9 56Bureau 7.7 19 McLean 4.4 28 Will 15.6 6 Macon 1.9 57Calhoun 0.8 101 Macon 1.9 57 Kendall 15.6 7 Mercer 1.9 58Carroll 2.8 40 Macoupin 0.9 94 DuPage 13.3 8 Tazewell 1.9 59Cass 16.8 5 Madison 2.7 42 Rock Island 11.6 9 Crawford 1.8 60Champaign 5.3 23 Marion 1.4 66 McHenry 11.4 10 Sangamon 1.8 61
Christian 1.4 71 Marshall 2.5 47 Whiteside 11.0 11 Effingham 1.7 62Clark 1.1 84 Mason 0.8 100 Winnebago 10.9 12 Pulaski 1.6 63Clay 1.1 81 Massac 1.9 56 DeKalb 10.1 13 Montgomery 1.5 64Clinton 2.8 41 Menard 1.0 92 Kankakee 9.0 14 Pope 1.4 65Coles 2.1 49 Mercer 1.9 58 Ogle 8.9 15 Marion 1.4 66Cook 24.0 2 Monroe 1.4 68 Warren 8.4 16 Fayette 1.4 67Crawford 1.8 60 Montgomery 1.5 64 Grundy 8.2 17 Monroe 1.4 68Cumberland 0.7 102 Morgan 2.0 53 LaSalle 8.0 18 Saline 1.4 69DeKalb 10.1 13 Moultrie 0.9 95 Bureau 7.7 19 Woodford 1.4 70DeWitt 2.1 50 Ogle 8.9 15 Douglas 6.1 20 Christian 1.4 71
Douglas 6.1 20 Peoria 3.8 33 Brown 5.8 21 Washington 1.3 72DuPage 13.3 8 Perry 2.7 44 Iroquois 5.3 22 Wabash 1.3 73Edgar 1.0 87 Piatt 1.0 88 Champaign 5.3 23 Hardin 1.3 74Edwards 0.9 93 Pike 1.0 86 Lee 5.0 24 Richland 1.3 75Effingham 1.7 62 Pope 1.4 65 Union 4.8 25 Hamilton 1.2 76Fayette 1.4 67 Pulaski 1.6 63 Knox 4.8 26 Franklin 1.2 77Ford 2.1 51 Putnam 4.2 30 Henry 4.8 27 Schuyler 1.2 78Franklin 1.2 77 Randolph 2.6 46 McLean 4.4 28 Gallatin 1.2 79Fulton 2.4 48 Richland 1.3 75 Vermilion 4.2 29 Adams 1.2 80Gallatin 1.2 79 Rock Island 11.6 9 Putnam 4.2 30 Clay 1.1 81
Greene 0.8 96 St. Clair 3.3 35 Jackson 4.0 31 Henderson 1.1 82Grundy 8.2 17 Saline 1.4 69 Livingston 3.9 32 White 1.1 83Hamilton 1.2 76 Sangamon 1.8 61 Peoria 3.8 33 Clark 1.1 84Hancock 1.0 90 Schuyler 1.2 78 Lawrence 3.3 34 Wayne 1.1 85Hardin 1.3 74 Scott 0.8 99 St. Clair 3.3 35 Pike 1.0 86Henderson 1.1 82 Shelby 0.8 98 Bond 3.1 36 Edgar 1.0 87Henry 4.8 27 Stark 1.0 89 Johnson 3.0 37 Piatt 1.0 88Iroquois 5.3 22 Stephenson 2.9 38 Stephenson 2.9 38 Stark 1.0 89Jackson 4.0 31 Tazewell 1.9 59 Logan 2.9 39 Hancock 1.0 90Jasper 0.8 97 Union 4.8 25 Carroll 2.8 40 Jersey 1.0 91
Jefferson 2.1 52 Vermilion 4.2 29 Clinton 2.8 41 Menard 1.0 92Jersey 1.0 91 Wabash 1.3 73 Madison 2.7 42 Edwards 0.9 93Jo Daviess 2.7 43 Warren 8.4 16 Jo Daviess 2.7 43 Macoupin 0.9 94Johnson 3.0 37 Washington 1.3 72 Perry 2.7 44 Moultrie 0.9 95Kane 30.7 1 Wayne 1.1 85 McDonough 2.7 45 Greene 0.8 96Kankakee 9.0 14 White 1.1 83 Randolph 2.6 46 Jasper 0.8 97Kendall 15.6 7 Whiteside 11.0 11 Marshall 2.5 47 Shelby 0.8 98Knox 4.8 26 Will 15.6 6 Fulton 2.4 48 Scott 0.8 99Lake 19.9 4 Williamson 2.0 54 Coles 2.1 49 Mason 0.8 100LaSalle 8.0 18 Winnebago 10.9 12 DeWitt 2.1 50 Calhoun 0.8 101Lawrence 3.3 34 Woodford 1.4 70 Ford 2.1 51 Cumberland 0.7 102

126 / Illinois County Data Book
TABLE 10: PERCENT OF POPULATION UNDER 18, 2010
By county In rank order
County Rank County Rank County Rank County Rank
Adams 23.0% 36 Lee 21.5% 77 Kendall 31.4% 1 Stephenson 22.7% 52Alexander 22.9 41 Livingston 22.5 61 Will 29.1 2 McLean 22.7 53Bond 20.5 89 Logan 20.0 93 Boone 29.0 3 Franklin 22.7 54Boone 29.0 3 McDonough 16.1 101 Kane 29.0 4 Mercer 22.6 55Brown 16.1 102 McHenry 27.3 7 Lake 27.4 5 Pike 22.6 56Bureau 23.3 34 McLean 22.7 53 Grundy 27.3 6 Shelby 22.6 57Calhoun 21.9 74 Macon 22.8 44 McHenry 27.3 7 Macoupin 22.6 58Carroll 20.5 88 Macoupin 22.6 58 Douglas 25.9 8 Wayne 22.6 59Cass 24.9 12 Madison 22.7 49 Woodford 25.8 9 Rock Island 22.5 60Champaign 19.4 95 Marion 23.4 33 St. Clair 25.4 10 Livingston 22.5 61
Christian 22.3 63 Marshall 21.7 75 Kankakee 25.3 11 Fayette 22.5 62Clark 22.8 48 Mason 22.0 72 Cass 24.9 12 Christian 22.3 63Clay 22.9 39 Massac 22.8 46 Moultrie 24.9 13 DeKalb 22.3 64Clinton 22.7 50 Menard 23.6 27 Winnebago 24.9 14 Richland 22.2 65Coles 18.5 98 Mercer 22.6 55 DuPage 24.8 15 Edgar 22.2 66Cook 23.7 25 Monroe 24.5 18 Ogle 24.8 16 Wabash 22.2 67Crawford 20.5 90 Montgomery 21.2 80 Effingham 24.7 17 Williamson 22.1 68Cumberland 23.5 30 Morgan 21.3 78 Monroe 24.5 18 Jefferson 22.1 69DeKalb 22.3 64 Moultrie 24.9 13 Vermilion 24.4 19 Washington 22.1 70DeWitt 23.1 35 Ogle 24.8 16 Peoria 24.1 20 Warren 22.1 71
Douglas 25.9 8 Peoria 24.1 20 Henry 24.0 21 Mason 22.0 72DuPage 24.8 15 Perry 20.7 86 Piatt 24.0 22 Hancock 22.0 73Edgar 22.2 66 Piatt 24.0 22 Ford 23.8 23 Calhoun 21.9 74Edwards 22.9 42 Pike 22.6 56 Scott 23.8 24 Marshall 21.7 75Effingham 24.7 17 Pope 18.2 99 Cook 23.7 25 Union 21.5 76Fayette 22.5 62 Pulaski 22.8 45 Sangamon 23.7 26 Lee 21.5 77Ford 23.8 23 Putnam 21.3 79 Menard 23.6 27 Morgan 21.3 78Franklin 22.7 54 Randolph 19.8 94 Iroquois 23.6 28 Putnam 21.3 79Fulton 20.9 83 Richland 22.2 65 Stark 23.5 29 Montgomery 21.2 80Gallatin 21.2 81 Rock Island 22.5 60 Cumberland 23.5 30 Gallatin 21.2 81
Greene 23.0 37 St. Clair 25.4 10 Tazewell 23.5 31 Schuyler 20.9 82Grundy 27.3 6 Saline 22.9 40 Whiteside 23.5 32 Fulton 20.9 83Hamilton 22.8 43 Sangamon 23.7 26 Marion 23.4 33 White 20.9 84Hancock 22.0 73 Schuyler 20.9 82 Bureau 23.3 34 Jo Daviess 20.8 85Hardin 20.3 92 Scott 23.8 24 DeWitt 23.1 35 Perry 20.7 86Henderson 20.4 91 Shelby 22.6 57 Adams 23.0 36 Knox 20.6 87Henry 24.0 21 Stark 23.5 29 Greene 23.0 37 Carroll 20.5 88Iroquois 23.6 28 Stephenson 22.7 52 LaSalle 23.0 38 Bond 20.5 89Jackson 17.8 100 Tazewell 23.5 31 Clay 22.9 39 Crawford 20.5 90Jasper 22.7 51 Union 21.5 76 Saline 22.9 40 Henderson 20.4 91
Jefferson 22.1 69 Vermilion 24.4 19 Alexander 22.9 41 Hardin 20.3 92Jersey 22.8 47 Wabash 22.2 67 Edwards 22.9 42 Logan 20.0 93Jo Daviess 20.8 85 Warren 22.1 71 Hamilton 22.8 43 Randolph 19.8 94Johnson 19.4 96 Washington 22.1 70 Macon 22.8 44 Champaign 19.4 95Kane 29.0 4 Wayne 22.6 59 Pulaski 22.8 45 Johnson 19.4 96Kankakee 25.3 11 White 20.9 84 Massac 22.8 46 Lawrence 19.1 97Kendall 31.4 1 Whiteside 23.5 32 Jersey 22.8 47 Coles 18.5 98Knox 20.6 87 Will 29.1 2 Clark 22.8 48 Pope 18.2 99Lake 27.4 5 Williamson 22.1 68 Madison 22.7 49 Jackson 17.8 100LaSalle 23.0 38 Winnebago 24.9 14 Clinton 22.7 50 McDonough 16.1 101Lawrence 19.1 97 Woodford 25.8 9 Jasper 22.7 51 Brown 16.1 102

Illinois County Data Book / 127
TABLE 11: PERCENT OF POPULATION AGE 18 TO 64, 2010
By county In rank order
County Rank County Rank County Rank County Rank
Adams 59.5% 63 Lee 62.9% 17 Brown 71.6% 1 DeWitt 60.2% 52Alexander 60.2 55 Livingston 61.7 26 Champaign 70.6 2 Pope 60.2 53Bond 64.4 9 Logan 64.3 11 Jackson 70.5 3 Effingham 60.2 54Boone 59.3 68 McDonough 69.7 4 McDonough 69.7 4 Alexander 60.2 55Brown 71.6 1 McHenry 62.6 20 DeKalb 67.8 5 Christian 60.1 56Bureau 58.6 85 McLean 67.1 7 Coles 67.8 6 Ogle 60.1 57Calhoun 58.0 95 Macon 60.8 47 McLean 67.1 7 Wabash 60.0 58Carroll 58.3 91 Macoupin 60.3 51 Lawrence 65.0 8 Jasper 59.9 59Cass 59.4 66 Madison 63.0 16 Bond 64.4 9 Cumberland 59.8 60Champaign 70.6 2 Marion 59.0 74 Cook 64.3 10 Piatt 59.8 61
Christian 60.1 56 Marshall 58.8 81 Logan 64.3 11 Greene 59.8 62Clark 59.2 71 Mason 58.9 79 Randolph 64.2 12 Adams 59.5 63Clay 59.2 70 Massac 58.8 80 DuPage 63.6 13 Edwards 59.4 64Clinton 62.8 18 Menard 60.8 46 Perry 63.5 14 Hardin 59.4 65Coles 67.8 6 Mercer 59.1 73 Johnson 63.4 15 Cass 59.4 66Cook 64.3 10 Monroe 61.4 34 Madison 63.0 16 Woodford 59.4 67Crawford 62.7 19 Montgomery 61.5 32 Lee 62.9 17 Boone 59.3 68Cumberland 59.8 60 Morgan 62.0 25 Clinton 62.8 18 Vermilion 59.3 69DeKalb 67.8 5 Moultrie 57.4 100 Crawford 62.7 19 Clay 59.2 70DeWitt 60.2 52 Ogle 60.1 57 McHenry 62.6 20 Clark 59.2 71
Douglas 58.3 90 Peoria 62.0 24 Sangamon 62.4 21 Edgar 59.1 72DuPage 63.6 13 Perry 63.5 14 Lake 62.2 22 Mercer 59.1 73Edgar 59.1 72 Piatt 59.8 61 St. Clair 62.1 23 Marion 59.0 74Edwards 59.4 64 Pike 58.3 89 Peoria 62.0 24 Whiteside 59.0 75Effingham 60.2 54 Pope 60.2 53 Morgan 62.0 25 Henry 59.0 76Fayette 61.4 35 Pulaski 59.0 78 Livingston 61.7 26 Franklin 59.0 77Ford 57.5 98 Putnam 60.9 42 Jefferson 61.7 27 Pulaski 59.0 78Franklin 59.0 77 Randolph 64.2 12 Will 61.7 28 Mason 58.9 79Fulton 61.0 40 Richland 58.6 84 Grundy 61.6 29 Massac 58.8 80Gallatin 58.3 88 Rock Island 61.3 36 Williamson 61.5 30 Marshall 58.8 81
Greene 59.8 62 St. Clair 62.1 23 Jersey 61.5 31 Henderson 58.7 82Grundy 61.6 29 Saline 58.7 83 Montgomery 61.5 32 Saline 58.7 83Hamilton 57.4 101 Sangamon 62.4 21 Kane 61.4 33 Richland 58.6 84Hancock 58.2 92 Schuyler 60.5 49 Monroe 61.4 34 Bureau 58.6 85Hardin 59.4 65 Scott 58.2 93 Fayette 61.4 35 Stephenson 58.6 86Henderson 58.7 82 Shelby 58.5 87 Rock Island 61.3 36 Shelby 58.5 87Henry 59.0 76 Stark 56.5 102 Winnebago 61.3 37 Gallatin 58.3 88Iroquois 57.5 99 Stephenson 58.6 86 Kendall 61.3 38 Pike 58.3 89Jackson 70.5 3 Tazewell 60.9 43 Kankakee 61.2 39 Douglas 58.3 90Jasper 59.9 59 Union 60.3 50 Fulton 61.0 40 Carroll 58.3 91
Jefferson 61.7 27 Vermilion 59.3 69 Knox 61.0 41 Hancock 58.2 92Jersey 61.5 31 Wabash 60.0 58 Putnam 60.9 42 Scott 58.2 93Jo Daviess 57.9 97 Warren 60.8 45 Tazewell 60.9 43 White 58.1 94Johnson 63.4 15 Washington 60.9 44 Washington 60.9 44 Calhoun 58.0 95Kane 61.4 33 Wayne 58.0 96 Warren 60.8 45 Wayne 58.0 96Kankakee 61.2 39 White 58.1 94 Menard 60.8 46 Jo Daviess 57.9 97Kendall 61.3 38 Whiteside 59.0 75 Macon 60.8 47 Ford 57.5 98Knox 61.0 41 Will 61.7 28 LaSalle 60.6 48 Iroquois 57.5 99Lake 62.2 22 Williamson 61.5 30 Schuyler 60.5 49 Moultrie 57.4 100LaSalle 60.6 48 Winnebago 61.3 37 Union 60.3 50 Hamilton 57.4 101Lawrence 65.0 8 Woodford 59.4 67 Macoupin 60.3 51 Stark 56.5 102

128 / Illinois County Data Book
TABLE 12: PERCENT OF POPULATION AGE 65 AND OVER, 2010
By county In rank order
County Rank County Rank County Rank County Rank
Adams 17.5% 42 Lee 15.7% 72 Pope 21.6% 1 Crawford 16.8% 52Alexander 17.0 51 Livingston 15.8 67 Jo Daviess 21.3 2 DeWitt 16.7 53Bond 15.0 77 Logan 15.7 69 Carroll 21.2 3 Morgan 16.7 54Boone 11.7 91 McDonough 14.2 81 White 21.0 4 Cumberland 16.6 55Brown 12.4 89 McHenry 10.1 97 Henderson 20.9 5 LaSalle 16.4 56Bureau 18.1 30 McLean 10.2 96 Gallatin 20.5 6 Macon 16.4 57Calhoun 20.1 8 Macon 16.4 57 Hardin 20.3 7 Williamson 16.3 58Carroll 21.2 3 Macoupin 17.1 47 Calhoun 20.1 8 Vermilion 16.3 59Cass 15.7 70 Madison 14.3 80 Stark 19.9 9 Piatt 16.2 60Champaign 10.0 98 Marion 17.6 39 Hancock 19.8 10 Jefferson 16.2 61
Christian 17.5 40 Marshall 19.5 12 Hamilton 19.8 11 Rock Island 16.2 62Clark 18.0 33 Mason 19.1 15 Marshall 19.5 12 Fayette 16.2 63Clay 17.9 34 Massac 18.4 26 Wayne 19.4 13 Randolph 16.0 64Clinton 14.5 79 Menard 15.6 74 Richland 19.2 14 Lawrence 15.9 65Coles 13.8 85 Mercer 18.3 27 Mason 19.1 15 Douglas 15.8 66Cook 11.9 90 Monroe 14.1 82 Pike 19.1 16 Livingston 15.8 67Crawford 16.8 52 Montgomery 17.3 44 Iroquois 18.9 17 Perry 15.7 68Cumberland 16.6 55 Morgan 16.7 54 Shelby 18.9 18 Logan 15.7 69DeKalb 9.8 99 Moultrie 17.6 38 Stephenson 18.8 19 Cass 15.7 70DeWitt 16.7 53 Ogle 15.2 75 Ford 18.7 20 Jersey 15.7 71
Douglas 15.8 66 Peoria 13.9 83 Edgar 18.7 21 Lee 15.7 72DuPage 11.6 93 Perry 15.7 68 Schuyler 18.5 22 Tazewell 15.6 73Edgar 18.7 21 Piatt 16.2 60 Knox 18.4 23 Menard 15.6 74Edwards 17.7 37 Pike 19.1 16 Saline 18.4 24 Ogle 15.2 75Effingham 15.2 76 Pope 21.6 1 Franklin 18.4 25 Effingham 15.2 76Fayette 16.2 63 Pulaski 18.2 28 Massac 18.4 26 Bond 15.0 77Ford 18.7 20 Putnam 17.8 36 Mercer 18.3 27 Woodford 14.8 78Franklin 18.4 25 Randolph 16.0 64 Pulaski 18.2 28 Clinton 14.5 79Fulton 18.1 31 Richland 19.2 14 Union 18.2 29 Madison 14.3 80Gallatin 20.5 6 Rock Island 16.2 62 Bureau 18.1 30 McDonough 14.2 81
Greene 17.2 46 St. Clair 12.5 88 Fulton 18.1 31 Monroe 14.1 82Grundy 11.1 94 Saline 18.4 24 Scott 18.0 32 Peoria 13.9 83Hamilton 19.8 11 Sangamon 13.9 84 Clark 18.0 33 Sangamon 13.9 84Hancock 19.8 10 Schuyler 18.5 22 Clay 17.9 34 Coles 13.8 85Hardin 20.3 7 Scott 18.0 32 Wabash 17.8 35 Winnebago 13.8 86Henderson 20.9 5 Shelby 18.9 18 Putnam 17.8 36 Kankakee 13.4 87Henry 17.1 48 Stark 19.9 9 Edwards 17.7 37 St. Clair 12.5 88Iroquois 18.9 17 Stephenson 18.8 19 Moultrie 17.6 38 Brown 12.4 89Jackson 11.6 92 Tazewell 15.6 73 Marion 17.6 39 Cook 11.9 90Jasper 17.4 43 Union 18.2 29 Christian 17.5 40 Boone 11.7 91
Jefferson 16.2 61 Vermilion 16.3 59 Whiteside 17.5 41 Jackson 11.6 92Jersey 15.7 71 Wabash 17.8 35 Adams 17.5 42 DuPage 11.6 93Jo Daviess 21.3 2 Warren 17.0 49 Jasper 17.4 43 Grundy 11.1 94Johnson 17.2 45 Washington 17.0 50 Montgomery 17.3 44 Lake 10.4 95Kane 9.6 100 Wayne 19.4 13 Johnson 17.2 45 McLean 10.2 96Kankakee 13.4 87 White 21.0 4 Greene 17.2 46 McHenry 10.1 97Kendall 7.3 102 Whiteside 17.5 41 Macoupin 17.1 47 Champaign 10.0 98Knox 18.4 23 Will 9.3 101 Henry 17.1 48 DeKalb 9.8 99Lake 10.4 95 Williamson 16.3 58 Warren 17.0 49 Kane 9.6 100LaSalle 16.4 56 Winnebago 13.8 86 Washington 17.0 50 Will 9.3 101Lawrence 15.9 65 Woodford 14.8 78 Alexander 17.0 51 Kendall 7.3 102
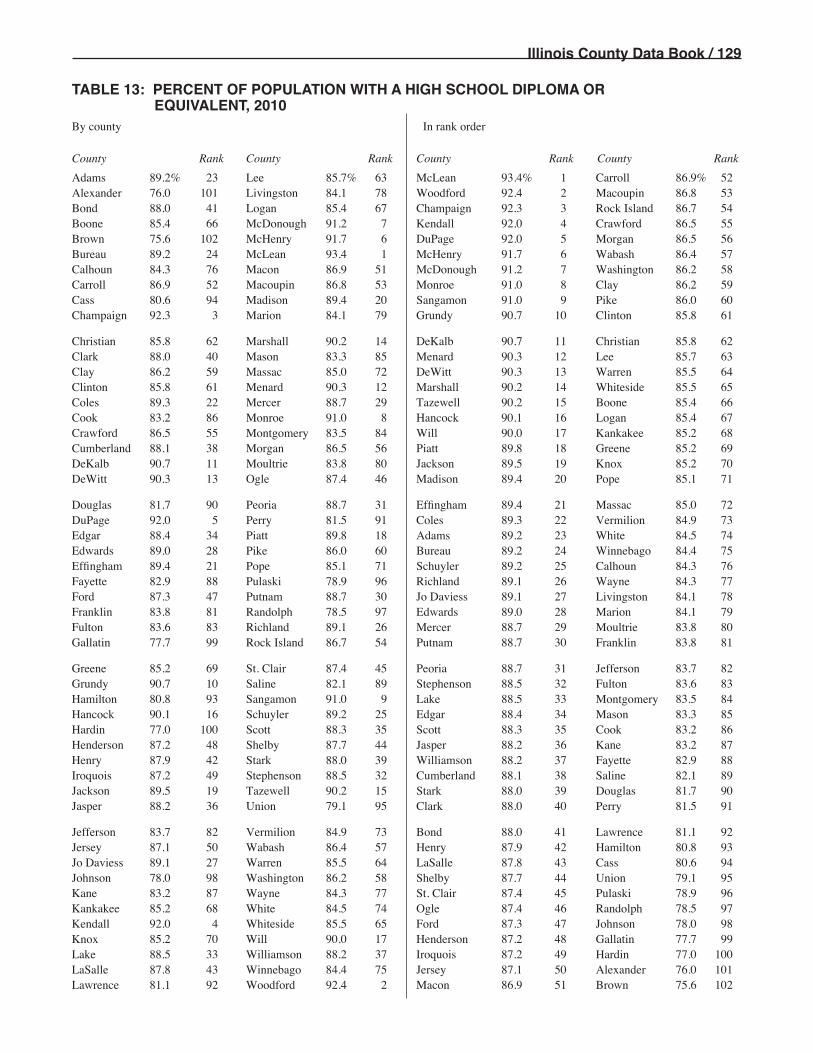
Illinois County Data Book / 129
TABLE 13: PERCENT OF POPULATION WITH A HIGH SCHOOL DIPLOMA OR EQUIVALENT, 2010
By county In rank order
County Rank County Rank County Rank County Rank
Adams 89.2% 23 Lee 85.7% 63 McLean 93.4% 1 Carroll 86.9% 52Alexander 76.0 101 Livingston 84.1 78 Woodford 92.4 2 Macoupin 86.8 53Bond 88.0 41 Logan 85.4 67 Champaign 92.3 3 Rock Island 86.7 54Boone 85.4 66 McDonough 91.2 7 Kendall 92.0 4 Crawford 86.5 55Brown 75.6 102 McHenry 91.7 6 DuPage 92.0 5 Morgan 86.5 56Bureau 89.2 24 McLean 93.4 1 McHenry 91.7 6 Wabash 86.4 57Calhoun 84.3 76 Macon 86.9 51 McDonough 91.2 7 Washington 86.2 58Carroll 86.9 52 Macoupin 86.8 53 Monroe 91.0 8 Clay 86.2 59Cass 80.6 94 Madison 89.4 20 Sangamon 91.0 9 Pike 86.0 60Champaign 92.3 3 Marion 84.1 79 Grundy 90.7 10 Clinton 85.8 61
Christian 85.8 62 Marshall 90.2 14 DeKalb 90.7 11 Christian 85.8 62Clark 88.0 40 Mason 83.3 85 Menard 90.3 12 Lee 85.7 63Clay 86.2 59 Massac 85.0 72 DeWitt 90.3 13 Warren 85.5 64Clinton 85.8 61 Menard 90.3 12 Marshall 90.2 14 Whiteside 85.5 65Coles 89.3 22 Mercer 88.7 29 Tazewell 90.2 15 Boone 85.4 66Cook 83.2 86 Monroe 91.0 8 Hancock 90.1 16 Logan 85.4 67Crawford 86.5 55 Montgomery 83.5 84 Will 90.0 17 Kankakee 85.2 68Cumberland 88.1 38 Morgan 86.5 56 Piatt 89.8 18 Greene 85.2 69DeKalb 90.7 11 Moultrie 83.8 80 Jackson 89.5 19 Knox 85.2 70DeWitt 90.3 13 Ogle 87.4 46 Madison 89.4 20 Pope 85.1 71
Douglas 81.7 90 Peoria 88.7 31 Effingham 89.4 21 Massac 85.0 72DuPage 92.0 5 Perry 81.5 91 Coles 89.3 22 Vermilion 84.9 73Edgar 88.4 34 Piatt 89.8 18 Adams 89.2 23 White 84.5 74Edwards 89.0 28 Pike 86.0 60 Bureau 89.2 24 Winnebago 84.4 75Effingham 89.4 21 Pope 85.1 71 Schuyler 89.2 25 Calhoun 84.3 76Fayette 82.9 88 Pulaski 78.9 96 Richland 89.1 26 Wayne 84.3 77Ford 87.3 47 Putnam 88.7 30 Jo Daviess 89.1 27 Livingston 84.1 78Franklin 83.8 81 Randolph 78.5 97 Edwards 89.0 28 Marion 84.1 79Fulton 83.6 83 Richland 89.1 26 Mercer 88.7 29 Moultrie 83.8 80Gallatin 77.7 99 Rock Island 86.7 54 Putnam 88.7 30 Franklin 83.8 81
Greene 85.2 69 St. Clair 87.4 45 Peoria 88.7 31 Jefferson 83.7 82Grundy 90.7 10 Saline 82.1 89 Stephenson 88.5 32 Fulton 83.6 83Hamilton 80.8 93 Sangamon 91.0 9 Lake 88.5 33 Montgomery 83.5 84Hancock 90.1 16 Schuyler 89.2 25 Edgar 88.4 34 Mason 83.3 85Hardin 77.0 100 Scott 88.3 35 Scott 88.3 35 Cook 83.2 86Henderson 87.2 48 Shelby 87.7 44 Jasper 88.2 36 Kane 83.2 87Henry 87.9 42 Stark 88.0 39 Williamson 88.2 37 Fayette 82.9 88Iroquois 87.2 49 Stephenson 88.5 32 Cumberland 88.1 38 Saline 82.1 89Jackson 89.5 19 Tazewell 90.2 15 Stark 88.0 39 Douglas 81.7 90Jasper 88.2 36 Union 79.1 95 Clark 88.0 40 Perry 81.5 91
Jefferson 83.7 82 Vermilion 84.9 73 Bond 88.0 41 Lawrence 81.1 92Jersey 87.1 50 Wabash 86.4 57 Henry 87.9 42 Hamilton 80.8 93Jo Daviess 89.1 27 Warren 85.5 64 LaSalle 87.8 43 Cass 80.6 94Johnson 78.0 98 Washington 86.2 58 Shelby 87.7 44 Union 79.1 95Kane 83.2 87 Wayne 84.3 77 St. Clair 87.4 45 Pulaski 78.9 96Kankakee 85.2 68 White 84.5 74 Ogle 87.4 46 Randolph 78.5 97Kendall 92.0 4 Whiteside 85.5 65 Ford 87.3 47 Johnson 78.0 98Knox 85.2 70 Will 90.0 17 Henderson 87.2 48 Gallatin 77.7 99Lake 88.5 33 Williamson 88.2 37 Iroquois 87.2 49 Hardin 77.0 100LaSalle 87.8 43 Winnebago 84.4 75 Jersey 87.1 50 Alexander 76.0 101Lawrence 81.1 92 Woodford 92.4 2 Macon 86.9 51 Brown 75.6 102

130 / Illinois County Data Book
TABLE 14: PERCENT OF POPULATION WITH A BACHELOR’S DEGREE OR HIGHER, 2010
By county In rank order
County Rank County Rank County Rank County Rank
Adams 21.1% 27 Lee 15.0% 63 DuPage 45.3% 1 Whiteside 16.1% 52Alexander 9.5 101 Livingston 13.5 78 Lake 41.3 2 Bureau 16.1 53Bond 24.7 17 Logan 17.0 48 Champaign 41.2 3 Jersey 16.0 54Boone 20.8 29 McDonough 32.6 7 McLean 40.4 4 Carroll 15.9 55Brown 10.9 99 McHenry 32.1 9 Jackson 35.4 5 LaSalle 15.8 56Bureau 16.1 53 McLean 40.4 4 Cook 33.2 6 DeWitt 15.7 57Calhoun 12.5 89 Macon 20.5 31 McDonough 32.6 7 Wabash 15.3 58Carroll 15.9 55 Macoupin 15.0 61 Kendall 32.3 8 Knox 15.2 59Cass 12.3 91 Madison 23.0 23 McHenry 32.1 9 Stark 15.2 60Champaign 41.2 3 Marion 13.6 76 Kane 31.8 10 Macoupin 15.0 61
Christian 12.1 94 Marshall 17.1 46 Sangamon 31.0 11 Putnam 15.0 62Clark 16.4 51 Mason 16.5 50 Will 30.7 12 Lee 15.0 63Clay 13.8 73 Massac 14.1 70 Peoria 28.1 13 Douglas 14.9 64Clinton 18.9 36 Menard 24.2 18 DeKalb 28.0 14 Henderson 14.9 65Coles 23.3 20 Mercer 14.5 67 Woodford 26.0 15 Shelby 14.7 66Cook 33.2 6 Monroe 24.7 16 Monroe 24.7 16 Mercer 14.5 67Crawford 13.5 77 Montgomery 13.3 82 Bond 24.7 17 Saline 14.3 68Cumberland 13.0 84 Morgan 20.2 32 Menard 24.2 18 Fayette 14.3 69DeKalb 28.0 14 Moultrie 13.8 72 St. Clair 23.9 19 Massac 14.1 70DeWitt 15.7 57 Ogle 17.8 40 Coles 23.3 20 Jefferson 14.1 71
Douglas 14.9 64 Peoria 28.1 13 Tazewell 23.1 21 Moultrie 13.8 72DuPage 45.3 1 Perry 13.5 80 Jo Daviess 23.0 22 Clay 13.8 73Edgar 16.8 49 Piatt 22.9 24 Madison 23.0 23 Vermilion 13.7 74Edwards 13.1 83 Pike 12.7 88 Piatt 22.9 24 Iroquois 13.7 75Effingham 20.0 33 Pope 8.3 102 Williamson 21.7 25 Marion 13.6 76Fayette 14.3 69 Pulaski 11.9 96 Winnebago 21.1 26 Crawford 13.5 77Ford 17.8 42 Putnam 15.0 62 Adams 21.1 27 Livingston 13.5 78Franklin 12.4 90 Randolph 12.0 95 Rock Island 21.1 28 Greene 13.5 79Fulton 13.4 81 Richland 18.1 38 Boone 20.8 29 Perry 13.5 80Gallatin 10.1 100 Rock Island 21.1 28 Henry 20.6 30 Fulton 13.4 81
Greene 13.5 79 St. Clair 23.9 19 Macon 20.5 31 Montgomery 13.3 82Grundy 18.3 37 Saline 14.3 68 Morgan 20.2 32 Edwards 13.1 83Hamilton 12.7 87 Sangamon 31.0 11 Effingham 20.0 33 Cumberland 13.0 84Hancock 19.1 35 Schuyler 17.7 43 Warren 19.9 34 Jasper 13.0 85Hardin 11.0 98 Scott 18.0 39 Hancock 19.1 35 Johnson 12.8 86Henderson 14.9 65 Shelby 14.7 66 Clinton 18.9 36 Hamilton 12.7 87Henry 20.6 30 Stark 15.2 60 Grundy 18.3 37 Pike 12.7 88Iroquois 13.7 75 Stephenson 17.2 45 Richland 18.1 38 Calhoun 12.5 89Jackson 35.4 5 Tazewell 23.1 21 Scott 18.0 39 Franklin 12.4 90Jasper 13.0 85 Union 17.8 41 Ogle 17.8 40 Cass 12.3 91
Jefferson 14.1 71 Vermilion 13.7 74 Union 17.8 41 White 12.2 92Jersey 16.0 54 Wabash 15.3 58 Ford 17.8 42 Wayne 12.1 93Jo Daviess 23.0 22 Warren 19.9 34 Schuyler 17.7 43 Christian 12.1 94Johnson 12.8 86 Washington 17.1 47 Kankakee 17.4 44 Randolph 12.0 95Kane 31.8 10 Wayne 12.1 93 Stephenson 17.2 45 Pulaski 11.9 96Kankakee 17.4 44 White 12.2 92 Marshall 17.1 46 Lawrence 11.1 97Kendall 32.3 8 Whiteside 16.1 52 Washington 17.1 47 Hardin 11.0 98Knox 15.2 59 Will 30.7 12 Logan 17.0 48 Brown 10.9 99Lake 41.3 2 Williamson 21.7 25 Edgar 16.8 49 Gallatin 10.1 100LaSalle 15.8 56 Winnebago 21.1 26 Mason 16.5 50 Alexander 9.5 101Lawrence 11.1 97 Woodford 26.0 15 Clark 16.4 51 Pope 8.3 102

Illinois County Data Book / 131
TABLE 15: SINGLE FEMALE HOUSEHOLDS WITH CHILDREN UNDER 18, 2010 (as a percent of total households in the county)
By county In rank order
County Rank County Rank County Rank County Rank
Adams 10.3% 23 Lee 9.5% 33 Alexander 17.7% 1 Richland 8.4% 52Alexander 17.7 1 Livingston 8.9 39 St. Clair 14.9 2 Boone 8.4 53Bond 7.5 76 Logan 10.0 29 Vermilion 14.1 3 Brown 8.3 54Boone 8.4 53 McDonough 10.0 28 Peoria 14.1 4 Lake 8.3 55Brown 8.3 54 McHenry 6.8 85 Macon 14.0 5 Henry 8.3 56Bureau 8.3 57 McLean 10.0 30 Sangamon 13.1 6 Bureau 8.3 57Calhoun 5.9 98 Macon 14.0 5 Kankakee 12.9 7 Clark 8.3 58Carroll 7.5 74 Macoupin 8.0 65 Winnebago 12.8 8 Grundy 8.2 59Cass 10.2 24 Madison 10.2 25 Jackson 12.6 9 Lawrence 8.2 60Champaign 11.7 14 Marion 11.6 15 Pulaski 12.5 10 Effingham 8.2 61
Christian 9.4 34 Marshall 6.5 93 Rock Island 12.5 11 Union 8.1 62Clark 8.3 58 Mason 9.2 35 Cook 12.3 12 Pike 8.1 63Clay 8.6 46 Massac 10.3 22 Knox 12.2 13 Wabash 8.0 64Clinton 7.0 82 Menard 8.7 45 Champaign 11.7 14 Macoupin 8.0 65Coles 10.8 17 Mercer 6.3 95 Marion 11.6 15 White 8.0 66Cook 12.3 12 Monroe 5.6 101 Morgan 10.9 16 Hardin 7.9 67Crawford 7.7 72 Montgomery 8.9 43 Coles 10.8 17 Will 7.9 68Cumberland 6.6 91 Morgan 10.9 16 Jefferson 10.8 18 Gallatin 7.8 69DeKalb 10.7 19 Moultrie 7.7 71 DeKalb 10.7 19 Hamilton 7.8 70DeWitt 8.6 47 Ogle 8.5 50 Stephenson 10.7 20 Moultrie 7.7 71
Douglas 7.1 81 Peoria 14.1 4 Williamson 10.5 21 Crawford 7.7 72DuPage 6.9 83 Perry 10.1 27 Massac 10.3 22 Jersey 7.5 73Edgar 9.1 36 Piatt 6.8 86 Adams 10.3 23 Carroll 7.5 74Edwards 6.6 90 Pike 8.1 63 Cass 10.2 24 Iroquois 7.5 75Effingham 8.2 61 Pope 6.5 92 Madison 10.2 25 Bond 7.5 76Fayette 8.4 51 Pulaski 12.5 10 Whiteside 10.1 26 Greene 7.4 77Ford 8.9 40 Putnam 5.6 102 Perry 10.1 27 Schuyler 7.3 78Franklin 9.9 31 Randolph 8.8 44 McDonough 10.0 28 Wayne 7.3 79Fulton 8.9 38 Richland 8.4 52 Logan 10.0 29 Kendall 7.1 80Gallatin 7.8 69 Rock Island 12.5 11 McLean 10.0 30 Douglas 7.1 81
Greene 7.4 77 St. Clair 14.9 2 Franklin 9.9 31 Clinton 7.0 82Grundy 8.2 59 Saline 9.7 32 Saline 9.7 32 DuPage 6.9 83Hamilton 7.8 70 Sangamon 13.1 6 Lee 9.5 33 Henderson 6.8 84Hancock 6.7 88 Schuyler 7.3 78 Christian 9.4 34 McHenry 6.8 85Hardin 7.9 67 Scott 8.5 48 Mason 9.2 35 Piatt 6.8 86Henderson 6.8 84 Shelby 6.7 87 Edgar 9.1 36 Shelby 6.7 87Henry 8.3 56 Stark 6.3 94 LaSalle 9.0 37 Hancock 6.7 88Iroquois 7.5 75 Stephenson 10.7 20 Fulton 8.9 38 Johnson 6.6 89Jackson 12.6 9 Tazewell 8.9 41 Livingston 8.9 39 Edwards 6.6 90Jasper 5.7 100 Union 8.1 62 Ford 8.9 40 Cumberland 6.6 91
Jefferson 10.8 18 Vermilion 14.1 3 Tazewell 8.9 41 Pope 6.5 92Jersey 7.5 73 Wabash 8.0 64 Warren 8.9 42 Marshall 6.5 93Jo Daviess 6.1 96 Warren 8.9 42 Montgomery 8.9 43 Stark 6.3 94Johnson 6.6 89 Washington 5.9 99 Randolph 8.8 44 Mercer 6.3 95Kane 8.5 49 Wayne 7.3 79 Menard 8.7 45 Jo Daviess 6.1 96Kankakee 12.9 7 White 8.0 66 Clay 8.6 46 Woodford 6.1 97Kendall 7.1 80 Whiteside 10.1 26 DeWitt 8.6 47 Calhoun 5.9 98Knox 12.2 13 Will 7.9 68 Scott 8.5 48 Washington 5.9 99Lake 8.3 55 Williamson 10.5 21 Kane 8.5 49 Jasper 5.7 100LaSalle 9.0 37 Winnebago 12.8 8 Ogle 8.5 50 Monroe 5.6 101Lawrence 8.2 60 Woodford 6.1 97 Fayette 8.4 51 Putnam 5.6 102

132 / Illinois County Data Book
TABLE 16: SINGLE MALE HOUSEHOLDS WITH CHILDREN UNDER 18, 2010 (as a percent of total households in the county)
By county In rank order
County Rank County Rank County Rank County Rank
Adams 3.5% 66 Lee 3.9% 41 Christian 5.0% 1 Madison 3.8% 52Alexander 4.0 35 Livingston 4.2 19 Logan 4.7 2 Boone 3.8 53Bond 4.2 20 Logan 4.7 2 Fulton 4.7 3 Richland 3.7 54Boone 3.8 53 McDonough 3.4 76 Cumberland 4.5 4 Pulaski 3.7 55Brown 3.3 83 McHenry 2.8 99 Scott 4.5 5 Carroll 3.7 56Bureau 3.9 45 McLean 3.1 90 Franklin 4.5 6 Henderson 3.7 57Calhoun 2.4 101 Macon 3.6 63 Vermilion 4.5 7 Effingham 3.7 58Carroll 3.7 56 Macoupin 4.2 18 Pike 4.4 8 DeKalb 3.6 59Cass 4.3 16 Madison 3.8 52 Fayette 4.4 9 Iroquois 3.6 60Champaign 3.3 81 Marion 4.1 25 Montgomery 4.4 10 Shelby 3.6 61
Christian 5.0 1 Marshall 3.4 74 Clay 4.4 11 Stephenson 3.6 62Clark 3.8 48 Mason 4.1 29 Whiteside 4.4 12 Macon 3.6 63Clay 4.4 11 Massac 3.4 78 Warren 4.4 13 St. Clair 3.6 64Clinton 3.3 82 Menard 4.0 33 Greene 4.4 14 Moultrie 3.5 65Coles 4.1 28 Mercer 3.3 80 Williamson 4.3 15 Adams 3.5 66Cook 3.2 86 Monroe 2.9 95 Cass 4.3 16 Henry 3.5 67Crawford 3.9 38 Montgomery 4.4 10 Schuyler 4.2 17 Jersey 3.5 68Cumberland 4.5 4 Morgan 4.0 37 Macoupin 4.2 18 Tazewell 3.5 69DeKalb 3.6 59 Moultrie 3.5 65 Livingston 4.2 19 Hancock 3.5 70DeWitt 4.2 24 Ogle 4.0 30 Bond 4.2 20 Wayne 3.4 71
Douglas 3.1 91 Peoria 3.4 73 Saline 4.2 21 Jackson 3.4 72DuPage 2.2 102 Perry 4.0 34 Winnebago 4.2 22 Peoria 3.4 73Edgar 3.9 42 Piatt 3.0 93 LaSalle 4.2 23 Marshall 3.4 74Edwards 3.8 50 Pike 4.4 8 DeWitt 4.2 24 Stark 3.4 75Effingham 3.7 58 Pope 3.1 89 Marion 4.1 25 McDonough 3.4 76Fayette 4.4 9 Pulaski 3.7 55 White 4.1 26 Hardin 3.4 77Ford 3.8 46 Putnam 3.8 49 Gallatin 4.1 27 Massac 3.4 78Franklin 4.5 6 Randolph 3.8 47 Coles 4.1 28 Union 3.4 79Fulton 4.7 3 Richland 3.7 54 Mason 4.1 29 Mercer 3.3 80Gallatin 4.1 27 Rock Island 3.9 39 Ogle 4.0 30 Champaign 3.3 81
Greene 4.4 14 St. Clair 3.6 64 Jefferson 4.0 31 Clinton 3.3 82Grundy 4.0 36 Saline 4.2 21 Hamilton 4.0 32 Brown 3.3 83Hamilton 4.0 32 Sangamon 3.9 44 Menard 4.0 33 Kane 3.3 84Hancock 3.5 70 Schuyler 4.2 17 Perry 4.0 34 Jo Daviess 3.3 85Hardin 3.4 77 Scott 4.5 5 Alexander 4.0 35 Cook 3.2 86Henderson 3.7 57 Shelby 3.6 61 Grundy 4.0 36 Jasper 3.2 87Henry 3.5 67 Stark 3.4 75 Morgan 4.0 37 Wabash 3.2 88Iroquois 3.6 60 Stephenson 3.6 62 Crawford 3.9 38 Pope 3.1 89Jackson 3.4 72 Tazewell 3.5 69 Rock Island 3.9 39 McLean 3.1 90Jasper 3.2 87 Union 3.4 79 Kankakee 3.9 40 Douglas 3.1 91Jefferson 4.0 31 Vermilion 4.5 7 Lee 3.9 41 Washington 3.0 92
Jersey 3.5 68 Wabash 3.2 88 Edgar 3.9 42 Piatt 3.0 93Jo Daviess 3.3 85 Warren 4.4 13 Lawrence 3.9 43 Johnson 3.0 94Johnson 3.0 94 Washington 3.0 92 Sangamon 3.9 44 Monroe 2.9 95Kane 3.3 84 Wayne 3.4 71 Bureau 3.9 45 Kendall 2.9 96Kankakee 3.9 40 White 4.1 26 Ford 3.8 46 Lake 2.9 97Kendall 2.9 96 Whiteside 4.4 12 Randolph 3.8 47 Woodford 2.8 98Knox 3.8 51 Will 2.7 100 Clark 3.8 48 McHenry 2.8 99Lake 2.9 97 Williamson 4.3 15 Putnam 3.8 49 Will 2.7 100LaSalle 4.2 23 Winnebago 4.2 22 Edwards 3.8 50 Calhoun 2.4 101Lawrence 3.9 43 Woodford 2.8 98 Knox 3.8 51 DuPage 2.2 102
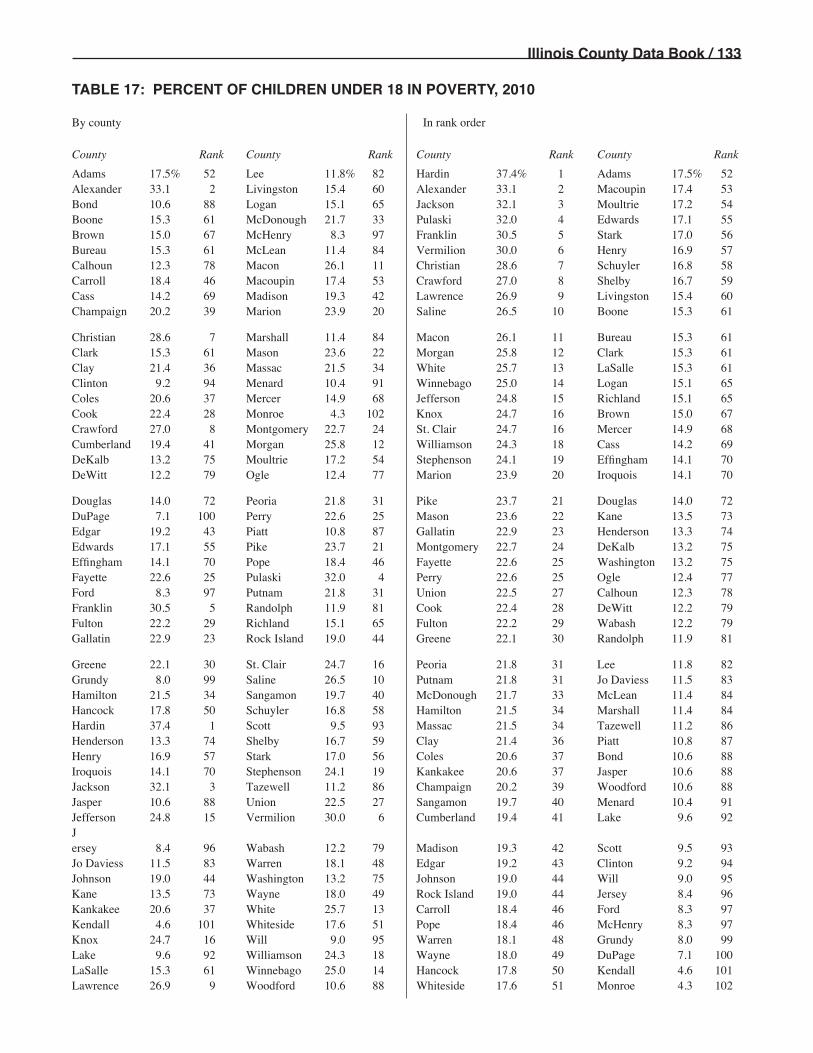
Illinois County Data Book / 133
TABLE 17: PERCENT OF CHILDREN UNDER 18 IN POVERTY, 2010
By county In rank order
County Rank County Rank County Rank County Rank
Adams 17.5% 52 Lee 11.8% 82 Hardin 37.4% 1 Adams 17.5% 52Alexander 33.1 2 Livingston 15.4 60 Alexander 33.1 2 Macoupin 17.4 53Bond 10.6 88 Logan 15.1 65 Jackson 32.1 3 Moultrie 17.2 54Boone 15.3 61 McDonough 21.7 33 Pulaski 32.0 4 Edwards 17.1 55Brown 15.0 67 McHenry 8.3 97 Franklin 30.5 5 Stark 17.0 56Bureau 15.3 61 McLean 11.4 84 Vermilion 30.0 6 Henry 16.9 57Calhoun 12.3 78 Macon 26.1 11 Christian 28.6 7 Schuyler 16.8 58Carroll 18.4 46 Macoupin 17.4 53 Crawford 27.0 8 Shelby 16.7 59Cass 14.2 69 Madison 19.3 42 Lawrence 26.9 9 Livingston 15.4 60Champaign 20.2 39 Marion 23.9 20 Saline 26.5 10 Boone 15.3 61
Christian 28.6 7 Marshall 11.4 84 Macon 26.1 11 Bureau 15.3 61Clark 15.3 61 Mason 23.6 22 Morgan 25.8 12 Clark 15.3 61Clay 21.4 36 Massac 21.5 34 White 25.7 13 LaSalle 15.3 61Clinton 9.2 94 Menard 10.4 91 Winnebago 25.0 14 Logan 15.1 65Coles 20.6 37 Mercer 14.9 68 Jefferson 24.8 15 Richland 15.1 65Cook 22.4 28 Monroe 4.3 102 Knox 24.7 16 Brown 15.0 67Crawford 27.0 8 Montgomery 22.7 24 St. Clair 24.7 16 Mercer 14.9 68Cumberland 19.4 41 Morgan 25.8 12 Williamson 24.3 18 Cass 14.2 69DeKalb 13.2 75 Moultrie 17.2 54 Stephenson 24.1 19 Effingham 14.1 70DeWitt 12.2 79 Ogle 12.4 77 Marion 23.9 20 Iroquois 14.1 70
Douglas 14.0 72 Peoria 21.8 31 Pike 23.7 21 Douglas 14.0 72DuPage 7.1 100 Perry 22.6 25 Mason 23.6 22 Kane 13.5 73Edgar 19.2 43 Piatt 10.8 87 Gallatin 22.9 23 Henderson 13.3 74Edwards 17.1 55 Pike 23.7 21 Montgomery 22.7 24 DeKalb 13.2 75Effingham 14.1 70 Pope 18.4 46 Fayette 22.6 25 Washington 13.2 75Fayette 22.6 25 Pulaski 32.0 4 Perry 22.6 25 Ogle 12.4 77Ford 8.3 97 Putnam 21.8 31 Union 22.5 27 Calhoun 12.3 78Franklin 30.5 5 Randolph 11.9 81 Cook 22.4 28 DeWitt 12.2 79Fulton 22.2 29 Richland 15.1 65 Fulton 22.2 29 Wabash 12.2 79Gallatin 22.9 23 Rock Island 19.0 44 Greene 22.1 30 Randolph 11.9 81
Greene 22.1 30 St. Clair 24.7 16 Peoria 21.8 31 Lee 11.8 82Grundy 8.0 99 Saline 26.5 10 Putnam 21.8 31 Jo Daviess 11.5 83Hamilton 21.5 34 Sangamon 19.7 40 McDonough 21.7 33 McLean 11.4 84Hancock 17.8 50 Schuyler 16.8 58 Hamilton 21.5 34 Marshall 11.4 84Hardin 37.4 1 Scott 9.5 93 Massac 21.5 34 Tazewell 11.2 86Henderson 13.3 74 Shelby 16.7 59 Clay 21.4 36 Piatt 10.8 87Henry 16.9 57 Stark 17.0 56 Coles 20.6 37 Bond 10.6 88Iroquois 14.1 70 Stephenson 24.1 19 Kankakee 20.6 37 Jasper 10.6 88Jackson 32.1 3 Tazewell 11.2 86 Champaign 20.2 39 Woodford 10.6 88Jasper 10.6 88 Union 22.5 27 Sangamon 19.7 40 Menard 10.4 91Jefferson 24.8 15 Vermilion 30.0 6 Cumberland 19.4 41 Lake 9.6 92Jersey 8.4 96 Wabash 12.2 79 Madison 19.3 42 Scott 9.5 93Jo Daviess 11.5 83 Warren 18.1 48 Edgar 19.2 43 Clinton 9.2 94Johnson 19.0 44 Washington 13.2 75 Johnson 19.0 44 Will 9.0 95Kane 13.5 73 Wayne 18.0 49 Rock Island 19.0 44 Jersey 8.4 96Kankakee 20.6 37 White 25.7 13 Carroll 18.4 46 Ford 8.3 97Kendall 4.6 101 Whiteside 17.6 51 Pope 18.4 46 McHenry 8.3 97Knox 24.7 16 Will 9.0 95 Warren 18.1 48 Grundy 8.0 99Lake 9.6 92 Williamson 24.3 18 Wayne 18.0 49 DuPage 7.1 100LaSalle 15.3 61 Winnebago 25.0 14 Hancock 17.8 50 Kendall 4.6 101Lawrence 26.9 9 Woodford 10.6 88 Whiteside 17.6 51 Monroe 4.3 102

134 / Illinois County Data Book
TABLE 18: INCOME PER CAPITA, 2010
By county In rank order
County Rank County Rank County Rank County Rank
Adams $37,130 23 Lee $32,671 64 Lake $53,905 1 Clark $33,430 52Alexander 26,045 100 Livingston 39,402 13 DuPage 52,854 2 Bond 33,406 53Bond 33,406 53 Logan 32,529 67 Cook 45,311 3 Winnebago 33,312 54Boone 31,465 84 McDonough 30,571 88 Piatt 44,537 4 Grundy 33,260 55Brown 26,544 98 McHenry 39,395 14 Peoria 42,354 5 Morgan 33,217 56Bureau 35,735 32 McLean 40,084 11 Sangamon 42,075 6 Williamson 33,143 57Calhoun 32,366 72 Macon 38,945 16 Monroe 41,909 7 Edgar 33,040 58Carroll 33,529 50 Macoupin 34,484 44 Ford 41,320 8 Knox 33,014 59Cass 32,450 69 Madison 36,781 25 Will 40,395 9 Hancock 32,992 60Champaign 33,963 46 Marion 32,614 65 Woodford 40,316 10 Scott 32,852 61
Christian 35,771 31 Marshall 38,655 18 McLean 40,084 11 Wabash 32,752 62Clark 33,430 52 Mason 35,690 33 Jo Daviess 39,574 12 Warren 32,726 63Clay 32,427 71 Massac 30,407 89 Livingston 39,402 13 Lee 32,671 64Clinton 37,178 21 Menard 39,163 15 McHenry 39,395 14 Marion 32,614 65Coles 31,696 81 Mercer 37,153 22 Menard 39,163 15 Saline 32,568 66Cook 45,311 3 Monroe 41,909 7 Macon 38,945 16 Logan 32,529 67Crawford 35,061 39 Montgomery 31,713 80 Rock Island 38,676 17 Henderson 32,519 68Cumberland 33,444 51 Morgan 33,217 56 Marshall 38,655 18 Cass 32,450 69DeKalb 30,725 87 Moultrie 35,321 38 Tazewell 38,469 19 Jefferson 32,435 70DeWitt 36,338 26 Ogle 33,578 47 Putnam 37,707 20 Clay 32,427 71
Douglas 34,321 45 Peoria 42,354 5 Clinton 37,178 21 Calhoun 32,366 72DuPage 52,854 2 Perry 25,535 101 Mercer 37,153 22 Schuyler 32,347 73Edgar 33,040 58 Piatt 44,537 4 Adams 37,130 23 Shelby 32,291 74Edwards 30,054 91 Pike 31,695 82 Washington 37,006 24 Kankakee 32,261 75Effingham 36,131 27 Pope 26,128 99 Madison 36,781 25 Jackson 32,186 76Fayette 26,836 97 Pulaski 30,844 86 DeWitt 36,338 26 Fulton 32,075 77Ford 41,320 8 Putnam 37,707 20 Effingham 36,131 27 Wayne 32,040 78Franklin 28,987 93 Randolph 28,008 95 Jersey 36,056 28 Hamilton 31,976 79Fulton 32,075 77 Richland 30,190 90 Kane 36,047 29 Montgomery 31,713 80Gallatin 33,573 49 Rock Island 38,676 17 Iroquois 35,790 30 Coles 31,696 81
Greene 29,953 92 St. Clair 35,646 34 Christian 35,771 31 Pike 31,695 82Grundy 33,260 55 Saline 32,568 66 Bureau 35,735 32 Vermilion 31,520 83Hamilton 31,976 79 Sangamon 42,075 6 Mason 35,690 33 Boone 31,465 84Hancock 32,992 60 Schuyler 32,347 73 St. Clair 35,646 34 Union 31,193 85Hardin 27,949 96 Scott 32,852 61 White 35,461 35 Pulaski 30,844 86Henderson 32,519 68 Shelby 32,291 74 Henry 35,419 36 DeKalb 30,725 87Henry 35,419 36 Stark 34,554 43 LaSalle 35,345 37 McDonough 30,571 88Iroquois 35,790 30 Stephenson 34,955 40 Moultrie 35,321 38 Massac 30,407 89Jackson 32,186 76 Tazewell 38,469 19 Crawford 35,061 39 Richland 30,190 90Jasper 33,576 48 Union 31,193 85 Stephenson 34,955 40 Edwards 30,054 91
Jefferson 32,435 70 Vermilion 31,520 83 Whiteside 34,898 41 Greene 29,953 92Jersey 36,056 28 Wabash 32,752 62 Kendall 34,740 42 Franklin 28,987 93Jo Daviess 39,574 12 Warren 32,726 63 Stark 34,554 43 Lawrence 28,250 94Johnson 25,000 102 Washington 37,006 24 Macoupin 34,484 44 Randolph 28,008 95Kane 36,047 29 Wayne 32,040 78 Douglas 34,321 45 Hardin 27,949 96Kankakee 32,261 75 White 35,461 35 Champaign 33,963 46 Fayette 26,836 97Kendall 34,740 42 Whiteside 34,898 41 Ogle 33,578 47 Brown 26,544 98Knox 33,014 59 Will 40,395 9 Jasper 33,576 48 Pope 26,128 99Lake 53,905 1 Williamson 33,143 57 Gallatin 33,573 49 Alexander 26,045 100LaSalle 35,345 37 Winnebago 33,312 54 Carroll 33,529 50 Perry 25,535 101Lawrence 28,250 94 Woodford 40,316 10 Cumberland 33,444 51 Johnson 25,000 102
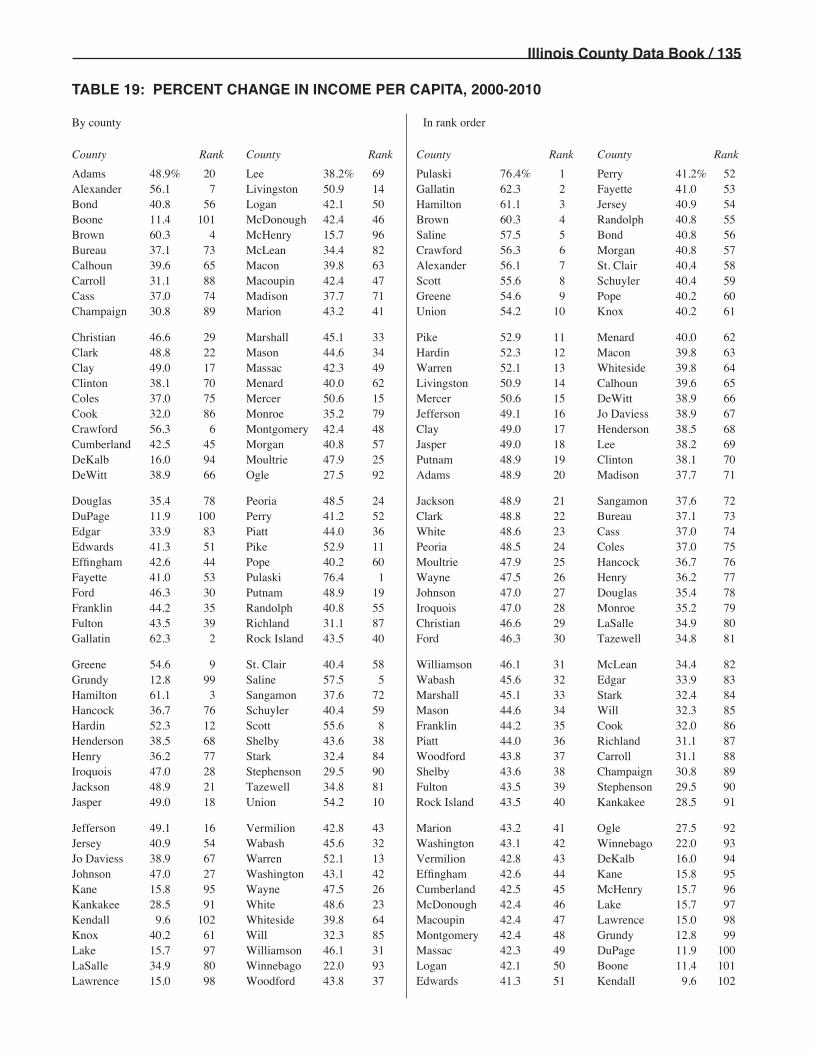
Illinois County Data Book / 135
TABLE 19: PERCENT CHANGE IN INCOME PER CAPITA, 2000-2010
By county In rank order
County Rank County Rank County Rank County Rank
Adams 48.9% 20 Lee 38.2% 69 Pulaski 76.4% 1 Perry 41.2% 52Alexander 56.1 7 Livingston 50.9 14 Gallatin 62.3 2 Fayette 41.0 53Bond 40.8 56 Logan 42.1 50 Hamilton 61.1 3 Jersey 40.9 54Boone 11.4 101 McDonough 42.4 46 Brown 60.3 4 Randolph 40.8 55Brown 60.3 4 McHenry 15.7 96 Saline 57.5 5 Bond 40.8 56Bureau 37.1 73 McLean 34.4 82 Crawford 56.3 6 Morgan 40.8 57Calhoun 39.6 65 Macon 39.8 63 Alexander 56.1 7 St. Clair 40.4 58Carroll 31.1 88 Macoupin 42.4 47 Scott 55.6 8 Schuyler 40.4 59Cass 37.0 74 Madison 37.7 71 Greene 54.6 9 Pope 40.2 60Champaign 30.8 89 Marion 43.2 41 Union 54.2 10 Knox 40.2 61
Christian 46.6 29 Marshall 45.1 33 Pike 52.9 11 Menard 40.0 62Clark 48.8 22 Mason 44.6 34 Hardin 52.3 12 Macon 39.8 63Clay 49.0 17 Massac 42.3 49 Warren 52.1 13 Whiteside 39.8 64Clinton 38.1 70 Menard 40.0 62 Livingston 50.9 14 Calhoun 39.6 65Coles 37.0 75 Mercer 50.6 15 Mercer 50.6 15 DeWitt 38.9 66Cook 32.0 86 Monroe 35.2 79 Jefferson 49.1 16 Jo Daviess 38.9 67Crawford 56.3 6 Montgomery 42.4 48 Clay 49.0 17 Henderson 38.5 68Cumberland 42.5 45 Morgan 40.8 57 Jasper 49.0 18 Lee 38.2 69DeKalb 16.0 94 Moultrie 47.9 25 Putnam 48.9 19 Clinton 38.1 70DeWitt 38.9 66 Ogle 27.5 92 Adams 48.9 20 Madison 37.7 71
Douglas 35.4 78 Peoria 48.5 24 Jackson 48.9 21 Sangamon 37.6 72DuPage 11.9 100 Perry 41.2 52 Clark 48.8 22 Bureau 37.1 73Edgar 33.9 83 Piatt 44.0 36 White 48.6 23 Cass 37.0 74Edwards 41.3 51 Pike 52.9 11 Peoria 48.5 24 Coles 37.0 75Effingham 42.6 44 Pope 40.2 60 Moultrie 47.9 25 Hancock 36.7 76Fayette 41.0 53 Pulaski 76.4 1 Wayne 47.5 26 Henry 36.2 77Ford 46.3 30 Putnam 48.9 19 Johnson 47.0 27 Douglas 35.4 78Franklin 44.2 35 Randolph 40.8 55 Iroquois 47.0 28 Monroe 35.2 79Fulton 43.5 39 Richland 31.1 87 Christian 46.6 29 LaSalle 34.9 80Gallatin 62.3 2 Rock Island 43.5 40 Ford 46.3 30 Tazewell 34.8 81
Greene 54.6 9 St. Clair 40.4 58 Williamson 46.1 31 McLean 34.4 82Grundy 12.8 99 Saline 57.5 5 Wabash 45.6 32 Edgar 33.9 83Hamilton 61.1 3 Sangamon 37.6 72 Marshall 45.1 33 Stark 32.4 84Hancock 36.7 76 Schuyler 40.4 59 Mason 44.6 34 Will 32.3 85Hardin 52.3 12 Scott 55.6 8 Franklin 44.2 35 Cook 32.0 86Henderson 38.5 68 Shelby 43.6 38 Piatt 44.0 36 Richland 31.1 87Henry 36.2 77 Stark 32.4 84 Woodford 43.8 37 Carroll 31.1 88Iroquois 47.0 28 Stephenson 29.5 90 Shelby 43.6 38 Champaign 30.8 89Jackson 48.9 21 Tazewell 34.8 81 Fulton 43.5 39 Stephenson 29.5 90Jasper 49.0 18 Union 54.2 10 Rock Island 43.5 40 Kankakee 28.5 91
Jefferson 49.1 16 Vermilion 42.8 43 Marion 43.2 41 Ogle 27.5 92Jersey 40.9 54 Wabash 45.6 32 Washington 43.1 42 Winnebago 22.0 93Jo Daviess 38.9 67 Warren 52.1 13 Vermilion 42.8 43 DeKalb 16.0 94Johnson 47.0 27 Washington 43.1 42 Effingham 42.6 44 Kane 15.8 95Kane 15.8 95 Wayne 47.5 26 Cumberland 42.5 45 McHenry 15.7 96Kankakee 28.5 91 White 48.6 23 McDonough 42.4 46 Lake 15.7 97Kendall 9.6 102 Whiteside 39.8 64 Macoupin 42.4 47 Lawrence 15.0 98Knox 40.2 61 Will 32.3 85 Montgomery 42.4 48 Grundy 12.8 99Lake 15.7 97 Williamson 46.1 31 Massac 42.3 49 DuPage 11.9 100LaSalle 34.9 80 Winnebago 22.0 93 Logan 42.1 50 Boone 11.4 101Lawrence 15.0 98 Woodford 43.8 37 Edwards 41.3 51 Kendall 9.6 102

136 / Illinois County Data Book
TABLE 20: UNEMPLOYMENT RATE, 2010
By county In rank order
County Rank County Rank County Rank County Rank
Adams 7.5% 101 Lee 11.2% 28 Boone 15.9% 1 Iroquois 10.1% 48Alexander 11.9 18 Livingston 10.6 40 Winnebago 15.3 2 Wabash 10.1 48Bond 10.1 48 Logan 9.4 75 Ogle 13.6 3 Crawford 10.0 54Boone 15.9 1 McDonough 8.4 89 Kankakee 13.3 4 McHenry 10.0 54Brown 5.3 102 McHenry 10.0 54 Montgomery 13.3 4 Saline 10.0 54Bureau 11.5 24 McLean 7.8 100 LaSalle 13.2 6 Madison 9.9 57Calhoun 10.9 34 Macon 12.0 16 Franklin 13.0 7 Marshall 9.9 57Carroll 11.4 26 Macoupin 10.6 40 Clark 12.7 8 Coles 9.8 59Cass 7.9 95 Madison 9.9 57 Mason 12.7 8 DeKalb 9.8 59Champaign 9.0 80 Marion 12.2 14 Clay 12.4 10 Greene 9.8 59
Christian 10.1 48 Marshall 9.9 57 Grundy 12.4 10 Scott 9.8 59Clark 12.7 8 Mason 12.7 8 Vermilion 12.4 10 Wayne 9.8 59Clay 12.4 10 Massac 9.5 68 Putnam 12.3 13 Jasper 9.7 64Clinton 8.2 92 Menard 7.9 95 Marion 12.2 14 Jefferson 9.7 64Coles 9.8 59 Mercer 10.8 36 Union 12.2 14 Knox 9.7 64Cook 10.8 36 Monroe 7.9 95 Macon 12.0 16 Rock Island 9.6 67Crawford 10.0 54 Montgomery 13.3 4 Perry 12.0 16 Douglas 9.5 68Cumberland 10.8 36 Morgan 9.5 68 Alexander 11.9 18 Edwards 9.5 68DeKalb 9.8 59 Moultrie 8.8 84 Fayette 11.9 18 Hamilton 9.5 68DeWitt 9.0 80 Ogle 13.6 3 Fulton 11.8 20 Kendall 9.5 68
Douglas 9.5 68 Peoria 11.0 31 Hancock 11.8 20 Massac 9.5 68DuPage 8.5 87 Perry 12.0 16 Stephenson 11.8 20 Morgan 9.5 68Edgar 11.0 31 Piatt 8.8 84 Hardin 11.7 23 Williamson 9.5 68Edwards 9.5 68 Pike 8.9 82 Bureau 11.5 24 Jersey 9.4 75Effingham 8.4 89 Pope 11.4 26 Pulaski 11.5 24 Logan 9.4 75Fayette 11.9 18 Pulaski 11.5 24 Carroll 11.4 26 Lawrence 9.3 77Ford 10.4 44 Putnam 12.3 13 Pope 11.4 26 Henry 9.1 78Franklin 13.0 7 Randolph 9.1 78 Lee 11.2 28 Randolph 9.1 78Fulton 11.8 20 Richland 10.4 44 Stark 11.2 28 Champaign 9.0 80Gallatin 10.1 48 Rock Island 9.6 67 Johnson 11.1 30 DeWitt 9.0 80
Greene 9.8 59 St. Clair 10.9 34 Edgar 11.0 31 Jo Daviess 8.9 82Grundy 12.4 10 Saline 10.0 54 Peoria 11.0 31 Pike 8.9 82Hamilton 9.5 68 Sangamon 8.2 92 Whiteside 11.0 31 Moultrie 8.8 84Hancock 11.8 20 Schuyler 7.9 95 Calhoun 10.9 34 Piatt 8.8 84Hardin 11.7 23 Scott 9.8 59 St. Clair 10.9 34 White 8.8 84Henderson 10.1 48 Shelby 10.4 44 Cook 10.8 36 DuPage 8.5 87Henry 9.1 78 Stark 11.2 28 Cumberland 10.8 36 Warren 8.5 87Iroquois 10.1 48 Stephenson 11.8 20 Mercer 10.8 36 Effingham 8.4 89Jackson 8.0 94 Tazewell 10.2 47 Will 10.7 39 McDonough 8.4 89Jasper 9.7 64 Union 12.2 14 Livingston 10.6 40 Woodford 8.3 91
Jefferson 9.7 64 Vermilion 12.4 10 Macoupin 10.6 40 Clinton 8.2 92Jersey 9.4 75 Wabash 10.1 48 Kane 10.5 42 Sangamon 8.2 92Jo Daviess 8.9 82 Warren 8.5 87 Lake 10.5 42 Jackson 8.0 94Johnson 11.1 30 Washington 7.9 95 Ford 10.4 44 Cass 7.9 95Kane 10.5 42 Wayne 9.8 59 Richland 10.4 44 Menard 7.9 95Kankakee 13.3 4 White 8.8 84 Shelby 10.4 44 Monroe 7.9 95Kendall 9.5 68 Whiteside 11.0 31 Tazewell 10.2 47 Schuyler 7.9 95Knox 9.7 64 Will 10.7 39 Bond 10.1 48 Washington 7.9 95Lake 10.5 42 Williamson 9.5 68 Christian 10.1 48 McLean 7.8 100LaSalle 13.2 6 Winnebago 15.3 2 Gallatin 10.1 48 Adams 7.5 101Lawrence 9.3 77 Woodford 8.3 91 Henderson 10.1 48 Brown 5.3 102

Illinois County Data Book / 137
TABLE 21: PERCENT CHANGE IN UNEMPLOYMENT RATE, 2000-2010
By county In rank order
County Rank County Rank County Rank County Rank
Adams 97.4% 63 Lee 160.5% 12 Winnebago 232.6% 1 Vermilion 110.2% 52Alexander 52.6 99 Livingston 171.8 10 Boone 224.5 2 Moultrie 109.5 53Bond 129.5 36 Logan 135.0 31 Ogle 209.1 3 Rock Island 108.7 54Boone 224.5 2 McDonough 95.3 65 Kankakee 189.1 4 Shelby 108.0 55Brown 51.4 101 McHenry 177.8 7 Kendall 187.9 5 Jo Daviess 107.0 56Bureau 130.0 35 McLean 129.4 38 Lake 183.8 6 Jersey 104.3 57Calhoun 98.2 60 Macon 126.4 39 McHenry 177.8 7 Clay 103.3 58Carroll 96.6 64 Macoupin 135.6 30 Ford 173.7 8 Scott 100.0 59Cass 68.1 90 Madison 125.0 43 DeKalb 172.2 9 Calhoun 98.2 60Champaign 157.1 14 Marion 110.3 51 Livingston 171.8 10 Knox 98.0 61
Christian 87.0 71 Marshall 135.7 29 Will 161.0 11 Washington 97.5 62Clark 154.0 17 Mason 115.3 48 Lee 160.5 12 Adams 97.4 63Clay 103.3 58 Massac 75.9 84 DuPage 157.6 13 Carroll 96.6 64Clinton 115.8 47 Menard 119.4 46 Champaign 157.1 14 McDonough 95.3 65Coles 133.3 34 Mercer 92.9 67 Hancock 156.5 15 Jasper 94.0 66Cook 125.0 41 Monroe 139.4 26 Whiteside 155.8 16 Mercer 92.9 67Crawford 75.4 85 Montgomery 133.3 33 Clark 154.0 17 Wabash 90.6 68Cumberland 125.0 41 Morgan 126.2 40 Tazewell 148.8 18 Fayette 88.9 69DeKalb 172.2 9 Moultrie 109.5 53 Piatt 144.4 19 Warren 88.9 69DeWitt 63.6 92 Ogle 209.1 3 Edgar 144.4 20 Christian 87.0 71
Douglas 137.5 27 Peoria 144.4 20 Peoria 144.4 20 Effingham 86.7 72DuPage 157.6 13 Perry 69.0 89 LaSalle 144.4 22 Hamilton 86.3 73Edgar 144.4 20 Piatt 144.4 19 Kane 144.2 23 Franklin 85.7 74Edwards 79.2 81 Pike 61.8 96 Putnam 141.2 24 Henry 85.7 75Effingham 86.7 72 Pope 70.1 88 Henderson 140.5 25 Union 84.8 76Fayette 88.9 69 Pulaski 59.7 97 Monroe 139.4 26 Stark 83.6 77Ford 173.7 8 Putnam 141.2 24 Douglas 137.5 27 Jackson 81.8 78Franklin 85.7 74 Randolph 78.4 82 Woodford 137.1 28 Greene 81.5 79Fulton 110.7 50 Richland 67.7 91 Marshall 135.7 29 Jefferson 79.6 80Gallatin 62.9 95 Rock Island 108.7 54 Macoupin 135.6 30 Edwards 79.2 81
Greene 81.5 79 St. Clair 113.7 49 Logan 135.0 31 Randolph 78.4 82Grundy 134.0 32 Saline 42.9 102 Grundy 134.0 32 Johnson 76.2 83Hamilton 86.3 73 Sangamon 121.6 45 Montgomery 133.3 33 Massac 75.9 84Hancock 156.5 15 Schuyler 51.9 100 Coles 133.3 34 Crawford 75.4 85Hardin 74.6 86 Scott 100.0 59 Bureau 130.0 35 Hardin 74.6 86Henderson 140.5 25 Shelby 108.0 55 Bond 129.5 36 White 72.5 87Henry 85.7 75 Stark 83.6 77 Iroquois 129.5 36 Pope 70.1 88Iroquois 129.5 36 Stephenson 122.6 44 McLean 129.4 38 Perry 69.0 89Jackson 81.8 78 Tazewell 148.8 18 Macon 126.4 39 Cass 68.1 90Jasper 94.0 66 Union 84.8 76 Morgan 126.2 40 Richland 67.7 91
Jefferson 79.6 80 Vermilion 110.2 52 Cook 125.0 41 DeWitt 63.6 92Jersey 104.3 57 Wabash 90.6 68 Cumberland 125.0 41 Wayne 63.3 93Jo Daviess 107.0 56 Warren 88.9 69 Madison 125.0 43 Lawrence 63.2 94Johnson 76.2 83 Washington 97.5 62 Stephenson 122.6 44 Gallatin 62.9 95Kane 144.2 23 Wayne 63.3 93 Sangamon 121.6 45 Pike 61.8 96Kankakee 189.1 4 White 72.5 87 Menard 119.4 46 Pulaski 59.7 97Kendall 187.9 5 Whiteside 155.8 16 Clinton 115.8 47 Williamson 53.2 98Knox 98.0 61 Will 161.0 11 Mason 115.3 48 Alexander 52.6 99Lake 183.8 6 Williamson 53.2 98 St. Clair 113.7 49 Schuyler 51.9 100LaSalle 144.4 22 Winnebago 232.6 1 Fulton 110.7 50 Brown 51.4 101Lawrence 63.2 94 Woodford 137.1 28 Marion 110.3 51 Saline 42.9 102
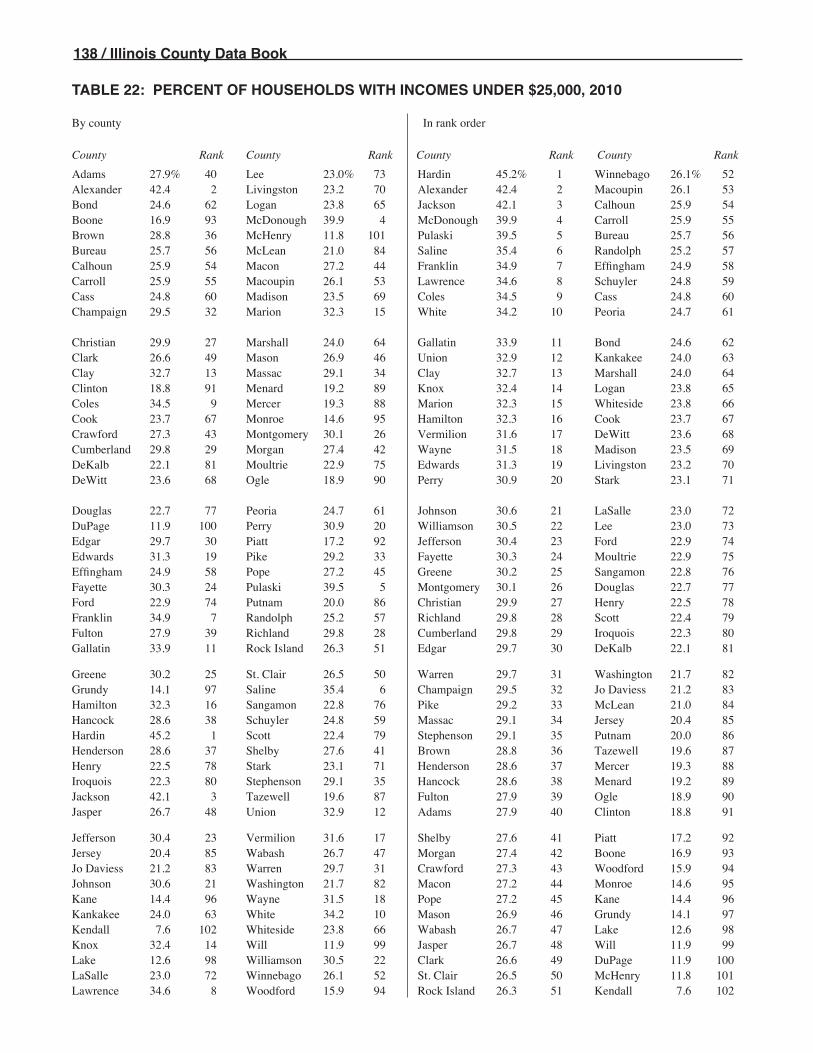
138 / Illinois County Data Book
TABLE 22: PERCENT OF HOUSEHOLDS WITH INCOMES UNDER $25,000, 2010
By county In rank order
County Rank County Rank County Rank County Rank
Adams 27.9% 40 Lee 23.0% 73 Hardin 45.2% 1 Winnebago 26.1% 52Alexander 42.4 2 Livingston 23.2 70 Alexander 42.4 2 Macoupin 26.1 53Bond 24.6 62 Logan 23.8 65 Jackson 42.1 3 Calhoun 25.9 54Boone 16.9 93 McDonough 39.9 4 McDonough 39.9 4 Carroll 25.9 55Brown 28.8 36 McHenry 11.8 101 Pulaski 39.5 5 Bureau 25.7 56Bureau 25.7 56 McLean 21.0 84 Saline 35.4 6 Randolph 25.2 57Calhoun 25.9 54 Macon 27.2 44 Franklin 34.9 7 Effingham 24.9 58Carroll 25.9 55 Macoupin 26.1 53 Lawrence 34.6 8 Schuyler 24.8 59Cass 24.8 60 Madison 23.5 69 Coles 34.5 9 Cass 24.8 60Champaign 29.5 32 Marion 32.3 15 White 34.2 10 Peoria 24.7 61
Christian 29.9 27 Marshall 24.0 64 Gallatin 33.9 11 Bond 24.6 62Clark 26.6 49 Mason 26.9 46 Union 32.9 12 Kankakee 24.0 63Clay 32.7 13 Massac 29.1 34 Clay 32.7 13 Marshall 24.0 64Clinton 18.8 91 Menard 19.2 89 Knox 32.4 14 Logan 23.8 65Coles 34.5 9 Mercer 19.3 88 Marion 32.3 15 Whiteside 23.8 66Cook 23.7 67 Monroe 14.6 95 Hamilton 32.3 16 Cook 23.7 67Crawford 27.3 43 Montgomery 30.1 26 Vermilion 31.6 17 DeWitt 23.6 68Cumberland 29.8 29 Morgan 27.4 42 Wayne 31.5 18 Madison 23.5 69DeKalb 22.1 81 Moultrie 22.9 75 Edwards 31.3 19 Livingston 23.2 70DeWitt 23.6 68 Ogle 18.9 90 Perry 30.9 20 Stark 23.1 71
Douglas 22.7 77 Peoria 24.7 61 Johnson 30.6 21 LaSalle 23.0 72DuPage 11.9 100 Perry 30.9 20 Williamson 30.5 22 Lee 23.0 73Edgar 29.7 30 Piatt 17.2 92 Jefferson 30.4 23 Ford 22.9 74Edwards 31.3 19 Pike 29.2 33 Fayette 30.3 24 Moultrie 22.9 75Effingham 24.9 58 Pope 27.2 45 Greene 30.2 25 Sangamon 22.8 76Fayette 30.3 24 Pulaski 39.5 5 Montgomery 30.1 26 Douglas 22.7 77Ford 22.9 74 Putnam 20.0 86 Christian 29.9 27 Henry 22.5 78Franklin 34.9 7 Randolph 25.2 57 Richland 29.8 28 Scott 22.4 79Fulton 27.9 39 Richland 29.8 28 Cumberland 29.8 29 Iroquois 22.3 80Gallatin 33.9 11 Rock Island 26.3 51 Edgar 29.7 30 DeKalb 22.1 81
Greene 30.2 25 St. Clair 26.5 50 Warren 29.7 31 Washington 21.7 82Grundy 14.1 97 Saline 35.4 6 Champaign 29.5 32 Jo Daviess 21.2 83Hamilton 32.3 16 Sangamon 22.8 76 Pike 29.2 33 McLean 21.0 84Hancock 28.6 38 Schuyler 24.8 59 Massac 29.1 34 Jersey 20.4 85Hardin 45.2 1 Scott 22.4 79 Stephenson 29.1 35 Putnam 20.0 86Henderson 28.6 37 Shelby 27.6 41 Brown 28.8 36 Tazewell 19.6 87Henry 22.5 78 Stark 23.1 71 Henderson 28.6 37 Mercer 19.3 88Iroquois 22.3 80 Stephenson 29.1 35 Hancock 28.6 38 Menard 19.2 89Jackson 42.1 3 Tazewell 19.6 87 Fulton 27.9 39 Ogle 18.9 90Jasper 26.7 48 Union 32.9 12 Adams 27.9 40 Clinton 18.8 91
Jefferson 30.4 23 Vermilion 31.6 17 Shelby 27.6 41 Piatt 17.2 92Jersey 20.4 85 Wabash 26.7 47 Morgan 27.4 42 Boone 16.9 93Jo Daviess 21.2 83 Warren 29.7 31 Crawford 27.3 43 Woodford 15.9 94Johnson 30.6 21 Washington 21.7 82 Macon 27.2 44 Monroe 14.6 95Kane 14.4 96 Wayne 31.5 18 Pope 27.2 45 Kane 14.4 96Kankakee 24.0 63 White 34.2 10 Mason 26.9 46 Grundy 14.1 97Kendall 7.6 102 Whiteside 23.8 66 Wabash 26.7 47 Lake 12.6 98Knox 32.4 14 Will 11.9 99 Jasper 26.7 48 Will 11.9 99Lake 12.6 98 Williamson 30.5 22 Clark 26.6 49 DuPage 11.9 100LaSalle 23.0 72 Winnebago 26.1 52 St. Clair 26.5 50 McHenry 11.8 101Lawrence 34.6 8 Woodford 15.9 94 Rock Island 26.3 51 Kendall 7.6 102

Illinois County Data Book / 139
TABLE 23: PERCENT OF HOUSEHOLDS WITH INCOMES $25,000 to $99,999, 2010
By county In rank order
County Rank County Rank County Rank County Rank
Adams 59.2% 61 Lee 62.4% 23 Schuyler 69.1% 1 Christian 60.0% 52Alexander 54.0 93 Livingston 62.5 21 Mercer 67.0 2 Crawford 60.0 53Bond 58.9 66 Logan 62.2 25 Cass 65.7 3 Effingham 59.9 54Boone 59.6 57 McDonough 51.6 98 Pope 65.5 4 Morgan 59.9 55Brown 59.2 59 McHenry 55.0 91 Douglas 65.0 5 Rock Island 59.7 56Bureau 62.2 27 McLean 55.5 87 Ogle 65.0 6 Boone 59.6 57Calhoun 61.4 36 Macon 57.8 75 Iroquois 64.9 7 Edwards 59.5 58Carroll 62.2 28 Macoupin 60.8 44 Jo Daviess 64.7 8 Brown 59.2 59Cass 65.7 3 Madison 58.2 71 Washington 64.3 9 Vermilion 59.2 60Champaign 53.3 96 Marion 58.2 72 Piatt 64.1 10 Adams 59.2 61
Christian 60.0 52 Marshall 62.0 30 Jersey 63.9 11 Richland 59.0 62Clark 62.1 29 Mason 61.3 38 Whiteside 63.8 12 Jefferson 58.9 63Clay 56.6 83 Massac 62.8 20 Moultrie 63.7 13 Edgar 58.9 64Clinton 63.1 16 Menard 61.7 33 Randolph 63.3 14 Montgomery 58.9 65Coles 53.9 94 Mercer 67.0 2 Jasper 63.2 15 Bond 58.9 66Cook 53.3 95 Monroe 56.0 85 Clinton 63.1 16 Knox 58.8 67Crawford 60.0 53 Montgomery 58.9 65 Fulton 63.0 17 Union 58.8 68Cumberland 60.1 51 Morgan 59.9 55 Ford 63.0 18 Winnebago 58.3 69DeKalb 57.8 74 Moultrie 63.7 13 DeWitt 62.9 19 Sangamon 58.3 70DeWitt 62.9 19 Ogle 65.0 6 Massac 62.8 20 Madison 58.2 71
Douglas 65.0 5 Peoria 57.4 79 Livingston 62.5 21 Marion 58.2 72DuPage 51.8 97 Perry 61.1 41 Henry 62.5 22 Franklin 57.9 73Edgar 58.9 64 Piatt 64.1 10 Lee 62.4 23 DeKalb 57.8 74Edwards 59.5 58 Pike 61.4 35 Shelby 62.3 24 Macon 57.8 75Effingham 59.9 54 Pope 65.5 4 Logan 62.2 25 Williamson 57.8 76Fayette 57.4 80 Pulaski 50.1 99 Greene 62.2 26 Woodford 57.8 77Ford 63.0 18 Putnam 60.3 49 Bureau 62.2 27 Hamilton 57.7 78Franklin 57.9 73 Randolph 63.3 14 Carroll 62.2 28 Peoria 57.4 79Fulton 63.0 17 Richland 59.0 62 Clark 62.1 29 Fayette 57.4 80Gallatin 57.3 81 Rock Island 59.7 56 Marshall 62.0 30 Gallatin 57.3 81
Greene 62.2 26 St. Clair 55.9 86 Tazewell 62.0 31 Kendall 57.2 82Grundy 61.8 32 Saline 55.5 88 Grundy 61.8 32 Clay 56.6 83Hamilton 57.7 78 Sangamon 58.3 70 Menard 61.7 33 White 56.4 84Hancock 61.0 42 Schuyler 69.1 1 Scott 61.6 34 Monroe 56.0 85Hardin 49.7 100 Scott 61.6 34 Pike 61.4 35 St. Clair 55.9 86Henderson 60.5 46 Shelby 62.3 24 Calhoun 61.4 36 McLean 55.5 87Henry 62.5 22 Stark 60.8 45 Warren 61.4 37 Saline 55.5 88Iroquois 64.9 7 Stephenson 60.4 47 Mason 61.3 38 Kane 55.3 89Jackson 47.4 102 Tazewell 62.0 31 Wabash 61.3 39 Lawrence 55.0 90Jasper 63.2 15 Union 58.8 68 LaSalle 61.1 40 McHenry 55.0 91
Jefferson 58.9 63 Vermilion 59.2 60 Perry 61.1 41 Will 54.7 92Jersey 63.9 11 Wabash 61.3 39 Hancock 61.0 42 Alexander 54.0 93Jo Daviess 64.7 8 Warren 61.4 37 Johnson 60.9 43 Coles 53.9 94Johnson 60.9 43 Washington 64.3 9 Macoupin 60.8 44 Cook 53.3 95Kane 55.3 89 Wayne 60.4 48 Stark 60.8 45 Champaign 53.3 96Kankakee 60.1 50 White 56.4 84 Henderson 60.5 46 DuPage 51.8 97Kendall 57.2 82 Whiteside 63.8 12 Stephenson 60.4 47 McDonough 51.6 98Knox 58.8 67 Will 54.7 92 Wayne 60.4 48 Pulaski 50.1 99Lake 49.5 101 Williamson 57.8 76 Putnam 60.3 49 Hardin 49.7 100LaSalle 61.1 40 Winnebago 58.3 69 Kankakee 60.1 50 Lake 49.5 101Lawrence 55.0 90 Woodford 57.8 77 Cumberland 60.1 51 Jackson 47.4 102

140 / Illinois County Data BookTABLE 24: PERCENT OF HOUSEHOLDS WITH INCOMES $100,000 AND OVER, 2010
By county In rank order
County Rank County Rank County Rank County Rank
Adams 12.9% 47 Lee 14.7% 35 Lake 37.9% 1 Whiteside 12.4% 52Alexander 3.6 102 Livingston 14.3 36 DuPage 36.4 2 Fayette 12.3 53Bond 16.6 24 Logan 14.0 42 Kendall 35.2 3 Douglas 12.3 54Boone 23.5 11 McDonough 8.5 91 Will 33.4 4 Bureau 12.2 55Brown 12.0 58 McHenry 33.2 5 McHenry 33.2 5 Wabash 12.0 56Bureau 12.2 55 McLean 23.5 10 Kane 30.3 6 Carroll 12.0 57Calhoun 12.7 51 Macon 14.9 34 Monroe 29.4 7 Brown 12.0 58Carroll 12.0 57 Macoupin 13.1 46 Woodford 26.3 8 Mason 11.8 59Cass 9.5 81 Madison 18.2 19 Grundy 24.1 9 Williamson 11.7 60Champaign 17.2 23 Marion 9.5 80 McLean 23.5 10 Coles 11.7 61
Christian 10.1 75 Marshall 14.0 41 Boone 23.5 11 Randolph 11.6 62Clark 11.4 63 Mason 11.8 59 Cook 23.0 12 Clark 11.4 63Clay 10.8 68 Massac 8.0 95 DeKalb 20.1 13 Edgar 11.3 64Clinton 18.1 20 Menard 19.1 15 Putnam 19.7 14 Richland 11.2 65Coles 11.7 61 Mercer 13.7 43 Menard 19.1 15 Montgomery 11.0 66Cook 23.0 12 Monroe 29.4 7 Sangamon 18.9 16 Henderson 10.9 67Crawford 12.7 50 Montgomery 11.0 66 Piatt 18.7 17 Clay 10.8 68Cumberland 10.1 76 Morgan 12.7 49 Tazewell 18.4 18 Jefferson 10.6 69DeKalb 20.1 13 Moultrie 13.4 45 Madison 18.2 19 Stephenson 10.5 70DeWitt 13.5 44 Ogle 16.1 25 Clinton 18.1 20 Jackson 10.5 71
Douglas 12.3 54 Peoria 17.9 21 Peoria 17.9 21 Hancock 10.4 72DuPage 36.4 2 Perry 8.0 96 St. Clair 17.6 22 Lawrence 10.4 73Edgar 11.3 64 Piatt 18.7 17 Champaign 17.2 23 Pulaski 10.4 74Edwards 9.2 85 Pike 9.4 82 Bond 16.6 24 Christian 10.1 75Effingham 15.1 32 Pope 7.3 98 Ogle 16.1 25 Cumberland 10.1 76Fayette 12.3 53 Pulaski 10.4 74 Stark 16.1 26 Jasper 10.1 77Ford 14.1 38 Putnam 19.7 14 Scott 16.0 27 Shelby 10.1 78Franklin 7.2 99 Randolph 11.6 62 Kankakee 15.9 28 Hamilton 10.0 79Fulton 9.0 87 Richland 11.2 65 LaSalle 15.8 29 Marion 9.5 80Gallatin 8.8 89 Rock Island 14.0 40 Jersey 15.7 30 Cass 9.5 81
Greene 7.7 97 St. Clair 17.6 22 Winnebago 15.6 31 Pike 9.4 82Grundy 24.1 9 Saline 9.1 86 Effingham 15.1 32 White 9.4 83Hamilton 10.0 79 Sangamon 18.9 16 Henry 15.0 33 Vermilion 9.3 84Hancock 10.4 72 Schuyler 6.1 100 Macon 14.9 34 Edwards 9.2 85Hardin 5.1 101 Scott 16.0 27 Lee 14.7 35 Saline 9.1 86Henderson 10.9 67 Shelby 10.1 78 Livingston 14.3 36 Fulton 9.0 87Henry 15.0 33 Stark 16.1 26 Jo Daviess 14.1 37 Warren 8.9 88Iroquois 12.8 48 Stephenson 10.5 70 Ford 14.1 38 Gallatin 8.8 89Jackson 10.5 71 Tazewell 18.4 18 Washington 14.0 39 Knox 8.8 90Jasper 10.1 77 Union 8.3 93 Rock Island 14.0 40 McDonough 8.5 91
Jefferson 10.6 69 Vermilion 9.3 84 Marshall 14.0 41 Johnson 8.5 92Jersey 15.7 30 Wabash 12.0 56 Logan 14.0 42 Union 8.3 93Jo Daviess 14.1 37 Warren 8.9 88 Mercer 13.7 43 Wayne 8.1 94Johnson 8.5 92 Washington 14.0 39 DeWitt 13.5 44 Massac 8.0 95Kane 30.3 6 Wayne 8.1 94 Moultrie 13.4 45 Perry 8.0 96Kankakee 15.9 28 White 9.4 83 Macoupin 13.1 46 Greene 7.7 97Kendall 35.2 3 Whiteside 12.4 52 Adams 12.9 47 Pope 7.3 98Knox 8.8 90 Will 33.4 4 Iroquois 12.8 48 Franklin 7.2 99Lake 37.9 1 Williamson 11.7 60 Morgan 12.7 49 Schuyler 6.1 100LaSalle 15.8 29 Winnebago 15.6 31 Crawford 12.7 50 Hardin 5.1 101Lawrence 10.4 73 Woodford 26.3 8 Calhoun 12.7 51 Alexander 3.6 102

Illinois County Data Book / 141TABLE 25: CONSTRUCTION JOBS, 2010 (as a percent of total jobs in the county)
By county In rank order
County Rank County Rank County Rank County Rank
Adams 4.9% 57 Lee 4.3% 72 Grundy 9.1% 1 Jasper 5.2% 52Alexander 2.6 97 Livingston 5.1 54 Menard 9.0 2 Union 5.1 53Bond 5.2 50 Logan 3.7 86 Clinton 8.7 3 Livingston 5.1 54Boone 6.5 25 McDonough 3.4 92 Moultrie 7.8 4 Montgomery 5.1 55Brown 6.7 19 McHenry 7.4 9 Jersey 7.8 5 Kane 5.0 56Bureau 5.2 49 McLean 3.7 88 Henry 7.6 6 Adams 4.9 57Calhoun 0.0 98 Macon 6.3 27 Clark 7.6 7 Morgan 4.9 58Carroll 5.8 36 Macoupin 7.1 14 Jo Daviess 7.4 8 Marshall 4.8 59Cass 3.9 82 Madison 6.6 22 McHenry 7.4 9 Edwards 4.8 60Champaign 3.6 89 Marion 4.6 65 Christian 7.4 10 DeKalb 4.7 61
Christian 7.4 10 Marshall 4.8 59 Schuyler 7.4 11 Mason 4.6 62Clark 7.6 7 Mason 4.6 62 Johnson 7.3 12 Jackson 4.6 63Clay 3.6 90 Massac 4.4 68 Woodford 7.3 13 LaSalle 4.6 64Clinton 8.7 3 Menard 9.0 2 Macoupin 7.1 14 Marion 4.6 65Coles 4.1 75 Mercer 5.4 47 DeWitt 7.0 15 Rock Island 4.5 66Cook 3.7 87 Monroe 6.6 21 Wabash 7.0 16 Sangamon 4.4 67Crawford 6.5 23 Montgomery 5.1 55 Iroquois 6.9 17 Massac 4.4 68Cumberland 5.2 51 Morgan 4.9 58 Perry 6.9 18 Shelby 4.4 69DeKalb 4.7 61 Moultrie 7.8 4 Brown 6.7 19 DuPage 4.4 70DeWitt 7.0 15 Ogle 5.8 38 Stephenson 6.7 20 St. Clair 4.3 71
Douglas 5.6 44 Peoria 4.2 73 Monroe 6.6 21 Lee 4.3 72DuPage 4.4 70 Perry 6.9 18 Madison 6.6 22 Peoria 4.2 73Edgar 4.0 81 Piatt 6.0 33 Crawford 6.5 23 Pulaski 4.2 74Edwards 4.8 60 Pike 6.2 29 Gallatin 6.5 24 Coles 4.1 75Effingham 5.7 40 Pope 0.0 98 Boone 6.5 25 Winnebago 4.0 76Fayette 5.7 41 Pulaski 4.2 74 Williamson 6.4 26 Kankakee 4.0 77Ford 5.8 37 Putnam 0.0 98 Macon 6.3 27 Whiteside 4.0 78Franklin 6.0 34 Randolph 4.0 79 Hancock 6.3 28 Randolph 4.0 79Fulton 5.7 43 Richland 3.1 95 Pike 6.2 29 Stark 4.0 80Gallatin 6.5 24 Rock Island 4.5 66 Will 6.2 30 Edgar 4.0 81
Greene 6.1 31 St. Clair 4.3 71 Greene 6.1 31 Cass 3.9 82Grundy 9.1 1 Saline 5.4 48 Tazewell 6.1 32 Lake 3.9 83Hamilton 5.4 46 Sangamon 4.4 67 Piatt 6.0 33 White 3.8 84Hancock 6.3 28 Schuyler 7.4 11 Franklin 6.0 34 Wayne 3.8 85Hardin 0.0 98 Scott 5.9 35 Scott 5.9 35 Logan 3.7 86Henderson 0.0 98 Shelby 4.4 69 Carroll 5.8 36 Cook 3.7 87Henry 7.6 6 Stark 4.0 80 Ford 5.8 37 McLean 3.7 88Iroquois 6.9 17 Stephenson 6.7 20 Ogle 5.8 38 Champaign 3.6 89Jackson 4.6 63 Tazewell 6.1 32 Kendall 5.8 39 Clay 3.6 90Jasper 5.2 52 Union 5.1 53 Effingham 5.7 40 Vermilion 3.6 91
Jefferson 3.3 94 Vermilion 3.6 91 Fayette 5.7 41 McDonough 3.4 92Jersey 7.8 5 Wabash 7.0 16 Lawrence 5.7 42 Knox 3.3 93Jo Daviess 7.4 8 Warren 2.9 96 Fulton 5.7 43 Jefferson 3.3 94Johnson 7.3 12 Washington 5.6 45 Douglas 5.6 44 Richland 3.1 95Kane 5.0 56 Wayne 3.8 85 Washington 5.6 45 Warren 2.9 96Kankakee 4.0 77 White 3.8 84 Hamilton 5.4 46 Alexander 2.6 97Kendall 5.8 39 Whiteside 4.0 78 Mercer 5.4 47 Calhoun 0.0 98Knox 3.3 93 Will 6.2 30 Saline 5.4 48 Hardin 0.0 98Lake 3.9 83 Williamson 6.4 26 Bureau 5.2 49 Henderson 0.0 98LaSalle 4.6 64 Winnebago 4.0 76 Bond 5.2 50 Pope 0.0 98Lawrence 5.7 42 Woodford 7.3 13 Cumberland 5.2 51 Putnam 0.0 98
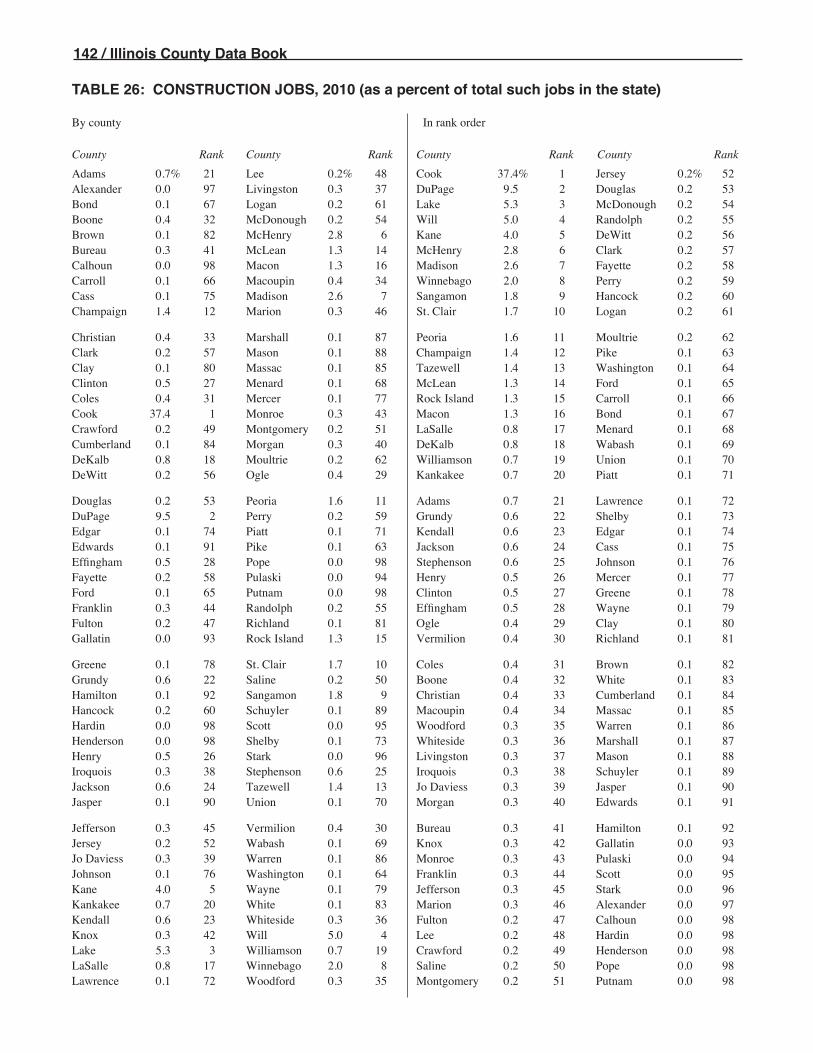
142 / Illinois County Data Book
TABLE 26: CONSTRUCTION JOBS, 2010 (as a percent of total such jobs in the state)
By county In rank order
County Rank County Rank County Rank County Rank
Adams 0.7% 21 Lee 0.2% 48 Cook 37.4% 1 Jersey 0.2% 52Alexander 0.0 97 Livingston 0.3 37 DuPage 9.5 2 Douglas 0.2 53Bond 0.1 67 Logan 0.2 61 Lake 5.3 3 McDonough 0.2 54Boone 0.4 32 McDonough 0.2 54 Will 5.0 4 Randolph 0.2 55Brown 0.1 82 McHenry 2.8 6 Kane 4.0 5 DeWitt 0.2 56Bureau 0.3 41 McLean 1.3 14 McHenry 2.8 6 Clark 0.2 57Calhoun 0.0 98 Macon 1.3 16 Madison 2.6 7 Fayette 0.2 58Carroll 0.1 66 Macoupin 0.4 34 Winnebago 2.0 8 Perry 0.2 59Cass 0.1 75 Madison 2.6 7 Sangamon 1.8 9 Hancock 0.2 60Champaign 1.4 12 Marion 0.3 46 St. Clair 1.7 10 Logan 0.2 61
Christian 0.4 33 Marshall 0.1 87 Peoria 1.6 11 Moultrie 0.2 62Clark 0.2 57 Mason 0.1 88 Champaign 1.4 12 Pike 0.1 63Clay 0.1 80 Massac 0.1 85 Tazewell 1.4 13 Washington 0.1 64Clinton 0.5 27 Menard 0.1 68 McLean 1.3 14 Ford 0.1 65Coles 0.4 31 Mercer 0.1 77 Rock Island 1.3 15 Carroll 0.1 66Cook 37.4 1 Monroe 0.3 43 Macon 1.3 16 Bond 0.1 67Crawford 0.2 49 Montgomery 0.2 51 LaSalle 0.8 17 Menard 0.1 68Cumberland 0.1 84 Morgan 0.3 40 DeKalb 0.8 18 Wabash 0.1 69DeKalb 0.8 18 Moultrie 0.2 62 Williamson 0.7 19 Union 0.1 70DeWitt 0.2 56 Ogle 0.4 29 Kankakee 0.7 20 Piatt 0.1 71
Douglas 0.2 53 Peoria 1.6 11 Adams 0.7 21 Lawrence 0.1 72DuPage 9.5 2 Perry 0.2 59 Grundy 0.6 22 Shelby 0.1 73Edgar 0.1 74 Piatt 0.1 71 Kendall 0.6 23 Edgar 0.1 74Edwards 0.1 91 Pike 0.1 63 Jackson 0.6 24 Cass 0.1 75Effingham 0.5 28 Pope 0.0 98 Stephenson 0.6 25 Johnson 0.1 76Fayette 0.2 58 Pulaski 0.0 94 Henry 0.5 26 Mercer 0.1 77Ford 0.1 65 Putnam 0.0 98 Clinton 0.5 27 Greene 0.1 78Franklin 0.3 44 Randolph 0.2 55 Effingham 0.5 28 Wayne 0.1 79Fulton 0.2 47 Richland 0.1 81 Ogle 0.4 29 Clay 0.1 80Gallatin 0.0 93 Rock Island 1.3 15 Vermilion 0.4 30 Richland 0.1 81
Greene 0.1 78 St. Clair 1.7 10 Coles 0.4 31 Brown 0.1 82Grundy 0.6 22 Saline 0.2 50 Boone 0.4 32 White 0.1 83Hamilton 0.1 92 Sangamon 1.8 9 Christian 0.4 33 Cumberland 0.1 84Hancock 0.2 60 Schuyler 0.1 89 Macoupin 0.4 34 Massac 0.1 85Hardin 0.0 98 Scott 0.0 95 Woodford 0.3 35 Warren 0.1 86Henderson 0.0 98 Shelby 0.1 73 Whiteside 0.3 36 Marshall 0.1 87Henry 0.5 26 Stark 0.0 96 Livingston 0.3 37 Mason 0.1 88Iroquois 0.3 38 Stephenson 0.6 25 Iroquois 0.3 38 Schuyler 0.1 89Jackson 0.6 24 Tazewell 1.4 13 Jo Daviess 0.3 39 Jasper 0.1 90Jasper 0.1 90 Union 0.1 70 Morgan 0.3 40 Edwards 0.1 91
Jefferson 0.3 45 Vermilion 0.4 30 Bureau 0.3 41 Hamilton 0.1 92Jersey 0.2 52 Wabash 0.1 69 Knox 0.3 42 Gallatin 0.0 93Jo Daviess 0.3 39 Warren 0.1 86 Monroe 0.3 43 Pulaski 0.0 94Johnson 0.1 76 Washington 0.1 64 Franklin 0.3 44 Scott 0.0 95Kane 4.0 5 Wayne 0.1 79 Jefferson 0.3 45 Stark 0.0 96Kankakee 0.7 20 White 0.1 83 Marion 0.3 46 Alexander 0.0 97Kendall 0.6 23 Whiteside 0.3 36 Fulton 0.2 47 Calhoun 0.0 98Knox 0.3 42 Will 5.0 4 Lee 0.2 48 Hardin 0.0 98Lake 5.3 3 Williamson 0.7 19 Crawford 0.2 49 Henderson 0.0 98LaSalle 0.8 17 Winnebago 2.0 8 Saline 0.2 50 Pope 0.0 98Lawrence 0.1 72 Woodford 0.3 35 Montgomery 0.2 51 Putnam 0.0 98
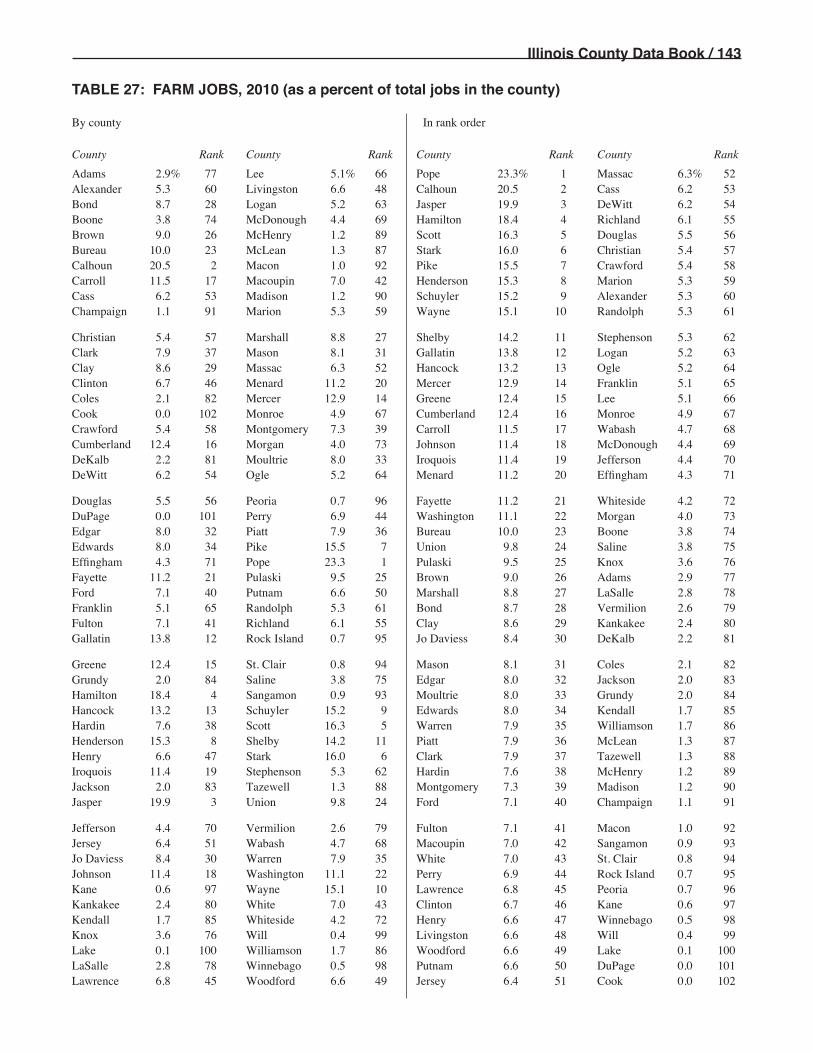
Illinois County Data Book / 143
TABLE 27: FARM JOBS, 2010 (as a percent of total jobs in the county)
By county In rank order
County Rank County Rank County Rank County Rank
Adams 2.9% 77 Lee 5.1% 66 Pope 23.3% 1 Massac 6.3% 52Alexander 5.3 60 Livingston 6.6 48 Calhoun 20.5 2 Cass 6.2 53Bond 8.7 28 Logan 5.2 63 Jasper 19.9 3 DeWitt 6.2 54Boone 3.8 74 McDonough 4.4 69 Hamilton 18.4 4 Richland 6.1 55Brown 9.0 26 McHenry 1.2 89 Scott 16.3 5 Douglas 5.5 56Bureau 10.0 23 McLean 1.3 87 Stark 16.0 6 Christian 5.4 57Calhoun 20.5 2 Macon 1.0 92 Pike 15.5 7 Crawford 5.4 58Carroll 11.5 17 Macoupin 7.0 42 Henderson 15.3 8 Marion 5.3 59Cass 6.2 53 Madison 1.2 90 Schuyler 15.2 9 Alexander 5.3 60Champaign 1.1 91 Marion 5.3 59 Wayne 15.1 10 Randolph 5.3 61
Christian 5.4 57 Marshall 8.8 27 Shelby 14.2 11 Stephenson 5.3 62Clark 7.9 37 Mason 8.1 31 Gallatin 13.8 12 Logan 5.2 63Clay 8.6 29 Massac 6.3 52 Hancock 13.2 13 Ogle 5.2 64Clinton 6.7 46 Menard 11.2 20 Mercer 12.9 14 Franklin 5.1 65Coles 2.1 82 Mercer 12.9 14 Greene 12.4 15 Lee 5.1 66Cook 0.0 102 Monroe 4.9 67 Cumberland 12.4 16 Monroe 4.9 67Crawford 5.4 58 Montgomery 7.3 39 Carroll 11.5 17 Wabash 4.7 68Cumberland 12.4 16 Morgan 4.0 73 Johnson 11.4 18 McDonough 4.4 69DeKalb 2.2 81 Moultrie 8.0 33 Iroquois 11.4 19 Jefferson 4.4 70DeWitt 6.2 54 Ogle 5.2 64 Menard 11.2 20 Effingham 4.3 71
Douglas 5.5 56 Peoria 0.7 96 Fayette 11.2 21 Whiteside 4.2 72DuPage 0.0 101 Perry 6.9 44 Washington 11.1 22 Morgan 4.0 73Edgar 8.0 32 Piatt 7.9 36 Bureau 10.0 23 Boone 3.8 74Edwards 8.0 34 Pike 15.5 7 Union 9.8 24 Saline 3.8 75Effingham 4.3 71 Pope 23.3 1 Pulaski 9.5 25 Knox 3.6 76Fayette 11.2 21 Pulaski 9.5 25 Brown 9.0 26 Adams 2.9 77Ford 7.1 40 Putnam 6.6 50 Marshall 8.8 27 LaSalle 2.8 78Franklin 5.1 65 Randolph 5.3 61 Bond 8.7 28 Vermilion 2.6 79Fulton 7.1 41 Richland 6.1 55 Clay 8.6 29 Kankakee 2.4 80Gallatin 13.8 12 Rock Island 0.7 95 Jo Daviess 8.4 30 DeKalb 2.2 81
Greene 12.4 15 St. Clair 0.8 94 Mason 8.1 31 Coles 2.1 82Grundy 2.0 84 Saline 3.8 75 Edgar 8.0 32 Jackson 2.0 83Hamilton 18.4 4 Sangamon 0.9 93 Moultrie 8.0 33 Grundy 2.0 84Hancock 13.2 13 Schuyler 15.2 9 Edwards 8.0 34 Kendall 1.7 85Hardin 7.6 38 Scott 16.3 5 Warren 7.9 35 Williamson 1.7 86Henderson 15.3 8 Shelby 14.2 11 Piatt 7.9 36 McLean 1.3 87Henry 6.6 47 Stark 16.0 6 Clark 7.9 37 Tazewell 1.3 88Iroquois 11.4 19 Stephenson 5.3 62 Hardin 7.6 38 McHenry 1.2 89Jackson 2.0 83 Tazewell 1.3 88 Montgomery 7.3 39 Madison 1.2 90Jasper 19.9 3 Union 9.8 24 Ford 7.1 40 Champaign 1.1 91
Jefferson 4.4 70 Vermilion 2.6 79 Fulton 7.1 41 Macon 1.0 92Jersey 6.4 51 Wabash 4.7 68 Macoupin 7.0 42 Sangamon 0.9 93Jo Daviess 8.4 30 Warren 7.9 35 White 7.0 43 St. Clair 0.8 94Johnson 11.4 18 Washington 11.1 22 Perry 6.9 44 Rock Island 0.7 95Kane 0.6 97 Wayne 15.1 10 Lawrence 6.8 45 Peoria 0.7 96Kankakee 2.4 80 White 7.0 43 Clinton 6.7 46 Kane 0.6 97Kendall 1.7 85 Whiteside 4.2 72 Henry 6.6 47 Winnebago 0.5 98Knox 3.6 76 Will 0.4 99 Livingston 6.6 48 Will 0.4 99Lake 0.1 100 Williamson 1.7 86 Woodford 6.6 49 Lake 0.1 100LaSalle 2.8 78 Winnebago 0.5 98 Putnam 6.6 50 DuPage 0.0 101Lawrence 6.8 45 Woodford 6.6 49 Jersey 6.4 51 Cook 0.0 102

144 / Illinois County Data Book
TABLE 28: FARM JOBS, 2010 (as a percent of total such jobs in the state)
By county In rank order
County Rank County Rank County Rank County Rank
Adams 1.6% 13 Lee 1.1% 38 Bureau 2.2% 1 Logan 0.9% 52Alexander 0.2 101 Livingston 1.6 12 Iroquois 2.0 2 Warren 0.9 52Bond 0.8 61 Logan 0.9 52 LaSalle 1.9 3 Clay 0.9 54Boone 0.9 48 McDonough 1.0 44 Madison 1.9 4 Edgar 0.9 55Brown 0.5 90 McHenry 1.9 5 McHenry 1.9 5 Coles 0.8 56Bureau 2.2 1 McLean 1.8 7 Kane 1.8 6 Macon 0.8 57Calhoun 0.5 89 Macon 0.8 57 McLean 1.8 7 Monroe 0.8 58Carroll 1.0 42 Macoupin 1.5 17 Henry 1.8 8 Rock Island 0.8 59Cass 0.6 75 Madison 1.9 4 Stephenson 1.7 9 Douglas 0.8 60Champaign 1.7 10 Marion 1.2 36 Champaign 1.7 10 Bond 0.8 61
Christian 1.1 37 Marshall 0.6 83 Kankakee 1.6 11 Cumberland 0.8 61Clark 0.7 68 Mason 0.6 85 Livingston 1.6 12 Hamilton 0.8 63Clay 0.9 54 Massac 0.5 91 Adams 1.6 13 Greene 0.8 64Clinton 1.5 15 Menard 0.6 82 Ogle 1.6 14 Kendall 0.7 65Coles 0.8 56 Mercer 0.9 50 Clinton 1.5 15 Crawford 0.7 66Cook 0.6 84 Monroe 0.8 58 Wayne 1.5 16 Williamson 0.7 67Crawford 0.7 66 Montgomery 1.2 30 Macoupin 1.5 17 Clark 0.7 68Cumberland 0.8 61 Morgan 1.0 46 DeKalb 1.5 18 Lake 0.7 69DeKalb 1.5 18 Moultrie 0.6 77 Sangamon 1.4 19 Richland 0.7 70DeWitt 0.6 79 Ogle 1.6 14 Whiteside 1.4 20 Jersey 0.7 71
Douglas 0.8 60 Peoria 1.0 41 Shelby 1.4 21 Perry 0.7 72DuPage 0.3 98 Perry 0.7 72 Pike 1.4 22 Ford 0.7 73Edgar 0.9 55 Piatt 0.6 81 Effingham 1.4 23 White 0.6 74Edwards 0.4 93 Pike 1.4 22 Jefferson 1.4 24 Cass 0.6 75Effingham 1.4 23 Pope 0.4 95 Fayette 1.3 25 Schuyler 0.6 76Fayette 1.3 25 Pulaski 0.3 97 Jo Daviess 1.3 26 Johnson 0.6 77Ford 0.7 73 Putnam 0.2 100 Hancock 1.3 27 Moultrie 0.6 77Franklin 0.9 49 Randolph 1.0 47 St. Clair 1.3 28 DeWitt 0.6 79Fulton 1.2 35 Richland 0.7 70 Woodford 1.3 29 Saline 0.6 80Gallatin 0.4 96 Rock Island 0.8 59 Knox 1.2 30 Piatt 0.6 81
Greene 0.8 64 St. Clair 1.3 28 Montgomery 1.2 30 Menard 0.6 82Grundy 0.5 86 Saline 0.6 80 Vermilion 1.2 32 Marshall 0.6 83Hamilton 0.8 63 Sangamon 1.4 19 Will 1.2 33 Cook 0.6 84Hancock 1.3 27 Schuyler 0.6 76 Tazewell 1.2 34 Mason 0.6 85Hardin 0.2 102 Scott 0.4 94 Fulton 1.2 35 Grundy 0.5 86Henderson 0.5 88 Shelby 1.4 21 Marion 1.2 36 Lawrence 0.5 87Henry 1.8 8 Stark 0.4 92 Christian 1.1 37 Henderson 0.5 88Iroquois 2.0 2 Stephenson 1.7 9 Lee 1.1 38 Calhoun 0.5 89Jackson 1.0 45 Tazewell 1.2 34 Jasper 1.1 39 Brown 0.5 90Jasper 1.1 39 Union 0.9 51 Washington 1.1 40 Massac 0.5 91
Jefferson 1.4 24 Vermilion 1.2 32 Peoria 1.0 41 Stark 0.4 92Jersey 0.7 71 Wabash 0.3 99 Carroll 1.0 42 Edwards 0.4 93Jo Daviess 1.3 26 Warren 0.9 52 Winnebago 1.0 43 Scott 0.4 94Johnson 0.6 77 Washington 1.1 40 McDonough 1.0 44 Pope 0.4 95Kane 1.8 6 Wayne 1.5 16 Jackson 1.0 45 Gallatin 0.4 96Kankakee 1.6 11 White 0.6 74 Morgan 1.0 46 Pulaski 0.3 97Kendall 0.7 65 Whiteside 1.4 20 Randolph 1.0 47 DuPage 0.3 98Knox 1.2 30 Will 1.2 33 Boone 0.9 48 Wabash 0.3 99Lake 0.7 69 Williamson 0.7 67 Franklin 0.9 49 Putnam 0.2 100LaSalle 1.9 3 Winnebago 1.0 43 Mercer 0.9 50 Alexander 0.2 101Lawrence 0.5 87 Woodford 1.3 29 Union 0.9 51 Hardin 0.2 102

Illinois County Data Book / 145
TABLE 29: INFORMATION, FINANCE, & REAL ESTATE JOBS, 2010 (as a percent of total jobs in the county)
By county In rank order
County Rank County Rank County Rank County Rank
Adams 10.7% 19 Lee 7.4% 75 McLean 16.7% 1 Clay 8.6% 52Alexander 7.2 78 Livingston 7.2 76 Monroe 15.3 2 LaSalle 8.5 53Bond 7.4 73 Logan 8.9 41 Stephenson 14.4 3 Ford 8.4 54Boone 9.4 28 McDonough 7.1 79 Cook 14.3 4 Jersey 8.4 55Brown 0.0 94 McHenry 8.7 46 DuPage 13.3 5 Richland 8.4 56Bureau 8.7 47 McLean 16.7 1 Lake 12.6 6 Schuyler 8.4 57Calhoun 0.0 94 Macon 7.9 65 Stark 12.3 7 Tazewell 8.3 58Carroll 11.2 13 Macoupin 9.8 23 Kane 12.1 8 Fulton 8.2 59Cass 7.9 64 Madison 9.8 24 Sangamon 11.7 9 Saline 8.0 60Champaign 9.4 31 Marion 6.9 82 Williamson 11.6 10 Marshall 8.0 61
Christian 9.0 39 Marshall 8.0 61 Clinton 11.4 11 Coles 8.0 62Clark 8.8 45 Mason 8.9 42 Lawrence 11.3 12 Woodford 8.0 63Clay 8.6 52 Massac 6.0 88 Carroll 11.2 13 Cass 7.9 64Clinton 11.4 11 Menard 9.4 29 Henry 11.1 14 Macon 7.9 65Coles 8.0 62 Mercer 10.8 17 Pike 11.0 15 Vermilion 7.7 66Cook 14.3 4 Monroe 15.3 2 Piatt 11.0 16 Effingham 7.6 67Crawford 7.5 70 Montgomery 9.5 27 Mercer 10.8 17 Douglas 7.6 68Cumberland 0.0 94 Morgan 9.1 34 Will 10.7 18 Shelby 7.5 69DeKalb 9.1 37 Moultrie 7.4 74 Adams 10.7 19 Crawford 7.5 70DeWitt 6.9 83 Ogle 9.7 25 Grundy 10.5 20 Hamilton 7.5 71
Douglas 7.6 68 Peoria 9.4 30 Iroquois 10.5 21 Jefferson 7.5 72DuPage 13.3 5 Perry 8.9 40 Edgar 10.3 22 Bond 7.4 73Edgar 10.3 22 Piatt 11.0 16 Macoupin 9.8 23 Moultrie 7.4 74Edwards 0.0 94 Pike 11.0 15 Madison 9.8 24 Lee 7.4 75Effingham 7.6 67 Pope 0.0 94 Ogle 9.7 25 Livingston 7.2 76Fayette 6.7 86 Pulaski 0.5 93 Greene 9.5 26 White 7.2 77Ford 8.4 54 Putnam 1.2 92 Montgomery 9.5 27 Alexander 7.2 78Franklin 8.9 43 Randolph 5.4 90 Boone 9.4 28 McDonough 7.1 79Fulton 8.2 59 Richland 8.4 56 Menard 9.4 29 Jackson 7.0 80Gallatin 0.0 94 Rock Island 9.1 36 Peoria 9.4 30 Whiteside 6.9 81
Greene 9.5 26 St. Clair 8.6 51 Champaign 9.4 31 Marion 6.9 82Grundy 10.5 20 Saline 8.0 60 Hancock 9.3 32 DeWitt 6.9 83Hamilton 7.5 71 Sangamon 11.7 9 Winnebago 9.3 33 Union 6.9 84Hancock 9.3 32 Schuyler 8.4 57 Morgan 9.1 34 Jasper 6.8 85Hardin 0.0 94 Scott 6.3 87 Kendall 9.1 35 Fayette 6.7 86Henderson 0.0 94 Shelby 7.5 69 Rock Island 9.1 36 Scott 6.3 87Henry 11.1 14 Stark 12.3 7 DeKalb 9.1 37 Massac 6.0 88Iroquois 10.5 21 Stephenson 14.4 3 Washington 9.0 38 Wayne 5.6 89Jackson 7.0 80 Tazewell 8.3 58 Christian 9.0 39 Randolph 5.4 90Jasper 6.8 85 Union 6.9 84 Perry 8.9 40 Warren 4.2 91
Jefferson 7.5 72 Vermilion 7.7 66 Logan 8.9 41 Putnam 1.2 92Jersey 8.4 55 Wabash 8.8 44 Mason 8.9 42 Pulaski 0.5 93Jo Daviess 8.6 50 Warren 4.2 91 Franklin 8.9 43 Brown 0.0 94Johnson 0.0 94 Washington 9.0 38 Wabash 8.8 44 Calhoun 0.0 94Kane 12.1 8 Wayne 5.6 89 Clark 8.8 45 Cumberland 0.0 94Kankakee 8.7 48 White 7.2 77 McHenry 8.7 46 Edwards 0.0 94Kendall 9.1 35 Whiteside 6.9 81 Bureau 8.7 47 Gallatin 0.0 94Knox 8.6 49 Will 10.7 18 Kankakee 8.7 48 Hardin 0.0 94Lake 12.6 6 Williamson 11.6 10 Knox 8.6 49 Henderson 0.0 94LaSalle 8.5 53 Winnebago 9.3 33 Jo Daviess 8.6 50 Johnson 0.0 94Lawrence 11.3 12 Woodford 8.0 63 St. Clair 8.6 51 Pope 0.0 94

146 / Illinois County Data Book
TABLE 30: INFORMATION, FINANCE, & REAL ESTATE JOBS, 2010 (as a percent of total such jobs in the state)
By county In rank order
County Rank County Rank County Rank County Rank
Adams 0.5% 20 Lee 0.1% 45 Cook 51.2% 1 Saline 0.1% 52Alexander 0.0 90 Livingston 0.2 42 DuPage 10.3 2 Edgar 0.1 53Bond 0.1 74 Logan 0.1 49 Lake 6.1 3 Douglas 0.1 54Boone 0.2 36 McDonough 0.1 46 Kane 3.5 4 Crawford 0.1 55Brown 0.0 94 McHenry 1.2 13 Will 3.1 5 Carroll 0.1 56Bureau 0.2 39 McLean 2.1 6 McLean 2.1 6 Pike 0.1 57Calhoun 0.0 94 Macon 0.6 16 Sangamon 1.7 7 Randolph 0.1 58Carroll 0.1 56 Macoupin 0.2 38 Winnebago 1.7 8 Richland 0.1 59Cass 0.1 67 Madison 1.4 9 Madison 1.4 9 Hancock 0.1 60Champaign 1.3 10 Marion 0.1 48 Champaign 1.3 10 Lawrence 0.1 61
Christian 0.2 41 Marshall 0.0 82 Peoria 1.3 11 Jersey 0.1 62Clark 0.1 69 Mason 0.1 77 St. Clair 1.2 12 Clay 0.1 63Clay 0.1 63 Massac 0.0 85 McHenry 1.2 13 Perry 0.1 64Clinton 0.2 31 Menard 0.0 83 Rock Island 0.9 14 Washington 0.1 65Coles 0.3 26 Mercer 0.1 71 Tazewell 0.7 15 Piatt 0.1 66Cook 51.2 1 Monroe 0.2 32 Macon 0.6 16 Cass 0.1 67Crawford 0.1 55 Montgomery 0.1 43 DeKalb 0.5 17 Fayette 0.1 68Cumberland 0.0 94 Morgan 0.2 37 LaSalle 0.5 18 Clark 0.1 69DeKalb 0.5 17 Moultrie 0.1 80 Kankakee 0.5 19 Ford 0.1 70DeWitt 0.1 73 Ogle 0.3 29 Adams 0.5 20 Mercer 0.1 71
Douglas 0.1 54 Peoria 1.3 11 Williamson 0.4 21 Shelby 0.1 72DuPage 10.3 2 Perry 0.1 64 Stephenson 0.4 22 DeWitt 0.1 73Edgar 0.1 53 Piatt 0.1 66 Kendall 0.3 23 Bond 0.1 74Edwards 0.0 94 Pike 0.1 57 Vermilion 0.3 24 White 0.1 75Effingham 0.2 33 Pope 0.0 94 Jackson 0.3 25 Union 0.1 76Fayette 0.1 68 Pulaski 0.0 93 Coles 0.3 26 Mason 0.1 77Ford 0.1 70 Putnam 0.0 92 Henry 0.3 27 Greene 0.1 78Franklin 0.1 44 Randolph 0.1 58 Knox 0.3 28 Wabash 0.1 78Fulton 0.1 51 Richland 0.1 59 Ogle 0.3 29 Moultrie 0.1 80Gallatin 0.0 94 Rock Island 0.9 14 Grundy 0.3 30 Wayne 0.0 81
Greene 0.1 78 St. Clair 1.2 12 Clinton 0.2 31 Marshall 0.0 82Grundy 0.3 30 Saline 0.1 52 Monroe 0.2 32 Menard 0.0 83Hamilton 0.0 89 Sangamon 1.7 7 Effingham 0.2 33 Warren 0.0 84Hancock 0.1 60 Schuyler 0.0 87 Whiteside 0.2 34 Massac 0.0 85Hardin 0.0 94 Scott 0.0 91 Jefferson 0.2 35 Jasper 0.0 86Henderson 0.0 94 Shelby 0.1 72 Boone 0.2 36 Schuyler 0.0 87Henry 0.3 27 Stark 0.0 88 Morgan 0.2 37 Stark 0.0 88Iroquois 0.2 40 Stephenson 0.4 22 Macoupin 0.2 38 Hamilton 0.0 89Jackson 0.3 25 Tazewell 0.7 15 Bureau 0.2 39 Alexander 0.0 90Jasper 0.0 86 Union 0.1 76 Iroquois 0.2 40 Scott 0.0 91
Jefferson 0.2 35 Vermilion 0.3 24 Christian 0.2 41 Putnam 0.0 92Jersey 0.1 62 Wabash 0.1 78 Livingston 0.2 42 Pulaski 0.0 93Jo Daviess 0.1 50 Warren 0.0 84 Montgomery 0.1 43 Brown 0.0 94Johnson 0.0 94 Washington 0.1 65 Franklin 0.1 44 Calhoun 0.0 94Kane 3.5 4 Wayne 0.0 81 Lee 0.1 45 Cumberland 0.0 94Kankakee 0.5 19 White 0.1 75 McDonough 0.1 46 Edwards 0.0 94Kendall 0.3 23 Whiteside 0.2 34 Woodford 0.1 47 Gallatin 0.0 94Knox 0.3 28 Will 3.1 5 Marion 0.1 48 Hardin 0.0 94Lake 6.1 3 Williamson 0.4 21 Logan 0.1 49 Henderson 0.0 94LaSalle 0.5 18 Winnebago 1.7 8 Jo Daviess 0.1 50 Johnson 0.0 94Lawrence 0.1 61 Woodford 0.1 47 Fulton 0.1 51 Pope 0.0 94

Illinois County Data Book / 147
TABLE 31: GOVERNMENT (FEDERAL, STATE, & LOCAL) JOBS, 2010 (as a percent of total jobs in the county)
By county In rank order
County Rank County Rank County Rank County Rank
Adams 11.4% 88 Lee 13.8% 61 Jackson 36.1% 1 McLean 14.1% 52Alexander 21.6 8 Livingston 14.8 45 McDonough 33.8 2 Montgomery 14.1 53Bond 15.3 42 Logan 16.5 31 Pulaski 31.0 3 Will 14.0 54Boone 12.0 80 McDonough 33.8 2 Champaign 30.0 4 Bureau 14.0 55Brown 12.0 81 McHenry 13.0 68 DeKalb 26.4 5 Marion 14.0 56Bureau 14.0 55 McLean 14.1 52 Mason 23.1 6 Clinton 13.9 57Calhoun 13.6 63 Macon 10.2 95 Pope 22.6 7 Wayne 13.9 58Carroll 12.9 72 Macoupin 15.9 38 Alexander 21.6 8 Lake 13.8 59Cass 12.4 77 Madison 13.8 60 Sangamon 21.5 9 Madison 13.8 60Champaign 30.0 4 Marion 14.0 56 Mercer 21.2 10 Lee 13.8 61
Christian 11.8 86 Marshall 11.5 87 Coles 21.2 11 Knox 13.7 62Clark 13.2 65 Mason 23.1 6 Randolph 20.9 12 Calhoun 13.6 63Clay 12.4 76 Massac 17.4 24 Union 20.4 13 Ogle 13.4 64Clinton 13.9 57 Menard 19.4 20 Wabash 20.2 14 Clark 13.2 65Coles 21.2 11 Mercer 21.2 10 St. Clair 20.1 15 Ford 13.1 66Cook 10.7 92 Monroe 12.0 79 Johnson 19.9 16 Woodford 13.0 67Crawford 18.8 21 Montgomery 14.1 53 Fulton 19.8 17 McHenry 13.0 68Cumberland 10.7 93 Morgan 13.0 70 Scott 19.7 18 Shelby 13.0 69DeKalb 26.4 5 Moultrie 10.7 94 Hamilton 19.4 19 Morgan 13.0 70DeWitt 14.5 50 Ogle 13.4 64 Menard 19.4 20 Washington 12.9 71
Douglas 9.7 98 Peoria 9.6 99 Crawford 18.8 21 Carroll 12.9 72DuPage 7.6 102 Perry 16.9 25 Schuyler 18.8 22 LaSalle 12.6 73Edgar 14.5 48 Piatt 17.5 23 Piatt 17.5 23 Kankakee 12.5 74Edwards 8.2 100 Pike 15.1 43 Massac 17.4 24 White 12.4 75Effingham 7.9 101 Pope 22.6 7 Perry 16.9 25 Clay 12.4 76Fayette 15.0 44 Pulaski 31.0 3 Henry 16.9 26 Cass 12.4 77Ford 13.1 66 Putnam 14.5 49 Rock Island 16.8 27 Kane 12.2 78Franklin 15.8 40 Randolph 20.9 12 Williamson 16.7 28 Monroe 12.0 79Fulton 19.8 17 Richland 11.9 84 Hancock 16.7 29 Boone 12.0 80Gallatin 14.3 51 Rock Island 16.8 27 Vermilion 16.6 30 Brown 12.0 81
Greene 16.1 34 St. Clair 20.1 15 Logan 16.5 31 Grundy 12.0 82Grundy 12.0 82 Saline 16.4 33 Whiteside 16.4 32 Jefferson 12.0 83Hamilton 19.4 19 Sangamon 21.5 9 Saline 16.4 33 Richland 11.9 84Hancock 16.7 29 Schuyler 18.8 22 Greene 16.1 34 Stephenson 11.8 85Hardin 14.8 46 Scott 19.7 18 Lawrence 16.1 35 Christian 11.8 86Henderson 15.9 37 Shelby 13.0 69 Stark 16.0 36 Marshall 11.5 87Henry 16.9 26 Stark 16.0 36 Henderson 15.9 37 Adams 11.4 88Iroquois 11.3 89 Stephenson 11.8 85 Macoupin 15.9 38 Iroquois 11.3 89Jackson 36.1 1 Tazewell 10.8 91 Jasper 15.8 39 Jo Daviess 11.1 90Jasper 15.8 39 Union 20.4 13 Franklin 15.8 40 Tazewell 10.8 91
Jefferson 12.0 83 Vermilion 16.6 30 Kendall 15.5 41 Cook 10.7 92Jersey 14.7 47 Wabash 20.2 14 Bond 15.3 42 Cumberland 10.7 93Jo Daviess 11.1 90 Warren 10.1 96 Pike 15.1 43 Moultrie 10.7 94Johnson 19.9 16 Washington 12.9 71 Fayette 15.0 44 Macon 10.2 95Kane 12.2 78 Wayne 13.9 58 Livingston 14.8 45 Warren 10.1 96Kankakee 12.5 74 White 12.4 75 Hardin 14.8 46 Winnebago 9.9 97Kendall 15.5 41 Whiteside 16.4 32 Jersey 14.7 47 Douglas 9.7 98Knox 13.7 62 Will 14.0 54 Edgar 14.5 48 Peoria 9.6 99Lake 13.8 59 Williamson 16.7 28 Putnam 14.5 49 Edwards 8.2 100LaSalle 12.6 73 Winnebago 9.9 97 DeWitt 14.5 50 Effingham 7.9 101Lawrence 16.1 35 Woodford 13.0 67 Gallatin 14.3 51 DuPage 7.6 102

148 / Illinois County Data Book
TABLE 32: GOVERNMENT (FEDERAL, STATE, & LOCAL) JOBS, 2010 (as a percent of total such jobs in the state)
By county In rank order
County Rank County Rank County Rank County Rank
Adams 0.5% 26 Lee 0.3% 42 Cook 37.8% 1 Iroquois 0.2% 52Alexander 0.1 91 Livingston 0.3 34 Lake 6.6 2 Monroe 0.2 53Bond 0.1 64 Logan 0.2 45 DuPage 5.8 3 Union 0.2 54Boone 0.3 43 McDonough 0.7 23 Champaign 4.1 4 Fayette 0.2 55Brown 0.1 93 McHenry 1.7 10 Will 4.0 5 Jo Daviess 0.2 56Bureau 0.3 40 McLean 1.7 12 Kane 3.5 6 Hancock 0.1 57Calhoun 0.0 102 Macon 0.7 21 Sangamon 3.1 7 Perry 0.1 58Carroll 0.1 79 Macoupin 0.3 36 St. Clair 2.8 8 Mason 0.1 59Cass 0.1 73 Madison 1.9 9 Madison 1.9 9 Jersey 0.1 60Champaign 4.1 4 Marion 0.3 41 McHenry 1.7 10 Edgar 0.1 61
Christian 0.2 50 Marshall 0.1 90 Winnebago 1.7 11 Mercer 0.1 62Clark 0.1 77 Mason 0.1 59 McLean 1.7 12 DeWitt 0.1 63Clay 0.1 75 Massac 0.1 71 Rock Island 1.7 13 Bond 0.1 64Clinton 0.3 38 Menard 0.1 84 Jackson 1.5 14 Douglas 0.1 65Coles 0.7 20 Mercer 0.1 62 DeKalb 1.5 15 Wayne 0.1 66Cook 37.8 1 Monroe 0.2 53 Peoria 1.3 16 Richland 0.1 67Crawford 0.2 47 Montgomery 0.2 51 Tazewell 0.9 17 Pike 0.1 68Cumberland 0.1 92 Morgan 0.3 39 LaSalle 0.8 18 Wabash 0.1 69DeKalb 1.5 15 Moultrie 0.1 87 Kankakee 0.7 19 Piatt 0.1 70DeWitt 0.1 63 Ogle 0.4 30 Coles 0.7 20 Massac 0.1 71
Douglas 0.1 65 Peoria 1.3 16 Macon 0.7 21 Shelby 0.1 72DuPage 5.8 3 Perry 0.1 58 Vermilion 0.7 22 Cass 0.1 73Edgar 0.1 61 Piatt 0.1 70 McDonough 0.7 23 Lawrence 0.1 74Edwards 0.0 97 Pike 0.1 68 Williamson 0.6 24 Clay 0.1 75Effingham 0.2 48 Pope 0.0 100 Kendall 0.6 25 Washington 0.1 76Fayette 0.2 55 Pulaski 0.1 83 Adams 0.5 26 Clark 0.1 77Ford 0.1 78 Putnam 0.0 96 Whiteside 0.5 27 Ford 0.1 78Franklin 0.3 44 Randolph 0.3 32 Knox 0.4 28 Carroll 0.1 79Fulton 0.3 37 Richland 0.1 67 Henry 0.4 29 White 0.1 80Gallatin 0.0 99 Rock Island 1.7 13 Ogle 0.4 30 Warren 0.1 81
Greene 0.1 85 St. Clair 2.8 8 Stephenson 0.3 31 Johnson 0.1 82Grundy 0.3 35 Saline 0.2 46 Randolph 0.3 32 Pulaski 0.1 83Hamilton 0.1 88 Sangamon 3.1 7 Jefferson 0.3 33 Menard 0.1 84Hancock 0.1 57 Schuyler 0.1 89 Livingston 0.3 34 Greene 0.1 85Hardin 0.0 101 Scott 0.0 95 Grundy 0.3 35 Jasper 0.1 86Henderson 0.0 94 Shelby 0.1 72 Macoupin 0.3 36 Moultrie 0.1 87Henry 0.4 29 Stark 0.0 97 Fulton 0.3 37 Hamilton 0.1 88Iroquois 0.2 52 Stephenson 0.3 31 Clinton 0.3 38 Schuyler 0.1 89Jackson 1.5 14 Tazewell 0.9 17 Morgan 0.3 39 Marshall 0.1 90Jasper 0.1 86 Union 0.2 54 Bureau 0.3 40 Alexander 0.1 91
Jefferson 0.3 33 Vermilion 0.7 22 Marion 0.3 41 Cumberland 0.1 92Jersey 0.1 60 Wabash 0.1 69 Lee 0.3 42 Brown 0.1 93Jo Daviess 0.2 56 Warren 0.1 81 Boone 0.3 43 Henderson 0.0 94Johnson 0.1 82 Washington 0.1 76 Franklin 0.3 44 Scott 0.0 95Kane 3.5 6 Wayne 0.1 66 Logan 0.2 45 Putnam 0.0 96Kankakee 0.7 19 White 0.1 80 Saline 0.2 46 Edwards 0.0 97Kendall 0.6 25 Whiteside 0.5 27 Crawford 0.2 47 Stark 0.0 97Knox 0.4 28 Will 4.0 5 Effingham 0.2 48 Gallatin 0.0 99Lake 6.6 2 Williamson 0.6 24 Woodford 0.2 49 Pope 0.0 100LaSalle 0.8 18 Winnebago 1.7 11 Christian 0.2 50 Hardin 0.0 101Lawrence 0.1 74 Woodford 0.2 49 Montgomery 0.2 51 Calhoun 0.0 102
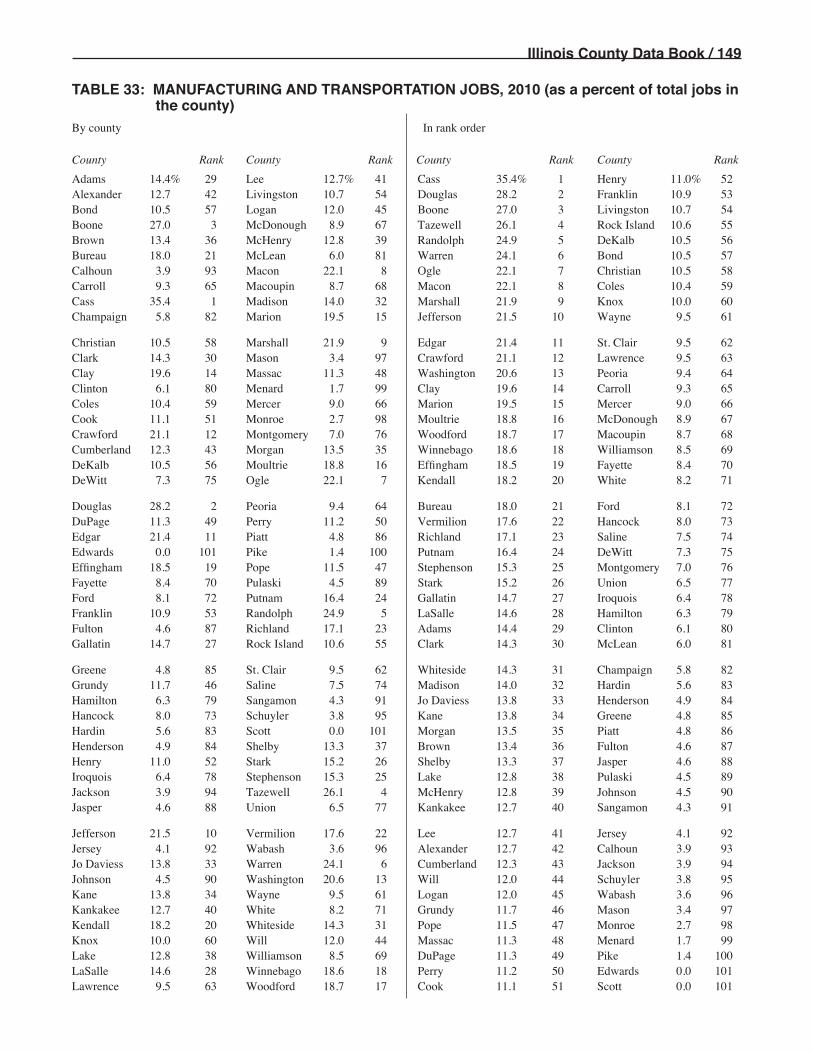
Illinois County Data Book / 149
TABLE 33: MANUFACTURING AND TRANSPORTATION JOBS, 2010 (as a percent of total jobs in the county)
By county In rank order
County Rank County Rank County Rank County Rank
Adams 14.4% 29 Lee 12.7% 41 Cass 35.4% 1 Henry 11.0% 52Alexander 12.7 42 Livingston 10.7 54 Douglas 28.2 2 Franklin 10.9 53Bond 10.5 57 Logan 12.0 45 Boone 27.0 3 Livingston 10.7 54Boone 27.0 3 McDonough 8.9 67 Tazewell 26.1 4 Rock Island 10.6 55Brown 13.4 36 McHenry 12.8 39 Randolph 24.9 5 DeKalb 10.5 56Bureau 18.0 21 McLean 6.0 81 Warren 24.1 6 Bond 10.5 57Calhoun 3.9 93 Macon 22.1 8 Ogle 22.1 7 Christian 10.5 58Carroll 9.3 65 Macoupin 8.7 68 Macon 22.1 8 Coles 10.4 59Cass 35.4 1 Madison 14.0 32 Marshall 21.9 9 Knox 10.0 60Champaign 5.8 82 Marion 19.5 15 Jefferson 21.5 10 Wayne 9.5 61
Christian 10.5 58 Marshall 21.9 9 Edgar 21.4 11 St. Clair 9.5 62Clark 14.3 30 Mason 3.4 97 Crawford 21.1 12 Lawrence 9.5 63Clay 19.6 14 Massac 11.3 48 Washington 20.6 13 Peoria 9.4 64Clinton 6.1 80 Menard 1.7 99 Clay 19.6 14 Carroll 9.3 65Coles 10.4 59 Mercer 9.0 66 Marion 19.5 15 Mercer 9.0 66Cook 11.1 51 Monroe 2.7 98 Moultrie 18.8 16 McDonough 8.9 67Crawford 21.1 12 Montgomery 7.0 76 Woodford 18.7 17 Macoupin 8.7 68Cumberland 12.3 43 Morgan 13.5 35 Winnebago 18.6 18 Williamson 8.5 69DeKalb 10.5 56 Moultrie 18.8 16 Effingham 18.5 19 Fayette 8.4 70DeWitt 7.3 75 Ogle 22.1 7 Kendall 18.2 20 White 8.2 71
Douglas 28.2 2 Peoria 9.4 64 Bureau 18.0 21 Ford 8.1 72DuPage 11.3 49 Perry 11.2 50 Vermilion 17.6 22 Hancock 8.0 73Edgar 21.4 11 Piatt 4.8 86 Richland 17.1 23 Saline 7.5 74Edwards 0.0 101 Pike 1.4 100 Putnam 16.4 24 DeWitt 7.3 75Effingham 18.5 19 Pope 11.5 47 Stephenson 15.3 25 Montgomery 7.0 76Fayette 8.4 70 Pulaski 4.5 89 Stark 15.2 26 Union 6.5 77Ford 8.1 72 Putnam 16.4 24 Gallatin 14.7 27 Iroquois 6.4 78Franklin 10.9 53 Randolph 24.9 5 LaSalle 14.6 28 Hamilton 6.3 79Fulton 4.6 87 Richland 17.1 23 Adams 14.4 29 Clinton 6.1 80Gallatin 14.7 27 Rock Island 10.6 55 Clark 14.3 30 McLean 6.0 81
Greene 4.8 85 St. Clair 9.5 62 Whiteside 14.3 31 Champaign 5.8 82Grundy 11.7 46 Saline 7.5 74 Madison 14.0 32 Hardin 5.6 83Hamilton 6.3 79 Sangamon 4.3 91 Jo Daviess 13.8 33 Henderson 4.9 84Hancock 8.0 73 Schuyler 3.8 95 Kane 13.8 34 Greene 4.8 85Hardin 5.6 83 Scott 0.0 101 Morgan 13.5 35 Piatt 4.8 86Henderson 4.9 84 Shelby 13.3 37 Brown 13.4 36 Fulton 4.6 87Henry 11.0 52 Stark 15.2 26 Shelby 13.3 37 Jasper 4.6 88Iroquois 6.4 78 Stephenson 15.3 25 Lake 12.8 38 Pulaski 4.5 89Jackson 3.9 94 Tazewell 26.1 4 McHenry 12.8 39 Johnson 4.5 90Jasper 4.6 88 Union 6.5 77 Kankakee 12.7 40 Sangamon 4.3 91
Jefferson 21.5 10 Vermilion 17.6 22 Lee 12.7 41 Jersey 4.1 92Jersey 4.1 92 Wabash 3.6 96 Alexander 12.7 42 Calhoun 3.9 93Jo Daviess 13.8 33 Warren 24.1 6 Cumberland 12.3 43 Jackson 3.9 94Johnson 4.5 90 Washington 20.6 13 Will 12.0 44 Schuyler 3.8 95Kane 13.8 34 Wayne 9.5 61 Logan 12.0 45 Wabash 3.6 96Kankakee 12.7 40 White 8.2 71 Grundy 11.7 46 Mason 3.4 97Kendall 18.2 20 Whiteside 14.3 31 Pope 11.5 47 Monroe 2.7 98Knox 10.0 60 Will 12.0 44 Massac 11.3 48 Menard 1.7 99Lake 12.8 38 Williamson 8.5 69 DuPage 11.3 49 Pike 1.4 100LaSalle 14.6 28 Winnebago 18.6 18 Perry 11.2 50 Edwards 0.0 101Lawrence 9.5 63 Woodford 18.7 17 Cook 11.1 51 Scott 0.0 101

150 / Illinois County Data Book
TABLE 34: MANUFACTURING AND TRANSPORTATION JOBS, 2010 (as a percent of total such jobs in the state)
By county In rank order
County Rank County Rank County Rank County Rank
Adams 0.7% 19 Lee 0.2% 42 Cook 40.5% 1 Richland 0.2% 52Alexander 0.0 82 Livingston 0.2 44 DuPage 8.9 2 McDonough 0.2 53Bond 0.1 66 Logan 0.2 48 Lake 6.4 3 Jackson 0.2 54Boone 0.6 25 McDonough 0.2 53 Kane 4.1 4 Macoupin 0.2 55Brown 0.1 77 McHenry 1.8 9 Will 3.5 5 Moultrie 0.1 56Bureau 0.4 33 McLean 0.8 17 Winnebago 3.4 6 Marshall 0.1 57Calhoun 0.0 99 Macon 1.6 10 Tazewell 2.2 7 Clinton 0.1 58Carroll 0.1 69 Macoupin 0.2 55 Madison 2.0 8 Shelby 0.1 59Cass 0.3 34 Madison 2.0 8 McHenry 1.8 9 Clark 0.1 60Champaign 0.8 15 Marion 0.4 30 Macon 1.6 10 Saline 0.1 61
Christian 0.2 47 Marshall 0.1 57 St. Clair 1.4 11 Montgomery 0.1 62Clark 0.1 60 Mason 0.0 92 Peoria 1.3 12 Iroquois 0.1 63Clay 0.2 49 Massac 0.1 68 Rock Island 1.1 13 Perry 0.1 64Clinton 0.1 58 Menard 0.0 100 LaSalle 0.9 14 Fayette 0.1 65Coles 0.4 31 Mercer 0.1 78 Champaign 0.8 15 Bond 0.1 66Cook 40.5 1 Monroe 0.0 81 Kankakee 0.8 16 Wayne 0.1 67Crawford 0.3 41 Montgomery 0.1 62 McLean 0.8 17 Massac 0.1 68Cumberland 0.1 71 Morgan 0.3 39 Vermilion 0.8 18 Carroll 0.1 69DeKalb 0.6 22 Moultrie 0.1 56 Adams 0.7 19 Hancock 0.1 70DeWitt 0.1 76 Ogle 0.6 24 Kendall 0.7 20 Cumberland 0.1 71
Douglas 0.4 32 Peoria 1.3 12 Sangamon 0.6 21 Fulton 0.1 72DuPage 8.9 2 Perry 0.1 64 DeKalb 0.6 22 White 0.1 73Edgar 0.2 45 Piatt 0.0 86 Jefferson 0.6 23 Lawrence 0.1 74Edwards 0.0 101 Pike 0.0 98 Ogle 0.6 24 Ford 0.1 75Effingham 0.5 26 Pope 0.0 93 Boone 0.6 25 DeWitt 0.1 76Fayette 0.1 65 Pulaski 0.0 96 Effingham 0.5 26 Brown 0.1 77Ford 0.1 75 Putnam 0.0 80 Stephenson 0.5 27 Mercer 0.1 78Franklin 0.2 51 Randolph 0.4 29 Whiteside 0.4 28 Union 0.1 79Fulton 0.1 72 Richland 0.2 52 Randolph 0.4 29 Putnam 0.0 80Gallatin 0.0 85 Rock Island 1.1 13 Marion 0.4 30 Monroe 0.0 81
Greene 0.0 87 St. Clair 1.4 11 Coles 0.4 31 Alexander 0.0 82Grundy 0.3 38 Saline 0.1 61 Douglas 0.4 32 Jersey 0.0 83Hamilton 0.0 88 Sangamon 0.6 21 Bureau 0.4 33 Stark 0.0 84Hancock 0.1 70 Schuyler 0.0 95 Cass 0.3 34 Gallatin 0.0 85Hardin 0.0 97 Scott 0.0 101 Williamson 0.3 34 Piatt 0.0 86Henderson 0.0 94 Shelby 0.1 59 Woodford 0.3 36 Greene 0.0 87Henry 0.3 40 Stark 0.0 84 Knox 0.3 37 Hamilton 0.0 88Iroquois 0.1 63 Stephenson 0.5 27 Grundy 0.3 38 Jasper 0.0 89Jackson 0.2 54 Tazewell 2.2 7 Morgan 0.3 39 Johnson 0.0 90Jasper 0.0 89 Union 0.1 79 Henry 0.3 40 Wabash 0.0 91
Jefferson 0.6 23 Vermilion 0.8 18 Crawford 0.3 41 Mason 0.0 92Jersey 0.0 83 Wabash 0.0 91 Lee 0.2 42 Pope 0.0 93Jo Daviess 0.2 46 Warren 0.2 43 Warren 0.2 43 Henderson 0.0 94Johnson 0.0 90 Washington 0.2 50 Livingston 0.2 44 Schuyler 0.0 95Kane 4.1 4 Wayne 0.1 67 Edgar 0.2 45 Pulaski 0.0 96Kankakee 0.8 16 White 0.1 73 Jo Daviess 0.2 46 Hardin 0.0 97Kendall 0.7 20 Whiteside 0.4 28 Christian 0.2 47 Pike 0.0 98Knox 0.3 37 Will 3.5 5 Logan 0.2 48 Calhoun 0.0 99Lake 6.4 3 Williamson 0.3 34 Clay 0.2 49 Menard 0.0 100LaSalle 0.9 14 Winnebago 3.4 6 Washington 0.2 50 Edwards 0.0 101Lawrence 0.1 74 Woodford 0.3 36 Franklin 0.2 51 Scott 0.0 101
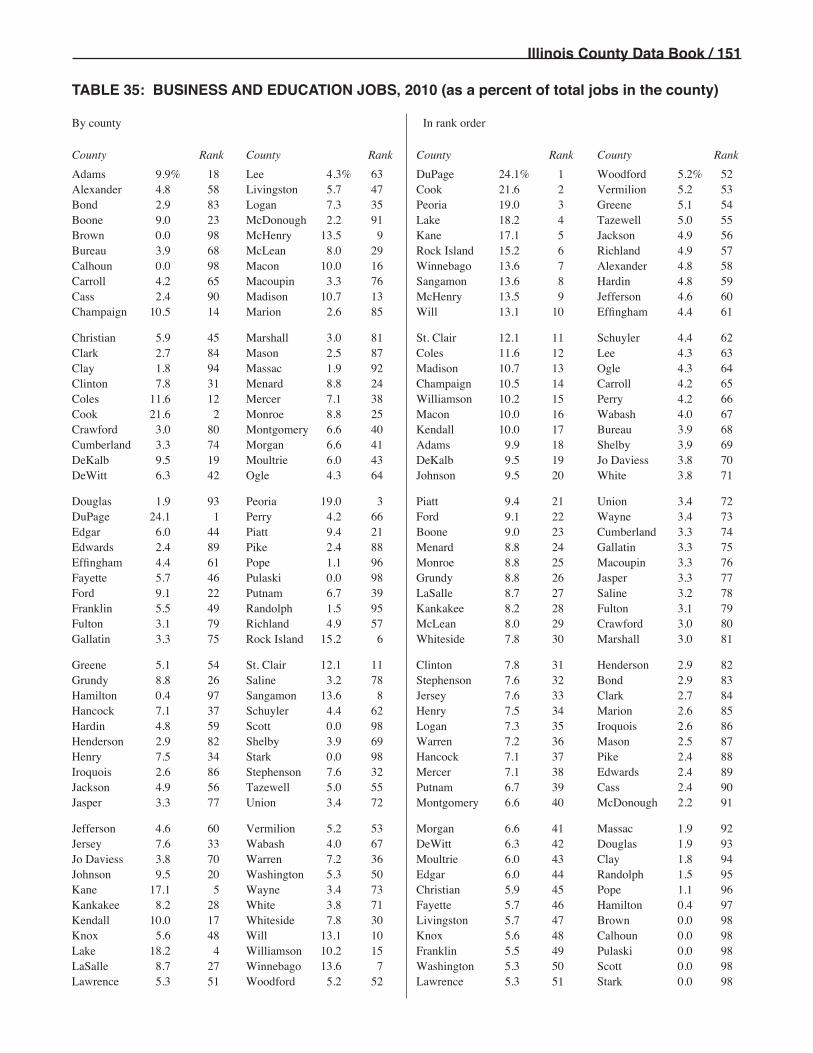
Illinois County Data Book / 151
TABLE 35: BUSINESS AND EDUCATION JOBS, 2010 (as a percent of total jobs in the county)
By county In rank order
County Rank County Rank County Rank County Rank
Adams 9.9% 18 Lee 4.3% 63 DuPage 24.1% 1 Woodford 5.2% 52Alexander 4.8 58 Livingston 5.7 47 Cook 21.6 2 Vermilion 5.2 53Bond 2.9 83 Logan 7.3 35 Peoria 19.0 3 Greene 5.1 54Boone 9.0 23 McDonough 2.2 91 Lake 18.2 4 Tazewell 5.0 55Brown 0.0 98 McHenry 13.5 9 Kane 17.1 5 Jackson 4.9 56Bureau 3.9 68 McLean 8.0 29 Rock Island 15.2 6 Richland 4.9 57Calhoun 0.0 98 Macon 10.0 16 Winnebago 13.6 7 Alexander 4.8 58Carroll 4.2 65 Macoupin 3.3 76 Sangamon 13.6 8 Hardin 4.8 59Cass 2.4 90 Madison 10.7 13 McHenry 13.5 9 Jefferson 4.6 60Champaign 10.5 14 Marion 2.6 85 Will 13.1 10 Effingham 4.4 61
Christian 5.9 45 Marshall 3.0 81 St. Clair 12.1 11 Schuyler 4.4 62Clark 2.7 84 Mason 2.5 87 Coles 11.6 12 Lee 4.3 63Clay 1.8 94 Massac 1.9 92 Madison 10.7 13 Ogle 4.3 64Clinton 7.8 31 Menard 8.8 24 Champaign 10.5 14 Carroll 4.2 65Coles 11.6 12 Mercer 7.1 38 Williamson 10.2 15 Perry 4.2 66Cook 21.6 2 Monroe 8.8 25 Macon 10.0 16 Wabash 4.0 67Crawford 3.0 80 Montgomery 6.6 40 Kendall 10.0 17 Bureau 3.9 68Cumberland 3.3 74 Morgan 6.6 41 Adams 9.9 18 Shelby 3.9 69DeKalb 9.5 19 Moultrie 6.0 43 DeKalb 9.5 19 Jo Daviess 3.8 70DeWitt 6.3 42 Ogle 4.3 64 Johnson 9.5 20 White 3.8 71
Douglas 1.9 93 Peoria 19.0 3 Piatt 9.4 21 Union 3.4 72DuPage 24.1 1 Perry 4.2 66 Ford 9.1 22 Wayne 3.4 73Edgar 6.0 44 Piatt 9.4 21 Boone 9.0 23 Cumberland 3.3 74Edwards 2.4 89 Pike 2.4 88 Menard 8.8 24 Gallatin 3.3 75Effingham 4.4 61 Pope 1.1 96 Monroe 8.8 25 Macoupin 3.3 76Fayette 5.7 46 Pulaski 0.0 98 Grundy 8.8 26 Jasper 3.3 77Ford 9.1 22 Putnam 6.7 39 LaSalle 8.7 27 Saline 3.2 78Franklin 5.5 49 Randolph 1.5 95 Kankakee 8.2 28 Fulton 3.1 79Fulton 3.1 79 Richland 4.9 57 McLean 8.0 29 Crawford 3.0 80Gallatin 3.3 75 Rock Island 15.2 6 Whiteside 7.8 30 Marshall 3.0 81
Greene 5.1 54 St. Clair 12.1 11 Clinton 7.8 31 Henderson 2.9 82Grundy 8.8 26 Saline 3.2 78 Stephenson 7.6 32 Bond 2.9 83Hamilton 0.4 97 Sangamon 13.6 8 Jersey 7.6 33 Clark 2.7 84Hancock 7.1 37 Schuyler 4.4 62 Henry 7.5 34 Marion 2.6 85Hardin 4.8 59 Scott 0.0 98 Logan 7.3 35 Iroquois 2.6 86Henderson 2.9 82 Shelby 3.9 69 Warren 7.2 36 Mason 2.5 87Henry 7.5 34 Stark 0.0 98 Hancock 7.1 37 Pike 2.4 88Iroquois 2.6 86 Stephenson 7.6 32 Mercer 7.1 38 Edwards 2.4 89Jackson 4.9 56 Tazewell 5.0 55 Putnam 6.7 39 Cass 2.4 90Jasper 3.3 77 Union 3.4 72 Montgomery 6.6 40 McDonough 2.2 91
Jefferson 4.6 60 Vermilion 5.2 53 Morgan 6.6 41 Massac 1.9 92Jersey 7.6 33 Wabash 4.0 67 DeWitt 6.3 42 Douglas 1.9 93Jo Daviess 3.8 70 Warren 7.2 36 Moultrie 6.0 43 Clay 1.8 94Johnson 9.5 20 Washington 5.3 50 Edgar 6.0 44 Randolph 1.5 95Kane 17.1 5 Wayne 3.4 73 Christian 5.9 45 Pope 1.1 96Kankakee 8.2 28 White 3.8 71 Fayette 5.7 46 Hamilton 0.4 97Kendall 10.0 17 Whiteside 7.8 30 Livingston 5.7 47 Brown 0.0 98Knox 5.6 48 Will 13.1 10 Knox 5.6 48 Calhoun 0.0 98Lake 18.2 4 Williamson 10.2 15 Franklin 5.5 49 Pulaski 0.0 98LaSalle 8.7 27 Winnebago 13.6 7 Washington 5.3 50 Scott 0.0 98Lawrence 5.3 51 Woodford 5.2 52 Lawrence 5.3 51 Stark 0.0 98

152 / Illinois County Data Book
TABLE 36: BUSINESS AND EDUCATION JOBS, 2010 (as a percent of total such jobs in the state)
By county In rank order
County Rank County Rank County Rank County Rank
Adams 0.3% 19 Lee 0.1% 44 Cook 53.9% 1 Macoupin 0.0% 51Alexander 0.0 90 Livingston 0.1 37 DuPage 13.0 2 Edgar 0.0 53Bond 0.0 78 Logan 0.1 39 Lake 6.1 3 DeWitt 0.0 54Boone 0.1 29 McDonough 0.0 63 Kane 3.4 4 Jo Daviess 0.0 55Brown 0.0 98 McHenry 1.3 9 Will 2.6 5 Marion 0.0 56Bureau 0.1 45 McLean 0.7 14 Peoria 1.8 6 Richland 0.0 57Calhoun 0.0 98 Macon 0.5 15 Winnebago 1.7 7 Fulton 0.0 58Carroll 0.0 70 Macoupin 0.0 51 Sangamon 1.4 8 Saline 0.0 59Cass 0.0 81 Madison 1.0 12 McHenry 1.3 9 Johnson 0.0 60Champaign 1.0 13 Marion 0.0 56 St. Clair 1.2 10 Washington 0.0 61
Christian 0.1 40 Marshall 0.0 85 Rock Island 1.1 11 Mercer 0.0 62Clark 0.0 80 Mason 0.0 89 Madison 1.0 12 McDonough 0.0 63Clay 0.0 86 Massac 0.0 91 Champaign 1.0 13 Moultrie 0.0 64Clinton 0.1 32 Menard 0.0 66 McLean 0.7 14 Iroquois 0.0 65Coles 0.3 21 Mercer 0.0 62 Macon 0.5 15 Menard 0.0 66Cook 53.9 1 Monroe 0.1 34 DeKalb 0.4 16 Lawrence 0.0 67Crawford 0.0 69 Montgomery 0.1 41 LaSalle 0.4 17 Perry 0.0 68Cumberland 0.0 83 Morgan 0.1 33 Kankakee 0.3 18 Crawford 0.0 69DeKalb 0.4 16 Moultrie 0.0 64 Adams 0.3 19 Carroll 0.0 70DeWitt 0.0 54 Ogle 0.1 38 Tazewell 0.3 20 Shelby 0.0 71
Douglas 0.0 76 Peoria 1.8 6 Coles 0.3 21 White 0.0 72DuPage 13.0 2 Perry 0.0 68 Williamson 0.3 22 Wayne 0.0 73Edgar 0.0 53 Piatt 0.0 49 Kendall 0.3 23 Greene 0.0 74Edwards 0.0 92 Pike 0.0 82 Whiteside 0.2 24 Union 0.0 75Effingham 0.1 36 Pope 0.0 96 Stephenson 0.2 25 Douglas 0.0 76Fayette 0.0 51 Pulaski 0.0 98 Grundy 0.2 26 Wabash 0.0 77Ford 0.1 46 Putnam 0.0 84 Vermilion 0.2 27 Bond 0.0 78Franklin 0.1 42 Randolph 0.0 78 Jackson 0.1 28 Randolph 0.0 78Fulton 0.0 58 Richland 0.0 57 Boone 0.1 29 Clark 0.0 80Gallatin 0.0 95 Rock Island 1.1 11 Henry 0.1 30 Cass 0.0 81
Greene 0.0 74 St. Clair 1.2 10 Knox 0.1 31 Pike 0.0 82Grundy 0.2 26 Saline 0.0 59 Clinton 0.1 32 Cumberland 0.0 83Hamilton 0.0 97 Sangamon 1.4 8 Morgan 0.1 33 Putnam 0.0 84Hancock 0.0 49 Schuyler 0.0 87 Monroe 0.1 34 Marshall 0.0 85Hardin 0.0 93 Scott 0.0 98 Jefferson 0.1 35 Clay 0.0 86Henderson 0.0 94 Shelby 0.0 71 Effingham 0.1 36 Schuyler 0.0 87Henry 0.1 30 Stark 0.0 98 Livingston 0.1 37 Jasper 0.0 88Iroquois 0.0 65 Stephenson 0.2 25 Ogle 0.1 38 Mason 0.0 89Jackson 0.1 28 Tazewell 0.3 20 Logan 0.1 39 Alexander 0.0 90Jasper 0.0 88 Union 0.0 75 Christian 0.1 40 Massac 0.0 91
Jefferson 0.1 35 Vermilion 0.2 27 Montgomery 0.1 41 Edwards 0.0 92Jersey 0.0 47 Wabash 0.0 77 Franklin 0.1 42 Hardin 0.0 93Jo Daviess 0.0 55 Warren 0.0 48 Woodford 0.1 43 Henderson 0.0 94Johnson 0.0 60 Washington 0.0 61 Lee 0.1 44 Gallatin 0.0 95Kane 3.4 4 Wayne 0.0 73 Bureau 0.1 45 Pope 0.0 96Kankakee 0.3 18 White 0.0 72 Ford 0.1 46 Hamilton 0.0 97Kendall 0.3 23 Whiteside 0.2 24 Jersey 0.0 47 Brown 0.0 98Knox 0.1 31 Will 2.6 5 Warren 0.0 48 Calhoun 0.0 98Lake 6.1 3 Williamson 0.3 22 Hancock 0.0 49 Pulaski 0.0 98LaSalle 0.4 17 Winnebago 1.7 7 Piatt 0.0 49 Scott 0.0 98Lawrence 0.0 67 Woodford 0.1 43 Fayette 0.0 51 Stark 0.0 98

Illinois County Data Book / 153
TABLE 37: HEALTH AND SOCIAL SERVICES JOBS, 2010 (as a percent of total jobs in the county)
By county In rank order
County Rank County Rank County Rank County Rank
Adams 13.6% 14 Lee 15.0% 7 Peoria 19.6% 1 Clark 6.7% 52Alexander 0.0 61 Livingston 10.8 25 Hardin 19.4 2 Mason 6.5 53Bond 0.0 61 Logan 10.3 33 Marion 17.6 3 Hamilton 6.0 54Boone 5.7 57 McDonough 0.0 61 Union 16.9 4 Schuyler 5.9 55Brown 0.0 61 McHenry 9.2 41 Kankakee 16.2 5 Kendall 5.7 56Bureau 0.0 61 McLean 10.3 34 Fulton 16.1 6 Boone 5.7 57Calhoun 0.0 61 Macon 12.9 17 Lee 15.0 7 Mercer 4.8 58Carroll 0.0 61 Macoupin 0.0 61 Winnebago 14.8 8 Jasper 4.5 59Cass 0.0 61 Madison 11.8 20 Williamson 14.7 9 Edwards 3.5 60Champaign 10.8 27 Marion 17.6 3 Sangamon 14.7 10 Alexander 0.0 61
Christian 13.5 15 Marshall 9.4 40 Effingham 13.9 11 Bond 0.0 61Clark 6.7 52 Mason 6.5 53 Saline 13.7 12 Brown 0.0 61Clay 0.0 61 Massac 0.0 61 Morgan 13.7 13 Bureau 0.0 61Clinton 10.8 26 Menard 0.0 61 Adams 13.6 14 Calhoun 0.0 61Coles 12.8 18 Mercer 4.8 58 Christian 13.5 15 Carroll 0.0 61Cook 11.9 19 Monroe 7.5 48 St. Clair 13.2 16 Cass 0.0 61Crawford 0.0 61 Montgomery 0.0 61 Macon 12.9 17 Clay 0.0 61Cumberland 11.7 22 Morgan 13.7 13 Coles 12.8 18 Crawford 0.0 61DeKalb 10.1 37 Moultrie 0.0 61 Cook 11.9 19 DeWitt 0.0 61DeWitt 0.0 61 Ogle 7.0 51 Madison 11.8 20 Douglas 0.0 61
Douglas 0.0 61 Peoria 19.6 1 Stephenson 11.7 21 Edgar 0.0 61DuPage 9.1 42 Perry 11.4 23 Cumberland 11.7 22 Fayette 0.0 61Edgar 0.0 61 Piatt 7.9 45 Perry 11.4 23 Ford 0.0 61Edwards 3.5 60 Pike 0.0 61 Rock Island 10.9 24 Greene 0.0 61Effingham 13.9 11 Pope 0.0 61 Livingston 10.8 25 Hancock 0.0 61Fayette 0.0 61 Pulaski 0.0 61 Clinton 10.8 26 Iroquois 0.0 61Ford 0.0 61 Putnam 0.0 61 Champaign 10.8 27 Jefferson 0.0 61Franklin 10.6 28 Randolph 0.0 61 Franklin 10.6 28 Jersey 0.0 61Fulton 16.1 6 Richland 0.0 61 LaSalle 10.5 29 Jo Daviess 0.0 61Gallatin 7.6 47 Rock Island 10.9 24 Jackson 10.5 30 Johnson 0.0 61
Greene 0.0 61 St. Clair 13.2 16 Woodford 10.5 31 Knox 0.0 61Grundy 10.2 35 Saline 13.7 12 Kane 10.5 32 Lawrence 0.0 61Hamilton 6.0 54 Sangamon 14.7 10 Logan 10.3 33 McDonough 0.0 61Hancock 0.0 61 Schuyler 5.9 55 McLean 10.3 34 Macoupin 0.0 61Hardin 19.4 2 Scott 0.0 61 Grundy 10.2 35 Massac 0.0 61Henderson 7.3 50 Shelby 9.9 38 Vermilion 10.2 36 Menard 0.0 61Henry 7.3 49 Stark 8.0 44 DeKalb 10.1 37 Montgomery 0.0 61Iroquois 0.0 61 Stephenson 11.7 21 Shelby 9.9 38 Moultrie 0.0 61Jackson 10.5 30 Tazewell 7.8 46 Will 9.9 39 Pike 0.0 61Jasper 4.5 59 Union 16.9 4 Marshall 9.4 40 Pope 0.0 61
Jefferson 0.0 61 Vermilion 10.2 36 McHenry 9.2 41 Pulaski 0.0 61Jersey 0.0 61 Wabash 0.0 61 DuPage 9.1 42 Putnam 0.0 61Jo Daviess 0.0 61 Warren 0.0 61 Lake 8.7 43 Randolph 0.0 61Johnson 0.0 61 Washington 0.0 61 Stark 8.0 44 Richland 0.0 61Kane 10.5 32 Wayne 0.0 61 Piatt 7.9 45 Scott 0.0 61Kankakee 16.2 5 White 0.0 61 Tazewell 7.8 46 Wabash 0.0 61Kendall 5.7 56 Whiteside 0.0 61 Gallatin 7.6 47 Warren 0.0 61Knox 0.0 61 Will 9.9 39 Monroe 7.5 48 Washington 0.0 61Lake 8.7 43 Williamson 14.7 9 Henry 7.3 49 Wayne 0.0 61LaSalle 10.5 29 Winnebago 14.8 8 Henderson 7.3 50 White 0.0 61Lawrence 0.0 61 Woodford 10.5 31 Ogle 7.0 51 Whiteside 0.0 61

154 / Illinois County Data Book
TABLE 38: HEALTH AND SOCIAL SERVICES JOBS, 2010 (as a percent of total such jobs in the state)
By county In rank order
County Rank County Rank County Rank County Rank
Adams 0.7% 17 Lee 0.3% 29 Cook 46.5% 1 Mason 0.0% 52Alexander 0.0 61 Livingston 0.3 33 DuPage 7.7 2 Mercer 0.0 53Bond 0.0 61 Logan 0.2 41 Lake 4.6 3 Henderson 0.0 54Boone 0.1 43 McDonough 0.0 61 Kane 3.3 4 Hamilton 0.0 55Brown 0.0 61 McHenry 1.4 13 Will 3.1 5 Jasper 0.0 56Bureau 0.0 61 McLean 1.4 12 Peoria 2.9 6 Schuyler 0.0 57Calhoun 0.0 61 Macon 1.0 16 Winnebago 2.9 7 Stark 0.0 58Carroll 0.0 61 Macoupin 0.0 61 Sangamon 2.3 8 Gallatin 0.0 59Cass 0.0 61 Madison 1.8 10 St. Clair 2.0 9 Edwards 0.0 60Champaign 1.6 11 Marion 0.4 27 Madison 1.8 10 Alexander 0.0 61
Christian 0.3 31 Marshall 0.1 48 Champaign 1.6 11 Bond 0.0 61Clark 0.1 49 Mason 0.0 52 McLean 1.4 12 Brown 0.0 61Clay 0.0 61 Massac 0.0 61 McHenry 1.4 13 Bureau 0.0 61Clinton 0.2 34 Menard 0.0 61 Rock Island 1.2 14 Calhoun 0.0 61Coles 0.5 23 Mercer 0.0 53 Kankakee 1.1 15 Carroll 0.0 61Cook 46.5 1 Monroe 0.1 44 Macon 1.0 16 Cass 0.0 61Crawford 0.0 61 Montgomery 0.0 61 Adams 0.7 17 Clay 0.0 61Cumberland 0.1 47 Morgan 0.3 28 LaSalle 0.7 18 Crawford 0.0 61DeKalb 0.6 20 Moultrie 0.0 61 Tazewell 0.7 19 DeWitt 0.0 61DeWitt 0.0 61 Ogle 0.2 37 DeKalb 0.6 20 Douglas 0.0 61
Douglas 0.0 61 Peoria 2.9 6 Williamson 0.6 21 Edgar 0.0 61DuPage 7.7 2 Perry 0.1 45 Jackson 0.5 22 Fayette 0.0 61Edgar 0.0 61 Piatt 0.1 50 Coles 0.5 23 Ford 0.0 61Edwards 0.0 60 Pike 0.0 61 Vermilion 0.5 24 Greene 0.0 61Effingham 0.4 25 Pope 0.0 61 Effingham 0.4 25 Hancock 0.0 61Fayette 0.0 61 Pulaski 0.0 61 Stephenson 0.4 26 Iroquois 0.0 61Ford 0.0 61 Putnam 0.0 61 Marion 0.4 27 Jefferson 0.0 61Franklin 0.2 40 Randolph 0.0 61 Morgan 0.3 28 Jersey 0.0 61Fulton 0.3 32 Richland 0.0 61 Lee 0.3 29 Jo Daviess 0.0 61Gallatin 0.0 59 Rock Island 1.2 14 Grundy 0.3 30 Johnson 0.0 61
Greene 0.0 61 St. Clair 2.0 9 Christian 0.3 31 Knox 0.0 61Grundy 0.3 30 Saline 0.2 36 Fulton 0.3 32 Lawrence 0.0 61Hamilton 0.0 55 Sangamon 2.3 8 Livingston 0.3 33 McDonough 0.0 61Hancock 0.0 61 Schuyler 0.0 57 Clinton 0.2 34 Macoupin 0.0 61Hardin 0.0 51 Scott 0.0 61 Kendall 0.2 35 Massac 0.0 61Henderson 0.0 54 Shelby 0.1 46 Saline 0.2 36 Menard 0.0 61Henry 0.2 39 Stark 0.0 58 Ogle 0.2 37 Montgomery 0.0 61Iroquois 0.0 61 Stephenson 0.4 26 Woodford 0.2 38 Moultrie 0.0 61Jackson 0.5 22 Tazewell 0.7 19 Henry 0.2 39 Pike 0.0 61Jasper 0.0 56 Union 0.1 42 Franklin 0.2 40 Pope 0.0 61
Jefferson 0.0 61 Vermilion 0.5 24 Logan 0.2 41 Pulaski 0.0 61Jersey 0.0 61 Wabash 0.0 61 Union 0.1 42 Putnam 0.0 61Jo Daviess 0.0 61 Warren 0.0 61 Boone 0.1 43 Randolph 0.0 61Johnson 0.0 61 Washington 0.0 61 Monroe 0.1 44 Richland 0.0 61Kane 3.3 4 Wayne 0.0 61 Perry 0.1 45 Scott 0.0 61Kankakee 1.1 15 White 0.0 61 Shelby 0.1 46 Wabash 0.0 61Kendall 0.2 35 Whiteside 0.0 61 Cumberland 0.1 47 Warren 0.0 61Knox 0.0 61 Will 3.1 5 Marshall 0.1 48 Washington 0.0 61Lake 4.6 3 Williamson 0.6 21 Clark 0.1 49 Wayne 0.0 61LaSalle 0.7 18 Winnebago 2.9 7 Piatt 0.1 50 White 0.0 61Lawrence 0.0 61 Woodford 0.2 38 Hardin 0.0 51 Whiteside 0.0 61
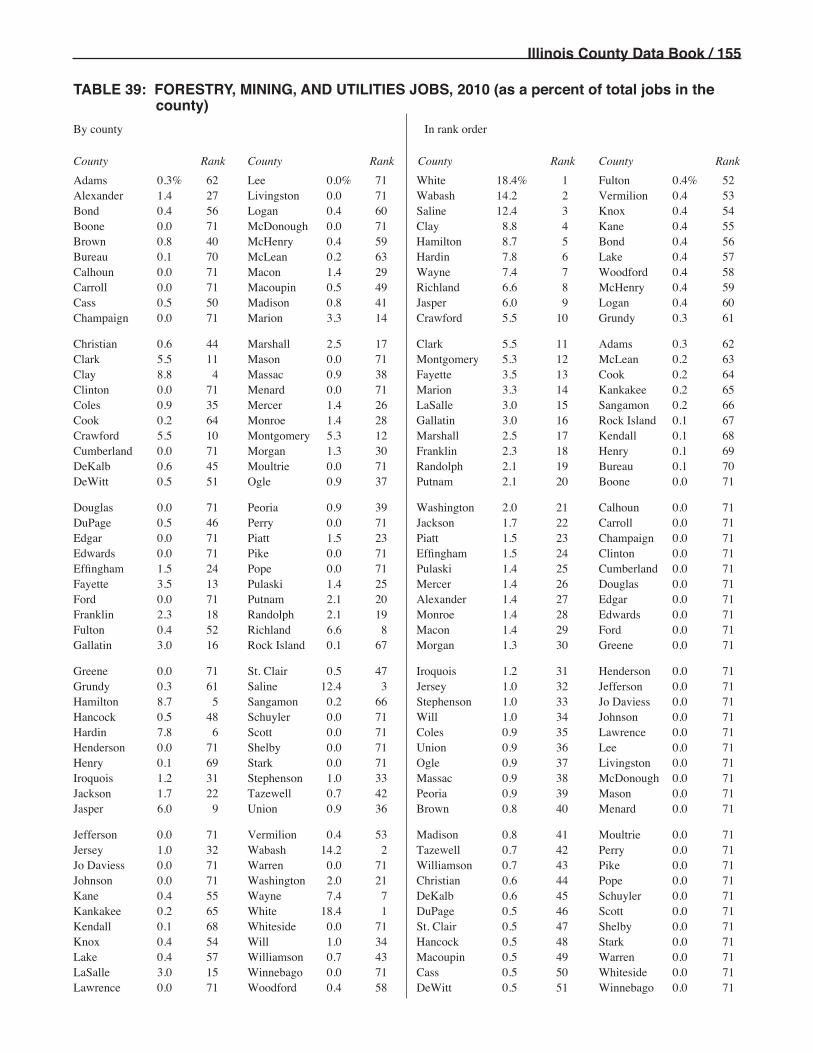
Illinois County Data Book / 155
TABLE 39: FORESTRY, MINING, AND UTILITIES JOBS, 2010 (as a percent of total jobs in the county)
By county In rank order
County Rank County Rank County Rank County Rank
Adams 0.3% 62 Lee 0.0% 71 White 18.4% 1 Fulton 0.4% 52Alexander 1.4 27 Livingston 0.0 71 Wabash 14.2 2 Vermilion 0.4 53Bond 0.4 56 Logan 0.4 60 Saline 12.4 3 Knox 0.4 54Boone 0.0 71 McDonough 0.0 71 Clay 8.8 4 Kane 0.4 55Brown 0.8 40 McHenry 0.4 59 Hamilton 8.7 5 Bond 0.4 56Bureau 0.1 70 McLean 0.2 63 Hardin 7.8 6 Lake 0.4 57Calhoun 0.0 71 Macon 1.4 29 Wayne 7.4 7 Woodford 0.4 58Carroll 0.0 71 Macoupin 0.5 49 Richland 6.6 8 McHenry 0.4 59Cass 0.5 50 Madison 0.8 41 Jasper 6.0 9 Logan 0.4 60Champaign 0.0 71 Marion 3.3 14 Crawford 5.5 10 Grundy 0.3 61
Christian 0.6 44 Marshall 2.5 17 Clark 5.5 11 Adams 0.3 62Clark 5.5 11 Mason 0.0 71 Montgomery 5.3 12 McLean 0.2 63Clay 8.8 4 Massac 0.9 38 Fayette 3.5 13 Cook 0.2 64Clinton 0.0 71 Menard 0.0 71 Marion 3.3 14 Kankakee 0.2 65Coles 0.9 35 Mercer 1.4 26 LaSalle 3.0 15 Sangamon 0.2 66Cook 0.2 64 Monroe 1.4 28 Gallatin 3.0 16 Rock Island 0.1 67Crawford 5.5 10 Montgomery 5.3 12 Marshall 2.5 17 Kendall 0.1 68Cumberland 0.0 71 Morgan 1.3 30 Franklin 2.3 18 Henry 0.1 69DeKalb 0.6 45 Moultrie 0.0 71 Randolph 2.1 19 Bureau 0.1 70DeWitt 0.5 51 Ogle 0.9 37 Putnam 2.1 20 Boone 0.0 71
Douglas 0.0 71 Peoria 0.9 39 Washington 2.0 21 Calhoun 0.0 71DuPage 0.5 46 Perry 0.0 71 Jackson 1.7 22 Carroll 0.0 71Edgar 0.0 71 Piatt 1.5 23 Piatt 1.5 23 Champaign 0.0 71Edwards 0.0 71 Pike 0.0 71 Effingham 1.5 24 Clinton 0.0 71Effingham 1.5 24 Pope 0.0 71 Pulaski 1.4 25 Cumberland 0.0 71Fayette 3.5 13 Pulaski 1.4 25 Mercer 1.4 26 Douglas 0.0 71Ford 0.0 71 Putnam 2.1 20 Alexander 1.4 27 Edgar 0.0 71Franklin 2.3 18 Randolph 2.1 19 Monroe 1.4 28 Edwards 0.0 71Fulton 0.4 52 Richland 6.6 8 Macon 1.4 29 Ford 0.0 71Gallatin 3.0 16 Rock Island 0.1 67 Morgan 1.3 30 Greene 0.0 71
Greene 0.0 71 St. Clair 0.5 47 Iroquois 1.2 31 Henderson 0.0 71Grundy 0.3 61 Saline 12.4 3 Jersey 1.0 32 Jefferson 0.0 71Hamilton 8.7 5 Sangamon 0.2 66 Stephenson 1.0 33 Jo Daviess 0.0 71Hancock 0.5 48 Schuyler 0.0 71 Will 1.0 34 Johnson 0.0 71Hardin 7.8 6 Scott 0.0 71 Coles 0.9 35 Lawrence 0.0 71Henderson 0.0 71 Shelby 0.0 71 Union 0.9 36 Lee 0.0 71Henry 0.1 69 Stark 0.0 71 Ogle 0.9 37 Livingston 0.0 71Iroquois 1.2 31 Stephenson 1.0 33 Massac 0.9 38 McDonough 0.0 71Jackson 1.7 22 Tazewell 0.7 42 Peoria 0.9 39 Mason 0.0 71Jasper 6.0 9 Union 0.9 36 Brown 0.8 40 Menard 0.0 71
Jefferson 0.0 71 Vermilion 0.4 53 Madison 0.8 41 Moultrie 0.0 71Jersey 1.0 32 Wabash 14.2 2 Tazewell 0.7 42 Perry 0.0 71Jo Daviess 0.0 71 Warren 0.0 71 Williamson 0.7 43 Pike 0.0 71Johnson 0.0 71 Washington 2.0 21 Christian 0.6 44 Pope 0.0 71Kane 0.4 55 Wayne 7.4 7 DeKalb 0.6 45 Schuyler 0.0 71Kankakee 0.2 65 White 18.4 1 DuPage 0.5 46 Scott 0.0 71Kendall 0.1 68 Whiteside 0.0 71 St. Clair 0.5 47 Shelby 0.0 71Knox 0.4 54 Will 1.0 34 Hancock 0.5 48 Stark 0.0 71Lake 0.4 57 Williamson 0.7 43 Macoupin 0.5 49 Warren 0.0 71LaSalle 3.0 15 Winnebago 0.0 71 Cass 0.5 50 Whiteside 0.0 71Lawrence 0.0 71 Woodford 0.4 58 DeWitt 0.5 51 Winnebago 0.0 71
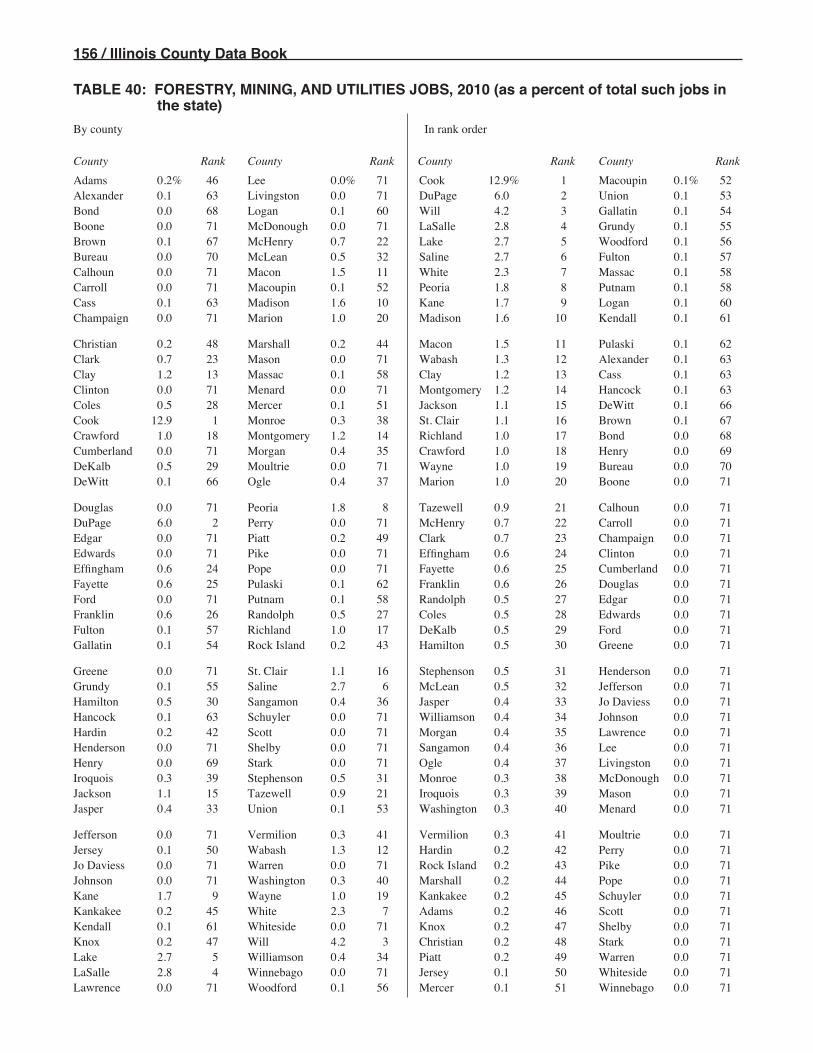
156 / Illinois County Data Book
TABLE 40: FORESTRY, MINING, AND UTILITIES JOBS, 2010 (as a percent of total such jobs in the state)
By county In rank order
County Rank County Rank County Rank County Rank
Adams 0.2% 46 Lee 0.0% 71 Cook 12.9% 1 Macoupin 0.1% 52Alexander 0.1 63 Livingston 0.0 71 DuPage 6.0 2 Union 0.1 53Bond 0.0 68 Logan 0.1 60 Will 4.2 3 Gallatin 0.1 54Boone 0.0 71 McDonough 0.0 71 LaSalle 2.8 4 Grundy 0.1 55Brown 0.1 67 McHenry 0.7 22 Lake 2.7 5 Woodford 0.1 56Bureau 0.0 70 McLean 0.5 32 Saline 2.7 6 Fulton 0.1 57Calhoun 0.0 71 Macon 1.5 11 White 2.3 7 Massac 0.1 58Carroll 0.0 71 Macoupin 0.1 52 Peoria 1.8 8 Putnam 0.1 58Cass 0.1 63 Madison 1.6 10 Kane 1.7 9 Logan 0.1 60Champaign 0.0 71 Marion 1.0 20 Madison 1.6 10 Kendall 0.1 61
Christian 0.2 48 Marshall 0.2 44 Macon 1.5 11 Pulaski 0.1 62Clark 0.7 23 Mason 0.0 71 Wabash 1.3 12 Alexander 0.1 63Clay 1.2 13 Massac 0.1 58 Clay 1.2 13 Cass 0.1 63Clinton 0.0 71 Menard 0.0 71 Montgomery 1.2 14 Hancock 0.1 63Coles 0.5 28 Mercer 0.1 51 Jackson 1.1 15 DeWitt 0.1 66Cook 12.9 1 Monroe 0.3 38 St. Clair 1.1 16 Brown 0.1 67Crawford 1.0 18 Montgomery 1.2 14 Richland 1.0 17 Bond 0.0 68Cumberland 0.0 71 Morgan 0.4 35 Crawford 1.0 18 Henry 0.0 69DeKalb 0.5 29 Moultrie 0.0 71 Wayne 1.0 19 Bureau 0.0 70DeWitt 0.1 66 Ogle 0.4 37 Marion 1.0 20 Boone 0.0 71
Douglas 0.0 71 Peoria 1.8 8 Tazewell 0.9 21 Calhoun 0.0 71DuPage 6.0 2 Perry 0.0 71 McHenry 0.7 22 Carroll 0.0 71Edgar 0.0 71 Piatt 0.2 49 Clark 0.7 23 Champaign 0.0 71Edwards 0.0 71 Pike 0.0 71 Effingham 0.6 24 Clinton 0.0 71Effingham 0.6 24 Pope 0.0 71 Fayette 0.6 25 Cumberland 0.0 71Fayette 0.6 25 Pulaski 0.1 62 Franklin 0.6 26 Douglas 0.0 71Ford 0.0 71 Putnam 0.1 58 Randolph 0.5 27 Edgar 0.0 71Franklin 0.6 26 Randolph 0.5 27 Coles 0.5 28 Edwards 0.0 71Fulton 0.1 57 Richland 1.0 17 DeKalb 0.5 29 Ford 0.0 71Gallatin 0.1 54 Rock Island 0.2 43 Hamilton 0.5 30 Greene 0.0 71
Greene 0.0 71 St. Clair 1.1 16 Stephenson 0.5 31 Henderson 0.0 71Grundy 0.1 55 Saline 2.7 6 McLean 0.5 32 Jefferson 0.0 71Hamilton 0.5 30 Sangamon 0.4 36 Jasper 0.4 33 Jo Daviess 0.0 71Hancock 0.1 63 Schuyler 0.0 71 Williamson 0.4 34 Johnson 0.0 71Hardin 0.2 42 Scott 0.0 71 Morgan 0.4 35 Lawrence 0.0 71Henderson 0.0 71 Shelby 0.0 71 Sangamon 0.4 36 Lee 0.0 71Henry 0.0 69 Stark 0.0 71 Ogle 0.4 37 Livingston 0.0 71Iroquois 0.3 39 Stephenson 0.5 31 Monroe 0.3 38 McDonough 0.0 71Jackson 1.1 15 Tazewell 0.9 21 Iroquois 0.3 39 Mason 0.0 71Jasper 0.4 33 Union 0.1 53 Washington 0.3 40 Menard 0.0 71
Jefferson 0.0 71 Vermilion 0.3 41 Vermilion 0.3 41 Moultrie 0.0 71Jersey 0.1 50 Wabash 1.3 12 Hardin 0.2 42 Perry 0.0 71Jo Daviess 0.0 71 Warren 0.0 71 Rock Island 0.2 43 Pike 0.0 71Johnson 0.0 71 Washington 0.3 40 Marshall 0.2 44 Pope 0.0 71Kane 1.7 9 Wayne 1.0 19 Kankakee 0.2 45 Schuyler 0.0 71Kankakee 0.2 45 White 2.3 7 Adams 0.2 46 Scott 0.0 71Kendall 0.1 61 Whiteside 0.0 71 Knox 0.2 47 Shelby 0.0 71Knox 0.2 47 Will 4.2 3 Christian 0.2 48 Stark 0.0 71Lake 2.7 5 Williamson 0.4 34 Piatt 0.2 49 Warren 0.0 71LaSalle 2.8 4 Winnebago 0.0 71 Jersey 0.1 50 Whiteside 0.0 71Lawrence 0.0 71 Woodford 0.1 56 Mercer 0.1 51 Winnebago 0.0 71

Illinois County Data Book / 157
TABLE 41: WHOLESALE AND RETAIL TRADE JOBS, 2010 (as a percent of total jobs in the county)
By county In rank order
County Rank County Rank County Rank County Rank
Adams 17.7% 8 Lee 18.7% 2 LaSalle 19.7% 1 Macon 13.9% 52Alexander 8.2 96 Livingston 16.4 21 Lee 18.7 2 Woodford 13.9 53Bond 13.0 63 Logan 16.8 17 DeWitt 18.6 3 Marshall 13.7 54Boone 12.3 71 McDonough 13.9 48 Effingham 18.0 4 Williamson 13.5 55Brown 4.1 102 McHenry 17.2 12 Greene 17.9 5 Randolph 13.4 56Bureau 13.1 61 McLean 12.0 78 Whiteside 17.9 6 Sangamon 13.3 57Calhoun 10.9 89 Macon 13.9 52 Will 17.8 7 Peoria 13.3 58Carroll 14.6 42 Macoupin 17.4 11 Adams 17.7 8 Clay 13.3 59Cass 8.8 95 Madison 14.6 44 DuPage 17.5 9 Moultrie 13.2 60Champaign 12.1 77 Marion 11.5 83 Montgomery 17.4 10 Bureau 13.1 61
Christian 16.0 24 Marshall 13.7 54 Macoupin 17.4 11 Edwards 13.1 62Clark 12.8 67 Mason 15.4 33 McHenry 17.2 12 Bond 13.0 63Clay 13.3 59 Massac 8.0 98 Vermilion 17.2 13 Putnam 13.0 64Clinton 14.6 43 Menard 15.5 31 Kankakee 17.0 14 Lawrence 12.9 65Coles 12.2 73 Mercer 12.1 76 Jersey 17.0 15 Shelby 12.8 66Cook 11.8 80 Monroe 13.9 50 Knox 16.9 16 Clark 12.8 67Crawford 12.6 68 Montgomery 17.4 10 Logan 16.8 17 Crawford 12.6 68Cumberland 15.1 36 Morgan 15.3 34 Scott 16.8 18 Jackson 12.5 69DeKalb 11.0 87 Moultrie 13.2 60 Lake 16.5 19 Wayne 12.3 70DeWitt 18.6 3 Ogle 11.0 86 Pike 16.4 20 Boone 12.3 71
Douglas 16.3 22 Peoria 13.3 58 Livingston 16.4 21 Wabash 12.3 72DuPage 17.5 9 Perry 11.1 85 Douglas 16.3 22 Coles 12.2 73Edgar 9.4 94 Piatt 15.0 37 Iroquois 16.2 23 Grundy 12.2 74Edwards 13.1 62 Pike 16.4 20 Christian 16.0 24 Jasper 12.2 75Effingham 18.0 4 Pope 4.5 101 Washington 16.0 25 Mercer 12.1 76Fayette 15.8 27 Pulaski 5.7 100 Fulton 15.9 26 Champaign 12.1 77Ford 15.6 29 Putnam 13.0 64 Fayette 15.8 27 McLean 12.0 78Franklin 15.5 30 Randolph 13.4 56 Henry 15.7 28 White 11.8 79Fulton 15.9 26 Richland 14.7 40 Ford 15.6 29 Cook 11.8 80Gallatin 8.1 97 Rock Island 15.1 35 Franklin 15.5 30 Schuyler 11.6 81
Greene 17.9 5 St. Clair 14.0 47 Menard 15.5 31 Stephenson 11.6 82Grundy 12.2 74 Saline 14.4 45 Henderson 15.5 32 Marion 11.5 83Hamilton 10.3 93 Sangamon 13.3 57 Mason 15.4 33 Warren 11.1 84Hancock 13.9 51 Schuyler 11.6 81 Morgan 15.3 34 Perry 11.1 85Hardin 7.8 99 Scott 16.8 18 Rock Island 15.1 35 Ogle 11.0 86Henderson 15.5 32 Shelby 12.8 66 Cumberland 15.1 36 DeKalb 11.0 87Henry 15.7 28 Stark 14.7 41 Piatt 15.0 37 Jefferson 10.9 88Iroquois 16.2 23 Stephenson 11.6 82 Kendall 14.9 38 Calhoun 10.9 89Jackson 12.5 69 Tazewell 13.9 49 Kane 14.7 39 Johnson 10.9 90Jasper 12.2 75 Union 14.0 46 Richland 14.7 40 Jo Daviess 10.9 91
Jefferson 10.9 88 Vermilion 17.2 13 Stark 14.7 41 Winnebago 10.7 92Jersey 17.0 15 Wabash 12.3 72 Carroll 14.6 42 Hamilton 10.3 93Jo Daviess 10.9 91 Warren 11.1 84 Clinton 14.6 43 Edgar 9.4 94Johnson 10.9 90 Washington 16.0 25 Madison 14.6 44 Cass 8.8 95Kane 14.7 39 Wayne 12.3 70 Saline 14.4 45 Alexander 8.2 96Kankakee 17.0 14 White 11.8 79 Union 14.0 46 Gallatin 8.1 97Kendall 14.9 38 Whiteside 17.9 6 St. Clair 14.0 47 Massac 8.0 98Knox 16.9 16 Will 17.8 7 McDonough 13.9 48 Hardin 7.8 99Lake 16.5 19 Williamson 13.5 55 Tazewell 13.9 49 Pulaski 5.7 100LaSalle 19.7 1 Winnebago 10.7 92 Monroe 13.9 50 Pope 4.5 101Lawrence 12.9 65 Woodford 13.9 53 Hancock 13.9 51 Brown 4.1 102
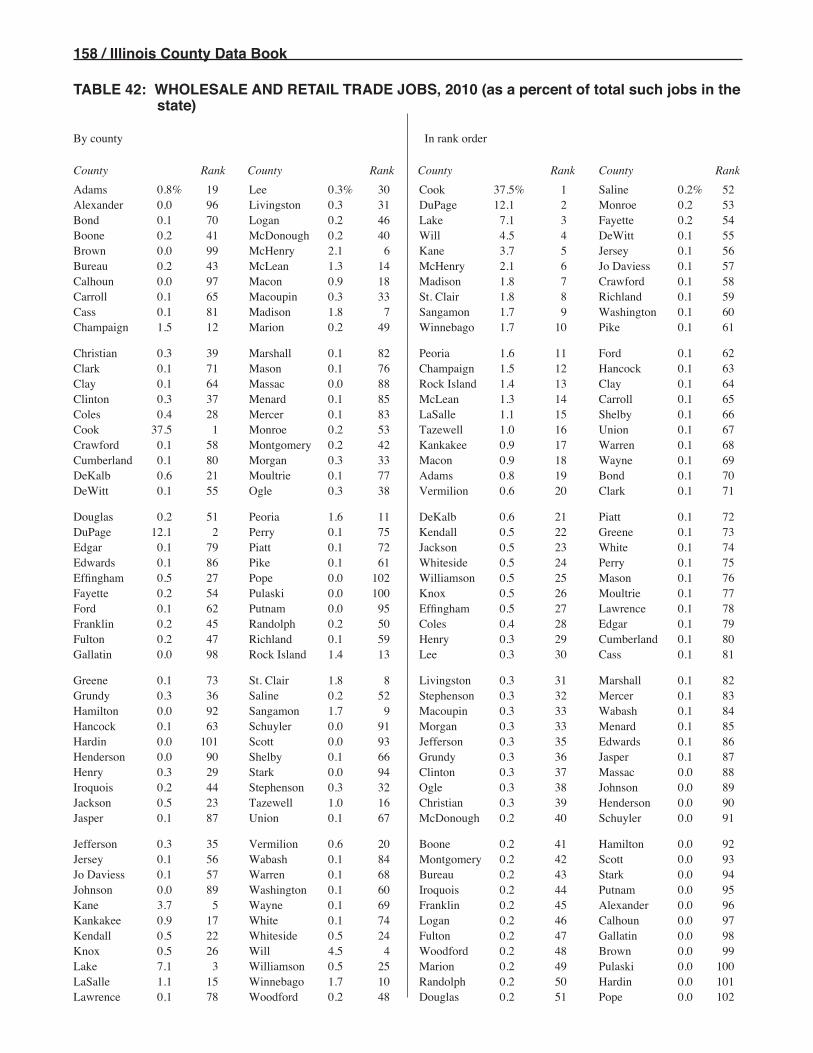
158 / Illinois County Data Book
TABLE 42: WHOLESALE AND RETAIL TRADE JOBS, 2010 (as a percent of total such jobs in the state)
By county In rank order
County Rank County Rank County Rank County Rank
Adams 0.8% 19 Lee 0.3% 30 Cook 37.5% 1 Saline 0.2% 52Alexander 0.0 96 Livingston 0.3 31 DuPage 12.1 2 Monroe 0.2 53Bond 0.1 70 Logan 0.2 46 Lake 7.1 3 Fayette 0.2 54Boone 0.2 41 McDonough 0.2 40 Will 4.5 4 DeWitt 0.1 55Brown 0.0 99 McHenry 2.1 6 Kane 3.7 5 Jersey 0.1 56Bureau 0.2 43 McLean 1.3 14 McHenry 2.1 6 Jo Daviess 0.1 57Calhoun 0.0 97 Macon 0.9 18 Madison 1.8 7 Crawford 0.1 58Carroll 0.1 65 Macoupin 0.3 33 St. Clair 1.8 8 Richland 0.1 59Cass 0.1 81 Madison 1.8 7 Sangamon 1.7 9 Washington 0.1 60Champaign 1.5 12 Marion 0.2 49 Winnebago 1.7 10 Pike 0.1 61
Christian 0.3 39 Marshall 0.1 82 Peoria 1.6 11 Ford 0.1 62Clark 0.1 71 Mason 0.1 76 Champaign 1.5 12 Hancock 0.1 63Clay 0.1 64 Massac 0.0 88 Rock Island 1.4 13 Clay 0.1 64Clinton 0.3 37 Menard 0.1 85 McLean 1.3 14 Carroll 0.1 65Coles 0.4 28 Mercer 0.1 83 LaSalle 1.1 15 Shelby 0.1 66Cook 37.5 1 Monroe 0.2 53 Tazewell 1.0 16 Union 0.1 67Crawford 0.1 58 Montgomery 0.2 42 Kankakee 0.9 17 Warren 0.1 68Cumberland 0.1 80 Morgan 0.3 33 Macon 0.9 18 Wayne 0.1 69DeKalb 0.6 21 Moultrie 0.1 77 Adams 0.8 19 Bond 0.1 70DeWitt 0.1 55 Ogle 0.3 38 Vermilion 0.6 20 Clark 0.1 71
Douglas 0.2 51 Peoria 1.6 11 DeKalb 0.6 21 Piatt 0.1 72DuPage 12.1 2 Perry 0.1 75 Kendall 0.5 22 Greene 0.1 73Edgar 0.1 79 Piatt 0.1 72 Jackson 0.5 23 White 0.1 74Edwards 0.1 86 Pike 0.1 61 Whiteside 0.5 24 Perry 0.1 75Effingham 0.5 27 Pope 0.0 102 Williamson 0.5 25 Mason 0.1 76Fayette 0.2 54 Pulaski 0.0 100 Knox 0.5 26 Moultrie 0.1 77Ford 0.1 62 Putnam 0.0 95 Effingham 0.5 27 Lawrence 0.1 78Franklin 0.2 45 Randolph 0.2 50 Coles 0.4 28 Edgar 0.1 79Fulton 0.2 47 Richland 0.1 59 Henry 0.3 29 Cumberland 0.1 80Gallatin 0.0 98 Rock Island 1.4 13 Lee 0.3 30 Cass 0.1 81
Greene 0.1 73 St. Clair 1.8 8 Livingston 0.3 31 Marshall 0.1 82Grundy 0.3 36 Saline 0.2 52 Stephenson 0.3 32 Mercer 0.1 83Hamilton 0.0 92 Sangamon 1.7 9 Macoupin 0.3 33 Wabash 0.1 84Hancock 0.1 63 Schuyler 0.0 91 Morgan 0.3 33 Menard 0.1 85Hardin 0.0 101 Scott 0.0 93 Jefferson 0.3 35 Edwards 0.1 86Henderson 0.0 90 Shelby 0.1 66 Grundy 0.3 36 Jasper 0.1 87Henry 0.3 29 Stark 0.0 94 Clinton 0.3 37 Massac 0.0 88Iroquois 0.2 44 Stephenson 0.3 32 Ogle 0.3 38 Johnson 0.0 89Jackson 0.5 23 Tazewell 1.0 16 Christian 0.3 39 Henderson 0.0 90Jasper 0.1 87 Union 0.1 67 McDonough 0.2 40 Schuyler 0.0 91
Jefferson 0.3 35 Vermilion 0.6 20 Boone 0.2 41 Hamilton 0.0 92Jersey 0.1 56 Wabash 0.1 84 Montgomery 0.2 42 Scott 0.0 93Jo Daviess 0.1 57 Warren 0.1 68 Bureau 0.2 43 Stark 0.0 94Johnson 0.0 89 Washington 0.1 60 Iroquois 0.2 44 Putnam 0.0 95Kane 3.7 5 Wayne 0.1 69 Franklin 0.2 45 Alexander 0.0 96Kankakee 0.9 17 White 0.1 74 Logan 0.2 46 Calhoun 0.0 97Kendall 0.5 22 Whiteside 0.5 24 Fulton 0.2 47 Gallatin 0.0 98Knox 0.5 26 Will 4.5 4 Woodford 0.2 48 Brown 0.0 99Lake 7.1 3 Williamson 0.5 25 Marion 0.2 49 Pulaski 0.0 100LaSalle 1.1 15 Winnebago 1.7 10 Randolph 0.2 50 Hardin 0.0 101Lawrence 0.1 78 Woodford 0.2 48 Douglas 0.2 51 Pope 0.0 102

Illinois County Data Book / 159
TABLE 43: OTHER SERVICES JOBS, 2010 (as a percent of total jobs in the county)
By county In rank order
County Rank County Rank County Rank County Rank
Adams 13.6% 40 Lee 12.2% 60 Jo Daviess 22.6% 1 Fayette 13.0% 52Alexander 9.7 82 Livingston 10.9 76 Monroe 18.8 2 Jackson 12.9 53Bond 13.2 46 Logan 15.4 10 Jersey 17.8 3 Woodford 12.9 54Boone 13.8 38 McDonough 14.0 34 Madison 16.8 4 Lake 12.7 55Brown 0.0 100 McHenry 14.5 22 St. Clair 16.7 5 DeWitt 12.6 56Bureau 11.2 74 McLean 14.6 21 Morgan 16.1 6 Stephenson 12.5 57Calhoun 8.4 84 Macon 14.3 24 Franklin 15.7 7 Coles 12.5 58Carroll 14.0 32 Macoupin 14.2 29 Fulton 15.5 8 Jefferson 12.4 59Cass 0.0 100 Madison 16.8 4 Tazewell 15.5 9 Lee 12.2 60Champaign 13.7 39 Marion 12.0 66 Logan 15.4 10 DuPage 12.2 61
Christian 13.1 49 Marshall 14.0 33 Perry 15.3 11 Saline 12.2 62Clark 14.7 18 Mason 14.3 27 Effingham 15.2 12 Greene 12.2 63Clay 8.8 83 Massac 6.9 87 Will 15.0 13 Wayne 12.1 64Clinton 13.1 48 Menard 13.6 41 Williamson 15.0 14 Douglas 12.1 65Coles 12.5 58 Mercer 13.0 50 Kendall 14.9 15 Marion 12.0 66Cook 14.7 19 Monroe 18.8 2 LaSalle 14.8 16 Hamilton 11.7 67Crawford 10.7 77 Montgomery 13.3 44 Sangamon 14.8 17 Iroquois 11.6 68Cumberland 6.5 91 Morgan 16.1 6 Clark 14.7 18 Pike 11.6 69DeKalb 13.1 47 Moultrie 14.1 31 Cook 14.7 19 Richland 11.6 70DeWitt 12.6 56 Ogle 11.3 73 Henry 14.6 20 Union 11.5 71
Douglas 12.1 65 Peoria 14.0 35 McLean 14.6 21 Ford 11.4 72DuPage 12.2 61 Perry 15.3 11 McHenry 14.5 22 Ogle 11.3 73Edgar 10.6 78 Piatt 6.4 92 White 14.5 23 Bureau 11.2 74Edwards 6.6 89 Pike 11.6 69 Macon 14.3 24 Randolph 11.0 75Effingham 15.2 12 Pope 5.7 95 Winnebago 14.3 25 Livingston 10.9 76Fayette 13.0 52 Pulaski 10.5 80 Grundy 14.3 26 Crawford 10.7 77Ford 11.4 72 Putnam 10.5 79 Mason 14.3 27 Edgar 10.6 78Franklin 15.7 7 Randolph 11.0 75 Knox 14.3 28 Putnam 10.5 79Fulton 15.5 8 Richland 11.6 70 Macoupin 14.2 29 Pulaski 10.5 80Gallatin 7.5 85 Rock Island 13.2 45 Kankakee 14.2 30 Henderson 10.1 81
Greene 12.2 63 St. Clair 16.7 5 Moultrie 14.1 31 Alexander 9.7 82Grundy 14.3 26 Saline 12.2 62 Carroll 14.0 32 Clay 8.8 83Hamilton 11.7 67 Sangamon 14.8 17 Marshall 14.0 33 Calhoun 8.4 84Hancock 6.7 88 Schuyler 5.8 94 McDonough 14.0 34 Gallatin 7.5 85Hardin 7.0 86 Scott 5.5 96 Peoria 14.0 35 Hardin 7.0 86Henderson 10.1 81 Shelby 13.0 51 Vermilion 13.8 36 Massac 6.9 87Henry 14.6 20 Stark 3.4 99 Kane 13.8 37 Hancock 6.7 88Iroquois 11.6 68 Stephenson 12.5 57 Boone 13.8 38 Edwards 6.6 89Jackson 12.9 53 Tazewell 15.5 9 Champaign 13.7 39 Jasper 6.5 90Jasper 6.5 90 Union 11.5 71 Adams 13.6 40 Cumberland 6.5 91
Jefferson 12.4 59 Vermilion 13.8 36 Menard 13.6 41 Piatt 6.4 92Jersey 17.8 3 Wabash 13.5 43 Whiteside 13.5 42 Warren 5.9 93Jo Daviess 22.6 1 Warren 5.9 93 Wabash 13.5 43 Schuyler 5.8 94Johnson 0.0 100 Washington 4.8 98 Montgomery 13.3 44 Pope 5.7 95Kane 13.8 37 Wayne 12.1 64 Rock Island 13.2 45 Scott 5.5 96Kankakee 14.2 30 White 14.5 23 Bond 13.2 46 Lawrence 5.1 97Kendall 14.9 15 Whiteside 13.5 42 DeKalb 13.1 47 Washington 4.8 98Knox 14.3 28 Will 15.0 13 Clinton 13.1 48 Stark 3.4 99Lake 12.7 55 Williamson 15.0 14 Christian 13.1 49 Brown 0.0 100LaSalle 14.8 16 Winnebago 14.3 25 Mercer 13.0 50 Cass 0.0 100Lawrence 5.1 97 Woodford 12.9 54 Shelby 13.0 51 Johnson 0.0 100

160 / Illinois County Data Book
TABLE 44: OTHER SERVICES JOBS, 2010 (as a percent of total such jobs in the state)
By county In rank order
County Rank County Rank County Rank County Rank
Adams 0.6% 20 Lee 0.2% 44 Cook 45.7% 1 Randolph 0.2% 52Alexander 0.0 91 Livingston 0.2 43 DuPage 8.3 2 Saline 0.2 53Bond 0.1 65 Logan 0.2 47 Lake 5.4 3 Jersey 0.1 54Boone 0.3 36 McDonough 0.2 38 Will 3.8 4 Douglas 0.1 55Brown 0.0 100 McHenry 1.7 10 Kane 3.4 5 Fayette 0.1 56Bureau 0.2 49 McLean 1.6 13 Winnebago 2.2 6 Perry 0.1 57Calhoun 0.0 94 Macon 0.9 16 Madison 2.1 7 Crawford 0.1 58Carroll 0.1 63 Macoupin 0.2 40 St. Clair 2.0 8 Clark 0.1 59Cass 0.0 100 Madison 2.1 7 Sangamon 1.9 9 White 0.1 59Champaign 1.7 11 Marion 0.2 44 McHenry 1.7 10 Richland 0.1 61
Christian 0.2 42 Marshall 0.1 74 Champaign 1.7 11 Shelby 0.1 62Clark 0.1 59 Mason 0.1 72 Peoria 1.7 12 Carroll 0.1 63Clay 0.1 76 Massac 0.0 81 McLean 1.6 13 DeWitt 0.1 64Clinton 0.2 39 Menard 0.1 78 Rock Island 1.2 14 Bond 0.1 65Coles 0.4 25 Mercer 0.1 73 Tazewell 1.1 15 Wayne 0.1 66Cook 45.7 1 Monroe 0.2 37 Macon 0.9 16 Edgar 0.1 67Crawford 0.1 58 Montgomery 0.2 50 LaSalle 0.8 17 Moultrie 0.1 68Cumberland 0.0 85 Morgan 0.3 33 Kankakee 0.7 18 Ford 0.1 69DeKalb 0.7 19 Moultrie 0.1 68 DeKalb 0.7 19 Pike 0.1 69DeWitt 0.1 64 Ogle 0.3 35 Adams 0.6 20 Union 0.1 71
Douglas 0.1 55 Peoria 1.7 12 Vermilion 0.5 21 Mason 0.1 72DuPage 8.3 2 Perry 0.1 57 Williamson 0.5 22 Mercer 0.1 73Edgar 0.1 67 Piatt 0.0 83 Jackson 0.5 23 Marshall 0.1 74Edwards 0.0 89 Pike 0.1 69 Kendall 0.5 24 Wabash 0.1 75Effingham 0.4 26 Pope 0.0 98 Coles 0.4 25 Clay 0.1 76Fayette 0.1 56 Pulaski 0.0 87 Effingham 0.4 26 Greene 0.1 77Ford 0.1 69 Putnam 0.0 92 Knox 0.4 27 Menard 0.1 78Franklin 0.2 41 Randolph 0.2 52 Whiteside 0.4 28 Hancock 0.1 79Fulton 0.2 46 Richland 0.1 61 Stephenson 0.3 29 Warren 0.1 80Gallatin 0.0 95 Rock Island 1.2 14 Grundy 0.3 30 Massac 0.0 81
Greene 0.1 77 St. Clair 2.0 8 Henry 0.3 31 Hamilton 0.0 82Grundy 0.3 30 Saline 0.2 53 Jefferson 0.3 32 Piatt 0.0 83Hamilton 0.0 82 Sangamon 1.9 9 Morgan 0.3 33 Washington 0.0 84Hancock 0.1 79 Schuyler 0.0 93 Jo Daviess 0.3 34 Cumberland 0.0 85Hardin 0.0 96 Scott 0.0 97 Ogle 0.3 35 Lawrence 0.0 86Henderson 0.0 90 Shelby 0.1 62 Boone 0.3 36 Pulaski 0.0 87Henry 0.3 31 Stark 0.0 99 Monroe 0.2 37 Jasper 0.0 88Iroquois 0.2 51 Stephenson 0.3 29 McDonough 0.2 38 Edwards 0.0 89Jackson 0.5 23 Tazewell 1.1 15 Clinton 0.2 39 Henderson 0.0 90Jasper 0.0 88 Union 0.1 71 Macoupin 0.2 40 Alexander 0.0 91
Jefferson 0.3 32 Vermilion 0.5 21 Franklin 0.2 41 Putnam 0.0 92Jersey 0.1 54 Wabash 0.1 75 Christian 0.2 42 Schuyler 0.0 93Jo Daviess 0.3 34 Warren 0.1 80 Livingston 0.2 43 Calhoun 0.0 94Johnson 0.0 100 Washington 0.0 84 Lee 0.2 44 Gallatin 0.0 95Kane 3.4 5 Wayne 0.1 66 Marion 0.2 44 Hardin 0.0 96Kankakee 0.7 18 White 0.1 59 Fulton 0.2 46 Scott 0.0 97Kendall 0.5 24 Whiteside 0.4 28 Logan 0.2 47 Pope 0.0 98Knox 0.4 27 Will 3.8 4 Woodford 0.2 48 Stark 0.0 99Lake 5.4 3 Williamson 0.5 22 Bureau 0.2 49 Brown 0.0 100LaSalle 0.8 17 Winnebago 2.2 6 Montgomery 0.2 50 Cass 0.0 100Lawrence 0.0 86 Woodford 0.2 48 Iroquois 0.2 51 Johnson 0.0 100

Illinois County Data Book / 161
TABLE 45: COUNTY PERCENT OF TOTAL JOBS IN THE STATE, 2010
By county In rank order
County Rank County Rank County Rank County Rank
Adams 0.6% 20 Lee 0.2% 41 Cook 44.0% 1 Saline 0.2% 52Alexander 0.0 94 Livingston 0.3 35 DuPage 9.5 2 Jo Daviess 0.2 53Bond 0.1 72 Logan 0.2 50 Lake 6.0 3 Douglas 0.2 54Boone 0.3 34 McDonough 0.2 38 Kane 3.5 4 Crawford 0.1 55Brown 0.1 88 McHenry 1.7 12 Will 3.5 5 Fayette 0.1 56Bureau 0.2 40 McLean 1.5 13 Winnebago 2.2 6 Richland 0.1 57Calhoun 0.0 99 Macon 0.9 16 Sangamon 1.8 7 Warren 0.1 58Carroll 0.1 73 Macoupin 0.2 42 St. Clair 1.7 8 Edgar 0.1 59Cass 0.1 61 Madison 1.7 9 Madison 1.7 9 Jersey 0.1 60Champaign 1.7 10 Marion 0.2 39 Champaign 1.7 10 Cass 0.1 61
Christian 0.2 43 Marshall 0.1 83 Peoria 1.7 11 Clay 0.1 62Clark 0.1 71 Mason 0.1 81 McHenry 1.7 12 Hancock 0.1 63Clay 0.1 62 Massac 0.1 79 McLean 1.5 13 Shelby 0.1 64Clinton 0.2 37 Menard 0.1 90 Rock Island 1.3 14 DeWitt 0.1 65Coles 0.4 25 Mercer 0.1 80 Tazewell 1.0 15 Wayne 0.1 66Cook 44.0 1 Monroe 0.2 51 Macon 0.9 16 Perry 0.1 67Crawford 0.1 55 Montgomery 0.2 48 LaSalle 0.8 17 Washington 0.1 68Cumberland 0.1 84 Morgan 0.3 36 Kankakee 0.7 18 White 0.1 69DeKalb 0.7 19 Moultrie 0.1 77 DeKalb 0.7 19 Ford 0.1 70DeWitt 0.1 65 Ogle 0.3 31 Adams 0.6 20 Clark 0.1 71
Douglas 0.2 54 Peoria 1.7 11 Jackson 0.5 21 Bond 0.1 72DuPage 9.5 2 Perry 0.1 67 Vermilion 0.5 22 Carroll 0.1 73Edgar 0.1 59 Piatt 0.1 78 Williamson 0.5 23 Pike 0.1 74Edwards 0.1 89 Pike 0.1 74 Kendall 0.5 24 Union 0.1 75Effingham 0.3 29 Pope 0.0 102 Coles 0.4 25 Lawrence 0.1 76Fayette 0.1 56 Pulaski 0.0 93 Whiteside 0.4 26 Moultrie 0.1 77Ford 0.1 70 Putnam 0.0 96 Knox 0.4 27 Piatt 0.1 78Franklin 0.2 45 Randolph 0.2 46 Stephenson 0.4 28 Massac 0.1 79Fulton 0.2 49 Richland 0.1 57 Effingham 0.3 29 Mercer 0.1 80Gallatin 0.0 97 Rock Island 1.3 14 Jefferson 0.3 30 Mason 0.1 81
Greene 0.1 85 St. Clair 1.7 8 Ogle 0.3 31 Wabash 0.1 82Grundy 0.3 32 Saline 0.2 52 Grundy 0.3 32 Marshall 0.1 83Hamilton 0.0 92 Sangamon 1.8 7 Henry 0.3 33 Cumberland 0.1 84Hancock 0.1 63 Schuyler 0.0 91 Boone 0.3 34 Greene 0.1 85Hardin 0.0 101 Scott 0.0 100 Livingston 0.3 35 Johnson 0.1 86Henderson 0.0 95 Shelby 0.1 64 Morgan 0.3 36 Jasper 0.1 87Henry 0.3 33 Stark 0.0 98 Clinton 0.2 37 Brown 0.1 88Iroquois 0.2 47 Stephenson 0.4 28 McDonough 0.2 38 Edwards 0.1 89Jackson 0.5 21 Tazewell 1.0 15 Marion 0.2 39 Menard 0.1 90Jasper 0.1 87 Union 0.1 75 Bureau 0.2 40 Schuyler 0.0 91
Jefferson 0.3 30 Vermilion 0.5 22 Lee 0.2 41 Hamilton 0.0 92Jersey 0.1 60 Wabash 0.1 82 Macoupin 0.2 42 Pulaski 0.0 93Jo Daviess 0.2 53 Warren 0.1 58 Christian 0.2 43 Alexander 0.0 94Johnson 0.1 86 Washington 0.1 68 Woodford 0.2 44 Henderson 0.0 95Kane 3.5 4 Wayne 0.1 66 Franklin 0.2 45 Putnam 0.0 96Kankakee 0.7 18 White 0.1 69 Randolph 0.2 46 Gallatin 0.0 97Kendall 0.5 24 Whiteside 0.4 26 Iroquois 0.2 47 Stark 0.0 98Knox 0.4 27 Will 3.5 5 Montgomery 0.2 48 Calhoun 0.0 99Lake 6.0 3 Williamson 0.5 23 Fulton 0.2 49 Scott 0.0 100LaSalle 0.8 17 Winnebago 2.2 6 Logan 0.2 50 Hardin 0.0 101Lawrence 0.1 76 Woodford 0.2 44 Monroe 0.2 51 Pope 0.0 102
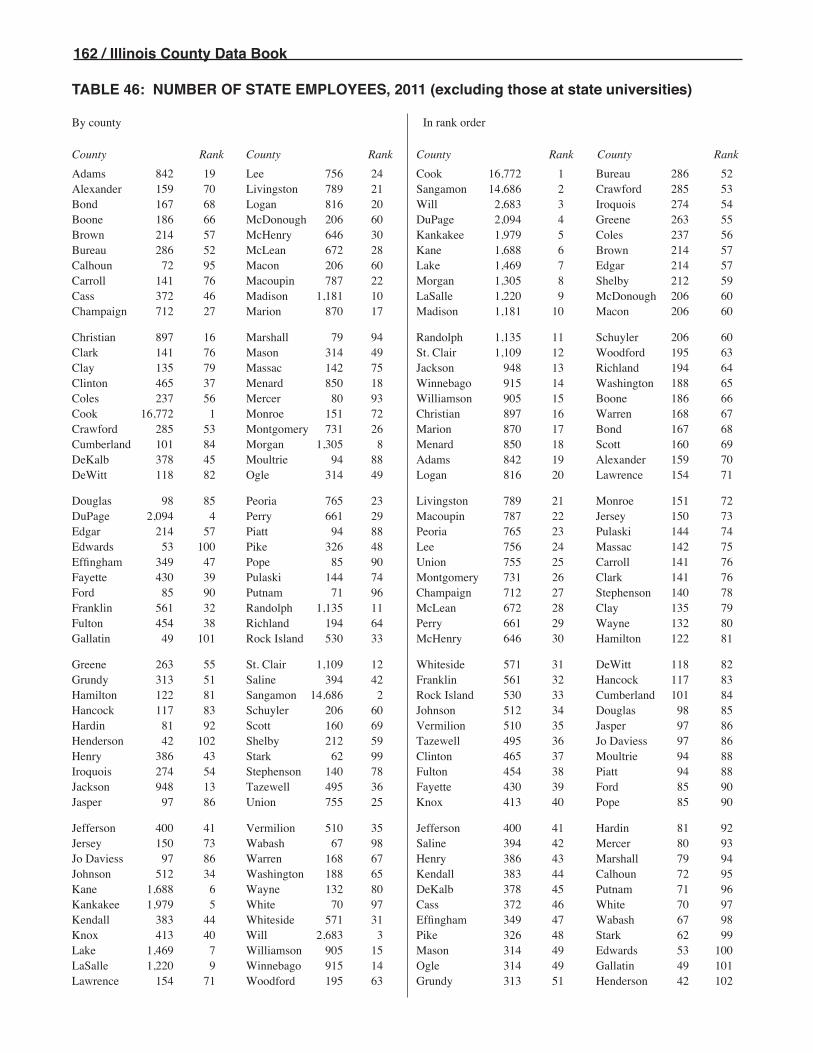
162 / Illinois County Data Book
TABLE 46: NUMBER OF STATE EMPLOYEES, 2011 (excluding those at state universities)
By county In rank order
County Rank County Rank County Rank County Rank
Adams 842 19 Lee 756 24 Cook 16,772 1 Bureau 286 52Alexander 159 70 Livingston 789 21 Sangamon 14,686 2 Crawford 285 53Bond 167 68 Logan 816 20 Will 2,683 3 Iroquois 274 54Boone 186 66 McDonough 206 60 DuPage 2,094 4 Greene 263 55Brown 214 57 McHenry 646 30 Kankakee 1,979 5 Coles 237 56Bureau 286 52 McLean 672 28 Kane 1,688 6 Brown 214 57Calhoun 72 95 Macon 206 60 Lake 1,469 7 Edgar 214 57Carroll 141 76 Macoupin 787 22 Morgan 1,305 8 Shelby 212 59Cass 372 46 Madison 1,181 10 LaSalle 1,220 9 McDonough 206 60Champaign 712 27 Marion 870 17 Madison 1,181 10 Macon 206 60
Christian 897 16 Marshall 79 94 Randolph 1,135 11 Schuyler 206 60Clark 141 76 Mason 314 49 St. Clair 1,109 12 Woodford 195 63Clay 135 79 Massac 142 75 Jackson 948 13 Richland 194 64Clinton 465 37 Menard 850 18 Winnebago 915 14 Washington 188 65Coles 237 56 Mercer 80 93 Williamson 905 15 Boone 186 66Cook 16,772 1 Monroe 151 72 Christian 897 16 Warren 168 67Crawford 285 53 Montgomery 731 26 Marion 870 17 Bond 167 68Cumberland 101 84 Morgan 1,305 8 Menard 850 18 Scott 160 69DeKalb 378 45 Moultrie 94 88 Adams 842 19 Alexander 159 70DeWitt 118 82 Ogle 314 49 Logan 816 20 Lawrence 154 71
Douglas 98 85 Peoria 765 23 Livingston 789 21 Monroe 151 72DuPage 2,094 4 Perry 661 29 Macoupin 787 22 Jersey 150 73Edgar 214 57 Piatt 94 88 Peoria 765 23 Pulaski 144 74Edwards 53 100 Pike 326 48 Lee 756 24 Massac 142 75Effingham 349 47 Pope 85 90 Union 755 25 Carroll 141 76Fayette 430 39 Pulaski 144 74 Montgomery 731 26 Clark 141 76Ford 85 90 Putnam 71 96 Champaign 712 27 Stephenson 140 78Franklin 561 32 Randolph 1,135 11 McLean 672 28 Clay 135 79Fulton 454 38 Richland 194 64 Perry 661 29 Wayne 132 80Gallatin 49 101 Rock Island 530 33 McHenry 646 30 Hamilton 122 81
Greene 263 55 St. Clair 1,109 12 Whiteside 571 31 DeWitt 118 82Grundy 313 51 Saline 394 42 Franklin 561 32 Hancock 117 83Hamilton 122 81 Sangamon 14,686 2 Rock Island 530 33 Cumberland 101 84Hancock 117 83 Schuyler 206 60 Johnson 512 34 Douglas 98 85Hardin 81 92 Scott 160 69 Vermilion 510 35 Jasper 97 86Henderson 42 102 Shelby 212 59 Tazewell 495 36 Jo Daviess 97 86Henry 386 43 Stark 62 99 Clinton 465 37 Moultrie 94 88Iroquois 274 54 Stephenson 140 78 Fulton 454 38 Piatt 94 88Jackson 948 13 Tazewell 495 36 Fayette 430 39 Ford 85 90Jasper 97 86 Union 755 25 Knox 413 40 Pope 85 90
Jefferson 400 41 Vermilion 510 35 Jefferson 400 41 Hardin 81 92Jersey 150 73 Wabash 67 98 Saline 394 42 Mercer 80 93Jo Daviess 97 86 Warren 168 67 Henry 386 43 Marshall 79 94Johnson 512 34 Washington 188 65 Kendall 383 44 Calhoun 72 95Kane 1,688 6 Wayne 132 80 DeKalb 378 45 Putnam 71 96Kankakee 1,979 5 White 70 97 Cass 372 46 White 70 97Kendall 383 44 Whiteside 571 31 Effingham 349 47 Wabash 67 98Knox 413 40 Will 2,683 3 Pike 326 48 Stark 62 99Lake 1,469 7 Williamson 905 15 Mason 314 49 Edwards 53 100LaSalle 1,220 9 Winnebago 915 14 Ogle 314 49 Gallatin 49 101Lawrence 154 71 Woodford 195 63 Grundy 313 51 Henderson 42 102

Illinois County Data Book / 163
TABLE 47: VALUE OF FARMLAND, 2009 EQUALIZED ASSESSED VALUATION (millions)
By county In rank order
County Rank County Rank County Rank County Rank
Adams $ 97.7 38 Lee $165.7 15 St. Clair $301.2 1 Mercer $79.0 52Alexander 9.1 98 Livingston 153.5 16 Will 284.1 2 Moultrie 77.8 53Bond 58.5 62 Logan 131.1 23 LaSalle 278.9 3 Carroll 77.2 54Boone 106.2 33 McDonough 95.0 39 McHenry 276.7 4 Pike 73.1 55Brown 21.9 93 McHenry 276.7 4 Kane 266.6 5 Effingham 72.8 56Bureau 195.0 10 McLean 241.5 7 Champaign 242.6 6 Rock Island 71.6 57Calhoun 27.3 88 Macon 125.1 25 McLean 241.5 7 Randolph 69.7 58Carroll 77.2 54 Macoupin 107.6 32 DeKalb 214.2 8 Clinton 66.1 59Cass 41.1 75 Madison 152.8 17 Jo Daviess 213.5 9 Greene 66.0 60Champaign 242.6 6 Marion 50.2 69 Bureau 195.0 10 Ford 62.9 61
Christian 167.9 14 Marshall 87.0 46 Kankakee 193.3 11 Bond 58.5 62Clark 41.2 74 Mason 31.1 83 Ogle 177.8 12 Fayette 57.9 63Clay 35.8 79 Massac 21.9 92 Sangamon 176.7 13 Jersey 57.1 64Clinton 66.1 59 Menard 56.4 66 Christian 167.9 14 Jackson 56.7 65Coles 90.9 44 Mercer 79.0 52 Lee 165.7 15 Menard 56.4 66Cook 5.0 101 Monroe 81.3 50 Livingston 153.5 16 Stark 53.4 67Crawford 39.5 76 Montgomery 84.3 48 Madison 152.8 17 Washington 52.7 68Cumberland 35.4 80 Morgan 90.8 45 Henry 151.2 18 Marion 50.2 69DeKalb 214.2 8 Moultrie 77.8 53 Lake 149.4 19 Henderson 49.9 70De Witt 90.9 43 Ogle 177.8 12 Woodford 138.6 20 Union 48.1 71
Douglas 91.4 42 Peoria 124.8 26 Vermilion 135.0 21 Jasper 46.7 72DuPage 1.8 102 Perry 32.7 82 Tazewell 131.7 22 Franklin 42.3 73Edgar 120.3 27 Piatt 99.2 36 Logan 131.1 23 Clark 41.2 74Edwards 15.4 97 Pike 73.1 55 Stephenson 128.1 24 Cass 41.1 75Effingham 72.8 56 Pope 17.8 96 Macon 125.1 25 Crawford 39.5 76Fayette 57.9 63 Pulaski 7.9 99 Peoria 124.8 26 Wayne 37.6 77Ford 62.9 61 Putnam 34.3 81 Edgar 120.3 27 Schuyler 36.1 78Franklin 42.3 73 Randolph 69.7 58 Iroquois 117.7 28 Clay 35.8 79Fulton 86.1 47 Richland 28.9 86 Shelby 116.4 29 Cumberland 35.4 80Gallatin 17.9 95 Rock Island 71.6 57 Knox 111.1 30 Putnam 34.3 81
Greene 66.0 60 St. Clair 301.2 1 Kendall 108.6 31 Perry 32.7 82Grundy 81.6 49 Saline 26.1 89 Macoupin 107.6 32 Mason 31.1 83Hamilton 24.9 90 Sangamon 176.7 13 Boone 106.2 33 Johnson 30.6 84Hancock 104.5 34 Schuyler 36.1 78 Hancock 104.5 34 Scott 29.6 85Hardin 7.4 100 Scott 29.6 85 Whiteside 99.6 35 Richland 28.9 86Henderson 49.9 70 Shelby 116.4 29 Piatt 99.2 36 White 28.0 87Henry 151.2 18 Stark 53.4 67 Warren 98.1 37 Calhoun 27.3 88Iroquois 117.7 28 Stephenson 128.1 24 Adams 97.7 38 Saline 26.1 89Jackson 56.7 65 Tazewell 131.7 22 McDonough 95.0 39 Hamilton 24.9 90Jasper 46.7 72 Union 48.1 71 Winnebago 94.6 40 Lawrence 24.0 91
Jefferson 80.0 51 Vermilion 135.0 21 Williamson 91.9 41 Massac 21.9 92Jersey 57.1 64 Wabash 19.0 94 Douglas 91.4 42 Brown 21.9 93Jo Daviess 213.5 9 Warren 98.1 37 De Witt 90.9 43 Wabash 19.0 94Johnson 30.6 84 Washington 52.7 68 Coles 90.9 44 Gallatin 17.9 95Kane 266.6 5 Wayne 37.6 77 Morgan 90.8 45 Pope 17.8 96Kankakee 193.3 11 White 28.0 87 Marshall 87.0 46 Edwards 15.4 97Kendall 108.6 31 Whiteside 99.6 35 Fulton 86.1 47 Alexander 9.1 98Knox 111.1 30 Will 284.1 2 Montgomery 84.3 48 Pulaski 7.9 99Lake 149.4 19 Williamson 91.9 41 Grundy 81.6 49 Hardin 7.4 100LaSalle 278.9 3 Winnebago 94.6 40 Monroe 81.3 50 Cook 5.0 101Lawrence 24.0 91 Woodford 138.6 20 Jefferson 80.0 51 DuPage 1.8 102

164 / Illinois County Data Book
TABLE 48: VALUE OF RESIDENTIAL REAL ESTATE, 2009 EQUALIZED ASSESSED VALUATION (millions)
By county In rank order
County Rank County Rank County Rank County Rank
Adams $ 627.3 24 Lee $ 362.1 37 Cook $116,989.7 1 McDonough $183.7 52Alexander 14.4 100 Livingston 336.9 39 DuPage 32,988.4 2 Christian 181.0 53Bond 91.8 75 Logan 206.6 48 Lake 24,850.2 3 Douglas 166.2 54Boone 973.1 21 McDonough 183.7 52 Will 16,773.5 4 Montgomery 163.2 55Brown 21.6 96 McHenry 8,513.6 6 Kane 12,169.6 5 Franklin 160.2 56Bureau 253.8 42 McLean 2,260.4 12 McHenry 8,513.6 6 Marshall 154.9 57Calhoun 34.2 93 Macon 1,026.0 20 Winnebago 3,542.6 7 Menard 147.8 58Carroll 252.1 43 Macoupin 374.9 36 Madison 3,423.6 8 Mercer 131.6 59Cass 57.3 85 Madison 3,423.6 8 Kendall 2,772.6 9 Shelby 126.8 60Champaign 2,191.1 14 Marion 185.9 51 St. Clair 2,624.5 10 De Witt 120.1 61
Christian 181.0 53 Marshall 154.9 57 Sangamon 2,447.4 11 Hancock 119.3 62Clark 106.7 64 Mason 99.8 68 McLean 2,260.4 12 Washington 107.9 63Clay 45.7 88 Massac 90.0 77 Peoria 2,242.1 13 Clark 106.7 64Clinton 402.6 34 Menard 147.8 58 Champaign 2,191.1 14 Saline 105.6 65Coles 355.9 38 Mercer 131.6 59 Tazewell 1,745.2 15 Ford 105.5 66Cook 116,989.7 1 Monroe 625.0 25 DeKalb 1,537.5 16 Warren 101.1 67Crawford 98.6 69 Montgomery 163.2 55 Rock Island 1,488.7 17 Mason 99.8 68Cumberland 58.2 84 Morgan 267.7 41 LaSalle 1,390.8 18 Crawford 98.6 69DeKalb 1,537.5 16 Moultrie 93.9 73 Kankakee 1,337.1 19 Putnam 98.3 70De Witt 120.1 61 Ogle 692.7 23 Macon 1,026.0 20 Perry 96.2 71
Douglas 166.2 54 Peoria 2,242.1 13 Boone 973.1 21 Edgar 95.3 72DuPage 32,988.4 2 Perry 96.2 71 Grundy 971.3 22 Moultrie 93.9 73Edgar 95.3 72 Piatt 220.1 47 Ogle 692.7 23 Richland 93.4 74Edwards 22.2 94 Pike 71.9 80 Adams 627.3 24 Bond 91.8 75Effingham 333.5 40 Pope 19.1 97 Monroe 625.0 25 Union 90.8 76Fayette 76.7 78 Pulaski 11.3 102 Williamson 530.6 26 Massac 90.0 77Ford 105.5 66 Putnam 98.3 70 Woodford 521.9 27 Fayette 76.7 78Franklin 160.2 56 Randolph 202.5 49 Whiteside 518.5 28 Wabash 76.0 79Fulton 225.2 46 Richland 93.4 74 Jo Daviess 494.3 29 Pike 71.9 80Gallatin 14.1 101 Rock Island 1,488.7 17 Henry 486.6 30 Greene 59.8 81
Greene 59.8 81 St. Clair 2,624.5 10 Vermilion 476.2 31 White 58.9 82Grundy 971.3 22 Saline 105.6 65 Jackson 412.1 32 Johnson 58.9 83Hamilton 22.0 95 Sangamon 2,447.4 11 Stephenson 409.9 33 Cumberland 58.2 84Hancock 119.3 62 Schuyler 39.7 90 Clinton 402.6 34 Cass 57.3 85Hardin 15.0 99 Scott 19.0 98 Knox 400.0 35 Wayne 52.4 86Henderson 42.9 89 Shelby 126.8 60 Macoupin 374.9 36 Lawrence 50.9 87Henry 486.6 30 Stark 35.4 92 Lee 362.1 37 Clay 45.7 88Iroquois 251.4 44 Stephenson 409.9 33 Coles 355.9 38 Henderson 42.9 89Jackson 412.1 32 Tazewell 1,745.2 15 Livingston 336.9 39 Schuyler 39.7 90Jasper 37.9 91 Union 90.8 76 Effingham 333.5 40 Jasper 37.9 91
Jefferson 188.6 50 Vermilion 476.2 31 Morgan 267.7 41 Stark 35.4 92Jersey 227.6 45 Wabash 76.0 79 Bureau 253.8 42 Calhoun 34.2 93Jo Daviess 494.3 29 Warren 101.1 67 Carroll 252.1 43 Edwards 22.2 94Johnson 58.9 83 Washington 107.9 63 Iroquois 251.4 44 Hamilton 22.0 95Kane 12,169.6 5 Wayne 52.4 86 Jersey 227.6 45 Brown 21.6 96Kankakee 1,337.1 19 White 58.9 82 Fulton 225.2 46 Pope 19.1 97Kendall 2,772.6 9 Whiteside 518.5 28 Piatt 220.1 47 Scott 19.0 98Knox 400.0 35 Will 16,773.5 4 Logan 206.6 48 Hardin 15.0 99Lake 24,850.2 3 Williamson 530.6 26 Randolph 202.5 49 Alexander 14.4 100LaSalle 1,390.8 18 Winnebago 3,542.6 7 Jefferson 188.6 50 Gallatin 14.1 101Lawrence 50.9 87 Woodford 521.9 27 Marion 185.9 51 Pulaski 11.3 102

Illinois County Data Book / 165
TABLE 49: VALUE OF INDUSTRIAL, RAILROAD, AND MINERAL REAL ESTATE, 2009 EQUALIZED ASSESSED VALUATION (millions)
By county In rank order
County Rank County Rank County Rank County Rank
Adams $ 46.8 33 Lee $ 56.6 30 Cook $19,091.2 1 Franklin $22.2 52Alexander 8.2 82 Livingston 20.8 55 DuPage 3,152.1 2 Fayette 21.4 53Bond 8.8 80 Logan 12.4 72 Will 2,415.5 3 Stephenson 20.8 54Boone 66.2 28 McDonough 8.4 81 Lake 1,094.3 4 Livingston 20.8 55Brown 0.2 100 McHenry 429.8 9 Kane 1,015.2 5 Putnam 20.0 56Bureau 42.4 34 McLean 86.6 24 Grundy 762.7 6 Jo Daviess 19.3 57Calhoun 0.0 102 Macon 109.2 17 LaSalle 644.5 7 Lawrence 19.3 58Carroll 11.5 73 Macoupin 13.0 71 Ogle 548.2 8 Ford 18.3 59Cass 2.0 95 Madison 302.9 11 McHenry 429.8 9 Perry 17.8 60Champaign 62.6 29 Marion 47.7 31 Winnebago 308.0 10 Iroquois 17.5 61
Christian 28.4 44 Marshall 16.5 63 Madison 302.9 11 Edgar 16.7 62Clark 3.9 90 Mason 27.0 46 De Witt 250.6 12 Marshall 16.5 63Clay 23.7 50 Massac 35.4 37 Rock Island 238.1 13 Clinton 16.4 64Clinton 16.4 64 Menard 2.7 91 Crawford 180.3 14 Douglas 16.0 65Coles 22.5 51 Mercer 0.2 101 Peoria 134.8 15 Monroe 15.4 66Cook 19,091.2 1 Monroe 15.4 66 Jasper 133.7 16 Wayne 14.9 67Crawford 180.3 14 Montgomery 73.2 26 Macon 109.2 17 Wabash 14.6 68Cumberland 5.2 88 Morgan 41.6 35 Randolph 108.6 18 Washington 14.0 69DeKalb 93.5 23 Moultrie 5.4 87 Kendall 105.3 19 Woodford 13.2 70De Witt 250.6 12 Ogle 548.2 8 St. Clair 99.5 20 Macoupin 13.0 71
Douglas 16.0 65 Peoria 134.8 15 Tazewell 95.6 21 Logan 12.4 72DuPage 3,152.1 2 Perry 17.8 60 Kankakee 95.4 22 Carroll 11.5 73Edgar 16.7 62 Piatt 8.9 79 DeKalb 93.5 23 Stark 11.2 74Edwards 10.7 75 Pike 10.5 76 McLean 86.6 24 Edwards 10.7 75Effingham 33.3 38 Pope 0.9 99 Williamson 77.1 25 Pike 10.5 76Fayette 21.4 53 Pulaski 6.4 85 Montgomery 73.2 26 Gallatin 10.0 77Ford 18.3 59 Putnam 20.0 56 Vermilion 68.9 27 Hamilton 9.1 78Franklin 22.2 52 Randolph 108.6 18 Boone 66.2 28 Piatt 8.9 79Fulton 25.7 48 Richland 24.1 49 Champaign 62.6 29 Bond 8.8 80Gallatin 10.0 77 Rock Island 238.1 13 Lee 56.6 30 McDonough 8.4 81
Greene 2.1 94 St. Clair 99.5 20 Marion 47.7 31 Alexander 8.2 82Grundy 762.7 6 Saline 27.9 45 Jackson 47.2 32 Scott 7.4 83Hamilton 9.1 78 Sangamon 29.2 43 Adams 46.8 33 Warren 6.9 84Hancock 2.5 93 Schuyler 1.5 98 Bureau 42.4 34 Pulaski 6.4 85Hardin 2.5 92 Scott 7.4 83 Morgan 41.6 35 Henderson 5.5 86Henderson 5.5 86 Shelby 26.6 47 Knox 39.5 36 Moultrie 5.4 87Henry 32.5 39 Stark 11.2 74 Massac 35.4 37 Cumberland 5.2 88Iroquois 17.5 61 Stephenson 20.8 54 Effingham 33.3 38 Union 4.9 89Jackson 47.2 32 Tazewell 95.6 21 Henry 32.5 39 Clark 3.9 90Jasper 133.7 16 Union 4.9 89 Whiteside 32.5 40 Menard 2.7 91
Jefferson 32.1 41 Vermilion 68.9 27 Jefferson 32.1 41 Hardin 2.5 92Jersey 1.9 97 Wabash 14.6 68 White 31.3 42 Hancock 2.5 93Jo Daviess 19.3 57 Warren 6.9 84 Sangamon 29.2 43 Greene 2.1 94Johnson 2.0 96 Washington 14.0 69 Christian 28.4 44 Cass 2.0 95Kane 1,015.2 5 Wayne 14.9 67 Saline 27.9 45 Johnson 2.0 96Kankakee 95.4 22 White 31.3 42 Mason 27.0 46 Jersey 1.9 97Kendall 105.3 19 Whiteside 32.5 40 Shelby 26.6 47 Schuyler 1.5 98Knox 39.5 36 Will 2,415.5 3 Fulton 25.7 48 Pope 0.9 99Lake 1,094.3 4 Williamson 77.1 25 Richland 24.1 49 Brown 0.2 100LaSalle 644.5 7 Winnebago 308.0 10 Clay 23.7 50 Mercer 0.2 101Lawrence 19.3 58 Woodford 13.2 70 Coles 22.5 51 Calhoun 0.0 102

166 / Illinois County Data Book
TABLE 50: VALUE OF COMMERCIAL REAL ESTATE, 2009 EQUALIZED ASSESSED VALUATION (millions)
By county In rank order
County Rank County Rank County Rank County Rank
Adams $ 229.7 24 Lee $ 89.0 40 Cook $57,232.3 1 Randolph $60.7 52Alexander 5.9 98 Livingston 104.2 36 DuPage 7,368.3 2 Fulton 59.2 53Bond 25.4 77 Logan 74.6 46 Lake 4,354.3 3 Saline 57.0 54Boone 110.0 33 McDonough 81.1 42 Will 2,767.7 4 Iroquois 55.4 55Brown 13.4 88 McHenry 1,215.6 7 Kane 2,342.0 5 De Witt 54.7 56Bureau 105.8 34 McLean 1,009.3 11 Champaign 1,242.1 6 Putnam 54.4 57Calhoun 10.9 91 Macon 388.1 19 McHenry 1,215.6 7 Hancock 45.9 58Carroll 29.6 71 Macoupin 68.6 48 St. Clair 1,180.8 8 Marshall 45.8 59Cass 27.6 76 Madison 1,063.0 9 Madison 1,063.0 9 Ford 41.8 60Champaign 1,242.1 6 Marion 78.2 44 Sangamon 1,042.3 10 Massac 40.2 61
Christian 72.4 47 Marshall 45.8 59 McLean 1,009.3 11 Piatt 37.5 62Clark 31.4 67 Mason 18.6 85 Winnebago 902.0 12 Warren 35.6 63Clay 25.0 79 Massac 40.2 61 Peoria 836.3 13 Crawford 35.6 64Clinton 83.8 41 Menard 16.0 86 Rock Island 695.0 14 Moultrie 33.1 65Coles 146.8 28 Mercer 28.4 73 LaSalle 507.6 15 Shelby 33.1 66Cook 57,232.3 1 Monroe 105.6 35 DeKalb 501.1 16 Clark 31.4 67Crawford 35.6 64 Montgomery 78.8 43 Tazewell 480.9 17 Fayette 31.0 68Cumberland 10.6 92 Morgan 96.0 38 Kankakee 395.9 18 Richland 31.0 69DeKalb 501.1 16 Moultrie 33.1 65 Macon 388.1 19 Pike 30.3 70De Witt 54.7 56 Ogle 103.8 37 Kendall 383.2 20 Carroll 29.6 71
Douglas 66.2 50 Peoria 836.3 13 Grundy 319.4 21 Union 29.4 72DuPage 7,368.3 2 Perry 22.8 83 Williamson 295.3 22 Mercer 28.4 73Edgar 24.1 80 Piatt 37.5 62 Jackson 230.6 23 Wabash 28.3 74Edwards 6.7 94 Pike 30.3 70 Adams 229.7 24 Washington 27.8 75Effingham 168.2 26 Pope 0.6 102 Vermilion 217.8 25 Cass 27.6 76Fayette 31.0 68 Pulaski 6.3 95 Effingham 168.2 26 Bond 25.4 77Ford 41.8 60 Putnam 54.4 57 Knox 151.3 27 Wayne 25.0 78Franklin 68.0 49 Randolph 60.7 52 Coles 146.8 28 Clay 25.0 79Fulton 59.2 53 Richland 31.0 69 Henry 140.8 29 Edgar 24.1 80Gallatin 5.9 99 Rock Island 695.0 14 Stephenson 129.3 30 White 23.4 81
Greene 23.0 82 St. Clair 1,180.8 8 Jefferson 128.3 31 Greene 23.0 82Grundy 319.4 21 Saline 57.0 54 Whiteside 128.1 32 Perry 22.8 83Hamilton 6.3 96 Sangamon 1,042.3 10 Boone 110.0 33 Lawrence 19.7 84Hancock 45.9 58 Schuyler 11.4 90 Bureau 105.8 34 Mason 18.6 85Hardin 2.3 101 Scott 3.5 100 Monroe 105.6 35 Menard 16.0 86Henderson 11.6 89 Shelby 33.1 66 Livingston 104.2 36 Johnson 13.7 87Henry 140.8 29 Stark 6.2 97 Ogle 103.8 37 Brown 13.4 88Iroquois 55.4 55 Stephenson 129.3 30 Morgan 96.0 38 Henderson 11.6 89Jackson 230.6 23 Tazewell 480.9 17 Jo Daviess 93.6 39 Schuyler 11.4 90Jasper 9.6 93 Union 29.4 72 Lee 89.0 40 Calhoun 10.9 91
Jefferson 128.3 31 Vermilion 217.8 25 Clinton 83.8 41 Cumberland 10.6 92Jersey 65.6 51 Wabash 28.3 74 McDonough 81.1 42 Jasper 9.6 93Jo Daviess 93.6 39 Warren 35.6 63 Montgomery 78.8 43 Edwards 6.7 94Johnson 13.7 87 Washington 27.8 75 Marion 78.2 44 Pulaski 6.3 95Kane 2,342.0 5 Wayne 25.0 78 Woodford 76.5 45 Hamilton 6.3 96Kankakee 395.9 18 White 23.4 81 Logan 74.6 46 Stark 6.2 97Kendall 383.2 20 Whiteside 128.1 32 Christian 72.4 47 Alexander 5.9 98Knox 151.3 27 Will 2,767.7 4 Macoupin 68.6 48 Gallatin 5.9 99Lake 4,354.3 3 Williamson 295.3 22 Franklin 68.0 49 Scott 3.5 100LaSalle 507.6 15 Winnebago 902.0 12 Douglas 66.2 50 Hardin 2.3 101Lawrence 19.7 84 Woodford 76.5 45 Jersey 65.6 51 Pope 0.6 102
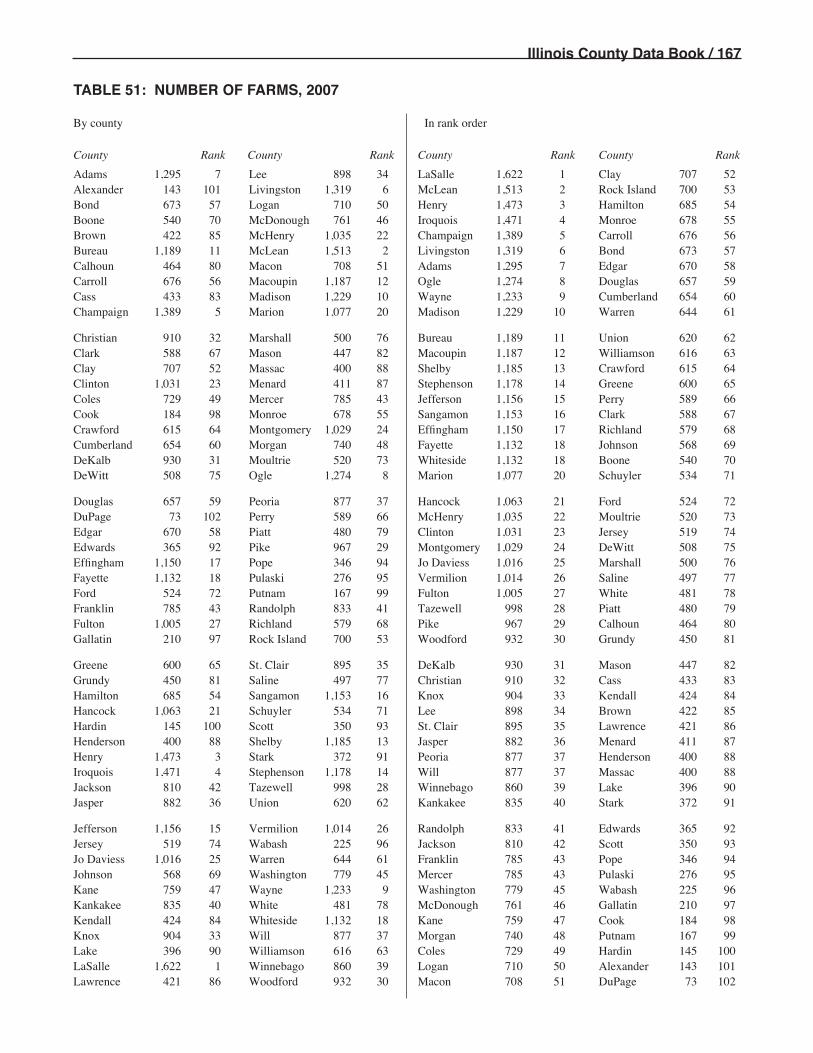
Illinois County Data Book / 167
TABLE 51: NUMBER OF FARMS, 2007
By county In rank order
County Rank County Rank County Rank County Rank
Adams 1,295 7 Lee 898 34 LaSalle 1,622 1 Clay 707 52Alexander 143 101 Livingston 1,319 6 McLean 1,513 2 Rock Island 700 53Bond 673 57 Logan 710 50 Henry 1,473 3 Hamilton 685 54Boone 540 70 McDonough 761 46 Iroquois 1,471 4 Monroe 678 55Brown 422 85 McHenry 1,035 22 Champaign 1,389 5 Carroll 676 56Bureau 1,189 11 McLean 1,513 2 Livingston 1,319 6 Bond 673 57Calhoun 464 80 Macon 708 51 Adams 1,295 7 Edgar 670 58Carroll 676 56 Macoupin 1,187 12 Ogle 1,274 8 Douglas 657 59Cass 433 83 Madison 1,229 10 Wayne 1,233 9 Cumberland 654 60Champaign 1,389 5 Marion 1,077 20 Madison 1,229 10 Warren 644 61
Christian 910 32 Marshall 500 76 Bureau 1,189 11 Union 620 62Clark 588 67 Mason 447 82 Macoupin 1,187 12 Williamson 616 63Clay 707 52 Massac 400 88 Shelby 1,185 13 Crawford 615 64Clinton 1,031 23 Menard 411 87 Stephenson 1,178 14 Greene 600 65Coles 729 49 Mercer 785 43 Jefferson 1,156 15 Perry 589 66Cook 184 98 Monroe 678 55 Sangamon 1,153 16 Clark 588 67Crawford 615 64 Montgomery 1,029 24 Effingham 1,150 17 Richland 579 68Cumberland 654 60 Morgan 740 48 Fayette 1,132 18 Johnson 568 69DeKalb 930 31 Moultrie 520 73 Whiteside 1,132 18 Boone 540 70DeWitt 508 75 Ogle 1,274 8 Marion 1,077 20 Schuyler 534 71
Douglas 657 59 Peoria 877 37 Hancock 1,063 21 Ford 524 72DuPage 73 102 Perry 589 66 McHenry 1,035 22 Moultrie 520 73Edgar 670 58 Piatt 480 79 Clinton 1,031 23 Jersey 519 74Edwards 365 92 Pike 967 29 Montgomery 1,029 24 DeWitt 508 75Effingham 1,150 17 Pope 346 94 Jo Daviess 1,016 25 Marshall 500 76Fayette 1,132 18 Pulaski 276 95 Vermilion 1,014 26 Saline 497 77Ford 524 72 Putnam 167 99 Fulton 1,005 27 White 481 78Franklin 785 43 Randolph 833 41 Tazewell 998 28 Piatt 480 79Fulton 1,005 27 Richland 579 68 Pike 967 29 Calhoun 464 80Gallatin 210 97 Rock Island 700 53 Woodford 932 30 Grundy 450 81
Greene 600 65 St. Clair 895 35 DeKalb 930 31 Mason 447 82Grundy 450 81 Saline 497 77 Christian 910 32 Cass 433 83Hamilton 685 54 Sangamon 1,153 16 Knox 904 33 Kendall 424 84Hancock 1,063 21 Schuyler 534 71 Lee 898 34 Brown 422 85Hardin 145 100 Scott 350 93 St. Clair 895 35 Lawrence 421 86Henderson 400 88 Shelby 1,185 13 Jasper 882 36 Menard 411 87Henry 1,473 3 Stark 372 91 Peoria 877 37 Henderson 400 88Iroquois 1,471 4 Stephenson 1,178 14 Will 877 37 Massac 400 88Jackson 810 42 Tazewell 998 28 Winnebago 860 39 Lake 396 90Jasper 882 36 Union 620 62 Kankakee 835 40 Stark 372 91
Jefferson 1,156 15 Vermilion 1,014 26 Randolph 833 41 Edwards 365 92Jersey 519 74 Wabash 225 96 Jackson 810 42 Scott 350 93Jo Daviess 1,016 25 Warren 644 61 Franklin 785 43 Pope 346 94Johnson 568 69 Washington 779 45 Mercer 785 43 Pulaski 276 95Kane 759 47 Wayne 1,233 9 Washington 779 45 Wabash 225 96Kankakee 835 40 White 481 78 McDonough 761 46 Gallatin 210 97Kendall 424 84 Whiteside 1,132 18 Kane 759 47 Cook 184 98Knox 904 33 Will 877 37 Morgan 740 48 Putnam 167 99Lake 396 90 Williamson 616 63 Coles 729 49 Hardin 145 100LaSalle 1,622 1 Winnebago 860 39 Logan 710 50 Alexander 143 101Lawrence 421 86 Woodford 932 30 Macon 708 51 DuPage 73 102

168 / Illinois County Data Book
TABLE 52: PERCENT CHANGE IN NUMBER OF FARMS, 1997-2007
By county In rank order
County Rank County Rank County Rank County Rank
Adams -8.5% 92 Lee -0.7% 73 Crawford 30.0% 1 St. Clair 6.0% 52Alexander -13.9 98 Livingston -4.4 83 Wayne 26.9 2 Iroquois 5.6 53Bond 9.3 39 Logan -3.9 82 Winnebago 25.2 3 Williamson 5.3 54Boone 10.2 35 McDonough -7.6 90 Pope 22.7 4 Stark 5.1 55Brown 11.9 29 McHenry 12.4 24 Marion 22.1 5 Montgomery 5.0 56Bureau 2.9 62 McLean 2.6 65 Monroe 21.9 6 Union 4.9 57Calhoun 7.2 45 Macon 6.5 50 Hamilton 21.7 7 Douglas 4.3 58Carroll 8.2 42 Macoupin -1.6 75 Jasper 21.0 8 Mercer 4.1 59Cass 3.8 60 Madison 2.8 63 Jefferson 20.2 9 Cass 3.8 60Champaign 1.3 66 Marion 22.1 5 Clinton 19.9 10 Vermilion 3.0 61
Christian 11.0 32 Marshall 1.2 67 Cumberland 19.6 11 Bureau 2.9 62Clark -2.5 76 Mason -8.0 91 Franklin 19.3 12 Madison 2.8 63Clay 12.8 22 Massac 0.0 72 Jackson 19.1 13 LaSalle 2.6 64Clinton 19.9 10 Menard 16.8 17 Lake 18.2 14 McLean 2.6 65Coles 7.0 47 Mercer 4.1 59 Richland 17.0 15 Champaign 1.3 66Cook -22.4 102 Monroe 21.9 6 Kane 16.8 16 Marshall 1.2 67Crawford 30.0 1 Montgomery 5.0 56 Menard 16.8 17 Fayette 1.2 68Cumberland 19.6 11 Morgan -5.1 86 Sangamon 16.1 18 Woodford 1.0 69DeKalb 12.3 25 Moultrie 12.1 26 Ogle 15.9 19 Kankakee 0.5 70De Witt 9.7 37 Ogle 15.9 19 Pulaski 15.5 20 Washington 0.3 71
Douglas 4.3 58 Peoria -5.1 85 Rock Island 13.3 21 Massac 0.0 72DuPage -21.5 101 Perry 6.9 49 Clay 12.8 22 Lee -0.7 73Edgar -12.5 97 Piatt 7.1 46 Saline 12.7 23 Randolph -1.2 74Edwards 10.9 33 Pike -5.9 88 McHenry 12.4 24 Macoupin -1.6 75Effingham 11.1 31 Pope 22.7 4 DeKalb 12.3 25 Clark -2.5 76Fayette 1.2 68 Pulaski 15.5 20 Moultrie 12.1 26 Knox -2.6 77Ford -4.7 84 Putnam -12.1 96 Lawrence 12.0 27 Grundy -2.8 78Franklin 19.3 12 Randolph -1.2 74 Schuyler 11.9 28 Henderson -3.4 79Fulton -8.7 93 Richland 17.0 15 Brown 11.9 29 Will -3.6 80Gallatin -11.8 95 Rock Island 13.3 21 White 11.3 30 Kendall -3.9 81
Greene -16.7 100 St. Clair 6.0 52 Effingham 11.1 31 Logan -3.9 82Grundy -2.8 78 Saline 12.7 23 Christian 11.0 32 Livingston -4.4 83Hamilton 21.7 7 Sangamon 16.1 18 Edwards 10.9 33 Ford -4.7 84Hancock -6.5 89 Schuyler 11.9 28 Johnson 10.3 34 Peoria -5.1 85Hardin -15.7 99 Scott 7.0 48 Boone 10.2 35 Morgan -5.1 86Henderson -3.4 79 Shelby -5.2 87 Tazewell 9.8 36 Shelby -5.2 87Henry 9.6 38 Stark 5.1 55 De Witt 9.7 37 Pike -5.9 88Iroquois 5.6 53 Stephenson 9.0 40 Henry 9.6 38 Hancock -6.5 89Jackson 19.1 13 Tazewell 9.8 36 Bond 9.3 39 McDonough -7.6 90Jasper 21.0 8 Union 4.9 57 Stephenson 9.0 40 Mason -8.0 91
Jefferson 20.2 9 Vermilion 3.0 61 Whiteside 9.0 41 Adams -8.5 92Jersey 7.9 44 Wabash 6.1 51 Carroll 8.2 42 Fulton -8.7 93Jo Daviess 8.0 43 Warren -9.3 94 Jo Daviess 8.0 43 Warren -9.3 94Johnson 10.3 34 Washington 0.3 71 Jersey 7.9 44 Gallatin -11.8 95Kane 16.8 16 Wayne 26.9 2 Calhoun 7.2 45 Putnam -12.1 96Kankakee 0.5 70 White 11.3 30 Piatt 7.1 46 Edgar -12.5 97Kendall -3.9 81 Whiteside 9.0 41 Coles 7.0 47 Alexander -13.9 98Knox -2.6 77 Will -3.6 80 Scott 7.0 48 Hardin -15.7 99Lake 18.2 14 Williamson 5.3 54 Perry 6.9 49 Greene -16.7 100LaSalle 2.6 64 Winnebago 25.2 3 Macon 6.5 50 DuPage -21.5 101Lawrence 12.0 27 Woodford 1.0 69 Wabash 6.1 51 Cook -22.4 102

Illinois County Data Book / 169
TABLE 53: ACRES OF FARMS, 2007
By county In rank order
County Rank County Rank County Rank County Rank
Adams 374,133 19 Lee 395,624 12 Iroquois 677,803 1 Jasper 243,451 52Alexander 47,626 98 Livingston 628,502 4 McLean 675,984 2 Effingham 242,009 53Bond 224,760 56 Logan 320,356 30 LaSalle 643,291 3 Clark 238,706 54Boone 137,162 85 McDonough 307,725 32 Livingston 628,502 4 Jefferson 232,531 55Brown 151,058 83 McHenry 215,584 60 Champaign 550,481 5 Bond 224,760 56Bureau 478,389 8 McLean 675,984 2 Sangamon 518,153 6 Jackson 224,414 57Calhoun 87,938 95 Macon 290,603 38 Henry 489,903 7 Will 220,851 58Carroll 265,153 46 Macoupin 394,228 13 Bureau 478,389 8 Hamilton 219,873 59Cass 173,543 77 Madison 312,936 31 Vermilion 457,375 9 McHenry 215,584 60Champaign 550,481 5 Marion 260,679 48 Christian 449,512 10 Grundy 215,474 61
Christian 449,512 10 Marshall 204,584 66 Whiteside 405,333 11 Clay 209,834 62Clark 238,706 54 Mason 273,362 41 Lee 395,624 12 Franklin 207,877 63Clay 209,834 62 Massac 89,693 94 Macoupin 394,228 13 Schuyler 207,457 64Clinton 268,441 44 Menard 168,594 80 Hancock 392,898 14 Crawford 205,356 65Coles 254,869 50 Mercer 306,306 34 Pike 389,808 15 Marshall 204,584 66Cook 8,198 101 Monroe 178,134 76 Shelby 387,288 16 Richland 202,860 67Crawford 205,356 65 Montgomery 347,765 25 Kankakee 385,808 17 Perry 200,354 68Cumberland 144,981 84 Morgan 320,512 29 Fulton 385,302 18 DeWitt 198,680 69DeKalb 370,772 20 Moultrie 167,791 81 Adams 374,133 19 Lawrence 194,035 70DeWitt 198,680 69 Ogle 366,470 21 DeKalb 370,772 20 Kane 192,372 71
Douglas 261,513 47 Peoria 259,204 49 Ogle 366,470 21 Jersey 189,462 72DuPage 7,948 102 Perry 200,354 68 Knox 362,951 22 Gallatin 185,753 73Edgar 352,535 24 Piatt 267,265 45 Washington 353,903 23 Winnebago 183,615 74Edwards 116,690 89 Pike 389,808 15 Edgar 352,535 24 Rock Island 178,623 75Effingham 242,009 53 Pope 60,809 97 Montgomery 347,765 25 Monroe 178,134 76Fayette 303,258 35 Pulaski 101,189 91 Stephenson 337,932 26 Cass 173,543 77Ford 270,720 43 Putnam 62,705 96 Wayne 333,255 27 Henderson 170,443 78Franklin 207,877 63 Randolph 252,926 51 Tazewell 329,268 28 Stark 169,775 79Fulton 385,302 18 Richland 202,860 67 Morgan 320,512 29 Menard 168,594 80Gallatin 185,753 73 Rock Island 178,623 75 Logan 320,356 30 Moultrie 167,791 81
Greene 273,088 42 St. Clair 306,533 33 Madison 312,936 31 Kendall 166,872 82Grundy 215,474 61 Saline 117,233 88 McDonough 307,725 32 Brown 151,058 83Hamilton 219,873 59 Sangamon 518,153 6 St. Clair 306,533 33 Cumberland 144,981 84Hancock 392,898 14 Schuyler 207,457 64 Mercer 306,306 34 Boone 137,162 85Hardin 34,733 99 Scott 135,731 86 Fayette 303,258 35 Scott 135,731 86Henderson 170,443 78 Shelby 387,288 16 White 296,989 36 Union 122,362 87Henry 489,903 7 Stark 169,775 79 Warren 294,907 37 Saline 117,233 88Iroquois 677,803 1 Stephenson 337,932 26 Macon 290,603 38 Edwards 116,690 89Jackson 224,414 57 Tazewell 329,268 28 Woodford 288,400 39 Wabash 114,361 90Jasper 243,451 52 Union 122,362 87 Jo Daviess 281,457 40 Pulaski 101,189 91
Jefferson 232,531 55 Vermilion 457,375 9 Mason 273,362 41 Johnson 100,499 92Jersey 189,462 72 Wabash 114,361 90 Greene 273,088 42 Williamson 94,124 93Jo Daviess 281,457 40 Warren 294,907 37 Ford 270,720 43 Massac 89,693 94Johnson 100,499 92 Washington 353,903 23 Clinton 268,441 44 Calhoun 87,938 95Kane 192,372 71 Wayne 333,255 27 Piatt 267,265 45 Putnam 62,705 96Kankakee 385,808 17 White 296,989 36 Carroll 265,153 46 Pope 60,809 97Kendall 166,872 82 Whiteside 405,333 11 Douglas 261,513 47 Alexander 47,626 98Knox 362,951 22 Will 220,851 58 Marion 260,679 48 Hardin 34,733 99Lake 34,525 100 Williamson 94,124 93 Peoria 259,204 49 Lake 34,525 100LaSalle 643,291 3 Winnebago 183,615 74 Coles 254,869 50 Cook 8,198 101Lawrence 194,035 70 Woodford 288,400 39 Randolph 252,926 51 DuPage 7,948 102

170 / Illinois County Data Book
TABLE 54: PERCENT CHANGE IN ACRES OF FARMS, 1997-2007
By county In rank order
County Rank County Rank County Rank County Rank
Adams -15.4 91 Lee 0.7 37 Bond 24.8 1 Boone -3.0 52Alexander -33.2 100 Livingston 2.4 30 Pulaski 21.7 2 Peoria -3.0 53Bond 24.8 1 Logan -15.9 95 Perry 16.5 3 Champaign -3.0 54Boone -3.0 52 McDonough -9.5 76 St. Clair 15.9 4 DeWitt -3.0 55Brown -0.7 43 McHenry -11.1 83 White 15.8 5 Ogle -3.4 56Bureau -1.2 47 McLean -3.0 51 Franklin 15.8 6 Jasper -3.5 57Calhoun -11.6 86 Macon -10.0 78 Jersey 15.4 7 Randolph -3.6 58Carroll 9.0 17 Macoupin -0.4 41 Christian 15.3 8 Johnson -3.7 59Cass -9.7 77 Madison 10.3 13 Clinton 14.9 9 Montgomery -3.7 60Champaign -3.0 54 Marion 4.5 26 Washington 14.7 10 Woodford -3.8 61
Christian 15.3 8 Marshall -10.1 80 Sangamon 11.0 11 Monroe -4.6 62Clark -11.2 84 Mason -6.2 68 Jackson 10.8 12 Stark -5.5 63Clay -12.1 87 Massac -13.6 88 Madison 10.3 13 Vermilion -5.7 64Clinton 14.9 9 Menard -1.0 45 Kankakee 9.7 14 Effingham -5.8 65Coles -0.8 44 Mercer -1.1 46 Stephenson 9.5 15 Wabash -6.0 66Cook -79.2 102 Monroe -4.6 62 LaSalle 9.5 16 Winnebago -6.1 67Crawford -1.7 48 Montgomery -3.7 60 Carroll 9.0 17 Mason -6.2 68Cumberland -14.6 90 Morgan 4.9 24 Henry 7.3 18 Warren -6.4 69DeKalb 0.7 36 Moultrie -2.8 50 Grundy 7.0 19 Scott -6.7 70DeWitt -3.0 55 Ogle -3.4 56 Lawrence 6.3 20 Knox -6.9 71
Douglas 4.8 25 Peoria -3.0 53 Piatt 5.5 21 Shelby -7.5 72DuPage -53.5 101 Perry 16.5 3 Whiteside 5.4 22 Kane -8.4 73Edgar 0.0 39 Piatt 5.5 21 Rock Island 5.0 23 Fayette -9.0 74Edwards 3.3 28 Pike -15.5 92 Morgan 4.9 24 Fulton -9.3 75Effingham -5.8 65 Pope -15.8 94 Douglas 4.8 25 McDonough -9.5 76Fayette -9.0 74 Pulaski 21.7 2 Marion 4.5 26 Cass -9.7 77Ford -14.0 89 Putnam -18.5 97 Wayne 3.9 27 Macon -10.0 78Franklin 15.8 6 Randolph -3.6 58 Edwards 3.3 28 Union -10.1 79Fulton -9.3 75 Richland 2.9 29 Richland 2.9 29 Marshall -10.1 80Gallatin -2.8 49 Rock Island 5.0 23 Livingston 2.4 30 Saline -10.3 81
Greene -16.6 96 St. Clair 15.9 4 Hamilton 2.4 31 Hancock -10.4 82Grundy 7.0 19 Saline -10.3 81 Jo Daviess 2.1 32 McHenry -11.1 83Hamilton 2.4 31 Sangamon 11.0 11 Williamson 2.0 33 Clark -11.2 84Hancock -10.4 82 Schuyler -0.7 42 Iroquois 1.6 34 Hardin -11.5 85Hardin -11.5 85 Scott -6.7 70 Jefferson 1.3 35 Calhoun -11.6 86Henderson -15.7 93 Shelby -7.5 72 DeKalb 0.7 36 Clay -12.1 87Henry 7.3 18 Stark -5.5 63 Lee 0.7 37 Massac -13.6 88Iroquois 1.6 34 Stephenson 9.5 15 Tazewell 0.3 38 Ford -14.0 89Jackson 10.8 12 Tazewell 0.3 38 Edgar 0.0 39 Cumberland -14.6 90Jasper -3.5 57 Union -10.1 79 Kendall -0.4 40 Adams -15.4 91
Jefferson 1.3 35 Vermilion -5.7 64 Macoupin -0.4 41 Pike -15.5 92Jersey 15.4 7 Wabash -6.0 66 Schuyler -0.7 42 Henderson -15.7 93Jo Daviess 2.1 32 Warren -6.4 69 Brown -0.7 43 Pope -15.8 94Johnson -3.7 59 Washington 14.7 10 Coles -0.8 44 Logan -15.9 95Kane -8.4 73 Wayne 3.9 27 Menard -1.0 45 Greene -16.6 96Kankakee 9.7 14 White 15.8 5 Mercer -1.1 46 Putnam -18.5 97Kendall -0.4 40 Whiteside 5.4 22 Bureau -1.2 47 Will -24.8 98Knox -6.9 71 Will -24.8 98 Crawford -1.7 48 Lake -32.2 99Lake -32.2 99 Williamson 2.0 33 Gallatin -2.8 49 Alexander -33.2 100LaSalle 9.5 16 Winnebago -6.1 67 Moultrie -2.8 50 DuPage -53.5 101Lawrence 6.3 20 Woodford -3.8 61 McLean -3.0 51 Cook -79.2 102

Illinois County Data Book / 171
TABLE 55: ACRES OF FOREIGN-OWNED AGRICULTURAL LAND, 2007
By county In rank order
County Rank County Rank County Rank County Rank
Adams 274 65 Lee 3,586 19 McLean 79,810 1 Boone 573 52Alexander 2,263 29 Livingston 347 59 DeWitt 22,637 2 Shelby 553 53Bond 120 75 Logan 3,908 16 Wayne 10,511 3 Jo Daviess 487 54Boone 573 52 McDonough 890 44 Stephenson 9,524 4 Scott 458 55Brown 0 89 McHenry 3,346 20 LaSalle 9,168 5 Lake 440 56Bureau 10 87 McLean 79,810 1 Champaign 8,557 6 Marshall 416 57Calhoun 0 89 Macon 2,562 24 Piatt 7,327 7 Warren 409 58Carroll 884 45 Macoupin 1,276 34 Ford 6,623 8 Livingston 347 59Cass 267 67 Madison 711 48 Ogle 6,485 9 Cook 315 60Champaign 8,557 6 Marion 204 72 DeKalb 6,388 10 Menard 301 61
Christian 3,817 17 Marshall 416 57 Vermilion 6,388 10 Woodford 299 62Clark 0 89 Mason 2,204 30 Franklin 5,918 12 Morgan 292 63Clay 0 89 Massac 2,345 27 Hamilton 5,370 13 Johnson 280 64Clinton 160 74 Menard 301 61 Grundy 5,010 14 Adams 274 65Coles 599 51 Mercer 0 89 Greene 4,859 15 DuPage 269 66Cook 315 60 Monroe 0 89 Logan 3,908 16 Cass 267 67Crawford 60 81 Montgomery 1,261 35 Christian 3,817 17 Edgar 254 68Cumberland 17 85 Morgan 292 63 Douglas 3,628 18 Henderson 240 69DeKalb 6,388 10 Moultrie 2,639 23 Lee 3,586 19 Stark 220 70DeWitt 22,637 2 Ogle 6,485 9 McHenry 3,346 20 Whiteside 215 71
Douglas 3,628 18 Peoria 120 75 Henry 2,690 21 Marion 204 72DuPage 269 66 Perry 793 46 Tazewell 2,644 22 St. Clair 202 73Edgar 254 68 Piatt 7,327 7 Moultrie 2,639 23 Clinton 160 74Edwards 30 84 Pike 54 82 Macon 2,562 24 Bond 120 75Effingham 0 89 Pope 976 42 Kendall 2,554 25 Peoria 120 75Fayette 110 78 Pulaski 2,274 28 Iroquois 2,490 26 Jefferson 118 77Ford 6,623 8 Putnam 78 79 Massac 2,345 27 Fayette 110 78Franklin 5,918 12 Randolph 1,673 31 Pulaski 2,274 28 Putnam 78 79Fulton 782 47 Richland 39 83 Alexander 2,263 29 Kankakee 74 80Gallatin 0 89 Rock Island 0 89 Mason 2,204 30 Crawford 60 81
Greene 4,859 15 St. Clair 202 73 Randolph 1,673 31 Pike 54 82Grundy 5,010 14 Saline 0 89 Jersey 1,420 32 Richland 39 83Hamilton 5,370 13 Sangamon 1,068 40 Williamson 1,283 33 Edwards 30 84Hancock 1,084 39 Schuyler 7 88 Macoupin 1,276 34 Cumberland 17 85Hardin 650 49 Scott 458 55 Montgomery 1,261 35 Lawrence 13 86Henderson 240 69 Shelby 553 53 Winnebago 1,207 36 Bureau 10 87Henry 2,690 21 Stark 220 70 Jackson 1,151 37 Schuyler 7 88Iroquois 2,490 26 Stephenson 9,524 4 Knox 1,109 38 Brown 0 89Jackson 1,151 37 Tazewell 2,644 22 Hancock 1,084 39 Calhoun 0 89Jasper 0 89 Union 630 50 Sangamon 1,068 40 Clark 0 89
Jefferson 118 77 Vermilion 6,388 10 Will 1,050 41 Clay 0 89Jersey 1,420 32 Wabash 0 89 Pope 976 42 Effingham 0 89Jo Daviess 487 54 Warren 409 58 Kane 931 43 Gallatin 0 89Johnson 280 64 Washington 0 89 McDonough 890 44 Jasper 0 89Kane 931 43 Wayne 10,511 3 Carroll 884 45 Mercer 0 89Kankakee 74 80 White 0 89 Perry 793 46 Monroe 0 89Kendall 2,554 25 Whiteside 215 71 Fulton 782 47 Rock Island 0 89Knox 1,109 38 Will 1,050 41 Madison 711 48 Saline 0 89Lake 440 56 Williamson 1,283 33 Hardin 650 49 Wabash 0 89LaSalle 9,168 5 Winnebago 1,207 36 Union 630 50 Washington 0 89Lawrence 13 86 Woodford 299 62 Coles 599 51 White 0 89
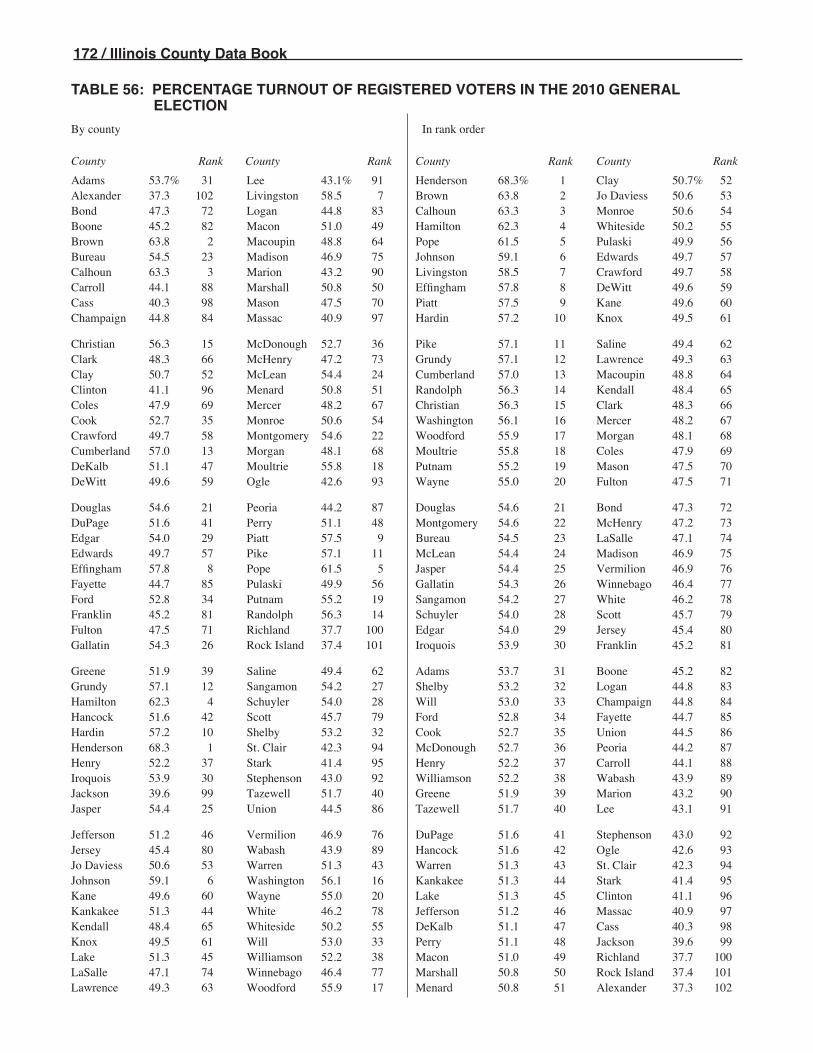
172 / Illinois County Data Book
TABLE 56: PERCENTAGE TURNOUT OF REGISTERED VOTERS IN THE 2010 GENERAL ELECTION
By county In rank order
County Rank County Rank County Rank County Rank
Adams 53.7% 31 Lee 43.1% 91 Henderson 68.3% 1 Clay 50.7% 52Alexander 37.3 102 Livingston 58.5 7 Brown 63.8 2 Jo Daviess 50.6 53Bond 47.3 72 Logan 44.8 83 Calhoun 63.3 3 Monroe 50.6 54Boone 45.2 82 Macon 51.0 49 Hamilton 62.3 4 Whiteside 50.2 55Brown 63.8 2 Macoupin 48.8 64 Pope 61.5 5 Pulaski 49.9 56Bureau 54.5 23 Madison 46.9 75 Johnson 59.1 6 Edwards 49.7 57Calhoun 63.3 3 Marion 43.2 90 Livingston 58.5 7 Crawford 49.7 58Carroll 44.1 88 Marshall 50.8 50 Effingham 57.8 8 DeWitt 49.6 59Cass 40.3 98 Mason 47.5 70 Piatt 57.5 9 Kane 49.6 60Champaign 44.8 84 Massac 40.9 97 Hardin 57.2 10 Knox 49.5 61
Christian 56.3 15 McDonough 52.7 36 Pike 57.1 11 Saline 49.4 62Clark 48.3 66 McHenry 47.2 73 Grundy 57.1 12 Lawrence 49.3 63Clay 50.7 52 McLean 54.4 24 Cumberland 57.0 13 Macoupin 48.8 64Clinton 41.1 96 Menard 50.8 51 Randolph 56.3 14 Kendall 48.4 65Coles 47.9 69 Mercer 48.2 67 Christian 56.3 15 Clark 48.3 66Cook 52.7 35 Monroe 50.6 54 Washington 56.1 16 Mercer 48.2 67Crawford 49.7 58 Montgomery 54.6 22 Woodford 55.9 17 Morgan 48.1 68Cumberland 57.0 13 Morgan 48.1 68 Moultrie 55.8 18 Coles 47.9 69DeKalb 51.1 47 Moultrie 55.8 18 Putnam 55.2 19 Mason 47.5 70DeWitt 49.6 59 Ogle 42.6 93 Wayne 55.0 20 Fulton 47.5 71
Douglas 54.6 21 Peoria 44.2 87 Douglas 54.6 21 Bond 47.3 72DuPage 51.6 41 Perry 51.1 48 Montgomery 54.6 22 McHenry 47.2 73Edgar 54.0 29 Piatt 57.5 9 Bureau 54.5 23 LaSalle 47.1 74Edwards 49.7 57 Pike 57.1 11 McLean 54.4 24 Madison 46.9 75Effingham 57.8 8 Pope 61.5 5 Jasper 54.4 25 Vermilion 46.9 76Fayette 44.7 85 Pulaski 49.9 56 Gallatin 54.3 26 Winnebago 46.4 77Ford 52.8 34 Putnam 55.2 19 Sangamon 54.2 27 White 46.2 78Franklin 45.2 81 Randolph 56.3 14 Schuyler 54.0 28 Scott 45.7 79Fulton 47.5 71 Richland 37.7 100 Edgar 54.0 29 Jersey 45.4 80Gallatin 54.3 26 Rock Island 37.4 101 Iroquois 53.9 30 Franklin 45.2 81
Greene 51.9 39 Saline 49.4 62 Adams 53.7 31 Boone 45.2 82Grundy 57.1 12 Sangamon 54.2 27 Shelby 53.2 32 Logan 44.8 83Hamilton 62.3 4 Schuyler 54.0 28 Will 53.0 33 Champaign 44.8 84Hancock 51.6 42 Scott 45.7 79 Ford 52.8 34 Fayette 44.7 85Hardin 57.2 10 Shelby 53.2 32 Cook 52.7 35 Union 44.5 86Henderson 68.3 1 St. Clair 42.3 94 McDonough 52.7 36 Peoria 44.2 87Henry 52.2 37 Stark 41.4 95 Henry 52.2 37 Carroll 44.1 88Iroquois 53.9 30 Stephenson 43.0 92 Williamson 52.2 38 Wabash 43.9 89Jackson 39.6 99 Tazewell 51.7 40 Greene 51.9 39 Marion 43.2 90Jasper 54.4 25 Union 44.5 86 Tazewell 51.7 40 Lee 43.1 91
Jefferson 51.2 46 Vermilion 46.9 76 DuPage 51.6 41 Stephenson 43.0 92Jersey 45.4 80 Wabash 43.9 89 Hancock 51.6 42 Ogle 42.6 93Jo Daviess 50.6 53 Warren 51.3 43 Warren 51.3 43 St. Clair 42.3 94Johnson 59.1 6 Washington 56.1 16 Kankakee 51.3 44 Stark 41.4 95Kane 49.6 60 Wayne 55.0 20 Lake 51.3 45 Clinton 41.1 96Kankakee 51.3 44 White 46.2 78 Jefferson 51.2 46 Massac 40.9 97Kendall 48.4 65 Whiteside 50.2 55 DeKalb 51.1 47 Cass 40.3 98Knox 49.5 61 Will 53.0 33 Perry 51.1 48 Jackson 39.6 99Lake 51.3 45 Williamson 52.2 38 Macon 51.0 49 Richland 37.7 100LaSalle 47.1 74 Winnebago 46.4 77 Marshall 50.8 50 Rock Island 37.4 101Lawrence 49.3 63 Woodford 55.9 17 Menard 50.8 51 Alexander 37.3 102

Illinois County Data Book / 173
TABLE 57: NUMBER OF REPUBLICAN BALLOTS IN THE 2012 PRIMARY ELECTION
By county In rank order
County Rank County Rank County Rank County Rank
Adams 7,854 21 Lee 5,187 31 Cook 200,750 1 Clinton 3,072 52Alexander 435 100 Livingston 6,850 24 DuPage 106,686 2 Shelby 2,825 53Bond 1,355 84 Logan 4,083 39 Lake 60,270 3 Marion 2,797 54Boone 6,282 27 Macon 9,499 18 Will 53,727 4 Carroll 2,775 55Brown 589 99 Macoupin 3,126 50 Kane 41,063 5 Ford 2,757 56Bureau 4,342 37 Madison 18,768 10 McHenry 33,268 6 Crawford 2,671 57Calhoun 312 102 Marion 2,797 54 Winnebago 29,776 7 Fulton 2,627 58Carroll 2,775 55 Marshall 1,643 77 McLean 21,980 8 Clark 2,599 59Cass 902 92 Mason 1,184 87 Sangamon 20,261 9 Edgar 2,504 60Champaign 17,884 11 Massac 1,744 73 Madison 18,768 10 Christian 2,437 61
Christian 2,437 61 McDonough 3,465 45 Champaign 17,884 11 Johnson 2,407 62Clark 2,599 59 McHenry 33,268 6 Tazewell 17,362 12 Warren 2,363 63Clay 1,473 82 McLean 21,980 8 Peoria 16,705 13 Saline 2,267 64Clinton 3,072 52 Menard 1,657 76 St. Clair 15,746 14 Montgomery 2,253 65Coles 6,202 28 Mercer 2,137 69 Kendall 11,540 15 Pike 2,169 66Cook 200,750 1 Monroe 3,080 51 DeKalb 10,426 16 Union 2,166 67Crawford 2,671 57 Montgomery 2,253 65 LaSalle 10,238 17 Randolph 2,156 68Cumberland 1,583 78 Morgan 4,497 35 Macon 9,499 18 Mercer 2,137 69DeKalb 10,426 16 Moultrie 1,663 75 Rock Island 9,235 19 Wayne 2,122 70DeWitt 3,876 42 Ogle 9,005 20 Ogle 9,005 20 Fayette 2,060 71
Douglas 3,381 46 Peoria 16,705 13 Adams 7,854 21 Jersey 1,846 72DuPage 106,686 2 Perry 1,570 79 Kankakee 7,755 22 Massac 1,744 73Edgar 2,504 60 Piatt 3,131 49 Williamson 6,877 23 Richland 1,702 74Edwards 973 90 Pike 2,169 66 Livingston 6,850 24 Moultrie 1,663 75Effingham 4,735 33 Pope 692 96 Woodford 6,798 25 Menard 1,657 76Fayette 2,060 71 Pulaski 617 98 Vermilion 6,718 26 Marshall 1,643 77Ford 2,757 56 Putnam 649 97 Boone 6,282 27 Cumberland 1,583 78Franklin 3,165 48 Randolph 2,156 68 Coles 6,202 28 Perry 1,570 79Fulton 2,627 58 Richland 1,702 74 Stephenson 5,666 29 Greene 1,564 80Gallatin 316 101 Rock Island 9,235 19 Iroquois 5,528 30 White 1,497 81
Greene 1,564 80 Saline 2,267 64 Lee 5,187 31 Clay 1,473 82Grundy 4,906 32 Sangamon 20,261 9 Grundy 4,906 32 Lawrence 1,420 83Hamilton 957 91 Schuyler 1,089 89 Effingham 4,735 33 Bond 1,355 84Hancock 3,835 43 Scott 1,204 86 Henry 4,528 34 Jasper 1,331 85Hardin 719 95 Shelby 2,825 53 Morgan 4,497 35 Scott 1,204 86Henderson 726 94 St. Clair 15,746 14 Whiteside 4,475 36 Mason 1,184 87Henry 4,528 34 Stark 810 93 Bureau 4,342 37 Wabash 1,120 88Iroquois 5,528 30 Stephenson 5,666 29 Knox 4,307 38 Schuyler 1,089 89Jackson 3,653 44 Tazewell 17,362 12 Logan 4,083 39 Edwards 973 90Jasper 1,331 85 Union 2,166 67 Jo Daviess 3,992 40 Hamilton 957 91
Jefferson 3,969 41 Vermilion 6,718 26 Jefferson 3,969 41 Cass 902 92Jersey 1,846 72 Wabash 1,120 88 DeWitt 3,876 42 Stark 810 93Jo Daviess 3,992 40 Warren 2,363 63 Hancock 3,835 43 Henderson 726 94Johnson 2,407 62 Washington 3,220 47 Jackson 3,653 44 Hardin 719 95Kane 41,063 5 Wayne 2,122 70 McDonough 3,465 45 Pope 692 96Kankakee 7,755 22 White 1,497 81 Douglas 3,381 46 Putnam 649 97Kendall 11,540 15 Whiteside 4,475 36 Washington 3,220 47 Pulaski 617 98Knox 4,307 38 Will 53,727 4 Franklin 3,165 48 Brown 589 99Lake 60,270 3 Williamson 6,877 23 Piatt 3,131 49 Alexander 435 100LaSalle 10,238 17 Winnebago 29,776 7 Macoupin 3,126 50 Gallatin 316 101Lawrence 1,420 83 Woodford 6,798 25 Monroe 3,080 51 Calhoun 312 102

174 / Illinois County Data Book
TABLE 58: NUMBER OF DEMOCRATIC BALLOTS IN THE 2012 PRIMARY ELECTION
By county In rank order
County Rank County Rank County Rank County Rank
Adams 1,420 44 Lee 771 59 Cook 440,873 1 Boone 957 52Alexander 345 89 Livingston 593 65 DuPage 30,321 2 Perry 932 53Bond 454 80 Logan 374 87 Lake 29,961 3 McDonough 913 54Boone 957 52 Macon 6,200 11 Will 23,022 4 Jersey 893 55Brown 168 99 Macoupin 4,313 17 St. Clair 18,305 5 Ogle 880 56Bureau 1,165 49 Madison 9,958 9 Winnebago 13,383 6 Shelby 874 57Calhoun 1,492 41 Marion 1,133 50 Rock Island 12,072 7 Putnam 824 58Carroll 491 72 Marshall 250 94 Kane 11,343 8 Lee 771 59Cass 366 88 Mason 1,943 32 Madison 9,958 9 White 771 59Champaign 8,075 10 Massac 403 85 Champaign 8,075 10 Jo Daviess 681 61
Christian 2,120 29 McDonough 913 54 Macon 6,200 11 Washington 647 62Clark 605 63 McHenry 5,585 13 Sangamon 5,879 12 Clark 605 63Clay 315 92 McLean 3,005 23 McHenry 5,585 13 DeWitt 604 64Clinton 523 71 Menard 190 98 Franklin 5,583 14 Livingston 593 65Coles 1,646 38 Mercer 1,461 43 Peoria 5,431 15 Crawford 588 66Cook 440,873 1 Monroe 1,191 48 Kankakee 4,500 16 Hardin 576 67Crawford 588 66 Montgomery 1,270 45 Macoupin 4,313 17 Woodford 561 68Cumberland 427 83 Morgan 1,071 51 Jefferson 4,259 18 Piatt 547 69DeKalb 1,983 31 Moultrie 432 82 LaSalle 4,017 19 Pope 542 70DeWitt 604 64 Ogle 880 56 Williamson 3,781 20 Clinton 523 71
Douglas 344 90 Peoria 5,431 15 Randolph 3,641 21 Carroll 491 72DuPage 30,321 2 Perry 932 53 Tazewell 3,281 22 Richland 491 72Edgar 393 86 Piatt 547 69 McLean 3,005 23 Wayne 489 74Edwards 157 101 Pike 1,871 33 Jackson 2,755 24 Lawrence 484 75Effingham 1,733 35 Pope 542 70 Kendall 2,594 25 Johnson 483 76Fayette 473 78 Pulaski 273 93 Whiteside 2,404 26 Warren 477 77Ford 167 100 Putnam 824 58 Union 2,387 27 Fayette 473 78Franklin 5,583 14 Randolph 3,641 21 Fulton 2,351 28 Schuyler 465 79Fulton 2,351 28 Richland 491 72 Christian 2,120 29 Bond 454 80Gallatin 1,633 39 Rock Island 12,072 7 Grundy 1,987 30 Hancock 437 81
Greene 1,236 46 Saline 1,492 41 DeKalb 1,983 31 Moultrie 432 82Grundy 1,987 30 Sangamon 5,879 12 Mason 1,943 32 Cumberland 427 83Hamilton 1,214 47 Schuyler 465 79 Pike 1,871 33 Jasper 418 84Hancock 437 81 Scott 219 97 Vermilion 1,758 34 Massac 403 85Hardin 576 67 Shelby 874 57 Effingham 1,733 35 Edgar 393 86Henderson 236 96 St. Clair 18,305 5 Knox 1,724 36 Logan 374 87Henry 1,546 40 Stark 97 102 Stephenson 1,668 37 Cass 366 88Iroquois 337 91 Stephenson 1,668 37 Coles 1,646 38 Alexander 345 89Jackson 2,755 24 Tazewell 3,281 22 Gallatin 1,633 39 Douglas 344 90Jasper 418 84 Union 2,387 27 Henry 1,546 40 Iroquois 337 91
Jefferson 4,259 18 Vermilion 1,758 34 Calhoun 1,492 41 Clay 315 92Jersey 893 55 Wabash 246 95 Saline 1,492 41 Pulaski 273 93Jo Daviess 681 61 Warren 477 77 Mercer 1,461 43 Marshall 250 94Johnson 483 76 Washington 647 62 Adams 1,420 44 Wabash 246 95Kane 11,343 8 Wayne 489 74 Montgomery 1,270 45 Henderson 236 96Kankakee 4,500 16 White 771 59 Greene 1,236 46 Scott 219 97Kendall 2,594 25 Whiteside 2,404 26 Hamilton 1,214 47 Menard 190 98Knox 1,724 36 Will 23,022 4 Monroe 1,191 48 Brown 168 99Lake 29,961 3 Williamson 3,781 20 Bureau 1,165 49 Ford 167 100LaSalle 4,017 19 Winnebago 13,383 6 Marion 1,133 50 Edwards 157 101Lawrence 484 75 Woodford 561 68 Morgan 1,071 51 Stark 97 102

Illinois County Data Book / 175
TABLE 59: PERCENTAGE TURNOUT OF REGISTERED VOTERS IN THE 2012 GENERAL ELECTION
By county In rank order
County Rank County Rank County Rank County Rank
Adams 68.8% 41 Lee 70.7% 26 Jasper 75.0% 1 Cumberland 67.6% 52Alexander 65.5 69 Livingston 69.8 35 Putnam 74.8 2 Douglas 67.5 53Bond 59.8 95 Logan 62.6 84 Schuyler 74.8 3 Ogle 67.2 54Boone 66.4 63 Macon 64.7 73 Washington 74.6 4 Montgomery 67.1 55Brown 60.6 91 Macoupin 66.6 60 Pope 74.6 5 Coles 67.0 56Bureau 71.2 24 Madison 69.1 39 Piatt 74.3 6 Kane 67.0 57Calhoun 72.1 14 Marion 64.3 74 Hancock 74.0 7 Randolph 66.8 58Carroll 66.4 62 Marshall 70.1 33 Monroe 73.8 8 LaSalle 66.7 59Cass 52.4 101 Mason 60.9 88 Cook 73.0 9 Macoupin 66.6 60Champaign 69.9 34 Massac 61.3 86 Effingham 72.8 10 Saline 66.5 61
Christian 68.0 49 McDonough 65.9 67 Edwards 72.6 11 Carroll 66.4 62Clark 62.7 83 McHenry 66.2 64 Henderson 72.5 12 Boone 66.4 63Clay 59.9 93 McLean 72.0 15 Will 72.3 13 McHenry 66.2 64Clinton 69.7 36 Menard 71.0 25 Calhoun 72.1 14 Morgan 66.2 65Coles 67.0 56 Mercer 72.0 16 McLean 72.0 15 Woodford 66.1 66Cook 73.0 9 Monroe 73.8 8 Mercer 72.0 16 McDonough 65.9 67Crawford 61.0 87 Montgomery 67.1 55 DuPage 71.9 17 Warren 65.6 68Cumberland 67.6 52 Morgan 66.2 65 Sangamon 71.8 18 Alexander 65.5 69DeKalb 71.5 20 Moultrie 70.5 28 Rock Island 71.6 19 White 65.5 70DeWitt 63.8 77 Ogle 67.2 54 DeKalb 71.5 20 Stark 65.4 71
Douglas 67.5 53 Peoria 68.5 43 Jo Daviess 71.5 21 Gallatin 65.4 72DuPage 71.9 17 Perry 68.3 45 Kankakee 71.3 22 Macon 64.7 73Edgar 59.5 96 Piatt 74.3 6 Lake 71.2 23 Marion 64.3 74Edwards 72.6 11 Pike 62.2 85 Bureau 71.2 24 St. Clair 64.0 75Effingham 72.8 10 Pope 74.6 5 Menard 71.0 25 Scott 63.8 76Fayette 60.3 92 Pulaski 52.2 102 Lee 70.7 26 DeWitt 63.8 77Ford 68.4 44 Putnam 74.8 2 Hamilton 70.6 27 Richland 63.7 78Franklin 60.8 90 Randolph 66.8 58 Moultrie 70.5 28 Stephenson 63.7 79Fulton 60.8 89 Richland 63.7 78 Shelby 70.5 29 Greene 63.6 80Gallatin 65.4 72 Rock Island 71.6 19 Johnson 70.4 30 Vermilion 63.5 81
Greene 63.6 80 Saline 66.5 61 Knox 70.3 31 Winnebago 63.4 82Grundy 69.5 37 Sangamon 71.8 18 Union 70.3 32 Clark 62.7 83Hamilton 70.6 27 Schuyler 74.8 3 Marshall 70.1 33 Logan 62.6 84Hancock 74.0 7 Scott 63.8 76 Champaign 69.9 34 Pike 62.2 85Hardin 68.6 42 Shelby 70.5 29 Livingston 69.8 35 Massac 61.3 86Henderson 72.5 12 St. Clair 64.0 75 Clinton 69.7 36 Crawford 61.0 87Henry 68.0 50 Stark 65.4 71 Grundy 69.5 37 Mason 60.9 88Iroquois 68.3 46 Stephenson 63.7 79 Kendall 69.5 38 Fulton 60.8 89Jackson 57.4 98 Tazewell 69.0 40 Madison 69.1 39 Franklin 60.8 90Jasper 75.0 1 Union 70.3 32 Tazewell 69.0 40 Brown 60.6 91
Jefferson 68.1 48 Vermilion 63.5 81 Adams 68.8 41 Fayette 60.3 92Jersey 57.0 99 Wabash 56.7 100 Hardin 68.6 42 Clay 59.9 93Jo Daviess 71.5 21 Warren 65.6 68 Peoria 68.5 43 Wayne 59.9 94Johnson 70.4 30 Washington 74.6 4 Ford 68.4 44 Bond 59.8 95Kane 67.0 57 Wayne 59.9 94 Perry 68.3 45 Edgar 59.5 96Kankakee 71.3 22 White 65.5 70 Iroquois 68.3 46 Lawrence 57.9 97Kendall 69.5 38 Whiteside 68.1 47 Whiteside 68.1 47 Jackson 57.4 98Knox 70.3 31 Will 72.3 13 Jefferson 68.1 48 Jersey 57.0 99Lake 71.2 23 Williamson 67.7 51 Christian 68.0 49 Wabash 56.7 100LaSalle 66.7 59 Winnebago 63.4 82 Henry 68.0 50 Cass 52.4 101Lawrence 57.9 97 Woodford 66.1 66 Williamson 67.7 51 Pulaski 52.2 102
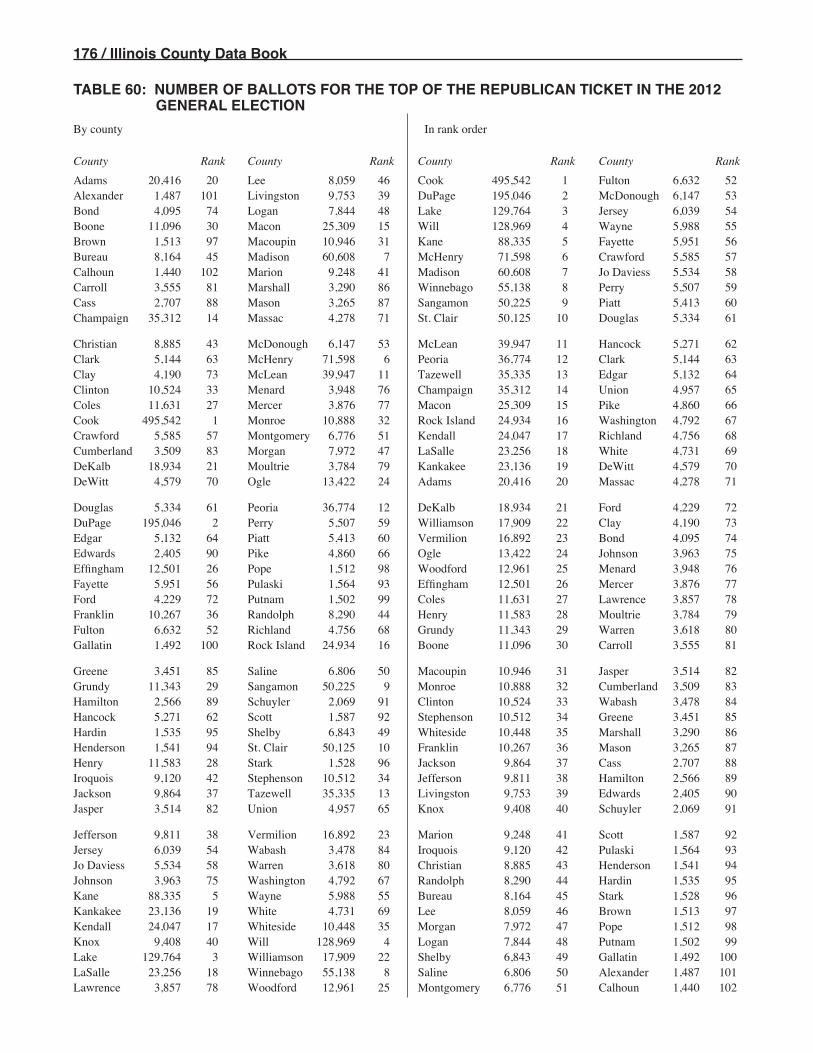
176 / Illinois County Data Book
TABLE 60: NUMBER OF BALLOTS FOR THE TOP OF THE REPUBLICAN TICKET IN THE 2012 GENERAL ELECTION
By county In rank order
County Rank County Rank County Rank County Rank
Adams 20,416 20 Lee 8,059 46 Cook 495,542 1 Fulton 6,632 52Alexander 1,487 101 Livingston 9,753 39 DuPage 195,046 2 McDonough 6,147 53Bond 4,095 74 Logan 7,844 48 Lake 129,764 3 Jersey 6,039 54Boone 11,096 30 Macon 25,309 15 Will 128,969 4 Wayne 5,988 55Brown 1,513 97 Macoupin 10,946 31 Kane 88,335 5 Fayette 5,951 56Bureau 8,164 45 Madison 60,608 7 McHenry 71,598 6 Crawford 5,585 57Calhoun 1,440 102 Marion 9,248 41 Madison 60,608 7 Jo Daviess 5,534 58Carroll 3,555 81 Marshall 3,290 86 Winnebago 55,138 8 Perry 5,507 59Cass 2,707 88 Mason 3,265 87 Sangamon 50,225 9 Piatt 5,413 60Champaign 35,312 14 Massac 4,278 71 St. Clair 50,125 10 Douglas 5,334 61
Christian 8,885 43 McDonough 6,147 53 McLean 39,947 11 Hancock 5,271 62Clark 5,144 63 McHenry 71,598 6 Peoria 36,774 12 Clark 5,144 63Clay 4,190 73 McLean 39,947 11 Tazewell 35,335 13 Edgar 5,132 64Clinton 10,524 33 Menard 3,948 76 Champaign 35,312 14 Union 4,957 65Coles 11,631 27 Mercer 3,876 77 Macon 25,309 15 Pike 4,860 66Cook 495,542 1 Monroe 10,888 32 Rock Island 24,934 16 Washington 4,792 67Crawford 5,585 57 Montgomery 6,776 51 Kendall 24,047 17 Richland 4,756 68Cumberland 3,509 83 Morgan 7,972 47 LaSalle 23,256 18 White 4,731 69DeKalb 18,934 21 Moultrie 3,784 79 Kankakee 23,136 19 DeWitt 4,579 70DeWitt 4,579 70 Ogle 13,422 24 Adams 20,416 20 Massac 4,278 71
Douglas 5,334 61 Peoria 36,774 12 DeKalb 18,934 21 Ford 4,229 72DuPage 195,046 2 Perry 5,507 59 Williamson 17,909 22 Clay 4,190 73Edgar 5,132 64 Piatt 5,413 60 Vermilion 16,892 23 Bond 4,095 74Edwards 2,405 90 Pike 4,860 66 Ogle 13,422 24 Johnson 3,963 75Effingham 12,501 26 Pope 1,512 98 Woodford 12,961 25 Menard 3,948 76Fayette 5,951 56 Pulaski 1,564 93 Effingham 12,501 26 Mercer 3,876 77Ford 4,229 72 Putnam 1,502 99 Coles 11,631 27 Lawrence 3,857 78Franklin 10,267 36 Randolph 8,290 44 Henry 11,583 28 Moultrie 3,784 79Fulton 6,632 52 Richland 4,756 68 Grundy 11,343 29 Warren 3,618 80Gallatin 1,492 100 Rock Island 24,934 16 Boone 11,096 30 Carroll 3,555 81
Greene 3,451 85 Saline 6,806 50 Macoupin 10,946 31 Jasper 3,514 82Grundy 11,343 29 Sangamon 50,225 9 Monroe 10,888 32 Cumberland 3,509 83Hamilton 2,566 89 Schuyler 2,069 91 Clinton 10,524 33 Wabash 3,478 84Hancock 5,271 62 Scott 1,587 92 Stephenson 10,512 34 Greene 3,451 85Hardin 1,535 95 Shelby 6,843 49 Whiteside 10,448 35 Marshall 3,290 86Henderson 1,541 94 St. Clair 50,125 10 Franklin 10,267 36 Mason 3,265 87Henry 11,583 28 Stark 1,528 96 Jackson 9,864 37 Cass 2,707 88Iroquois 9,120 42 Stephenson 10,512 34 Jefferson 9,811 38 Hamilton 2,566 89Jackson 9,864 37 Tazewell 35,335 13 Livingston 9,753 39 Edwards 2,405 90Jasper 3,514 82 Union 4,957 65 Knox 9,408 40 Schuyler 2,069 91
Jefferson 9,811 38 Vermilion 16,892 23 Marion 9,248 41 Scott 1,587 92Jersey 6,039 54 Wabash 3,478 84 Iroquois 9,120 42 Pulaski 1,564 93Jo Daviess 5,534 58 Warren 3,618 80 Christian 8,885 43 Henderson 1,541 94Johnson 3,963 75 Washington 4,792 67 Randolph 8,290 44 Hardin 1,535 95Kane 88,335 5 Wayne 5,988 55 Bureau 8,164 45 Stark 1,528 96Kankakee 23,136 19 White 4,731 69 Lee 8,059 46 Brown 1,513 97Kendall 24,047 17 Whiteside 10,448 35 Morgan 7,972 47 Pope 1,512 98Knox 9,408 40 Will 128,969 4 Logan 7,844 48 Putnam 1,502 99Lake 129,764 3 Williamson 17,909 22 Shelby 6,843 49 Gallatin 1,492 100LaSalle 23,256 18 Winnebago 55,138 8 Saline 6,806 50 Alexander 1,487 101Lawrence 3,857 78 Woodford 12,961 25 Montgomery 6,776 51 Calhoun 1,440 102

Illinois County Data Book / 177
TABLE 61: NUMBER OF BALLOTS FOR THE TOP OF THE DEMOCRATIC TICKET IN THE 2012 GENERAL ELECTION
By county In rank order
County Rank County Rank County Rank County Rank
Adams 9,648 29 Lee 6,937 37 Cook 1,488,537 1 Logan 3,978 52Alexander 1,965 83 Livingston 5,020 49 DuPage 199,460 2 Effingham 3,861 53Bond 3,020 63 Logan 3,978 52 Lake 153,757 3 Perry 3,819 54Boone 9,883 28 Macon 22,780 17 Will 144,229 4 Saline 3,701 55Brown 787 99 Macoupin 9,464 31 Kane 90,332 5 Jersey 3,667 56Bureau 8,134 35 Madison 58,922 9 St. Clair 67,285 6 Carroll 3,665 57Calhoun 1,080 96 Marion 6,225 38 Winnebago 61,732 7 Hancock 3,650 58Carroll 3,665 57 Marshall 2,455 70 McHenry 59,797 8 Iroquois 3,413 59Cass 2,053 79 Mason 2,867 64 Madison 58,922 9 Shelby 3,342 60Champaign 40,831 11 Massac 2,092 78 Sangamon 42,107 10 Union 3,137 61
Christian 5,494 47 McDonough 5,967 41 Champaign 40,831 11 Piatt 3,090 62Clark 2,591 68 McHenry 59,797 8 Peoria 40,209 12 Bond 3,020 63Clay 1,584 88 McLean 31,883 14 Rock Island 39,157 13 Mason 2,867 64Clinton 5,596 45 Menard 2,100 77 McLean 31,883 14 Crawford 2,858 65Coles 9,262 33 Mercer 4,507 50 Tazewell 24,438 15 Fayette 2,853 66Cook 1,488,537 1 Monroe 6,215 39 LaSalle 23,073 16 DeWitt 2,601 67Crawford 2,858 65 Montgomery 5,058 48 Macon 22,780 17 Clark 2,591 68Cumberland 1,641 86 Morgan 5,806 42 Kendall 22,471 18 Edgar 2,565 69DeKalb 21,207 20 Moultrie 2,144 76 Kankakee 21,595 19 Marshall 2,455 70DeWitt 2,601 67 Ogle 9,514 30 DeKalb 21,207 20 Washington 2,450 71
Douglas 2,430 72 Peoria 40,209 12 Whiteside 14,833 21 Douglas 2,430 72DuPage 199,460 2 Perry 3,819 54 Knox 13,451 22 Richland 2,362 73Edgar 2,565 69 Piatt 3,090 62 Jackson 13,319 23 Pike 2,278 74Edwards 754 100 Pike 2,278 74 Vermilion 12,878 24 White 2,188 75Effingham 3,861 53 Pope 650 102 Henry 12,332 25 Moultrie 2,144 76Fayette 2,853 66 Pulaski 1,389 93 Williamson 10,647 26 Menard 2,100 77Ford 1,656 85 Putnam 1,559 90 Stephenson 10,165 27 Massac 2,092 78Franklin 7,254 36 Randolph 5,759 43 Boone 9,883 28 Cass 2,053 79Fulton 8,328 34 Richland 2,362 73 Adams 9,648 29 Greene 2,023 80Gallatin 1,029 97 Rock Island 39,157 13 Ogle 9,514 30 Lawrence 2,011 81
Greene 2,023 80 Saline 3,701 55 Macoupin 9,464 31 Henderson 1,978 82Grundy 9,451 32 Sangamon 42,107 10 Grundy 9,451 32 Alexander 1,965 83Hamilton 1,269 94 Schuyler 1,727 84 Coles 9,262 33 Schuyler 1,727 84Hancock 3,650 58 Scott 910 98 Fulton 8,328 34 Ford 1,656 85Hardin 742 101 Shelby 3,342 60 Bureau 8,134 35 Cumberland 1,641 86Henderson 1,978 82 St. Clair 67,285 6 Franklin 7,254 36 Wabash 1,590 87Henry 12,332 25 Stark 1,095 95 Lee 6,937 37 Clay 1,584 88Iroquois 3,413 59 Stephenson 10,165 27 Marion 6,225 38 Johnson 1,572 89Jackson 13,319 23 Tazewell 24,438 15 Monroe 6,215 39 Putnam 1,559 90Jasper 1,436 92 Union 3,137 61 Jefferson 6,089 40 Wayne 1,514 91
Jefferson 6,089 40 Vermilion 12,878 24 McDonough 5,967 41 Jasper 1,436 92Jersey 3,667 56 Wabash 1,590 87 Morgan 5,806 42 Pulaski 1,389 93Jo Daviess 5,667 44 Warren 4,044 51 Randolph 5,759 43 Hamilton 1,269 94Johnson 1,572 89 Washington 2,450 71 Jo Daviess 5,667 44 Stark 1,095 95Kane 90,332 5 Wayne 1,514 91 Clinton 5,596 45 Calhoun 1,080 96Kankakee 21,595 19 White 2,188 75 Woodford 5,572 46 Gallatin 1,029 97Kendall 22,471 18 Whiteside 14,833 21 Christian 5,494 47 Scott 910 98Knox 13,451 22 Will 144,229 4 Montgomery 5,058 48 Brown 787 99Lake 153,757 3 Williamson 10,647 26 Livingston 5,020 49 Edwards 754 100LaSalle 23,073 16 Winnebago 61,732 7 Mercer 4,507 50 Hardin 742 101Lawrence 2,011 81 Woodford 5,572 46 Warren 4,044 51 Pope 650 102


Sources,Methodology,and Appendices
Part 4Stark

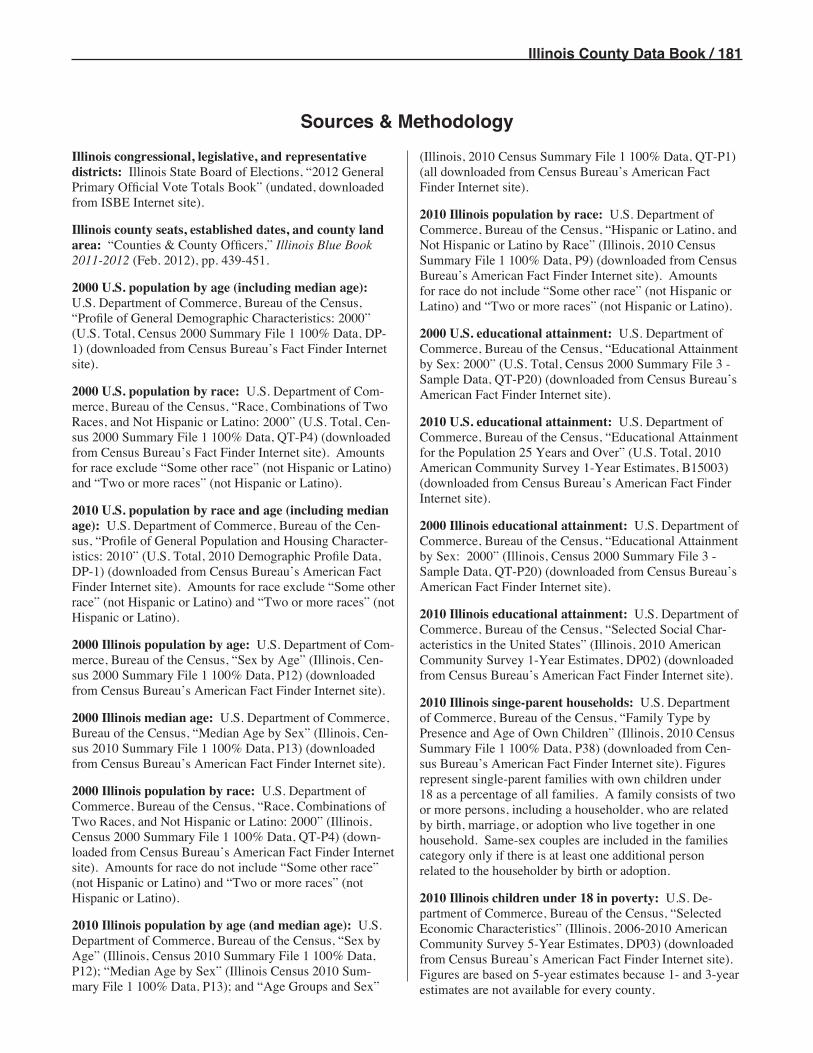
Illinois County Data Book / 181
Sources & MethodologyIllinois congressional, legislative, and representative districts: Illinois State Board of Elections, “2012 General Primary Official Vote Totals Book” (undated, downloaded from ISBE Internet site).
Illinois county seats, established dates, and county land area: “Counties & County Officers,” Illinois Blue Book 2011-2012 (Feb. 2012), pp. 439-451.
2000 U.S. population by age (including median age): U.S. Department of Commerce, Bureau of the Census, “Profile of General Demographic Characteristics: 2000” (U.S. Total, Census 2000 Summary File 1 100% Data, DP-1) (downloaded from Census Bureau’s Fact Finder Internet site).
2000 U.S. population by race: U.S. Department of Com-merce, Bureau of the Census, “Race, Combinations of Two Races, and Not Hispanic or Latino: 2000” (U.S. Total, Cen-sus 2000 Summary File 1 100% Data, QT-P4) (downloaded from Census Bureau’s Fact Finder Internet site). Amounts for race exclude “Some other race” (not Hispanic or Latino) and “Two or more races” (not Hispanic or Latino).
2010 U.S. population by race and age (including median age): U.S. Department of Commerce, Bureau of the Cen-sus, “Profile of General Population and Housing Character-istics: 2010” (U.S. Total, 2010 Demographic Profile Data, DP-1) (downloaded from Census Bureau’s American Fact Finder Internet site). Amounts for race exclude “Some other race” (not Hispanic or Latino) and “Two or more races” (not Hispanic or Latino).
2000 Illinois population by age: U.S. Department of Com-merce, Bureau of the Census, “Sex by Age” (Illinois, Cen-sus 2000 Summary File 1 100% Data, P12) (downloaded from Census Bureau’s American Fact Finder Internet site).
2000 Illinois median age: U.S. Department of Commerce, Bureau of the Census, “Median Age by Sex” (Illinois, Cen-sus 2010 Summary File 1 100% Data, P13) (downloaded from Census Bureau’s American Fact Finder Internet site).
2000 Illinois population by race: U.S. Department of Commerce, Bureau of the Census, “Race, Combinations of Two Races, and Not Hispanic or Latino: 2000” (Illinois, Census 2000 Summary File 1 100% Data, QT-P4) (down-loaded from Census Bureau’s American Fact Finder Internet site). Amounts for race do not include “Some other race” (not Hispanic or Latino) and “Two or more races” (not Hispanic or Latino).
2010 Illinois population by age (and median age): U.S. Department of Commerce, Bureau of the Census, “Sex by Age” (Illinois, Census 2010 Summary File 1 100% Data, P12); “Median Age by Sex” (Illinois Census 2010 Sum-mary File 1 100% Data, P13); and “Age Groups and Sex”
(Illinois, 2010 Census Summary File 1 100% Data, QT-P1) (all downloaded from Census Bureau’s American Fact Finder Internet site).
2010 Illinois population by race: U.S. Department of Commerce, Bureau of the Census, “Hispanic or Latino, and Not Hispanic or Latino by Race” (Illinois, 2010 Census Summary File 1 100% Data, P9) (downloaded from Census Bureau’s American Fact Finder Internet site). Amounts for race do not include “Some other race” (not Hispanic or Latino) and “Two or more races” (not Hispanic or Latino).
2000 U.S. educational attainment: U.S. Department of Commerce, Bureau of the Census, “Educational Attainment by Sex: 2000” (U.S. Total, Census 2000 Summary File 3 - Sample Data, QT-P20) (downloaded from Census Bureau’s American Fact Finder Internet site).
2010 U.S. educational attainment: U.S. Department of Commerce, Bureau of the Census, “Educational Attainment for the Population 25 Years and Over” (U.S. Total, 2010 American Community Survey 1-Year Estimates, B15003) (downloaded from Census Bureau’s American Fact Finder Internet site).
2000 Illinois educational attainment: U.S. Department of Commerce, Bureau of the Census, “Educational Attainment by Sex: 2000” (Illinois, Census 2000 Summary File 3 - Sample Data, QT-P20) (downloaded from Census Bureau’s American Fact Finder Internet site).
2010 Illinois educational attainment: U.S. Department of Commerce, Bureau of the Census, “Selected Social Char-acteristics in the United States” (Illinois, 2010 American Community Survey 1-Year Estimates, DP02) (downloaded from Census Bureau’s American Fact Finder Internet site).
2010 Illinois singe-parent households: U.S. Department of Commerce, Bureau of the Census, “Family Type by Presence and Age of Own Children” (Illinois, 2010 Census Summary File 1 100% Data, P38) (downloaded from Cen-sus Bureau’s American Fact Finder Internet site). Figures represent single-parent families with own children under 18 as a percentage of all families. A family consists of two or more persons, including a householder, who are related by birth, marriage, or adoption who live together in one household. Same-sex couples are included in the families category only if there is at least one additional person related to the householder by birth or adoption.
2010 Illinois children under 18 in poverty: U.S. De-partment of Commerce, Bureau of the Census, “Selected Economic Characteristics” (Illinois, 2006-2010 American Community Survey 5-Year Estimates, DP03) (downloaded from Census Bureau’s American Fact Finder Internet site). Figures are based on 5-year estimates because 1- and 3-year estimates are not available for every county.

182 / Illinois County Data Book
2000, 2005, and 2010 U.S. and Illinois income per capita: U.S. Department of Commerce, Bureau of Eco-nomic Analysis, “Personal Income Summary: per capita personal income (dollars)” (Illinois updated April 25, 2012, U.S. updated March 28, 2012) (U.S. Total, Illinois Total, and Illinois counties, Table CA1-3, downloaded from BEA Internet site).
U.S. and Illinois Elections: Illinois State Board of Elec-tions, Official Vote Cast at the General Election (various years); Official Vote Cast at the General Primary Election (various years); and “Candidate Totals By County” (down-loadable vote totals, tables, various years) (downloaded from ISBE Internet site).
2000 and 2010 U.S. Employment: U.S. Department of Labor, Bureau of Labor Statistics, “Labor Force Statistics from the Current Population Survey” (Household Data, Table A-1) (downloaded from DoL’s Data Retrieval: Labor Force Statistics (CPS) Internet site).
2000 and 2010 Illinois Employment: Illinois Department of Employment Statistics, “Annual Average Data: Coun-ties” (2000 and 2010) (spreadsheets, downloaded from IDES Internet site).
Illinois household income: U.S. Department of Com-merce, Bureau of the Census, “Selected Economic Char-acteristics” (Illinois, 2006-2010 American Community Survey 5-Year Estimates, DP03) (downloaded from Census Bureau’s American Fact Finder Internet site).
U.S. and Illinois jobs by industry: U.S. Department of Commerce, Bureau of Economic Analysis, “Total full-time and part-time employment by NAICS industry” (Illinois counties, and U.S. Total, Regional GDP & Personal Income data, CA25N) (updated Apr. 25, 2012) and “Total full-time and part-time employment by NAICS industry” (United States total, Regional GDP & Personal Income data, SA25N) (updated March 28, 2012) (both downloaded from BEA Internet site).
Amounts for county are the county’s percentages of the types of jobs in the county; amounts for the state are the county’s percentage of that type of job statewide. Some industry-specific county data were withheld to avoid disclosure of confidential information; those data are not included in the county breakdowns, but are included in to-tal jobs for the county. Percentages may not add to 100% because totals include jobs withheld from industry data by county. Data are nearly complete for most categories, except forestry, mining, and utilities—locations of over 35% of those jobs statewide were withheld.
State sales & use tax: Illinois Department of Revenue, “FY 2011 Municipal and County Share of State Sales and Use Taxes” (undated, spreadsheet). Estimates are local share multiplied by 6.25.
Individual income tax: Illinois Department of Revenue, “Individual Income Tax: County Report - Tax Year: 2010 - Final” (Aug. 2012) (spreadsheet).
State motor fuel tax: Estimates are each county’s pro-portional share of total calendar year 2011 motor fuel tax, based on sales tax collections at filling stations and conve-nience stores. Provided Sept. 2012 by Illinois Department of Transportation.
Local property tax: Illinois Department of Revenue, “Comparison of Taxes Extended and Collected by Selected Classes of Property” (undated, spreadsheet, 2008 Property Tax Statistics), Table 19 (downloaded from IDOR Internet site). Includes collections from taxes on real estate and railroad properties.
School district expenditures: Illinois State Board of Education, “FY 2011 County State Dist Disbursements” (undated, spreadsheet). Includes only state funds to school districts; excludes federal funds and funds to regional offices.
Medicaid expenditures: Illinois Department of Human Services, Bureau of Research and Analysis, “Fiscal Year 2011: Grant and Medical Expenditures” (undated, table). Some counties have consolidated spending; the totals for those counties are shown as combined totals.
State payroll and number of employees: Office of the Comptroller, “State Employee Numbers and Cost CY 2011” (spreadsheet). These amounts overstate total em-ployment costs to the state because they include employees paid with non-state (such as federal) funds. The numbers of employees include anyone receiving a paycheck from the state in calendar year 2011; but exclude state college and university employees. Location is based on voting address, not where employees work.
Land use: Illinois Department of Revenue, “Comparison of Equalized Assessed Valuations by Class of Property (Thousands of dollars),” 1999 Illinois Property Tax Statis-tics (June 2002), pp. 164-165, Table 15 and “Comparison of Equalized Assessed Valuations by Class of Property” (undated, spreadsheet, 2009 Property Tax Statistics), Table 15 (downloaded from IDOR Internet site).
Number of farms: U.S. Department of Agriculture, National Agricultural Statistics Service, “County Summary Highlights: 2007” (2007 Census of Agriculture, County Data, updated Dec. 2009), Table 1 and “County Summary Highlights: 1997” (1997 Census of Agriculture, County Data, March 1999) (both downloaded from U.S. DoAg Internet site).
Foreign ownership of agricultural land: U.S. Depart-ment of Agriculture, Farm Service Agency, “U.S. Land-holdings of Foreign Investors by Type of Land Use and by State and County as of February 28, 2010” (Foreign Holdings of U.S. Agricultural Land as of February 28, 2010, undated), Report 3.
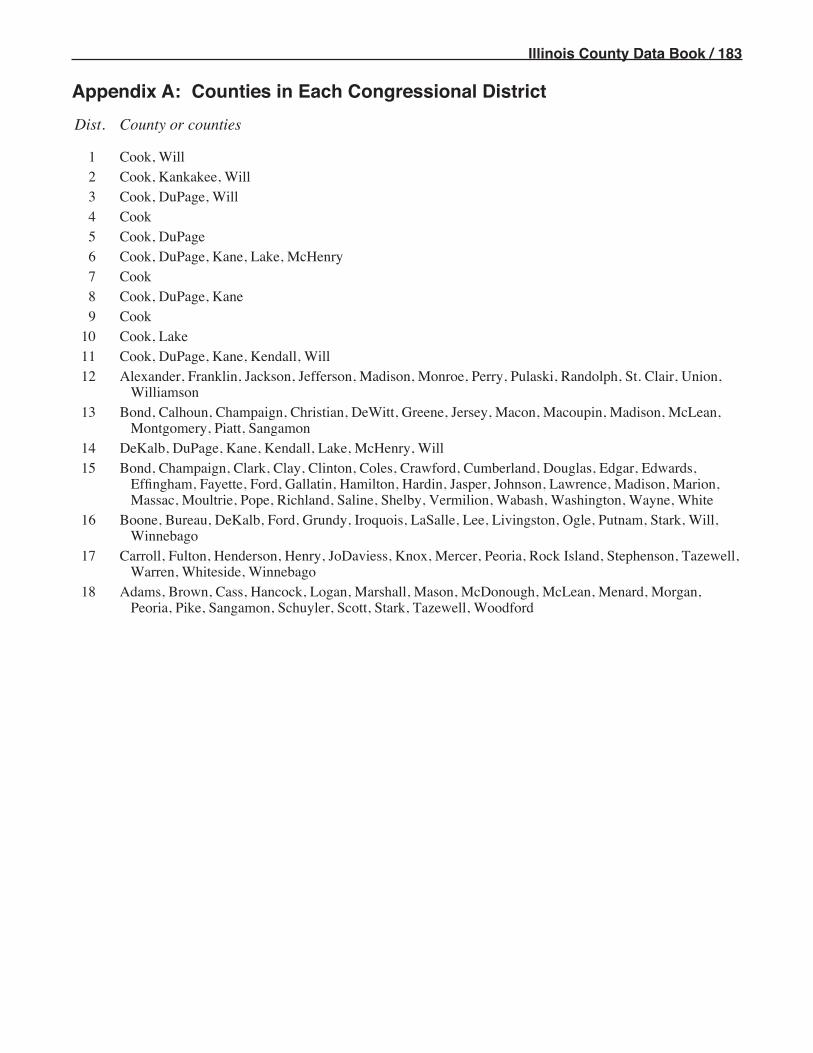
Illinois County Data Book / 183
Appendix A: Counties in Each Congressional District Dist. County or counties
1 Cook, Will 2 Cook, Kankakee, Will 3 Cook, DuPage, Will 4 Cook 5 Cook, DuPage 6 Cook, DuPage, Kane, Lake, McHenry 7 Cook 8 Cook, DuPage, Kane 9 Cook 10 Cook, Lake 11 Cook, DuPage, Kane, Kendall, Will 12 Alexander, Franklin, Jackson, Jefferson, Madison, Monroe, Perry, Pulaski, Randolph, St. Clair, Union,
Williamson 13 Bond, Calhoun, Champaign, Christian, DeWitt, Greene, Jersey, Macon, Macoupin, Madison, McLean,
Montgomery, Piatt, Sangamon 14 DeKalb, DuPage, Kane, Kendall, Lake, McHenry, Will 15 Bond, Champaign, Clark, Clay, Clinton, Coles, Crawford, Cumberland, Douglas, Edgar, Edwards,
Effingham, Fayette, Ford, Gallatin, Hamilton, Hardin, Jasper, Johnson, Lawrence, Madison, Marion, Massac, Moultrie, Pope, Richland, Saline, Shelby, Vermilion, Wabash, Washington, Wayne, White
16 Boone, Bureau, DeKalb, Ford, Grundy, Iroquois, LaSalle, Lee, Livingston, Ogle, Putnam, Stark, Will, Winnebago
17 Carroll, Fulton, Henderson, Henry, JoDaviess, Knox, Mercer, Peoria, Rock Island, Stephenson, Tazewell, Warren, Whiteside, Winnebago
18 Adams, Brown, Cass, Hancock, Logan, Marshall, Mason, McDonough, McLean, Menard, Morgan, Peoria, Pike, Sangamon, Schuyler, Scott, Stark, Tazewell, Woodford
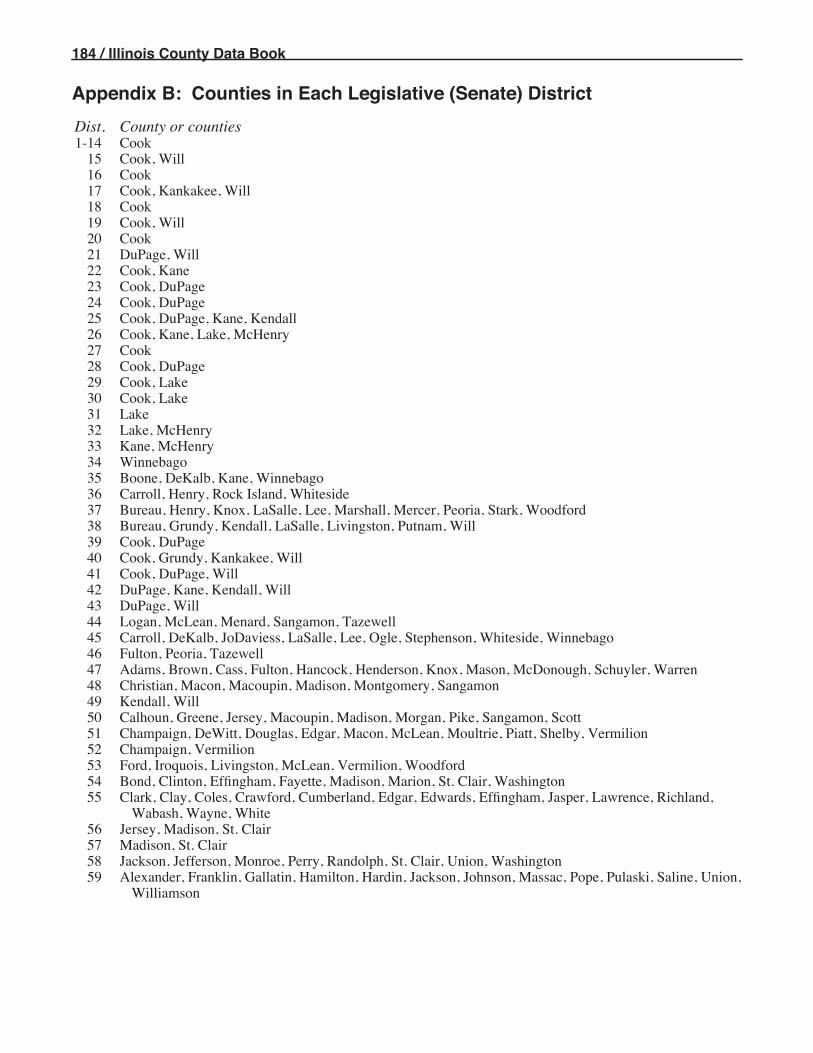
184 / Illinois County Data Book
Appendix B: Counties in Each Legislative (Senate) District Dist. County or counties 1-14 Cook 15 Cook, Will 16 Cook 17 Cook, Kankakee, Will 18 Cook 19 Cook, Will 20 Cook 21 DuPage, Will 22 Cook, Kane 23 Cook, DuPage 24 Cook, DuPage 25 Cook, DuPage, Kane, Kendall 26 Cook, Kane, Lake, McHenry 27 Cook 28 Cook, DuPage 29 Cook, Lake 30 Cook, Lake 31 Lake 32 Lake, McHenry 33 Kane, McHenry 34 Winnebago 35 Boone, DeKalb, Kane, Winnebago 36 Carroll, Henry, Rock Island, Whiteside 37 Bureau, Henry, Knox, LaSalle, Lee, Marshall, Mercer, Peoria, Stark, Woodford 38 Bureau, Grundy, Kendall, LaSalle, Livingston, Putnam, Will 39 Cook, DuPage 40 Cook, Grundy, Kankakee, Will 41 Cook, DuPage, Will 42 DuPage, Kane, Kendall, Will 43 DuPage, Will 44 Logan, McLean, Menard, Sangamon, Tazewell 45 Carroll, DeKalb, JoDaviess, LaSalle, Lee, Ogle, Stephenson, Whiteside, Winnebago 46 Fulton, Peoria, Tazewell 47 Adams, Brown, Cass, Fulton, Hancock, Henderson, Knox, Mason, McDonough, Schuyler, Warren 48 Christian, Macon, Macoupin, Madison, Montgomery, Sangamon 49 Kendall, Will 50 Calhoun, Greene, Jersey, Macoupin, Madison, Morgan, Pike, Sangamon, Scott 51 Champaign, DeWitt, Douglas, Edgar, Macon, McLean, Moultrie, Piatt, Shelby, Vermilion 52 Champaign, Vermilion 53 Ford, Iroquois, Livingston, McLean, Vermilion, Woodford 54 Bond, Clinton, Effingham, Fayette, Madison, Marion, St. Clair, Washington 55 Clark, Clay, Coles, Crawford, Cumberland, Edgar, Edwards, Effingham, Jasper, Lawrence, Richland,
Wabash, Wayne, White 56 Jersey, Madison, St. Clair 57 Madison, St. Clair 58 Jackson, Jefferson, Monroe, Perry, Randolph, St. Clair, Union, Washington 59 Alexander, Franklin, Gallatin, Hamilton, Hardin, Jackson, Johnson, Massac, Pope, Pulaski, Saline, Union,
Williamson

Illinois County Data Book / 185
Appendix C: Counties in Each Representative (House) District Dist. County or counties Dist. County or counties
77 Cook, DuPage 78 Cook 79 Grundy, Kankakee, Will 80 Cook, Will 81 DuPage, Will 82 Cook, DuPage, Will 83 Kane 84 DuPage, Kane, Kendall, Will 85 DuPage, Will 86 Will 87 Logan, Menard, Sangamon, Tazewell 88 McLean, Tazewell 89 Carroll, JoDaviess, Ogle, Stephenson,
Whiteside, Winnebago 90 DeKalb, LaSalle, Lee, Ogle, Winnebago 91 Fulton, Peoria, Tazewell 92 Peoria 93 Brown, Cass, Fulton, Knox, Mason,
McDonough, Schuyler, Warren 94 Adams, Hancock, Henderson, Warren 95 Christian, Macoupin, Madison, Montgomery 96 Christian, Macon, Sangamon 97 Kendall, Will 98 Will 99 Sangamon 100 Calhoun, Greene, Jersey, Macoupin, Madison,
Morgan, Pike, Sangamon, Scott 101 Champaign, DeWitt, Macon, McLean, Piatt 102 Champaign, Douglas, Edgar, Macon,
Moultrie, Shelby, Vermilion 103 Champaign 104 Champaign, Vermilion 105 Livingston, McLean 106 Ford, Iroquois, Livingston, Vermilion,
Woodford 107 Bond, Clinton, Effingham, Fayette, Marion 108 Clinton, Madison, St. Clair, Washington 109 Clay, Edwards, Effingham, Jasper, Lawrence,
Richland, Wabash, Wayne, White 110 Clark, Coles, Crawford, Cumberland, Edgar,
Lawrence 111 Jersey, Madison 112 Madison, St. Clair 113 Madison, St. Clair 114 St. Clair 115 Jackson, Jefferson, Perry, Union, Washington 116 Monroe, Perry, Randolph, St. Clair 117 Franklin, Hamilton, Williamson 118 Alexander, Gallatin, Hamilton, Hardin,
Jackson, Johnson, Massac, Pope, Pulaski, Saline, Union
1-28 Cook 29 Cook, Will 30 Cook 31 Cook 32 Cook 33 Cook 34 Cook, Kankakee, Will 35 Cook 36 Cook 37 Cook, Will 38 Cook, Will 39 Cook 40 Cook 41 DuPage, Will 42 DuPage 43 Cook, Kane 44 Cook 45 Cook, DuPage 46 DuPage 47 Cook, DuPage 48 DuPage 49 Cook, DuPage, Kane 50 Kane, Kendall 51 Cook, Lake 52 Cook, Kane, Lake, McHenry 53 Cook 54 Cook 55 Cook 56 Cook, DuPage 57 Cook, Lake 58 Cook, Lake 59 Cook, Lake 60 Lake 61 Lake 62 Lake 63 McHenry 64 Lake, McHenry 65 Kane, McHenry 66 Kane, McHenry 67 Winnebago 68 Winnebago 69 Boone, Winnebago 70 Boone, DeKalb, Kane 71 Carroll, Henry, Rock Island, Whiteside 72 Rock Island 73 Bureau, LaSalle, Marshall, Peoria, Stark,
Woodford 74 Bureau, Henry, Knox, Lee, Mercer 75 Grundy, Kendall, LaSalle, Will 76 Bureau, LaSalle, Livingston, Putnam