COUNTRY SPECIFIC GLOBAL FOREST DATA SET V
38
COUNTRY SPECIFIC GLOBAL FOREST DATA SET V.1 Brent Sohngen and Colleen Tennity Department of Agricultural, Environmental, and Development Economics Ohio State University 2120 Fyffe Rd. Columbus, OH 43210 Contact: [email protected] DRAFT: 11/30/04 ABSTRACT This paper describes a dataset containing inventory and economic information on global forests. Inventory information on the area of timber in productive forest types is furnished for different age classes, where that information is available. Inventory information for species without verifiable age class data is provided as well. Economic data on timber types is provided, including merchantable timber production functions, prices, rental values, and other information. The data was developed for the Global Trade and Analysis Project at Purdue University, with funding from the US Environmental Protection Agency. The paper describes the methods used to collect the data and provides individuals with information to help them use the data in modeling efforts. ACKNOWLEDGEMENT: The authors thank the US Environmental Protection Agency Climate Analysis Branch for funding the effort to assemble the data. In particular, Francisco DeLachesnaye, Ken Andrasko, and Steven Rose at USEPA provided numerous comments and ideas to assist the data development effort. The authors also appreciate comments from Tom Hertel, Robert McDougall, and Huey-Lin Lee at Purdue University, and Navin Ramankutty at the University of Wisconsin. All errors and omissions remain the responsibility of the authors alone. Copyright 2004 by Brent Sohngen and Colleen Tennity. All rights reserved. Readers may make verbatim copies of this document for non-commercial purposes by any means, provided that this copyright notice appears on all such copies.
Transcript of COUNTRY SPECIFIC GLOBAL FOREST DATA SET V

COUNTRY SPECIFIC GLOBAL FOREST DATA SET V.1
Brent Sohngen and Colleen Tennity
Department of Agricultural, Environmental, and Development Economics Ohio State University
2120 Fyffe Rd. Columbus, OH 43210
Contact: [email protected]
DRAFT: 11/30/04 ABSTRACT This paper describes a dataset containing inventory and economic information on global forests. Inventory information on the area of timber in productive forest types is furnished for different age classes, where that information is available. Inventory information for species without verifiable age class data is provided as well. Economic data on timber types is provided, including merchantable timber production functions, prices, rental values, and other information. The data was developed for the Global Trade and Analysis Project at Purdue University, with funding from the US Environmental Protection Agency. The paper describes the methods used to collect the data and provides individuals with information to help them use the data in modeling efforts. ACKNOWLEDGEMENT: The authors thank the US Environmental Protection Agency Climate Analysis Branch for funding the effort to assemble the data. In particular, Francisco DeLachesnaye, Ken Andrasko, and Steven Rose at USEPA provided numerous comments and ideas to assist the data development effort. The authors also appreciate comments from Tom Hertel, Robert McDougall, and Huey-Lin Lee at Purdue University, and Navin Ramankutty at the University of Wisconsin. All errors and omissions remain the responsibility of the authors alone. Copyright 2004 by Brent Sohngen and Colleen Tennity. All rights reserved. Readers may make verbatim copies of this document for non-commercial purposes by any means, provided that this copyright notice appears on all such copies.
1
COUNTRY SPECIFIC GLOBAL FOREST DATA SET V.1 INTRODUCTION
In recent years, considerable concern has been raised about the sustainability of the world's forested ecosystems (FAO, 2003). With deforestation rates in tropical regions estimated to be as high as 12 million hectares per year (FAO, 2003; Houghton, 2003), much of the concern has centered on deforestation on tropical areas. In contrast to deforestation in tropical areas, there is evidence that the area of forests in temperate regions is expanding. Given the large potential storage of carbon in both temperate and tropical forests, these changes in land use can potentially lead to large fluxes of carbon both to and from forests (Houghton, 2003; Plattner et al. 2002; Dixon et al., 1994). In addition to the potential carbon fluxes, forest management and land use change can potentially influence a host of other local and global environmental impacts.
Developing a better understanding of the relationship between forest management, land use, and environmental outcomes is an important objective. Numerous studies have explored these topics on local scales (i.e., Twalar et al., 2003; Chuo, 2001; Parks, et al., 2000; Nghi, 2002; Lynch and Talbott, 1995), however, few studies have explored how global demand for forest and agricultural products potentially influences production in forest industries, and the state of the future forest. For example, human consumption of forest and agricultural products will continue to change over time as population and incomes grow. Projections of demand and productivity in agriculture could have a large influence on the future area of forests, and future carbon flux. It is useful to develop modeling systems that explore how these changes may affect the relationship between agricultural and forest land globally. To support such a modeling exercise, it is imperative to begin developing datasets that can be used by modelers. Global models of forestry exist (i.e. Sohngen et al., 1999; Perez Garcia et al., 1997), and global models of agriculture exist (i.e. Hertel, 1997, Rosegrant et al., 2002, Fisher et al., 2002), however, no general equilibrium models of global forestry and agriculture exist. The IMAGE model does represent both agriculture and forestry, however the IMAGE model does not fully account for many important issues in managing forest stocks that influence prices in that sector (Alcamo et al. 1998). Further, some regional models of both the agricultural and forestry sectors exist, but these models typically model only particular regions of the world (i.e. Adams et al., 1996).
This study begins that process of developing global models of forestry and agriculture by presenting a globally integrated database on forest inventories and economic variables. The database is intended for use by individuals interested in modeling forestry markets or forestry and agricultural markets globally, or in particular regions of the globe. The database has been developed in conjunction with the Global Trade in Agriculture Project at Purdue University (GTAP), and thus has been constructed to provide data that can be used within the framework of the GTAP system. Authors interested in other applications, however, may find the data useful and may be able to apply the data to their own research. This paper presents descriptive information about the dataset. Two types of information are provided. First, data on forest inventories, merchantable timber yield functions, and biomass expansion factors are provided. This data is available at the

2
country level for most countries that have forests. The forest inventory data is further disaggregated into agro-ecological zones. Second, data on important economic variables are provided so analysts may incorporate this data into economic models. Data on economic variables is provided for timber types and is not disaggregated to the agro-ecological zones.
The data are derived from numerous sources of information, as described below. While it is tempting to view this as a complete effort, it is important to recognize that many vital pieces of data are missing for certain regions of the world. Thus, the dataset is not entirely complete, and we believe that future efforts to improve this data set should be undertaken. However, we hope that as a first effort to integrate global forestry inventory and economic information, the data may be useful for economic modelers interested in the economics of forestry. NOTE: Readers of this paper, and users of this data are encouraged to send data, literature, sources, and other relevant information to Brent Sohngen ([email protected]) for inclusion in the data set. The data will be updated periodically on the project web page (http://aede.osu.edu/people/sohngen.1/forests/GTM/), and contributors will be acknowledged fully on the web page. Please noted that all data sent will be made publicly available. METHODS FOR DATA DEVELOPMENT The data has generally been obtained from the global timber model described originally in Sedjo and Lyon (1990) and expanded in Sohngen et al. (1999); Sohngen and Sedjo (2000), and Sohngen and Mendelsohn (2003). Some inventory and land area data, as noted below, is obtained directly from the United Nations Food and Agricultural Organization (FAO, 2003) for this compilation. One important issue associated with interpreting this data is that the economic parameters for different timber types were originally developed for a more aggregated modeling effort as described in Sohngen et al. (1999). This report disaggregates that data to the country level. Economic parameters have been applied directly from the larger regions used in Sohngen et al. (1999), and are not corrected for potential differences across specific countries. The methods used to disaggregate the data are shown in figure 1. Two types of data are obtained from the global timber model, including timberland inventories for different timber types in 9 regions of the world, and economic parameters associated with each of these timber types. The 9 regions included in the global timber model are: North America, South and Central America, Europe, the Former Soviet Union, China, Asia-Pacific, India, Oceania (Australia and New Zealand), and Africa. The two types of data, land area inventories and economic parameters, are disaggregated to different levels of detail. The timberland area data is disaggregated to show inventories of timber types in different agro-ecological zones within a country, while the economic parameters are disaggregated only to the timber type level for specific countries. The method for disaggregating the timberland area data is accomplished as follows (the left hand side of figure 1). The model in Sohngen et al. (1999) was originally developed so that the timber types were linked to spatial distribution of ecosystems presented in the BIOME3 model (Haxeltine and Prentice, 1996). In some cases in

3
developed countries, additional detail is available from local inventory sources to further break down these ecosystem types into the area of hardwoods and softwoods within the ecosystem type. In particular, North America and Europe have more timber type classifications than most other regions due to the availability of data sources at the regional and country level. In order to take the classification of timber types in the global timber model and disaggregate those into specific timber types in particular countries, three steps are taken. First, the BIOME3 model is overlain with a global forest area dataset from Ramankutty and Foley (1999) to estimate the area of forestland in each ecosystem type in each country. Second, the combined dataset is used to estimate the proportion of the total timberland in each country residing in different ecosystem types. Third, the proportions are then used in conjunction with data from FAO (2003) on total forestland for a country to determine the total timberland in each timber type in each country. The proportion of timber in each age class for the region is then applied to the country level timber types. For some regions additional information from country level sources is used. For instance, for Europe, North America, and countries of the Former Soviet Union, additional information on hardwoods and softwoods types within each ecosystem type is available, so that hardwoods and conifers can be considered separately. The methods used here ensure that the total land area in forests in each country is consistent with FAO (2003), but total forestland has been disaggregated to different timber types using the timber types in the global timber model, BIOME3, and other local data sources where additional data is available. The steps taken provide estimates of the area of land in different types of forests for each country. In this dataset, however, the area of forestland in different agro-ecological zones (AEZ’s) is also estimated. The AEZ map from Ramankutty and Foley (1999) was overlain on the map of ecosystem types from BIOME3, to generate an estimate of the proportion of land in each ecosystem type that resides in each AEZ. These proportions were then used to allocate the timber types in each country to AEZ’s. Because we do not have specific age class information on AEZ’s, each age class is proportionally allocated to the respective AEZ’s for a timber type. The second type of data relates to the economic parameters. This data is obtained from the global timber model, but is disaggregated only to the timber type level for each country. It was not possible to further disaggregate these parameters to AEZ’s, given that data on productivity, prices, etc. is generally not available in a globally consistent database at the AEZ level. Consequently, economic parameters are available only for timber types. For each timber type in a specific country, there is a corresponding timber type in one of the 9 major regions in the global timber model. The parameters for the corresponding timber type from the global timber model are used for each timber type in each country. There are several caveats with the data that should be discussed. First, there will be more timber price variation across countries in reality than reflected in this data. The reason for this is that the prices and quality adjustment factors for prices were originally developed for a global model that aggregates the world into 9 regions: North America, South and Central America, Europe, the Former Soviet Union, China, Asia-Pacific, India, Oceania (Australia and New Zealand), and Africa. Within each of these regions, there are likely to be price differentials reflected in other data sources that are not reflected

4
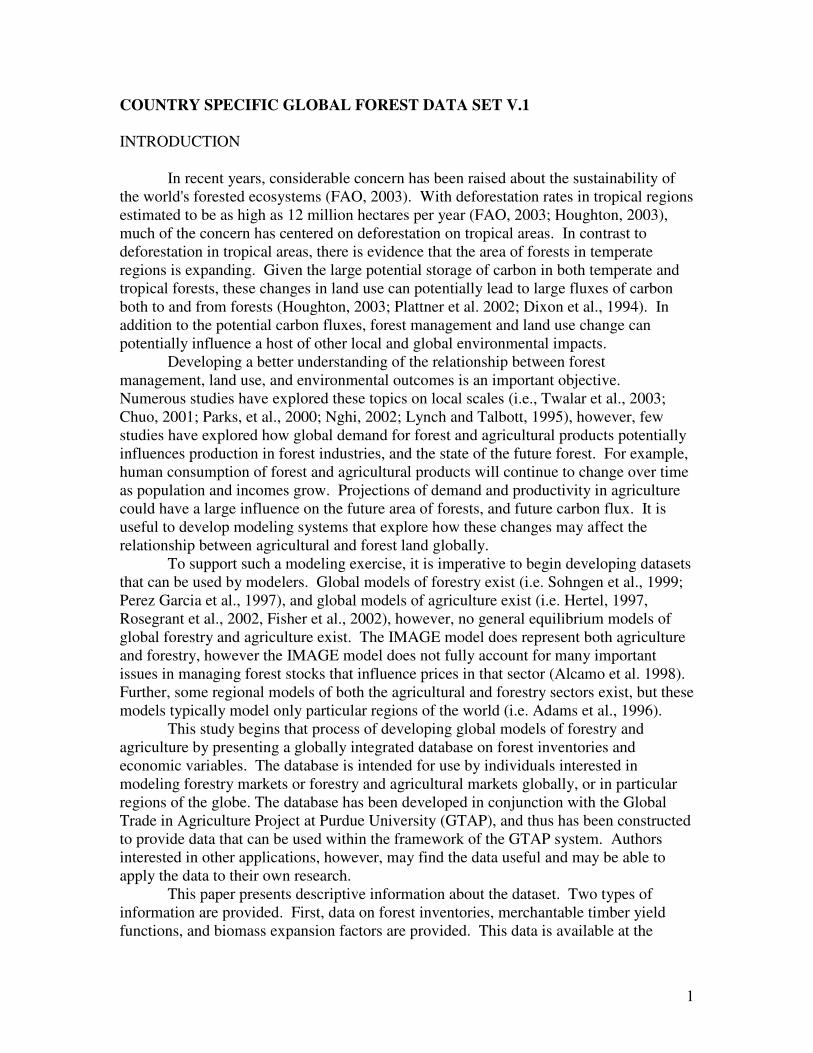
here. For modelers interested in global analyses, the price differentials contained in this data are adequate for general comparisons across broad global regions. However, modelers seeking to use the data for more selected local analyses involving countries within a particular region may consider adjusting the prices used for timber with more recent data from the FAOSTATS database (FAOSTATS, 2004). Second, an analogous issue is that there will be larger differences in forest productivity in particular countries than reflected in this data. The reasons are similar to those described above for prices: The productivity (i.e. merchantable yield) of timber types was originally estimated so that it could be applied to large areas of timber in the nine regions of the model in Sohngen et al. (1999). The same parameters have been applied to all timber types in a country located in a particular region. Thus, the productivity estimates may fail to reflect important differences in specific countries. Unlike price data, however, there are no global databases with country specific timber yield function parameters, hence it is not possible at this point to make further corrections to the data for specific countries. Third, in addition to providing country specific data, the data on forestland areas has been further disaggregated to specific AEZ's. Thus, the dataset provides an estimate of the quantity of timber in a timber type in each agro-ecological zone. While the overall estimates of forestland areas in specific agro-ecological zones conform to the aggregate estimates from Ramankutty and Foley (1999), the dataset only provides economic information on the general timber type, not a specific set of parameters for each timber type and agro-ecological zone combination. There are reasons to believe that the same timber type might have different productivity in different agro-ecological zones (i.e. oaks grow at different rates in different ecological zones), but it was not possible with this data to estimate those differences. Clearly, there are uncertainties associated with the data and parameters provided in this dataset. For instance, the inventory data for many countries, like the U.S., Canada, Europe, and Russia are collected by sampling plots within the country and sometimes combining this data with satellite observations. Extrapolating plot level data to entire regions or countries has inherent uncertainties. While in some cases, the sampling distributions can be determined from the underlying data, this information has not as of yet been included in the data set. Alternatively, satellite data is often used to estimate forest areas and deforestation rates in developing tropical countries. The satellite observations, however, are often taken for specific regions and then extrapolated to larger areas (i.e. Houghton, 2003). At this time, information on the distribution of key data and parameters in this dataset has not been compiled and is not presented. DATA STRUCTURE This section describes the general layout of the GTAP forestry data. The data is provided in individual country spreadsheets. The names of the countries with available data and the corresponding spreadsheet name are given in appendix A, Table A1. In addition, general information on the sources for the original forest inventory data is provided in the table. Each spreadsheet is constructed similarly, although the timber types in each country vary. This section describes the general layout of the spreadsheets so that readers can get a sense for the type of data provided in them.

5
Each spreadsheet contains 3 worksheets. Individuals must use later versions of Microsoft Excel that support individual worksheets to view the spreadsheets. The three datasets contained within each spreadsheet are:
• "Data_Output": Contains basic economic data on timber types within the country • "GTAP_foracre": Contains inventory data on the hectares of land in each timber
type, age class (where age class information is available), and AEZ • "GTAP_CO2": Contains information on carbon in each timber type, age class,
and AEZ.
The timber types are designated M1 through M14. Only the United States has 14 timber types. All other countries have fewer types. The main reason for this is that substantial information is available for forest economic modeling within the United States, so disaggregated data for this region has been developed more extensively. It is generally not possible to compare timber types across different countries. For example, M1 in the United States is not the same forest type as M1 in Argentina or Canada.
The data for individual countries is allocated into six regions. The countries included in this dataset, as well as the regions to which they are assigned are shown in table A1. Briefly, the regions are:
(1) Africa (2) Central Asia (3) Southeast Asia (4) Europe (5) Central and South America (6) Developed, Large, and Other Countries
Economic data for each timber type is provided in year 2000 US $. The values are
obtained from the global timber model developed by Sedjo and Lyon (1990) and Sohngen et al. (1999). Forest inventories for each of the timber types have been further disaggregated into AEZ’s using the methods described above. As noted, it is currently not possible to take the economic data associated with each forest type and present specific estimates of economic parameters for each AEZ. WORKSHEET "Data Output" The information contained in the "Data Output" worksheet provides the fundamental economic values associated with forestry activity and carbon sequestration for the particular timber types. The data is provided only for the timber types identified for each country. The values for particular timber types in countries within a particular region are similar because the data have been obtained form a more aggregated global timber model. The parameters contained in this dataset are listed in Table 1. An additional description of each variable is provided below.

6
Total hectares: The total area in hectares for each forest type is derived from various sources for each country. Total hectares for each country are obtained from FAO (2003).
Land Rent: Land rental values are estimated for each forest type based on the value of the land associated with the forest type. Land rental is given in year 2000 US $ per hectare per year.
Timber Production:
With the exception of a few regions, such as the United States, timber production data by timber type is difficult to obtain. As a consequence, this value is estimated for each timber type in each region with the following methods. First, aggregate national timber production for each region is obtained from the United Nations Food and Agricultural Organization FAOSTATS database (FAOSTATS, 2003). This data is distributed to the specific timber types in each region using timber production proportions derived from Sohngen et al. (1999). These proportions are generated for larger aggregated regions than the individual country data described in this study, so the production numbers for specific timber types should only be considered estimates of actual production of those types within a region.
QA Timber Log Price ($ per m3): Quality adjustment factors for log prices have been developed for each region. The numeraire price is US southern softwood timber. Prices for all other types are adjusted so that they are relative to this type. Quality adjustment factors take into account price differentials (using average price data from FAOSTATS, 2003), and other factors, such as whether the type typically provides raw material mainly for sawtimber or pulpwood markets. These estimates were developed in the mid-1990's based on data from the 1960's – early 1990's.
QA Net Stumpage Price ($ per m3): Stumpage prices are the quality adjusted timber log price less the costs of accessing the timber (maintaining and building roads), logging, and hauling to mills. The original data for this was derived from Sedjo and Lyon (1990) and adjusted in Sohngen et al. (1999) to reflect changes in general price levels.
Merchantable Yield function parameters:
Merchantable yield functions represent estimates of the merchantable yield for the timber type in m3 per hectare of roundwood. There are three parameters used in the merchantable yield functions. The form of the merchantable yield function is: m3 per hectare = exp(a - b/(age - c)) if age > c m3 per hectare = 0 if age < c

7
Regeneration Cost: Average regeneration costs are given in year 2000 US $ per hectare. These averages represent average intensity of regeneration effort in the timber type for the country in question. The regeneration estimates are obtained from the model described in Sohngen et al. (1999) for larger aggregated regions than the countries contained in this dataset, and thus can be considered only estimates of the regeneration costs for a particular timber type.
Net Present Value: Average net present value for each timber type is given in year 2000 US $ per hectare. It is estimated as the site expectation value for the timber type using the following formula,
NPV = )1(*))((*)(
*
*
ager
agerQA
eCeageYieldP
−
−
−−
Where PQA is the quality adjusted net stumpage price, yield is the merchantable yield of the timber type at age a, r is the discount rate (5% used here), and C is the regeneration cost.
Annual Forest Area Harvested: Annual forest areas harvested are estimated for each timber type using information on the optimal rotation of the species from Sohngen et al. (1999), the area of the species, and total timber harvest in the country.
Forest Carbon Stock: The stock of carbon in million metric tons (1 metric ton = 1 Mg = 1000 kg ) for each forest type is estimated by using information on the area of forests, the age class distribution, the merchantable yield functions, and the carbon conversion factor to convert merchantable forest stock to tons of carbon. Forest carbon stock (FCS) for each timber type is:
�=
=T
ageageage YieldAreaFCS
1
)(*)( α
where Areaage is the area of land in each age class in the timber type, Yield is the merchantable yield for timber at a specific age, and � is the carbon conversion factor for forest stock described below.
Forest Carbon Sequestration 10 yr: Forest carbon sequestration in million metric tons (106 Mg) per year for each timber type is estimated from Sohngen et al. (1999). The estimates are first generated for the broad regional types described in that model. Since that model looks forward, estimates are derived for the period 2000 – 2010, as projected by that model. The

8
results for broad regions are disaggregated to specific countries and timber types based on the proportion of forestland areas of each type in each country.
Forest Carbon Sequestration 50 yr: Forest carbon sequestration in million tons per year for each timber type is estimated from Sohngen et al. (1999). The estimates are first generated for the broad regional types described in that model. Since that model looks forward, estimates are derived for the period 2000 – 2050, as projected by that model. The results for broad regions are disaggregated to specific countries and timber types based on the proportion of forestland areas of each type, in each country.
Carbon associated with forest stock: This is the tons (Mg) of carbon per m3 of merchantable wood. The units of this measure are Mg/m3. Note that this is a single parameter used to account for density of specific species (typically around 0.5), whole tree factors (typically 1.4 – 1.6), and forest floor carbon. It includes only above-ground storage, and does not include forest soil carbon. These parameters have been calibrated from numerous data sources, and are described in more detail in Sohngen and Sedjo (2000). Note however, that the merchantable yield function described above must be slightly adjusted to account for carbon in young forests. In particular, the following yield function should be used: Yield = exp(a – b/age) Where the parameters a and b are the same as used in the merchantable yield function described above. The parameter c is not used for estimating forest carbon.
Carbon associated with products: This is the tons (Mg) of carbon per m3 of roundwood, given in Mg/m3. This parameter should be used only for wood removed from the forest and incorporated into wood products. It is an average value for both sawnwood and pulpwood products and thus can be used for both.
Long term storage percent: This estimates the proportion of wood that enters into long term wood products. For this study, a 30% average has been assumed for the world, based on studies by Winjum et al., 1998.
Net forest area change (FAO data): This estimates the net forest area change for each timber type in each country in the dataset. The sum across the regions equals the estimated forest area change based on the recent State of the World's Forests 2003 report from FAO (2003). Country level estimates have been disaggregated to specific timber types using proportions projected by the model described in Sohngen et al. (1999).

9
Net forest area change 10 yr: An alternative projection of net change in forest area is estimated using the model described in Sohngen et al. (1999) and Sohngen and Mendelsohn (2003). The estimates are first generated for the broad regional types described in that model. Since that model looks forward, estimates are derived for the period 2000 – 2010, as projected by that model. The results for broad regions are disaggregated to specific countries and timber types based on the proportion of forestland areas of each type, in each country.
Net forest area change 50 yr: An alternative projection of net change in forest area is estimated using the model described in Sohngen et al. (1999) and Sohngen and Mendelsohn (2003). The estimates are first generated for the broad regional types described in that model. Since that model looks forward, estimates are derived for the period 2000 – 2050, as projected by that model. The results for broad regions are disaggregated to specific countries and timber types based on the proportion of forestland areas of each type in each country.
Marginal Access Cost for inaccessible forest types: Marginal access costs are applied only for certain inaccessible types occurring in temperate and boreal regions. These marginal access costs represent the cost of building additional access roads and infrastructure to access forests in these regions. They represent the marginal value of the stumpage on that site (the value of harvesting current old growth forests plus the net present value of the future forest on the site). Note that the net stumpage value for these sites will thus be $0 per hectare when subtracting marginal access costs from the value of current and future harvests.
WORKSHEET "GTAP_foracre" The worksheet "GTAP_foracre" contains information on the area of timberland in different age classes for forests in the country. The data is organized by timber type class (M1 – M14), 10-year age class, and agro-ecological zones. The data used to generate the age class information is given in appendix A, Table A1. Table A1 shows broad regions, individual countries included in the dataset, the source of the total timberland area data, and the source of the age class data. Note that for forestry, over 70% of timber production is derived from harvests in the United States, Canada, Europe, and Russia. Thus, for a large part of industrial timber activity, age class information is available. For other regions, however, this data is not available. For the countries noted in table A1 as having age class information available, the data on age class distributions is derived from the dataset originally developed in Sohngen et al. (1999) and extended to additional regions in Sohngen and Mendelsohn (2003). For most developed countries, information on age classes has been obtained from original inventory reports developed by those countries, or from reports on the inventories from those countries available in the literature. In particular, for most countries in the classifications "developed and large" and "Europe," age class distributions have been developed.

10
For most developing countries, information on age class distribution is generally unavailable. There is one exception. High value plantation species have emerged in many subtropical countries as an important source of world fiber supply in the last 25 – 30 years. Age class distributions have been developed for these fast growing plantations based on historical establishment rates as well as information on rotation ages to define harvesting dates. This data was originally developed for study by Sohngen et al. (1999) using historical information from the Pandey (1992), Bazett (1993), ABARE-Jaako Poyry (1999) on establishment rates and harvest rates.
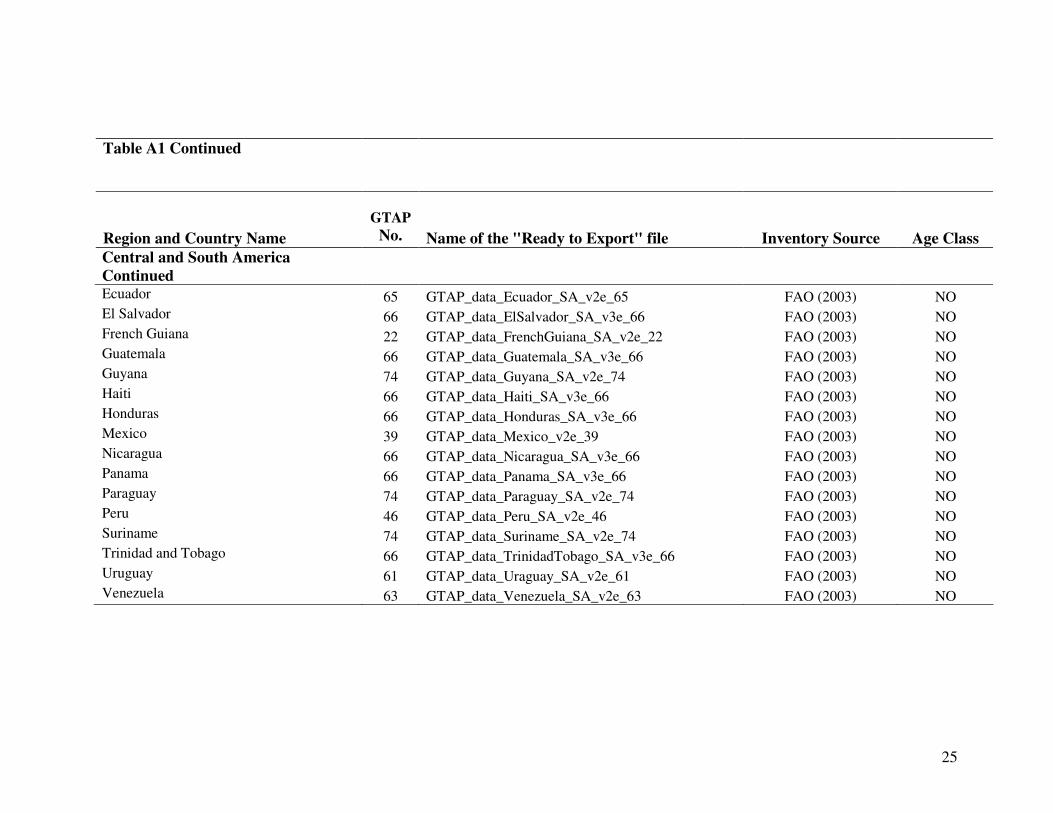
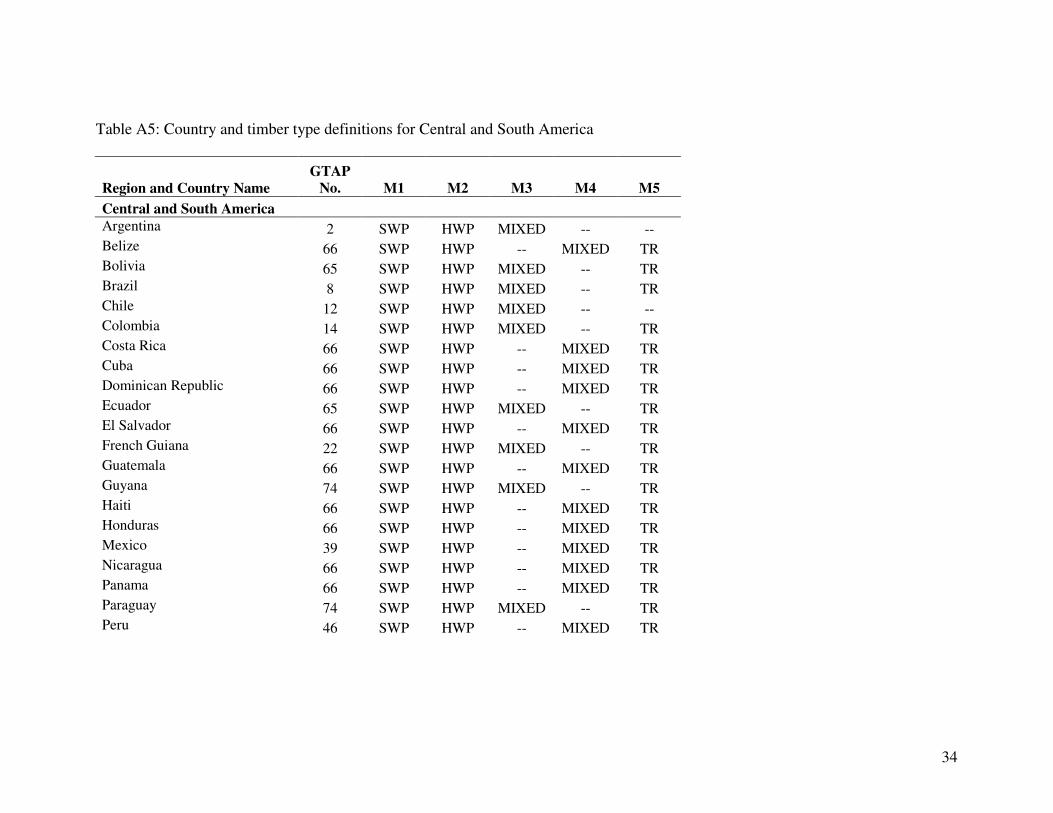
In developing countries, plantation species are maintained in timber type M1 and in some regions, also in timber type M2. A general description of timber types in each region is shown in Table A2. In general, the regions have plantations maintained in the following timber types:
South and Central America: Plantations only in M1 and M2 Africa: Plantations only in M1 and M2 Central Asia: Plantations only in M1 SE Asia: Plantations only in M1
For other forest types in developing countries, age classes have been assumed. These are reflected in the worksheet by showing forest types in different age classes, typically through age class 50. The oldest age classes are usually assumed to hold the most forestland area. Age class 50 is used as the maximum age in the regions listed above because forests in these regions typically mature at this age. Local site conditions for or within specific countries could vary substantially. Beyond year 50, one would expect little additional accumulation of forest biomass or carbon, thus users of the data should consider imposing constraints in their models that limit additional growth beyond year 50 for the regions listed above. There are two issues that individuals should recognize about timber types M3 – M14 in South and Central America, Africa, Central Asia, and SE Asia. For these timber types and regions, age classes have been assumed. Allowing the age class distribution to adjust in modeling could affect estimates of carbon sequestration in modeling efforts. Users should carefully consider this issue before using this age class information directly in modeling, and consult experts from different regions when developing their models. Second, if using this data for modeling purposes, allowing mature forests in types M2 – M14 (i.e. those already in age class 50) to age beyond year 50 in these same regions could lead to large estimates of carbon sequestration. Users should consider setting maximum ages in their models because many of these forests area already mature and sequester very little additional carbon unless they are harvested and returned to younger age classes. Note that users can modify the age class information with more specific country-level information if it is available.
In addition to the age class distributions, the area distribution of forests is defined for specific AEZ's. The distribution of forests into AEZ's has been accomplished by overlaying the distribution of forest types in the model by Sohngen et al. (1999) over the agro-ecological zones provided by Ramankutty and Foley (1999), as noted above. Forest inventories have also been disaggregated to the AEZ's as well. It is important to recognize, however, that age class distributions have been assumed to be the same for the

11
timber types in each AEZ. This is not likely to hold in reality, but we do not have age class information available by agro-ecological zones for this dataset.
WORKSHEET "GTAP_CO2" This worksheet provides information on carbon located in different timber types and different agro-ecological zones. In the worksheet carbon is calculated for each age class and AEZ using the yield functions and carbon conversion parameters available in the worksheet “Data_output” and the inventories located in the worksheet “GTAP_foracre”. For this section, age classes are denoted “a”, timber types are denoted “t”, and AEZ's are denoted “z”. Forest carbon stock for an age class in a timber type in an AEZ is given as:
tztaztazta YieldAreaFCS α)(*)( ,,,,,, = where �t is the carbon conversion parameter described above. To calculate carbon for particular agro-ecological zones or timber types, individuals can aggregate across a, t, or z. Note that �t in the data set varies across timber types, but does not vary across AEZ. In reality, this may vary across both AEZ's and age classes, however, that detailed level of information is not available for this data set.

12
REFERENCES: ABARE – Jaako Poyry. 1999. Global Outlook for Plantations. ABARE Research Report 99.9. Canberra, Australia. Adams, Darius M.; Alig, Ralph J.; Callaway, J.M.; McCarl, Bruce A.; Winnett, Steven M. 1996. The forest and agricultural sector optimization model (FASOM): model structure and policy applications Res. Pap. PNW-RP-495. Portland, OR: U.S. Department of Agriculture, Forest Service, Pacific Northwest Research Station. 60 p. Alcamo, J., Leemans, R., Kreileman, G. J. J. 1998. Global change scenarios of the 21st century, Results From the IMAGE 2.1 Model. London: Pergamon & Elseviers Science. Backman, Charles A. and Waggener, Thomas R. 1991. Soviet Timber Resources and Utilization: An Interpretation of the 1988 National Inventory. CINTRAFOR Working Paper 35. Seattle: University of Washington, Center for International Trade in Forest Products. 296 p. Bazett, Michael. 1993. Industrial Wood. Shell/WWF Tree Plantation Review Study No. 3. WWF (UK), Panda House, Weyside Park, Godalming, Surrey. Chuo. 2001.“Community Agroforestry as an Alternative Land use System.” Institute for Development and Alternative living. A paper written for the conference on Resource Tenure, Forest Management, And Conflict Resolution in April 2001. Dixon, R.K., S. Brown, R.A. Houghton, A.M. Solomon, M.C. Trexler, and J. Wisniewski. 1994. Carbon Pools and Flux of Global Forest Ecosystems. Science. 263(5144): 185 – 190. FAO. 2003. State of the World's Forests 2003. United Nations Food and Agricultural Organization. Rome, Italy. (http://www.fao.org/DOCREP/005/Y7581E/Y7581E00.HTM) FAOSTATS. 2003. FAOSTATS Database of Global Forest Production. United Nations Food and Agricultural Organization. Rome, Italy. (http://faostat.fao.org/faostat/collections?version=ext&hasbulk=0&subset=) Fisher, Anthony, Wolfram Schlenker, Michael Hanemann. 2002. “The impact of global warming on U.S. agriculture: an econometric analysis.” Department of Agricultural & Resource Economics, UC Berkeley, Working Paper Series 11009. (http://netec.wustl.edu/WoPEc/data/Papers/cdlagrebk11009.html) Haxeltine, A. and I.C. Prentice. 1996. “BIOME3: An Equilibrium Terrestrial Biosphere Model Based on Ecophysiological Constraints, Resource Availability, and Competition Among Plant Functional Types.” Global Biogeochemical Cycles 10(4): 693-709.

13
Hertel, Thomas W. (editor), 1997. Global Trade Analysis: Modeling and Applications. New York; Cambridge University Press, 1997. Houghton, R.A. 2003. Revised estimates of the annual net flux of carbon to the atmosphere from changes in land use and land management 1850–2000. Tellus. 55b: 378-390. Kuusela, Kullervo. 1994. Forest Resources in Europe, 1950-1990. Cambridge: University of Cambridge Press. 154 p. Lowe, J.J.; Power, K.; and Gray, S.L. 1994. Canada’s Forest Inventory 1991. Information Report PI-X-115. Canada Forest Service, Petawawa National Forest Institute.
Lynch, Owen, Kirk Talbott. 1995. Balancing Acts: Community-Based Forest Management and National Law in Asia and the Pacific. World Resources Institute, September 1995.
Ministry of Forestry. Dynamic Changes in China’s Forest Resources. Working Report, Center for Forest Inventory, Ministry of Forestry, Beijing, China. Nghi, Tran Huu. 2002. "Decentralization and Devolution of Forest Management in Vietnam: A Case Study of Ea Hleo and Cu Jut Forest Enterprises, Dak Lak Province." Presented at The Commons in an Age of Globalisation. Digital Library of the Commons. http://dlc.dlib.indiana.edu/archive/00000889/ Pandey, D. 1992. "Assessment of Tropical Forest Plantation Resources." Unpublished. Swedish University of Agricultural Sciences, Department of Forest Survey. Parks, P. J., I. W. Hardie, C. A. Tedder, and D. N. Wear. 2000. “Using resource economics to anticipate forest land use change in the U.S. Mid-Atlantic region." Environmental Monitoring and Assessment 63:175-185. Perez-Garcia, J., L.A. Joyce, A.D. McGuire, and C.S. Binkley. 1997. “Economic Impact of Climatic Change on the Global Forest Sector.” In Economics of Carbon Sequestration in Forestry, ed., Sedjo, R.A., R.N. Sampson, and J. Wisniewski. pp. 123-129, Lewis Publishers, Boca Raton. Plattner, G., Joos, F. and Stocker, T. F. 2002. Revision of the Global Carbon Budget due to Changing Air-Sea Oxygen Fluxes. Global Biogeochemical Cycles. 16(4): 1096. Ramankutty, N. and Foley J. 1999. Estimating Historical Changes in Global Land Cover: Croplands from 1700 to 1992. Global Biogeochemical Cycles. 13(4): 997-1027. Rosegrant, M.W., S. Meijer, and S. A. Cline. 2002. “International Model for Policy Analysis of Agricultural Commodities and Trade (IMPACT): Model Description.” Unpublished. http://www.ifpri.org/themes/impact/impactmodel.pdf

14
Sedjo, R.A. and K.S. Lyon. 1990. The Long Term Adequacy of the World Timber Supply. Washington: Resources For the Future. Sohngen, B. and R. Mendelsohn. 2003. “An Optimal Control Model of Forest Carbon Sequestration.” American Journal of Agricultural Economics. 85(2): 448-457. Sohngen, B., R. Mendelsohn, and R. Sedjo. 1999. “Forest Management, Conservation, and Global Timber Markets.” American Journal of Agricultural Economics. 81: 1-13. Sohngen, B. and R. Sedjo. 2000. “Potential Carbon Flux from Timber Harvests and Management in the Context of a Global Timber Market.” Climatic Change. 44:151-72. Twalar, Deepshikha Mehra, and Rucha Ghate. 2003. “Community-Initiated Forest Management Without Land Tenure: How Feeble, How Strong? A Study of Three Villages from Central India.” Digital Library of the Commons. http://dlc.dlib.indiana.edu/archive/00001093/ Winjun, J.K., S. Brown and B. Schlamadinger. 1998. Forest harvests and wood products: sources and sinks of atmospheric carbon dioxide. Forest Science. 44: 272-284. USDA FIA. 1990. USDA Forest Service Forest Inventory and Analysis Database. (http://www.fia.fs.fed.us/) Yin, Runsheng. 1995. Forestry and the Environment in China, The Current Situation and Strategic Choices. Paper presented at the 22nd PAFTAD Conference, Ottawa, Canada, September, 1995.

15
Table 1: Data contained in GTAP forest data set. Name Description Total hectares (Million) million hectares circa 1990 - 2000 Land Rent ($$/hectare) Marginal land rent ($$ per hectare for last hectare in forests) Timber Production (Million m3/yr) Annual timber roundwood production QA Timber Log Price ($$ per m3) Quality adjusted gross log price
QA Net Stumpage Price ($$ per m3) Quality adjusted net log price (gross price - marginal access, harvesting and hauling costs)
Merchantable Yield function parameters Merchantable yields are given in m3/hectare Regneration Cost ($$ per ha) Average regeneration costs per hectare Net Present Value ($$ per hectare) Net present value of land in forest type: Annual Forest Area Harvested (Million hectares per year) Estimate of annual area of timberland currently harvested. Forest Carbon Stock (Million tons Carbon) Total Stock of carbon in forests in million Mg carbon (1Mg = 1000 Kg) Forest Carbon Sequestration 10 yr (Million tons/yr)
Projected carbon changes in stock over the period 2000 – 2010, derived from timber model described in Sohngen et al. (1999)
Forest Carbon Sequestration 50 yr (Million tons/yr)
Projected carbon changes in stock over the period 2000 – 2050, derived from timber model described in Sohngen et al. (1999)

16
Table 1: Continued Name Description Carbon associated with forest stock (Mg/m3)
Conversion factor to take merchantable forest stock and convert to carbon; accounts for whole tree factor and other carbon on the site, but which is not merchantable.
Carbon associated with products (Mg/m3) Conversion factor to take harvested timber logs and convert to carbon. Long term storage percent (percent in long term wood products) Percent of harvested timber assumed to be stored in long term timber products Net forest area change (FAO data; thousand hectares per year) Regional estimate of net forest area change predicted by FAO for 1990 - 2000 Net forest area change (Million ha/yr) 10 yr
Projected forest area change over the period 2000 – 2010, derived from timber model described in Sohngen et al. (1999)
Net forest area change (Million ha/yr) 50 yr
Projected forest area change over the period 2000 – 2010, derived from timber model described in Sohngen et al. (1999)
Marginal Access Costs for inaccessible forest types ($$ per ha) Marginal access cost for marginal hectare accessed.

17
Figure 1: Graphical depiction of methods used to obtain values in the GTAP forestry dataset.
Regional estimatesof land area in
timber types M1 – M14From Sohngen et al. (1999)
Country estimatesof total land areafrom FAO (2003)
&Country estimates of land in timber types
from BIOME3 (Haxeltine & Prentice, 1996) Country estimates
of land area in timber types M1 – M14
Regional estimatesof economic parametersin timber types M1 – M14
from Sohngen et al. (1999)
Country estimatesof economic parameters in timber types M1 – M14
Timber type M1 area
In AEZ 1 - 18
Timber type M14area
In AEZ 1 - 18………
Agro-ecologicalZones from Ramankuttty and Foley (1999)
Forest Inventory Data Economic Parameters

18
APPENDIX A: INVENTORY DATA SOURCES

19
Table A1: Regions and file names, inventory sources, and age class information
Region and Country Name GTAP
No. Name of the "Ready to Export" file Inventory Source Age
Class Africa Algeria 69 GTAP_data_Algeria_AF_v3e_69 FAO (2003) NO Angola 73 GTAP_data_Angola_AF_v3e_73 FAO (2003) NO Benin 75 GTAP_data_Benin_AF_v3e_75 FAO (2003) NO Botswana 9 GTAP_data_Botswana_AF_v3e_9 FAO (2003) NO Brunei Darussalam 75 GTAP_data_Burundi_AF_v3e_75 FAO (2003) NO Burkina Faso 75 GTAP_data_BurkinaFaso_AF_v3e_75 FAO (2003) NO Cameroon 75 GTAP_data_Cameroon_AF_v3e_75 FAO (2003) NO Central African Republic 75 GTAP_data_CentAfricanRep_AF_v3e_75 FAO (2003) NO Chad 75 GTAP_data_Chad_AF_v3e_75 FAO (2003) NO Congo 75 GTAP_data_Congo_AF_v3e_75 FAO (2003) NO Cote d'Ivoire 75 GTAP_data_CotedIvoire_AF_v3e_75 FAO (2003) NO Djibouti 75 GTAP_data_Djibouti_AF_v3e_75 FAO (2003) NO Egypt 69 GTAP_data_Egypt_AF_v3e_69 FAO (2003) NO Equatorial Guinea 75 GTAP_data_EquatorialGuinea_AF_v3e_75 FAO (2003) NO Eritrea 75 GTAP_data_Eritrea_AF_v3e_75 FAO (2003) NO Ethiopia 75 GTAP_data_Ethiopia_AF_v3e_75 FAO (2003) NO Gabon 75 GTAP_data_Gabon_AF_v3e_75 FAO (2003) NO Gambia 75 GTAP_data_Gambia_AF_v3e_75 FAO (2003) NO Ghana 75 GTAP_data_Ghana_AF_v3e_75 FAO (2003) NO Guinea 75 GTAP_data_Guinea_AF_v3e_75 FAO (2003) NO Guinea-Bissau 75 GTAP_data_GuineaBissau_AF_v3e_75 FAO (2003) NO

20
Table A1 Continued
Region and Country Name GTAP
No. Name of the "Ready to Export" file Inventory Source Age Class Africa Continued Kenya 75 GTAP_data_Kenya_AF_v3e_75 FAO (2003) NO Liberia 75 GTAP_data_Liberia_AF_v3e_75 FAO (2003) NO Libya 69 GTAP_data_Libya_AF_v3e_69 FAO (2003) NO Madagascar 75 GTAP_data_Madagascar_AF_v3e_75 FAO (2003) NO Malawi 42 GTAP_data_Malawi_AF_v3e_42 FAO (2003) NO Mali 75 GTAP_data_Mali_AF_v3e_75 FAO (2003) NO Mauritania 75 GTAP_data_Mauritania_AF_v3e_75 FAO (2003) NO Morocco 38 GTAP_data_Morocco_AF_v3e_38 FAO (2003) NO Mozambique 41 GTAP_data_Mozambique_AF_v3e_41 FAO (2003) NO Namibia 72 GTAP_data_Namibia_AF_v3e_72 FAO (2003) NO Niger 75 GTAP_data_Niger_AF_v3e_75 FAO (2003) NO Nigeria 75 GTAP_data_Nigeria_AF_v3e_75 FAO (2003) NO Rwanda 75 GTAP_data_Rwanda_AF_v3e_75 FAO (2003) NO Senegal 75 GTAP_data_Senegal_AF_v3e_75 FAO (2003) NO Sierra Leone 75 GTAP_data_SierraLeone_AF_v3e_75 FAO (2003) NO Somalia 75 GTAP_data_Somalia_AF_v3e_75 FAO (2003) NO South Africa 72 GTAP_data_SouthAfrica_AF_v3e_72 FAO (2003) NO Sudan 75 GTAP_data_Sudan_AF_v3e_75 FAO (2003) NO Swaziland 72 GTAP_data_Swaziland_AF_v3e_72 FAO (2003) NO Tanzania, United Republic of 59 GTAP_data_Tanzania_AF_v3e_59.xls FAO (2003) NO Togo 75 GTAP_data_Togo_AF_v3e_75 FAO (2003) NO Tunisia 69 GTAP_data_Tunisia_AF_v3e_69 FAO (2003) NO

21
Table A1 Continued Region and Country Name
GTAP
No.
Name of the "Ready to Export" file
Inventory Source
Age Class Africa Continued Uganda 6 GTAP_data_Uganda_AF_v3e_60 FAO (2003) NO Western Sahara GTAP_data_WesternSahara_AF_v3.xls FAO (2003) NO
Zaire 70 GTAP_data_Congo_AF_v3e_70 FAO (2003) NO Zambia 77 GTAP_data_Zambia_AF_v3e_77 FAO (2003) NO Zimbabwe 78 GTAP_data_Zimbabwe_AF_v3e_78 FAO (2003) NO
Central Asia Afghanistan 70 GTAP_data_Afghanistan_CentAsia_v3e_70 FAO (2003) NO Armenia 76 GTAP_data_Armenia_CentAsia_v3e_76 FAO (2003) NO Azerbaijan 76 GTAP_data_Azerbaijan_CentAsia_v3e_76 FAO (2003) NO Georgia 76 GTAP_data_Georgia_CentAsia_v3e_76 FAO (2003) NO Iran, Islamic Republic of 68 GTAP_data_Iran_CentAsia_v3e_68 FAO (2003) NO Iraq 68 GTAP_data_Iraq_CentAsia_v3e_68 FAO (2003) NO Israel 68 GTAP_data_Israel_CentAsia_v3e_68 FAO (2003) NO Jordan 68 GTAP_data_Jordan_CentAsia_v3e_68 FAO (2003) NO Kazakhstan 76 GTAP_data_Kazakhstan_CentAsia_v3e_76 FAO (2003) NO Kuwait 68 GTAP_data_Kuwait_CentAsia_v3e_68 FAO (2003) NO Kyrgyzstan 76 GTAP_data_Kyrgyzstan_CentAsia_v3e_76 FAO (2003) NO Lebanon 68 GTAP_data_Lebanon_CentAsia_v3e_68 FAO (2003) NO Oman 68 GTAP_data_Oman_CentAsia_v3e_68 FAO (2003) NO Pakistan 71 GTAP_data_Pakistan_CentAsia_v3e_71 FAO (2003) NO Qatar 68 GTAP_data_Qatar_CentAsia_v3e_68 FAO (2003) NO Saudi Arabia 68 GTAP_data_SaudiArabia_CentAsia_v3e_68 FAO (2003) NO

22
Table A1 Continued Region and Country Name
GTAP
No. Name of the "Ready to Export" file
Inventory Source
Age Class
Central Asia Continued Turkmenistan 76 GTAP_data_Turkmenistan_CentAsia_v3e_76 FAO (2003) NO United Arab Emirates 68 GTAP_data_UnitedArabEmirates_CentAsia_v3e_68 FAO (2003) NO Uzbekistan 76 GTAP_data_Uzbekistan_CentAsia_v3e_76 FAO (2003) NO Yemen 68 GTAP_data_Yemen_CentAsia_v3e_68 FAO (2003) NO SE Asia Bangladesh 6 GTAP_data_Bangladesh_SEASIA_v3e_6 FAO (2003) NO Cambodia 70 GTAP_data_Cambodia_SEASIA_v3e_70 FAO (2003) NO India 29 GTAP_data_India_v3e_29.xls FAO (2003) NO Indonesia 28 GTAP_data_Indonesia_SEASIA_v3e_28 FAO (2003) NO Lao People’s Democratic Republic 70 GTAP_data_Laos_SEASIA_v3e_70 FAO (2003) NO Malaysia 43 GTAP_data_Malaysia_SEASIA_v3e_43 FAO (2003) NO Mongolia 70 GTAP_data_Mongolia_SEASIA_v3e_70 FAO (2003) NO Myanmar 70 GTAP_data_Myanmar_SEASIA_v3e_70 FAO (2003) NO Nepal 71 GTAP_data_NEPAL_SEASIA_v3e_71 FAO (2003) NO Philippines 47 GTAP_data_Philippines_SEASIA_v3e_47 FAO (2003) NO Singapore 52 GTAP_data_Singapore_SEASIA_v3e_52 FAO (2003) NO Sri Lanka 34 GTAP_data_SriLanka_SEASIA_v3e_34 FAO (2003) NO Thailand 56 GTAP_data_Thailand_SEASIA_v3e_56 FAO (2003) NO Viet Nam 64 GTAP_data_VietNam_SEASIA_v3e_64 FAO (2003) NO

23
Table A1 Continued Region and Country Name
GTAP
No.
Name of the "Ready to Export" file
Inventory Source
Age Class Europe Austria 4 GTAP_data_Austria_EU_v3e_4 Kuusela (1994) Yes Belarus 76 GTAP_data_Belarus_EU_v3e_76 Kuusela (1994) Yes Belgium 5 GTAP_data_Belgium&Luxembourg_EU_v3e_5 Kuusela (1994) Yes Bosnia and Herzegovina 70 GTAP_data_Bosnia&Herzegovia_EU_v3e_70 Kuusela (1994) Yes Bulgaria 7 GTAP_data_Bulgaria_EU_v3e_7 Kuusela (1994) Yes Croatia 26 GTAP_data_Croatia_EU_v3e_26 Kuusela (1994) Yes Czech Republic 16 GTAP_data_CzechRepublic_EU_v3e_16 Kuusela (1994) Yes Denmark 18 GTAP_data_Denmark_EU_v3e_18 Kuusela (1994) Yes Estonia 20 GTAP_data_Estonia_EU_v3e_20 Kuusela (1994) Yes Finland 21 GTAP_data_Finland_EU_v3e_21 Kuusela (1994) Yes France 22 GTAP_data_France_EU_v3e_22 Kuusela (1994) Yes Germany 17 GTAP_data_Germany_EU_v3e_17.xls Kuusela (1994) Yes Greece 24 GTAP_data_Greece_EU_v3e_24 Kuusela (1994) Yes Hungary 27 GTAP_data_Hungary_EU_v3e_27 Kuusela (1994) Yes Iceland 67 GTAP_data_Iceland_EU_v3e_67 Kuusela (1994) Yes Ireland 30 GTAP_data_Ireland_EU_v3e_30 Kuusela (1994) Yes Italy 31 GTAP_data_Italy_EU_v3e_31 Kuusela (1994) Yes Latvia 37 GTAP_data_Latvia_EU_v3e_37 Kuusela (1994) Yes Lithuania 35 GTAP_data_Lithuania_EU_v3e_35 Kuusela (1994) Yes Macedonia 70 GTAP_data_FYRMacedonia_EU_v3e_70 Kuusela (1994) Yes Netherlands 44 GTAP_data_Netherlands_EU_v3e_44 Kuusela (1994) Yes Norway 67 GTAP_data_Norway_EU_v3e_67 Kuusela (1994) Yes

24
Table A1 Continued Region and Country Name
GTAP
No.
Name of the "Ready to Export" file
Inventory Source
Age Class Europe Continued Poland 48 GTAP_data_Poland_EU_v3e_48.xls Kuusela (1994) Yes Portugal 49 GTAP_data_Portugal_EU_v3e_49.xls Kuusela (1994) Yes Republic of Moldova 76 GTAP_data_RepublicofMoldova_EU_v3e_76.xls Kuusela (1994) Yes Romania 50 GTAP_data_Romania_EU_v3e_50.xls Kuusela (1994) Yes Slovakia 53 GTAP_data_Slovakia_EU_v3e_53 Kuusela (1994) Yes Slovenia 54 GTAP_data_Slovenia_EU_v3e_54 Kuusela (1994) Yes Spain 19 GTAP_data_Spain_EU_v3e_19 Kuusela (1994) Yes Sweden 55 GTAP_data_Sweden_EU_v3e_55 Kuusela (1994) Yes Switzerland 11 GTAP_data_Switzerland_EU_v3e_11 Kuusela (1994) Yes Ukraine 76 GTAP_data_Ukraine_EU_v3e_76 Kuusela (1994) Yes United Kingdom 23 GTAP_data_UnitedKingdom_EU_v3e_23 Kuusela (1994) Yes Yugoslavia 70 GTAP_data_Yugoslavia_EU_v3e_70 Kuusela (1994) Yes Central and South America Argentina 2 GTAP_data_Argentina_SA_v2e_2 FAO (2003) NO Belize 66 GTAP_data_Belize_SA_v3e_66 FAO (2003) NO Bolivia 65 GTAP_data_Boliva_SA_v2e_65 FAO (2003) NO Brazil 8 GTAP_data_Brazil_SA_v2e_8 FAO (2003) NO Chile 12 GTAP_data_Chile_v2e_12 FAO (2003) NO Colombia 14 GTAP_data_Colombia_SA_v2e_14 FAO (2003) NO Costa Rica 66 GTAP_data_CostaRica_SA_v3e_66 FAO (2003) NO Cuba 66 GTAP_data_Cuba_SA_v3e_66 FAO (2003) NO Dominican Republic 66 GTAP_data_DominicanRepublic_SA_v3e_66 FAO (2003) NO
25
Table A1 Continued
Region and Country Name
GTAP
No.
Name of the "Ready to Export" file
Inventory Source
Age Class Central and South America Continued Ecuador 65 GTAP_data_Ecuador_SA_v2e_65 FAO (2003) NO El Salvador 66 GTAP_data_ElSalvador_SA_v3e_66 FAO (2003) NO French Guiana 22 GTAP_data_FrenchGuiana_SA_v2e_22 FAO (2003) NO Guatemala 66 GTAP_data_Guatemala_SA_v3e_66 FAO (2003) NO Guyana 74 GTAP_data_Guyana_SA_v2e_74 FAO (2003) NO Haiti 66 GTAP_data_Haiti_SA_v3e_66 FAO (2003) NO Honduras 66 GTAP_data_Honduras_SA_v3e_66 FAO (2003) NO Mexico 39 GTAP_data_Mexico_v2e_39 FAO (2003) NO Nicaragua 66 GTAP_data_Nicaragua_SA_v3e_66 FAO (2003) NO Panama 66 GTAP_data_Panama_SA_v3e_66 FAO (2003) NO Paraguay 74 GTAP_data_Paraguay_SA_v2e_74 FAO (2003) NO Peru 46 GTAP_data_Peru_SA_v2e_46 FAO (2003) NO Suriname 74 GTAP_data_Suriname_SA_v2e_74 FAO (2003) NO Trinidad and Tobago 66 GTAP_data_TrinidadTobago_SA_v3e_66 FAO (2003) NO Uruguay 61 GTAP_data_Uraguay_SA_v2e_61 FAO (2003) NO Venezuela 63 GTAP_data_Venezuela_SA_v2e_63 FAO (2003) NO

26
Developed, Large and Other Countries Region and Country Name
GTAP
No.
Name of the "Ready to Export" file
Inventory Source
Age Class
Australia 3 GTAP_data_Australia_v3e_3 FAO (2003) Plantations
only Canada 10 GTAP_data_Canda_v3e_10 Lowe et al. (1994) Yes China 13 GTAP_data_china_v3e_13.xls Yin (1995); Ministry of
Foresry, China. Yes
Japan 32 GTAP_data_Japan_v3e_32 FAO (2003) NO Korea, Republic of 70 GTAP_data_SKorea_v3e_70 FAO (2003) NO Korea, Democratic People’s Republic of 33 GTAP_data_NKorea_v3e_33 FAO (2003) NO New Zealand 45
GTAP_data_NZealand_v3e_45 FAO (2003) Plantations
only Russian Federation 51 GTAP_data_Russia_v3e_51.xls Backman and
Waggener (1990) Yes
United States of America 62 GTAP_data_US_v3e_62 USDA FIA (~1990) Yes

27
Table A2: Country and timber type definitions for Africa
Region and Country Name GTAP
No. M1 M2 M3 M4 M5 Africa Algeria 69 SWP HWP DTR -- TR Angola 73 SWP HWP DTR -- TR Benin 75 SWP HWP DTR -- TR Botswana 9 SWP HWP DTR -- TR Brunei Darussalam 75 SWP HWP DTR -- TR Burkina Faso 75 SWP HWP DTR -- TR Cameroon 75 SWP HWP DTR -- TR Central African Republic 75 SWP HWP DTR -- TR Chad 75 SWP HWP DTR -- TR Congo 75 SWP HWP DTR -- TR Cote d'Ivoire 75 SWP HWP DTR -- TR Djibouti 75 SWP HWP DTR -- TR Egypt 69 SWP HWP DTR -- TR Equatorial Guinea 75 SWP HWP DTR -- TR Eritrea 75 SWP HWP DTR -- TR Ethiopia 75 SWP HWP DTR -- TR Gabon 75 SWP HWP DTR -- TR Gambia 75 SWP HWP DTR -- TR Ghana 75 SWP HWP DTR -- TR Guinea 75 SWP HWP DTR -- TR Guinea-Bissau 75 SWP HWP DTR -- TR

28
Region and Country Name GTAP
No. M1 M2 M3 M4 M5 Africa Continued Kenya 75 SWP HWP DTR -- TR Lesotho 72 SWP HWP DTR -- TR Liberia 75 SWP HWP DTR -- TR Libyan Arab Jamahiriya 69 SWP HWP DTR -- TR Madagascar 75 SWP HWP DTR -- TR Malawi 42 SWP HWP DTR -- TR Mali 75 SWP HWP DTR -- TR Mauritania 75 SWP HWP DTR -- TR Morocco 38 SWP HWP DTR -- TR Mozambique 41 SWP HWP DTR -- TR Namibia 72 SWP HWP DTR -- TR Niger 75 SWP HWP DTR -- TR Nigeria 75 SWP HWP DTR -- TR Rwanda 75 SWP HWP DTR -- TR Senegal 75 SWP HWP DTR -- TR Sierra Leone 75 SWP HWP DTR -- TR Somalia 75 SWP HWP DTR -- TR South Africa 72 SWP HWP DTR -- TR Sudan 75 SWP HWP DTR -- TR Swaziland 72 SWP HWP DTR -- TR Tanzania, United Republic of 59 SWP HWP DTR -- TR Togo 75 SWP HWP DTR -- TR Tunisia 69 SWP HWP DTR -- TR Uganda 60 SWP HWP DTR -- TR Western Sahara SWP HWP DTR -- TR

29
Region and Country Name GTAP
No. M1 M2 M3 M4 M5 Africa Continued Zaire 70 SWP HWP DTR -- TR Zambia 77 SWP HWP DTR -- TR Zimbabwe 78 SWP HWP DTR -- TR Notes for Africa: SWP = Softwood plantation type; HWP = Hardwood plantation type; DTR = dry tropical forest; TR = tropical forest

30
Table A3: Country and timber type definitions for Central Asia
Region and Country Name GTAP No. M1 M2 Central Asia Afghanistan 70 P MIXED Armenia 76 P MIXED Azerbaijan 76 P MIXED Georgia 76 P MIXED Iran, Islamic Republic of 68 P MIXED Iraq 68 P MIXED Israel 68 P MIXED Jordan 68 P MIXED Kazakhstan 76 P MIXED Kuwait 68 P MIXED Kyrgyzstan 76 P MIXED Lebanon 68 P MIXED Oman 68 P MIXED Pakistan 71 P MIXED Qatar 68 P MIXED Saudi Arabia 68 P MIXED Syrian Arab Republic 68 P MIXED Tajikistan 76 P MIXED Turkey 57 P MIXED Turkmenistan 76 P MIXED United Arab Emirates 68 P MIXED Uzbekistan 76 P MIXED Yemen 68 P MIXED P = general plantation type; MIXED = other species

31
Table A4: Country and timber type definitions for Southeast Asia
Region and Country Name GTAP
No. M1 M2 M3 M4 M5 SE Asia Bangladesh 6 P -- -- -- TR Cambodia 70 P -- -- -- TR India 29 P -- -- -- TR Indonesia 28 P -- DT -- TR Lao People’s Democratic Republic 70 P -- -- -- TR Malaysia 43 P -- DT -- TR Mongolia 70 P -- -- -- TR Myanmar 70 P -- -- -- TR Nepal 71 P -- -- -- TR Philippines 47 P -- -- -- TR Singapore 52 P -- -- -- TR Sri Lanka 34 P -- -- -- TR Thailand 56 P -- -- -- TR Viet Nam 64 P -- -- -- TR P = Mixed plantation types; DT = higher value dipterocarp forests; TR = tropical forests

32
Table A4: Country and timber type definitions for Europe
Region and Country Name
GTAP No. M1 M2 M3 M4 M5 M7 M8 M9
Europe Albania 1 -- -- -- SSW SHW -- -- -- Andorra 70 -- CESW CEHW SSW SHW -- -- -- Austria 4 -- CESW CEHW SSW SHW -- -- -- Belarus 76 -- -- -- -- -- -- -- MIXED Belgium 5 -- CESW CEHW -- -- -- -- Bosnia and Herzegovina 70 -- -- -- SSW SHW -- -- Bulgaria 7 -- -- -- SSW SHW -- -- Croatia 26 -- -- -- SSW SHW -- -- Czech Republic 16 -- CESW CEHW -- -- -- -- Denmark 18 -- CESW CEHW -- -- -- -- Estonia 20 -- -- -- -- -- -- -- MIXED Finland 21 BSW -- -- -- -- -- BSWL France 22 -- CESW CEHW -- -- -- -- Germany 17 -- CESW CEHW -- -- -- -- Greece 24 -- -- -- SSW SHW -- -- Hungary 27 -- CESW CEHW SSW SHW -- -- Iceland 67 BSW -- -- -- -- -- BSWL Ireland 30 -- CESW CEHW -- -- -- -- Italy 31 -- -- -- SSW SHW -- -- Latvia 37 -- -- -- -- -- -- -- MIXED Lithuania 35 -- -- -- -- -- -- -- MIXED Macedonia 70 -- -- -- SSW SHW -- --

33
Region and Country Name
GTAP No. M1 M2 M3 M4 M5 M7 M8 M9
Europe Continued Netherlands 44 -- CESW CEHW -- -- -- -- Norway 67 BSW -- -- -- -- -- BSWL Poland 48 -- CESW CEHW -- -- -- -- Portugal 49 -- -- -- SSW SHW P -- Romania 50 -- CESW CEHW SSW SHW -- -- Slovakia 53 -- CESW CEHW SSW SHW -- -- Slovenia 54 -- CESW CEHW SSW SHW -- -- Spain 19 -- -- -- SSW SHW P -- Sweden 55 BSW -- -- -- -- -- BSWL Switzerland 11 -- CESW CEHW -- -- -- -- Ukraine 76 -- -- -- -- -- -- -- MIXED United Kingdom 23 -- CESW CEHW -- -- -- -- Yugoslavia 70 -- -- -- SSW SHW -- -- BSW = Boreal Softwood type; CESW = Central European softwoods; CEHW = Central European Hardwoods; SSW = Southern European softwoods; SHW = Southern European hardwoods; BSWL = Low access boreal softwoods;
MIXED = mixed hardwoods and softwoods (applied only to Former Soviet Union countries)
34
Table A5: Country and timber type definitions for Central and South America
Region and Country Name GTAP
No. M1 M2 M3 M4 M5 Central and South America Argentina 2 SWP HWP MIXED -- -- Belize 66 SWP HWP -- MIXED TR Bolivia 65 SWP HWP MIXED -- TR Brazil 8 SWP HWP MIXED -- TR Chile 12 SWP HWP MIXED -- -- Colombia 14 SWP HWP MIXED -- TR Costa Rica 66 SWP HWP -- MIXED TR Cuba 66 SWP HWP -- MIXED TR Dominican Republic 66 SWP HWP -- MIXED TR Ecuador 65 SWP HWP MIXED -- TR El Salvador 66 SWP HWP -- MIXED TR French Guiana 22 SWP HWP MIXED -- TR Guatemala 66 SWP HWP -- MIXED TR Guyana 74 SWP HWP MIXED -- TR Haiti 66 SWP HWP -- MIXED TR Honduras 66 SWP HWP -- MIXED TR Mexico 39 SWP HWP -- MIXED TR Nicaragua 66 SWP HWP -- MIXED TR Panama 66 SWP HWP -- MIXED TR Paraguay 74 SWP HWP MIXED -- TR Peru 46 SWP HWP -- MIXED TR
35
Region and Country Name GTAP
No. M1 M2 M3 M4 M5 Central and South America Continued Suriname 74 SWP HWP -- MIXED TR Trinidad and Tobago 66 SWP HWP -- MIXED TR Uruguay 61 SWP HWP MIXED -- TR Venezuela 63 SWP HWP MIXED -- TR SWP = Softwood plantation types; HWP = Hardwood plantation types; MIXED= Mixed species (productivity depends on country); TR = tropical forest
36
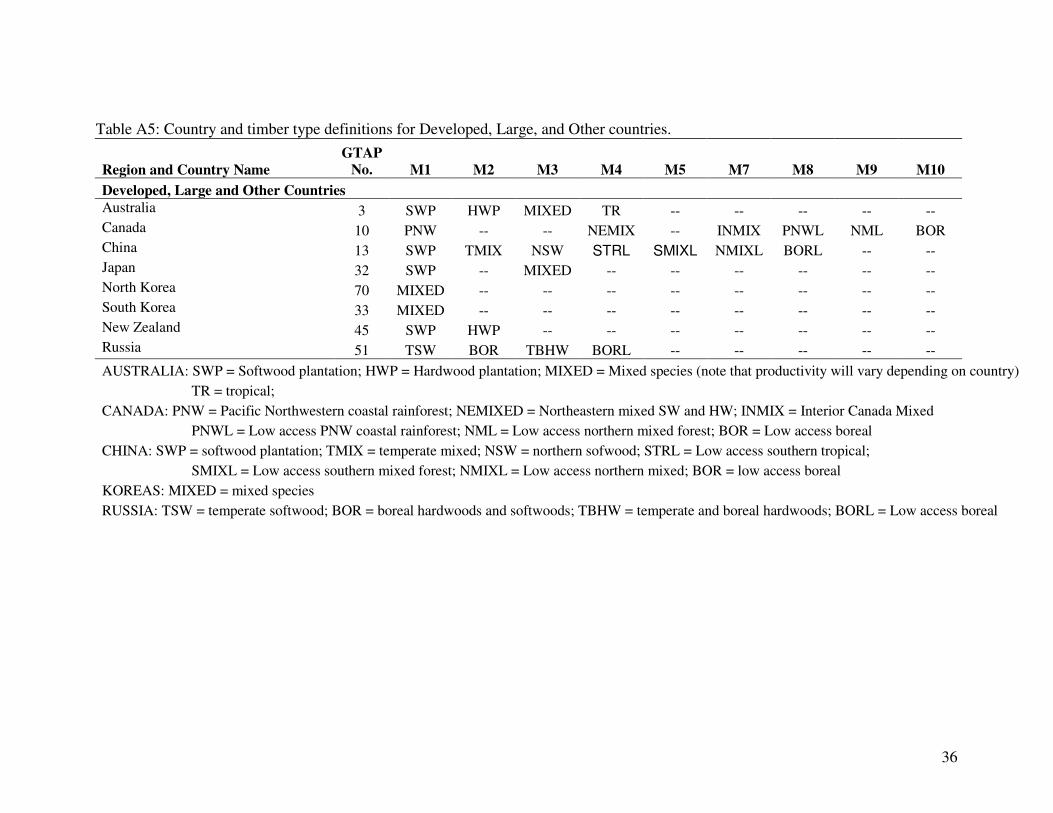
Table A5: Country and timber type definitions for Developed, Large, and Other countries.
Region and Country Name GTAP
No. M1 M2 M3 M4 M5 M7 M8 M9 M10 Developed, Large and Other Countries Australia 3 SWP HWP MIXED TR -- -- -- -- -- Canada 10 PNW -- -- NEMIX -- INMIX PNWL NML BOR China 13 SWP TMIX NSW STRL SMIXL NMIXL BORL -- -- Japan 32 SWP -- MIXED -- -- -- -- -- -- North Korea 70 MIXED -- -- -- -- -- -- -- -- South Korea 33 MIXED -- -- -- -- -- -- -- -- New Zealand 45 SWP HWP -- -- -- -- -- -- -- Russia 51 TSW BOR TBHW BORL -- -- -- -- -- AUSTRALIA: SWP = Softwood plantation; HWP = Hardwood plantation; MIXED = Mixed species (note that productivity will vary depending on country)
TR = tropical; CANADA: PNW = Pacific Northwestern coastal rainforest; NEMIXED = Northeastern mixed SW and HW; INMIX = Interior Canada Mixed
PNWL = Low access PNW coastal rainforest; NML = Low access northern mixed forest; BOR = Low access boreal CHINA: SWP = softwood plantation; TMIX = temperate mixed; NSW = northern sofwood; STRL = Low access southern tropical;
SMIXL = Low access southern mixed forest; NMIXL = Low access northern mixed; BOR = low access boreal KOREAS: MIXED = mixed species RUSSIA: TSW = temperate softwood; BOR = boreal hardwoods and softwoods; TBHW = temperate and boreal hardwoods; BORL = Low access boreal

37
Table A6: Country and timber type definitions for United States.
GTAP No. M1 M2 M3 M4 M5 M6 M7
United States of America 62 PNWP SP SSW NSW INTSW NSWL INTSWL
GTAP No. M8 M9 M10 M11 M12 M13 M14
United States of America 62 PNWL SHW NHW THW SMIXED TMIXED NMIXL PNWP = Pacific Northwestern west-side; SP = southern pine plantations; SSW = southern softwood; NSW = northern softwood; INTSW = Interior/mountain sofwood NSWL = low access northern softwood; INTSWL = low access interior softwood; PNWL = low access Pacific Northwestern softwood; SHW = southern hardwood; NHW = northern hardwood; THW = temperate hardwood; TMIXED = temperate mixed forest; NMIXL = low access northern mixed forest.