Countries of old men? - Friedrich Ebert Foundation
30
n The Baltic countries, along with other developed countries, are experiencing negative natural population growth accompanied by ageing societies, which is caused by pro- cesses denoted as the Second Demographic Transition. In addition, being among the less wealthy members of the EU, Estonia, Latvia and Lithuania have seen significant emigration, amplifying the negative population trend. n The Baltic states are perceived as a homogenous region within the EU, but the de- velopments of recent years and projections for the future point to diverse paths of development for Estonia vs. Latvia/Lithuania. Estonia has attained thin but positive immigration that is expected to continue in the coming years, while the populations of Latvia and Lithuania are expected to decrease as a result of net migration. Estonia’s population is projected to stay younger than Latvia’s and Lithuania’s, which are among the fastest ageing populations in Europe. n The policies aimed at tackling demographic challenges are not restricted to fertility boosting instruments that are expensive and inefficient. Instead, other policy actions can be aimed at affecting migration, transforming the labour market and using speci- fic tools to mitigate or make use of migration. The labour market policies – increasing productivity and labour participation, and working beyond the current retirement age – are the most efficient and are achievable only in line with improving the population’s education and health. n Improving institutional quality - government trust, efficiency and transparency, legisla- tion, the court system, protection of rights – is equally important, as these factors have proved to have an impact on migration and other areas where Lithuania and especially Latvia fall far behind Estonia and the EU. February 2018 ZANE VĀRPIŅA Demographic challenges in Estonia, Latvia and Lithuania Countries of old men? ANALYSIS Baltic states
Transcript of Countries of old men? - Friedrich Ebert Foundation

n The Baltic countries, along with other developed countries, are experiencing negative natural population growth accompanied by ageing societies, which is caused by pro-cesses denoted as the Second Demographic Transition. In addition, being among the less wealthy members of the EU, Estonia, Latvia and Lithuania have seen significant emigration, amplifying the negative population trend.
n The Baltic states are perceived as a homogenous region within the EU, but the de-velopments of recent years and projections for the future point to diverse paths of development for Estonia vs. Latvia/Lithuania. Estonia has attained thin but positive immigration that is expected to continue in the coming years, while the populations of Latvia and Lithuania are expected to decrease as a result of net migration. Estonia’s population is projected to stay younger than Latvia’s and Lithuania’s, which are among the fastest ageing populations in Europe.
n The policies aimed at tackling demographic challenges are not restricted to fertility boosting instruments that are expensive and inefficient. Instead, other policy actions can be aimed at affecting migration, transforming the labour market and using speci-fic tools to mitigate or make use of migration. The labour market policies – increasing productivity and labour participation, and working beyond the current retirement age
– are the most efficient and are achievable only in line with improving the population’s education and health.
n Improving institutional quality - government trust, efficiency and transparency, legisla-tion, the court system, protection of rights – is equally important, as these factors have proved to have an impact on migration and other areas where Lithuania and especially Latvia fall far behind Estonia and the EU.
February 2018
ZANE VĀRPIŅA
Demographic challenges in Estonia, Latvia and Lithuania
Countries of old men?
ANALYSIS
Baltic states

ZANE VĀRPIŅA | COUNTRIES OF OLD MEN?
Baltic states
Content
2
1. Introduction: Outlook on Europe and the Baltic states . . . . . . . . . . . . . . . . . . . . . . .3
2. Demography of the Baltic states – status and causes of demographic decline . 52.1.Negative population growth . . . . . . . . . . . . . . . . . . . . . . . . . . . . . . . . . . . . . . . . . . . . 5
2.1.1. Negative natural change . . . . . . . . . . . . . . . . . . . . . . . . . . . . . . . . . . . . . . . . . . . 62.1.2. Migration . . . . . . . . . . . . . . . . . . . . . . . . . . . . . . . . . . . . . . . . . . . . . . . . . . . . . . . . 8
2.2. Ageing society . . . . . . . . . . . . . . . . . . . . . . . . . . . . . . . . . . . . . . . . . . . . . . . . . . . . . . 11
3. What is to come – projections for 2030 and beyond . . . . . . . . . . . . . . . . . . . . . . . .12
4. Implications of changing demography . . . . . . . . . . . . . . . . . . . . . . . . . . . . . . . . . . . .154.1. Threat to competitiveness . . . . . . . . . . . . . . . . . . . . . . . . . . . . . . . . . . . . . . . . . . . 154.2. Dampening economic growth . . . . . . . . . . . . . . . . . . . . . . . . . . . . . . . . . . . . . . . . 164.3. Fiscal outcomes: pensions, social care, health and education . . . . . . . . . . . . 164.4. Changing consumptions patterns . . . . . . . . . . . . . . . . . . . . . . . . . . . . . . . . . . . . . 174.5. Structural changes in education and health sectors . . . . . . . . . . . . . . . . . . . . . 17
5. Solutions and options . . . . . . . . . . . . . . . . . . . . . . . . . . . . . . . . . . . . . . . . . . . . . . . . . . .185.1. Policies aimed at affecting childbearing behaviour . . . . . . . . . . . . . . . . . . . . . . 195.2. Policies aimed at migration . . . . . . . . . . . . . . . . . . . . . . . . . . . . . . . . . . . . . . . . . . 215.3. Policies to affect the labour market . . . . . . . . . . . . . . . . . . . . . . . . . . . . . . . . . . . 235.4. Mitigating effects from emigration . . . . . . . . . . . . . . . . . . . . . . . . . . . . . . . . . . . . 27
6. Concluding remarks . . . . . . . . . . . . . . . . . . . . . . . . . . . . . . . . . . . . . . . . . . . . . . . . . . . .28
Literature . . . . . . . . . . . . . . . . . . . . . . . . . . . . . . . . . . . . . . . . . . . . . . . . . . . . . . . . . . . . . . . .29
Imprint . . . . . . . . . . . . . . . . . . . . . . . . . . . . . . . . . . . . . . . . . . . . . . . . . . . . . . . . . . . . . . . . . . .30

3
1. UN Population Division database:
https://esa.un.org/unpd/wpp/Download/Standard/Population/
Figure 1.World population 1950–2100 (statistics and projections)
Source: United Nations, Department of Economic and Social Affairs, Population Division (2017). World Population Prospects: The 2017 Revision, custom data acquired via website.
1. Introduction: Outlook on Europe and the Baltic states
In 2016, the population of the European Union grew by 1.5 million (3%) with zero natural change but fuelled by net immigration, according to a 10 July 2017 Eurostat report (Eurostat, 2017). At the same time, the situation in the Baltic countries, which comprise 6.2 million people, or 1.3% of the EU population, is darker. In just one year, Lithuania lost 1.42% and Latvia 0.96% of its population. Es-tonia is doing somewhat better at just a 0.02% po-pulation loss. Lithuania and Latvia are the two EU record breakers in this negative trend, with Croatia (-0.87%), Bulgaria (-0.73%) and Romania (-0.62%) coming close. Overall, ten EU countries experien-ced decreases in population, while in eighteen the population grew.
Latvia and Lithuania also have the highest rate of depopulation in the world as shown by UN popu-lation data.1 Between 2000 and 2017, Latvia lost 18.22% and Lithuania 17.46% of its population. Disregarding a few mini-states, this is the biggest loss of population in the world. Estonia is doing marginally better, showing a loss of 6.4% of its
population between 2000 and 2017. Revealingly, only 31 of 233 countries on the UN list show de-population, and 10 of these are mini-states with a maximum of 100,000 people; 16 of them are in Eastern and Southern Europe and Western Asia, including Russia, Georgia and Armenia.
There are two contradicting demographic trends in the world. On one side, the world’s population is skyrocketing, approaching 8 billion and projec-ted to reach 10 billion by 2055 (UN, 2015). Global population growth has slowed down but is still positive at 1.12% per year (UN, 2015). In previous decades, the biggest additions to global populati-on have come from China, India and other Asian countries, but in the future, according to the UN, African countries will provide most of this growth. From the other side, developed countries (Europe and North America) are experiencing low fertility rates and neutral or negative natural population
ZANE VĀRPIŅA | COUNTRIES OF OLD MEN?
Baltic states

4
growth, resulting in overall stable or shrinking po-pulations. The United Nations projected in 2015 that the world population will reach its peak in around the year 2100 and will start to diminish thereafter.
Countries also experience very different age struc-tures. While developing countries have younger populations, more developed countries’ popu-lations are ageing. The difference in the age of populations is striking – the median age ranges from as low as 15.5 years in Niger and below 20 in other sub-Saharan African countries to 48 years in Germany and 44.3 across the EU. Estonia, Latvia and Lithuania represent part of the world where the population is shrinking and ageing (the me-dian age in 2016 was 41.6, 42.9 and 43.1 for Es-tonia, Latvia and Lithuania respectively). Still, the slowdown of population growth in less developed countries will gradually push up the age of popu-lations everywhere. The old age dependency ra-tio – the number of people aged 65 and over as a percentage of the working population aged 15 to 64 – is expected to triple globally by 2100 (from 12 to about 38) while the old age dependency ra-tio in developed countries will double (from 25 to about 50) (IMF, 2015).
Changing demographics pose important challen-ges for all countries, but the extent and specifics of these challenges vary. This paper addresses challenges that demographic changes bring to the Baltic countries of Estonia, Latvia and Lithuania. Similarities and differences between these three neighbouring countries are presented by looking at status (section 2), projected developments (section 3), consequences for the economy and society (section 4), and possible solutions (secti-on 5). Solutions are proposed rather than prescri-bed, with the aim of illuminating the territory of ac-tion and available tools for mitigating the effects of shrinking and ageing populations.
ZANE VĀRPIŅA | COUNTRIES OF OLD MEN?
Baltic states

5
Figure 2.Population of the Baltic countries 1960–2017
Source: Eurostat databases [demo-gind]
2. Crude rates are the parameters expressed per 1,000 inhabitants. A crude rate of birth of 11 (Lithuania, 2016), for example, means that there were 11 children born per 1,000 people.
2. Demography of the Baltic states – status and causes of demographic decline
The Baltic states occupy a relatively small region in the EU. In 2017, this region was home to 6.1 million people: 1.3 million in Estonia, 1.9 million in Latvia and 2.9 million in Lithuania (Figure 2). The population of the region peaked right before independence: in 1990, it reached close to 8 mil-lion, and each Baltic country reached the largest population in its history between 1990 and 1992.With the economic and social turmoil of the first years of independence the populations started to shrink, however, and in 2017 were very close to their 1960s numbers. Interestingly, both populati-on gains and losses over this eighty-year period have been relatively small in Estonia compared to Lithuania and Latvia.
Two interconnected processes – a shrinking po-pulation (section 2.1) and an ageing population (section 2.2) – have characterised the demogra-phic situation in the Baltic countries over the last decades.
2.1.Negative population growth
The decline in population is the result of two mu-tually reinforcing developments: negative natural population growth and migration. The crude ra-tes2 are good at illustrating the underlying proces-ses that determine population movements. The developments have been analogous in all three countries (Figure 3) since about the 1970s. Birth rates fell below death rates between 1990 and 1994 and have remained there ever since. Hence, the natural change in population is and has been negative.
ZANE VĀRPIŅA | COUNTRIES OF OLD MEN?
Baltic states

6
Figure 3.Population change – crude rates at national level (indicator per 1,000 inhabitants)
Source: Eurostat databases [demo-gind]
The net migration numbers are more volatile. Pre-independence immigration was replaced by emigration starting from 1990; every year since, net migration has been negative. The peak in the early 1990s is associated with Russian citizens leaving, the 2000 peak in Estonia is associated with one-off legislative changes, the 2004 peak in Latvia and Lithuania is associated with EU acces-sion, and the peak after 2008, again in Latvia and Lithuania, is associated with the global economic crisis. The 2004 and 2008–2009 waves of emigra-tion suggest that much emigration from the Baltic States is economically driven. Estonia, however, has always been less affected by emigration. Its rates have been more modest, and since 2015 the country has been enjoying net immigration.
2.1.1. Negative natural change
While life expectancy gradually increases, the main determinant in the natural decline in popu-lation is a fertility level below the replacement le-vel (according to the conventional indicator, this
means less than 2.1 children born per woman in her lifetime). The average fertility rates in all Euro-pean countries have dropped far below the repla-cement rate of 2.1 (Figure 4). The average in 2015 was 1.58 across Europe, and in the Baltic States it dropped as low as 1.1 children per woman in 1998 and has yet to recover to previous levels. The fall in the early years of independence in all of the Baltic states is associated with insecurity, econo-mic instability and anomie, which are known to have negative effects on the willingness to create offspring and lead people to postpone fertility de-cisions. The fertility rate in 2017 was 1.7 in Latvia and Lithuania and 1.6 in Estonia, and is not expec-ted to reach 2 due to emigration and age structure (Eurostat projects that in 2030 total fertility rates (TFR) will be 1.75 in Estonia, 1.85 in Latvia and 1.76 in Lithuania).
ZANE VĀRPIŅA | COUNTRIES OF OLD MEN?
Baltic states

7
Figure 4.Fertility rates in the EU, 2015
Source: Eurostat databases [proj_15naasfr]
These developments do not come as a surprise. Europe is undergoing a period of demographic change, the so-called Second Demographic Tran-sition (SDT). The main features of this SDT in the areas of family and fertility are falling marriage rates coupled with an increasing age at first mar-riage, a rise in both pre- and post-marital cohabita-tion, a rise in divorce rates, a decline in remarriage, which is being replaced by cohabitation, high and rising extra-marital fertility, more common paren-thood within cohabitation, delayed childbearing, reduced higher-order fertility and often (but not necessarily) under-replacement fertility as well as purposeful childlessness.
The reason for SDT is societal developments and changes in values as individuals move higher up Maslow’s pyramid of needs. Better welfare, more highly developed and democratic societies, and more opportunities at the individual level lead to a focus on self-realisation and self-expression, pri-oritising individual needs over those of family and society. While lacking certain aspects to be fully called a demographic transition, the SDT has been accepted as a general and true description of so-cietal transformations with important demogra-
phic outcomes. Cohabitation is becoming increa-singly common as a family setup, and registering a partnership in the form of marriage is no longer a precondition for childbearing. Marriage has not fully lost its role, but has become a symbolic and festive act, often following rather than preceding childbearing.
In 2018, it is almost indisputable that Baltic socie-ties are taking the shape of Western societies and that their values and lifestyles are increasingly si-milar, including with regard to higher-order values such as self-expression and individualism, which are deterministic in the context of family and child-bearing. In the Baltic countries in the beginning of the 1990s, many SDT features appeared simul-taneously – decreased marriage and increased divorce rates, increased age at first birth, increa-sed popularity of cohabitation and an increasing number of children born outside marriage. At the same time, there are studies that point at a con-flict between views and practical behaviour. For example, for Latvia, Eglīte et al. (2013) found that “[the] majority of respondents consider marriage an essential value but at the same time 45% of the children are born outside marriage.” The same
ZANE VĀRPIŅA | COUNTRIES OF OLD MEN?
Baltic states

8
study reports that the perceived ideal childbearing age for females is 23.5 years, but the average age of females at first birth in 2012 was 27 years (CSB Latvia databases). The progress with SDT in the Baltic countries varies – Estonia and Latvia are rather far along by some indicators. In 2015 in Es-tonia, 58% of children were born outside marriage; in Latvia this number was 42%, but in Lithuania it was a relatively smaller 28%. This can be part-ly explained by the prevalence of Catholicism in Lithuania.
2.1.2. Migration
Europe was once the most populous region in the world. In the 1950s, one-fifth of the world’s popu-lation lived in Europe. In 2017, a European coun-try was home to every tenth person in the world. In the coming years, however, Europe will lose its relative weight among the world’s population even more. The UN projects that by 2050, only about 7% of the global population will live in Eu-rope. Decades of very low birth rates have slowed population growth or turned it negative. In 2016, there were as many births as deaths in the EU (5.1 million), and hence natural population growth was flat (Eurostat, 2017). Population growth in Europe as a whole relies on immigration.
But immigration does not materialise in all coun-tries in the same way (Richer). Western European countries receive an inflow of people from both poorer European countries and third countries. Eastern Europe loses population not only due to natural decline but also to emigration. These countries are population donors and welcome few immigrants partly because they have policies that are not welcoming to third country nationals but also because at the societal level there is a high degree of hostility to immigrants owing to histori-cal experience.
Emigration from Central, Eastern, and Southeas-tern Europe in previous decades has been “unu-sually large, persistent and dominated by educa-ted and young people,” notes Atoyan (2016). The world has seen multiple waves of migration, but the post-1990 east-west migration in Europe has
been unique in many ways. First, it is arguably the largest economic migration in modern times. It is unprecedented in terms of volume, speed and per-sistence. It has been reinforced by the low barri-ers of moving because of low costs (geographical proximity) along with open borders and open la-bour markets. Second, it has been a movement of mostly young and highly skilled people. And third, all indications point to these moves as being more permanent than in any earlier observed wave of migration.
The migration patterns differ between Estonia and Latvia/Lithuania. Emigration from Estonia has been far less severe (Figure 5); since 2000, only about 5% of the population (46,000 people) have emigrated, which sharply contrasts to the close to 20% from Latvia and Lithuania (amounting to about 270,000 and 470,000 respectively).3 Estonia has managed to avoid large emigration flows,4 but despite that its age structure remains similar to that in other countries. Most Lithuanian and Lat-vian emigrants have ended up living in the UK, Ire-land and Germany.
3. Precise migration statistics differ depending on source and metho-dology.
4. The reason for lower emigration can be only partly explained by the wage differentials – the average salary in Estonia is below that in the UK or Germany. This effect remains to be explained.
ZANE VĀRPIŅA | COUNTRIES OF OLD MEN?
Baltic states

9
Figure 5.Net migration in the Baltic countries, 2000–2017
Source: Eurostat databases, [demo_gind]
The 2017 migrant age split clearly shows the emigration of young people (Figure 6). Lithua-nia again has lost a striking 9,000 people in their twenties, plus another 1,000 right after secondary school, aged 19. It is unlikely that all of this popu-lation has emigrated for study purposes, although some have. Latvia has also lost half of the num-ber Lithuania has, while Estonia has received an inflow of young people.5 The emigration of young and educated people brings important non-eco-nomic externalities, as noted by Atoyan (2016), such as the exit of those who are potential agents of change for improvement, growth and transfor-mation. Additionally, skilled labour has increasing returns with scale. It earns more where it is ab-undant and also tends to move to countries whe-re it is abundant (forming clusters). For sending countries, the effect is disproportionally negative (World bank, 2009).
5. The immigration spike of 0- to 2-year-olds for Latvia (and other coun-tries) is associated with citizenship registration of children of Latvian nationals born abroad.
ZANE VĀRPIŅA | COUNTRIES OF OLD MEN?
Baltic states

10
Figure 6.Net migration in Baltic countries by age, 2017
Source: Eurostat databases [proj_15nanmig]
Economic migration benefits migrants themsel-ves and the receiving countries and the EU as a whole. From the other side, for sending countries the emigration of educated young people has slo-wed economic growth and income convergence. It has lowered competitiveness and enlarged the relative size of bureaucracy and social spending
relative to economies. Hence, emigration and slow convergence will become reinforcing factors contributing to further emigration. Migration reci-pient countries, as part of the common EU market, have to assume responsibility for preventing the draining of labour from donors (Central, Eastern, and Southeastern Europe).
Figure 7.Crude rate of total population change by regions in Europe, 2015 (per 1,000 inhabitants)
Source: Eurostat, regional statistics [demo_gind3, demo_gind], NUTS3 regions
(per 1 00 inhabitants)
EU-28 = 3.5
< -6
-6 — <6
0 — <6
6 — <12
> = 12
Data not available
ZANE VĀRPIŅA | COUNTRIES OF OLD MEN?
Baltic states

11
EU28 Estonia Latvia LithuaniaYear 2016Proportion of population 0–14 15.6 16.1 15.2 14.7Proportion of population 15–64 65.3 64.9 65.1 66.4Proportion of population 65+ 19.2 19.0 19.6 19.0Proportion of population 80+ 5.4 5.1 5.0 5.3Old dependency ratio (65+ over 15–64) 29.3 29.3 30.2 28.6Median age of population 42.6 41.6 42.9 43.1
Year 1987Old dependency ratio (65+ over 15–64) NA 17.0 17.3 15.5Median age of population NA 33.9 34.7 32.0
Table 1.Age structure indicators for Baltic countries and EU28
Source: Eurostat databases, [demo_pjanind]
Intraregional migration in the Baltic countries is a different but related issue. All three countries are experiencing growing regional disparities with some regions doing relatively better but emptying more remote rural areas (Figure 7). Even the ap-parent positive migration to Estonia does not spill beyond the Tallinn region, which is the only region in Estonia with positive net migration.
In addition, the Tartu (Estonia), Riga (Latvia) and Vilnius (Lithuania) regions where most economic activity is located are losing population to a lesser degree compared to other parts of these countries since they receive some of the intra-country popu-lation mobility. Remote parts are depopulated and ageing: schools are being closed or turned into as-sisted living facilities (Springe, 2017). Certain mu-nicipalities are gradually becoming uninhabitable due to a dying social life and local economy.
2.2. Ageing society
The greying of the population is the other demo-graphic process taking place in Europe and the Baltic states. Ageing of the population happens naturally with increasing life expectancy and fal-ling birth rates, and hence it has been a rather sta-ble trend since the beginning of the last century.
In that sense, the stress associated with this is overestimated. The first phase, however, brought about a bigger middle of working age groups in the population and hence was economically be-neficial and did not create any stress on society. The second phase that is happening currently in developed countries is a shift from middle-aged to senior populations. This trend is accelerating and is expected to continue to do so.
The old age dependency ratio in Baltic countries has risen from the lowest levels in recent times (in 1987 it was 17.0% in Estonia, 17.3% in Latvia and 15.5% in Lithuania) to 29–30% in 2017 (see Table 1). Put differently, there are 3.3 to 3.4 working age people for each person older than 65. This num-ber is similar to that in Western Europe. At the beginning of independence, half of the population was older than 34, but in 2017 the median age is approaching 43; the population has become on average 10 years older.
Along with an overall age increase, the share of the oldest population (those above 80) has also been increasing and is now about 5% in the Baltic countries and the EU. This indicator is important because it is assumed that after 80 years of age, health conditions rapidly deteriorate and individu-als need assistance in everyday life. Hence, it has an increasing impact on health and social care spending.
ZANE VĀRPIŅA | COUNTRIES OF OLD MEN?
Baltic states

12
3. What is to come – projections for 2030 and beyond
The population of the Baltic states will continue to shrink in the future according to Eurostat and the UN, the two most notable population projecti-on6 agencies. This development is in line with pro-cesses happening elsewhere in Europe. By 2030 – over the following 12 years – Estonia will lose 1% of its population, Latvia 11% and Lithuania as much as 15% (Figure 8). Interestingly, just as his-torical population swings for Estonia have been small (see section 2.1), the projected numbers for the future also look stable. Latvia’s and Lithuania’s populations grew more during the Soviet period but have lost since and will continue losing a rela-tively larger share.
Figure 8.Baltic countries’ populations 2017–2050 (Eurostat baseline projections)
Source: Eurostat databases [proj_15ndbims]
By 2050, the development for Baltic countries is projected to be in the same negative direction
but with a very different magnitude: -4% in Esto-nia, -23% in Latvia and a striking -32% in Lithua-nia. In 2016, there were 22,000 children born in Latvia, whereas in 2030 there are projected to be only 14,000. For comparison, these numbers are 30,000 vs. 20,000 for Lithuania and 13,000 vs. 12,000 for Estonia.
The age structure will continue to change (Figure 9) toward an older population. Currently, the de-mographic structure in all three Baltic countries and the EU on average is very similar – one-fifth of the population has reached 65 years of age, 15% to 16% are children, and the working po-pulation aged 15 to 64 constitute 65%, or about two-thirds, of the population. Important structural changes will happen over the following 12 years
6. Eurostat projections are used throughout this paper. The UN and Eu-rostat projections carry negligible differences due to slightly different assumptions, but they are not important for this discussion. The au-thor is aware that reliability and accuracy of projections is subject to criticism, which is the why Eurostat’s methodologically sound data are used. The projections take into account expected non-zero migration.
before 2030, when the Baby Boomers will be ente-ring retirement, and the processes will continue through 2050 at a slower rate. In addition, owing to emigration of younger people, the proportion of older people will grow faster in Latvia and Lit-huania than in Estonia and the EU28. By 2030, the share of pension age people in the population will
ZANE VĀRPIŅA | COUNTRIES OF OLD MEN?
Baltic states

13
have exceeded 25% in Latvia and Lithuania, but by 2050 it will have reached 30%. Emigration from Estonia has been significantly lower, reflecting the younger population structure that is ageing at the same rate as the EU. The share of children in all populations, however, is expected to remain stab-le at 15%. The retired population will expand at the expense of the working age group. In Latvia and Lithuania, by 2050 only slightly more than 50% of
the population will be in the (conventional) wor-king age range of 15 to 64 years. The expected 57% working age population in Estonia is due to positive net migration that consists of younger people at fertile age, hence reinforcing the positive migration effect on the population. The changing age structure is reflected in growing old age de-pendency ratios.
Figure 9.Population age structure indicators in Baltic countries and EU28, statistics and projections(a) Population by main age groups (0–14, 15–64, 65 +)
Source: Eurostat databases [demo_pjanind], [proj_15ndbims]
(b) Median age and old dependency ratio (population 65+ to population aged 15–64)
ZANE VĀRPIŅA | COUNTRIES OF OLD MEN?
Baltic states

14
Accordingly, the economic burden on the working population rises, which in simple terms means that there are fewer working people to produce, pay taxes, and sustain the government, pension and healthcare system for the growing pensioner group. In 2017, 100 people at working age had to support 30 pension age people (in the EU28 and all Baltic countries), but in 12 years this number of pension age people will be 38 in Estonia and 43 and 46 in Latvia and Lithuania respectively. Furthermore, in 2050 there will be about 60 pen-sion age people per 100 working people. This is a technical indicator. In reality, the number of tax-payers is significantly smaller than the statistical working age population. Just the estimate for Latvia is illustrative: the working age population (those aged 15 to 64) in 2017 was 1.26 million (estimated to be 1.02 in 2030, or minus 240,000). People generally do not start working at 15, howe-ver. Applying a rough estimate of an employment rate of 70% (in 2016 it was 68.7%), the actual labour force in Latvia is just below 900,000, and only about 600,000 are contributors to the social
system (according to Reirs, LR Minister of Welfare, 2017 communication). Therefore, the labour force may see a possible reduction of 168,000 people, with some 110,000 fewer contributors by 2030.
An additional expected implication concerns migration. Figure 10 projects the situation compa-ring prospects in Europe with and without migra-tion (from The Economist, 12 July 2017). Only four countries in the coming years would see a rise in population without immigration (but even that is presumably because of second generation immigrants contributing to natural growth). Most of Europe needs immigration to compensate for shrinking populations, but Eastern Europe is loca-ted in the fall-fall quadrant of the figure meaning that populations would shrink under either scena-rio.
Figure 10.Europe population change with or without migration 2017–2030, projections, in percentages
Source: The Economist, 12 July 2017, based on Eurostat [proj_15npms]
Population rises withmigration but falls without
Population falls withor without migration
Population rises withor without migration
15
10
5
0+
-5
15
10
20
2540 30 20 10 0 10 403020 50 60+-
With migration
With
out m
igra
tion
Europe, population change with or without migration 2017 - 50 forecast, % Europe: Western Easterm
Population falls withmigration but rises without
Ireland
France
Norway
SwedenBelgium
Cyprus
LuxembourgMalta
Denmark
AustriaSlovenia
EU
SpainNeth.
Finland
GeramnyItalyPortugal
BulgariaGreece
Latvia
Lithuania Romania
Croatia
Poland
Hungary
EstoniaSlovakia
Czech Rep
Britain
ZANE VĀRPIŅA | COUNTRIES OF OLD MEN?
Baltic states

15
Though the Baltic countries occupy the same spa-ce, Lithuania stands out particularly in terms of expected emigration, which is projected to exceed 300,000 (more than 20,000 yearly) in the coming ten years. In this regard, Latvia’s situation appears less severe. Emigration is expected to continue at about 7,000 people yearly, amounting to 100,000 by 2030. Estonia, on the other hand, is already en-joying a population inflow of thin but true immigra-tion of about 2,000 people a year and finds itself in a very different situation than its Baltic neighbours. Estonia’s population has increased largely thanks to immigrants from the east (Ukraine, Belarus and Russia) and Estonians returning from Finland. Immigration to Estonia cannot offset the ever-in-creasing natural decline, but at least it is working against it.
4. Implications of changing demography
Shrinking and ageing populations pose immense challenges to the economies of European coun-tries. The economies of the Baltic states along with other Central, Eastern, and Southeastern Eu-rope are particularly affected because of the hig-her pace of changes compared to Western Euro-pe. The precise size of the impact from changing demographics is impossible to predict as change in demographics enters the equation at multiple levels and in addition is itself of unknown magnitu-de. There is also limited historical evidence about such effects.
The most important fields of influence, however, can be identified.
4.1. Threat to competitiveness
Ongoing demographic changes harm competi-tiveness via the labour market. A shortage of la-bour has the most direct and most critical impact on the economy. Emigration and ageing create stress in local labour markets primarily due to the emigration of skilled people and to a lesser extent because of retirement. The fact that emigrants are skilled people causes brain drain and lowers pro-ductivity (Burns and Mohapatra, 2008). Remittan-
ces, according to the International Monetary Fund (IMF, 2016), may have played a very important role in the labour markets by reducing supply of labour by raising reservation wages.
According to Eurostat projections, in the coming years Latvia will lose 18,000 to 20,000 working age people partly due to migration and partly to retirement, which constitutes close to 2% per year. Lithuania is projected to lose 3% of its working age people yearly. Stakeholders, especially busi-nesses, increasingly experience labour shortages. According to the 2017 Foreign Investors Senti-ment Index in Latvia (Sauka, 2018), demography and access to labour are two of the most prob-lematic areas. It is assessed that investment at-tractiveness over the previous year has decreased “because of availability (or unavailability) of labour.” Investors assess that the government is not doing enough to attract labour from abroad. Similar opi-nions are expressed concerning the Lithuanian labour market (The Economist, 19 January 2017).
Businesses adapt to labour shortages by raising wages to attract workers from farther and farther away. But that at the same time means that wa-ges have grown faster than productivity which, in turn, makes exports less competitive. The other response by companies has been automation and robotisation. Investment in technologies is cost-ly and not sufficiently institutionally supported. Some jobs such as those performed by doctors, nurses, caregivers, teachers, and drivers cannot be performed by machines, at least not soon.
The Baltic countries are adapting to the idea of im-migration pushed by employers. Estonia appears to be ahead of its neighbours by opening the mar-ket to foreign workers. Legislation for employing non-EU citizens is principally similar in all Baltic countries – the employer has to make sure that no respective skill set is available in the domestic labour market as a way to give priority to locals and fulfil a minimum salary requirement. The dif-ference lies in the details of implementation. Em-ployment of third country nationals in Latvia and Lithuania is administratively complicated and, as assessed by businesses, hostile. Estonia, however, states openly that the “government encourages
ZANE VĀRPIŅA | COUNTRIES OF OLD MEN?
Baltic states

16
employers to attract qualified individuals from non-EU countries” (workinestonia.com, 2018). It offers short-term employment plans for foreign talent to start working quickly without waiting for a residence permit. It has also established an on-line platform, “work in Estonia,” that offers easy access to all information needed regarding im-migration.
4.2. Dampening economic growth
The associated macroeconomic risk from a shrin-king labour force is its implication for economic growth in the Baltic countries. The IMF has esti-mated that in the period 1999 to 2014, emigra-tion lowered GDP growth due to loss of labour to emigration (about two-thirds of the losses) and skill deterioration (the remaining one-third). “Migration shaved 0.6 to 0.9 percentage points off annual growth rates” (Atoyan et al, 2016) in se-veral Central European and South-East European countries, including Latvia and Lithuania. The IMF estimates that without emigration, by 2030 the GDP per capita in Latvia and Lithuania could be 3 to 4% higher than otherwise. In addition, the na-tural population shift into retirement age will slow growth even further.
Opposite this negative effect on the labour mar-ket, an inflow of remittances increases the money supply in sending countries and stimulates the economy. The size of remittances to Baltic coun-tries is unknown, but in Romania and Bulgaria they constituted about 5% of GDP in 2007 (Dietz, 2009). Remittances are primarily used to finan-ce consumption but could instead be invested if appropriate stimulus were given.
4.3. Fiscal outcomes: pensions, social care, health and education
Shrinking and ageing populations put public fi-nances under pressure via two channels: (1) fiscal spending and (2) reduction of economic growth.
A retiring population increases direct fiscal spending for pensions and health care. The IMF
(2015) estimates that in the absence of reforms in developed countries, age-related public spen-ding between 2015 and 2100 will increase by an aggregate 5% of GDP – by 1.1% for pension spending and by 3.8% for health spending on the aged. Health spending will constitute a major part of the increase, while pension spending will remain relatively less affected due to the pensi-on reforms of early 2000. Current public pensi-on spending in Latvia is 7.6% of GDP, in Estonia 7.8%, and in Lithuania 7.4%. The pension age in all Baltic countries is gradually being raised and will reach 65 between 2022 and 2025, and because of that the actual number of pension age people will not substantially increase. Therefore, by 2030 the social budget will be affected to a lesser ex-tent; it is projected to rise to 8.2% in Estonia and Lithuania, but even to decrease to 6.5% in Latvia. Additionally, the three-pillar pension systems fo-resee increasing reliance on the second and third pillars, which are outside the social budget. Health spending will increase because older populations require more in-patient and out-patient treatment, and treatment per patient gets more expensive. For Latvia, however, the effect by 2030 will be mar-ginal because the pre-pension age population also spends a big share of funds, and that population will shrink. Additionally, the number of the oldest elderly people will increase, and it is assumed that after the age of 80 the probability of needing ever-yday assistance and care rises.
By 2030 in the Baltic countries, social care for el-derly people will become one of the major challen-ges of the social systems. Statistics about social care for elderly people is fragmented and scarce. Currently it is shared between hospitals, state and municipal care homes, and families. Hence it is unclear what it costs to the society, and further-more it is difficult to extrapolate future costs.
The second channel is the effect of reduced eco-nomic growth. Reduced economic activity would suppress tax revenues, and governments will be-come relatively more sizeable and costly.
On the contrary, there is some opportunity for saving on expenditures with reduced population groups. In 2017, there were 22,000 children born
ZANE VĀRPIŅA | COUNTRIES OF OLD MEN?
Baltic states

17
in Latvia, whereas in 2030 there will only be 14,000 new-borns, with analogous trends in Estonia and Lithuania. There will be a short upswing of 12,000 children in secondary education owing to current birth rates, but fewer people of higher educati-on age. These statistics are unpleasant, but in principle constitute space for savings. From the practical perspective, those savings will be hard to realise, however, for political reasons (proof to be seen in the current debate over school closings in the periphery and merging of higher education institutions in Latvia).
4.4. Changing consumptions patterns
An ageing and shrinking population affects the economy also by changing patterns of consump-tion. Fewer people means less local demand for anything from bread and butter to cars and houses. The life-cycle hypothesis (Modigliani, 1966) that explains individual consumption patterns propo-ses that the consumption and savings behaviour of individuals is planned over their lifetimes. Indi-viduals aim to even out consumption by accumu-lating during the working and earning period and dis-saving in retirement. An increasing share of the population entering retirement age means that savers will start to claim back their savings. Uni-ted States policymakers are cautious about what effects this will have on the financial markets. In the Baltic countries, this may be less of a problem since individual savings do not constitute import-ant resources. But the problem there will be of a different nature. Since savings are insufficient, se-niors are cutting down their consumption in com-parison to pre-pension spending. In the United States, it is estimated that in retirement spending drops by 37% (McBride, WEF, 14 September 2017), which is a major deflationary force. No estimates are available for the Baltic countries, but clearly the effect will be sizeable.
The consumer basket for seniors also differs from that for the younger population. Things like consu-mer goods are elastic and will adjust easily and the service sector will adjust with some planning from the business side, but the real estate sec-tor is less flexible. An ageing population requires
smaller, cheaper, more easily accessible dwellings that are close to everyday services like public transport, retail shops and medical care.
An ageing population is also spurring changes to how business is run. The service sector will have to adjust to serving older customers, and it will have to involve both technical solutions for elder-ly people and appropriately trained staff. Japan, the oldest nation in the world, is piloting various age-friendly business projects and applications.
On the positive side, there might and certainly will be new business opportunities to replace the re-dundant goods and services consumed by the younger population. The key to success is timely planning.
4.5. Structural changes in education and health sectors
A few sectors will have to experience radical chan-ges due to shifting demographics. The first of the-se will be education. Demographic developments directly cut the main resource and output of this sector. Education conventionally is perceived as a business targeted at the young, but in the years to come it is going to be transformed by push and pull factors. The young customer group is shrin-king, and hence there is less need for pre-school, primary and secondary school places. Closing of schools, however, is a sensitive issue because in regions they also serve as community centres, and local governments are obliged to provide education to all children. At the same time, there is a scale effect in schools in terms of quality and cost. The situation with higher education institu-tions is similar – there is a significant resistan-ce to closing or merging institutions even where there has been persistent pressure. On the other hand, longer life and a longer work life as well as a rapidly changing world creates an increasing need for continued education during people’s lifetimes, including for re-qualifications and skill upgra-des. The participation of adults (ages 25 to 64) in education and training in Latvia and Lithuania was much below the EU28 average in 2016 – 7% and 6% respectively. In comparison, the training invol-
ZANE VĀRPIŅA | COUNTRIES OF OLD MEN?
Baltic states

18
vement in Scandinavian countries is close to 30%. 16% of adult Estonians are involved in education and training – twice as many as in its Baltic neigh-bours, but half that of Nordic countries. Expansion of adult education is therefore an inevitable way for the education system to develop, and requires content and institutional adjustments.
The second-most affected economic sector due to age structure changes is healthcare. In addition to the above-noted financial effects, the sector is expected to undergo a transformation. The World Health Organization (WHO) reports that worldwi-de illnesses and causes of death are changing from communicable (infectious) to non-commu-nicable diseases (stroke, cancer, diabetes), which to a large extent is attributable to ageing. While life expectancy in the Baltic countries has risen, the same has not happened with healthy life expec-tancy (HLE). In Latvia, HLE has even decreased in recent years. More doctors, nurses and caregivers will be needed to treat older patients, and the most common methods and kinds of manipulations will change.
In addition, healthcare systems in the Baltic coun-tries (especially in Latvia and Lithuania) already suffer from a shortage of personnel. The Latvian Ministry of Health has estimated that by 2022 the-re will be a shortage of 1,000 doctors (currently there are 6,500), 3,000 nurses and close to 2,000 caregivers. These estimates do not take into ac-count population age dynamics.
5. Solutions and options
The third section of this paper aims to look at ways to influence this process, or how to live with what is coming. Despite awareness of demogra-phic decline and age structure changes, there is little real decisive action on the political stage. First of all, it is important to understand the ulti-mate objective or goal that we want to achieve. The aim can be as straightforward and simple as sustaining the current population size or more nuanced like ensuring a sufficient labour force for the economies of the Baltic states to flourish. Evi-dently, this debate about where to go should be
opened up among stakeholders alongside discus-sion of demographic policies. But for the purpose of this article, the proposed aim is to “ensure pro-sperous continuation of the Baltic nations with a high quality of life at all ages.” The goals could be different for the three countries as well.
Points to consider when setting these goals inclu-de: (1) the size of the population is not a sufficient aim per se; smaller countries or communities than Estonia or Latvia exist without risk of extinction. (2) In the era of globalisation, no country has a single nationality; different cultures and nationali-ties enrich a country. (3) Quality is more important than quantity. (4) Historically, the Baltic countries have relied on immigration. (5) It must be accep-ted that in the future, the populations of the Baltic countries will be older, as will be all Western popu-lations. Most probably, these populations will also be smaller, at least in the foreseeable future.
The demographic equation has very few variables, and even those are highly endogenous. Hence, for population there does not exist big and efficient solutions, excluding massive immigration that is unacceptable to society. There are only small steps and delicate tools available. Demographic processes, like climate change, are slow and in-ert. Natural population change (births and deaths) takes time, and it is questionable if changing the course is at all possible with available instruments. Net migration is a more rapid process, but there are limited tools to affect it in a situation of open borders and free labour mobility.
This part of the paper sketches a set of possib-le solutions and provides grounds for discussion rather than prescribes a treatment. It summarises lessons from other countries that the Baltic sta-tes could (and should) make use of. There are four areas of potential policy responses to challenges posed by population trends: affecting fertility, la-bour market policies, and migration flows as well as mitigating the effects of emigration.
ZANE VĀRPIŅA | COUNTRIES OF OLD MEN?
Baltic states

19
5.1. Policies aimed at affecting childbearing beha-viour
The first set of policy actions attempts to address the underlying natural population change. These are so-called pronatalist policies that aim at boos-ting fertility rates. They are favoured in all coun-tries because they are natural and noncontrover-sial. These measures take the form of either direct financial transfers (child and family benefits, tax incentives) or reduced opportunity costs of child-bearing (paid parental leave, subsidised health care, flexible work arrangements). Theoretically, boosting fertility rates could slow down populati-on ageing and shrinkage or turn the trend around. The problem is that these pronatalist policies are largely ineffective at increasing fertility rates in most countries because of the societal value ch-anges associated with the Second Demographic Transition (see discussion in section 2.1.1).
Figure 11.Total fertility rates, child benefits and paid leave entitlements in selected developed countries, 2015(a) Correlation between TFR and family support for third child: 0.21
Source: OECD Family databases and Latvijas Avīze (8 September 2017)
In a number of countries (Spain, Germany) these policies have been shown ineffective (Clements, IMF, 2015). For illustration, a cross-country com-parison of TFR with childcare support reveals no correlation (Figure 11). There is no statistically significant correlation either between TFR and di-rect financial support (family benefits) or between TFR and indirect support (paid leave available to mothers in connection with childbirth). What we know is that all these forms of family support have a non-negative impact on fertility, but no causali-ty between support and fertility has been proven. And even if they did have any effect, it would take time for that effect to reach the working-age po-pulation about 20 years later and thereby to have positive effects on fiscal spending.
ZANE VĀRPIŅA | COUNTRIES OF OLD MEN?
Baltic states

20
Figure 11.Total fertility rates, child benefits and paid leave entitlements in selected developed countries, 2015(b) Correlation between TFR and mother leave entitlements: -0.32
Source: OECD Family databases and Latvijas Avīze (8 September 2017)
Supporters of these policies often argue that over time, higher financial support has a similar effect to TFR development, hence concluding that vari-ous forms of family support encourage childbea-ring. However, they fail to acknowledge the under-lying reason that both support and fertility rates rise in more prosperous times and fall in periods of crisis. Therefore, it is false to assume signifi-cant causality between benefit increases and a rise in the fertility rate. Even if the impact from family benefits on fertility indicators is minimal or non-existent, though, family support policies still have an important redistribution and inequa-lity mitigating function. They also increase labour force participation, especially for females, and af-fect the timing of births. The IMF (2016) empha-sises that countries should avoid untargeted and costly child allowances that do not reach the right target group but instead invite fertility in certain marginal social groups.
The family support policies in the Baltic countries are similar to the extent that these countries come from the same socio-historical background, but in recent years these policies have developed dif-ferently. Regarding direct financial transfers, the benefits for first and second children are at simi-lar levels (about EUR 50 and EUR 100 per month, respectively) and include tax relief. But in 2017, Estonia took a radical step to try to tempt families
into birthing third and more children by raising be-nefits to 550 EUR for families with three children and 700 EUR for families with four children, plus offering additional benefits for an even greater number of children. Lithuania stands particularly poor in this comparison: the maximum support for a family with four children does not even reach 200 EUR. Latvia pays close to 200 EUR to families with three children and close to 300 EUR for those with four. From 2018, Latvia will offer a thin bo-nus for raising three or more children, as decided after long political discussions in connection with the 2018 budget. Indirect support via paid paren-tal leave is also higher in Estonia, where mothers are eligible for a paid leave of 85 weeks full-rate equivalent,7 while in Latvia and Lithuania this leave is 52.2 and 62 weeks respectively (OECD databa-ses). In the European and global context, however, the parental leave offered by the Baltic states is very generous. In the UK, paid parental leave (mo-ther, full-rate equivalent) is 12 weeks, in Ireland 8.9, in France 18.8, in Belgium 13.2, in Australia 7.6, and in the United States 0.
In light of the Second Demographic Transition de-scribed in section 1, if a society has entered the
7. Full rate equivalent weeks measure is the length of leave that a mo-ther would be eligible for if she were paid 100% of her salary. This mea-sure is used for country comparison purposes.
ZANE VĀRPIŅA | COUNTRIES OF OLD MEN?
Baltic states

21
stage of secular ego-centric values, as has by all indicators happened in all of the Baltic countries, no financial policies of any value will radically turn the fertility rate. There are no tools in the policy-makers’ toolbox to affect societal values in an open global economy. However, often soft factors (for lack of a better term) are disregarded that could play a marginal role. The attitudes toward families and children, attitudes toward parents at work, gender equality, media and information may impact the willingness to have an additional child.
5.2. Policies aimed at migration
The second set of policies aim at physical popu-lation change or migration. Migration is a sensiti-ve matter. Countries generally realise the benefits that immigration carries, but the desired degree of openness differs significantly across OECD countries. Most populations support controlled or decreased migration (OECD, 2010).
Most EU internal migration is economic migrati-on, and most emigrants from Baltic countries le-ave for economic reasons, departing in search of higher income and wellbeing. The reasons why (1) the remaining labour force stays, (2) emigrants re-turn and (3) new workers come from other coun-tries are generally identical. The policies that aim to affect decisions of these three groups hence also lie in the same area.
Strengthening institutions
Analysis of factors driving emigration suggests that highly-skilled emigrants tend to leave coun-tries where institutions and governments are weak and move toward countries where they are stronger. Hence, one of the primary but complex tasks of governments is to improve institutional effectiveness, fight corruption, and establish a safe, stable, reliable and predictable environment for living and working. Boosting job creation and growth also creates a more attractive environ-ment for people to come and stay. In addition, this invites foreign direct investment and boosts pro-ductivity via capital and technology.
The difference in institutional quality is evident from the Global Competitiveness report (Swab, 2017). For 2017 - 2018, institutions in Latvia recei-ved a score of 3.8 (out of 7), ranking 82nd; insti-tutions in Lithuania, with a score of 4.1, ranked 53rd; while Estonian institutions, with a score of 5.0, ranked 24th out of 137 countries in the wor-ld. Estonian institutions by evaluation outperform European and North American, while Lithuanian and especially Latvian institutions lag behind. The trend for Latvia, in comparison to previous years, is stable or negative. Efficiency of the legal frame-work, favouritism in government decisions, public trust in politicians and efficiency of government spending are the first areas to address, as these receive the lowest evaluations (2.3 to 2.5). Lithua-nia also faces problems with trust in politicians and efficiency in government spending and the legal framework.
Engagement with diaspora
Return migration brings back departed skills and brings in new ones acquired by the emigrant po-pulation abroad. In addition, returning migrants are especially welcome because they are citizens of the country, speak the language and are of the same culture; hence, they are our people in the minds of politicians and the remaining resident population. Further, remigrants return together with their young children born abroad and often give birth to several more in the domestic country. Initiatives for keeping in touch with diaspora com-munities, implemented also by Baltic countries, are important. Specific actions to facilitate return migration should focus on spreading information about job and business opportunities and remo-ving barriers to reintegration. These barriers inclu-de recognition of foreign experience and diplomas for adults and especially for children who need to enter the school system and have their education recognised.
Precise remigration numbers are difficult to esti-mate because EU citizens are not required to register when they enter or leave EU countries. However, based on official migration statistics
ZANE VĀRPIŅA | COUNTRIES OF OLD MEN?
Baltic states

22
(Table 2) it is possible to assess the volume of re-turning nationals relative to emigration. Assuming returning migrants appear in the statistical tables as nationals who immigrate, in 2015 there were eight thousand returning Estonians, close to five thousand returning Latvians and almost twenty thousand returning Lithuanians. Relative to the numbers of emigrating nationals, return migrants constitute 90, 30 and 50 percent for Estonia, Lat-via and Lithuania respectively.8 Hence there is a significant counter flow of emigrants who are returning to their native countries. The migration flow data show that more than half of people mo-ving to Estonia and Latvia as well as about eighty
percent of those moving to Lithuania in 2015 were citizens of the respective countries. It has been noted by migration researchers who study Latvian diaspora abroad (Lulle, 2015) that an important moment when it comes to making the decision to return is when children have to start school (age 5-6), as changing from one school to another in a new country can be difficult.
8. Alternatively, for every 10 emigrated Estonians in 2015, there were 9 who returned, for every 10 Latvians who left, 3 returned, and for every 10 Lithuanians who left Lithuania in 2015, there were 5 other Lithuanians that came back to live in the country.
2004 2005 2006 2007 2008 2009 2010 2011 2012 2013 2014 2015Total emigrationEstonia 2 927 4 610 5 527 4 384 4 406 4 658 5 294 6 214 6 321 6 740 4 637 13 003
Latvia 20 167 17 643 17 019 15 463 27 045 38 208 39 651 30 311 25 163 22 561 19 017 20 119
Lithuania 37 691 57 885 32 390 30 383 25 750 38 500 83 157 53 863 41 100 38 818 36 621 44 533
Emigration of nationalsEstonia 2 279 3 964 4 964 3 940 3 860 3 972 4 665 5 608 5 968 6 414 4 314 8 957
Latvia : : : : : : : 23 630 20 421 19 150 16 438 16 579
Lithuania 35 279 54 571 29 678 27 592 21 793 33 522 79 315 51 505 38 479 35 492 33 115 36 976
Total immigrationEstonia 1 097 1 436 2 234 3 741 3 671 3 884 2 810 3 709 2 639 4 109 3 904 15 413
Latvia 4 844 6 691 8 212 7 517 4 678 3 731 4 011 10 234 13 303 8 299 10 365 9 479
Lithuania 5 553 6 789 7 745 8 609 9 297 6 487 5 213 15 685 19 843 22 011 24 294 22 130
Immigration of nationals (return migration)Estonia 338 455 746 1 789 1 742 1 655 1 611 2 034 1 532 2 472 2 557 8 043
Latvia : : : : : : : 7 373 9 637 4 774 5 864 4 974
Lithuania 3 397 4 705 5 508 6 141 6 337 4 821 4 153 14 012 17 357 18 975 19 528 18 383
Net migration*Estonia -3 707 -5 184 -5 341 -2 846 -2 053 -2 132 -3 665 -3 878 -3 649 -2 642 -615 2 410
Latvia -15 323 -10 952 -8 807 -7 946 -22 367 -34 477 -35 640 -20 077 -11 860 -14 262 -8 652 -10 640
Lithuania -32 138 -51 096 -24 645 -21 774 -16 453 -32 013 -77 944 -38 178 -21 257 -16 807 -12 327 -22 403
Return migrants as % of emigrating nationals (calendar year)Estonia 14.8 11.5 15.0 45.4 45.1 41.7 34.5 36.3 25.7 38.5 59.3 89,8
Latvia : : : : : : : 31.2 47.2 24.9 35.7 30,0
Lithuania 9.6 8.6 18.6 22.3 29.1 14.4 5.2 27.2 45.1 53.5 59.0 49,7
Table 2.Migration statistics, Baltic countries, 2004-2015
* Net migration numbers include statistical adjustment
Source: Eurostat databases [migr_imm1ctz], [migr_emi1ctz] and [demo_gind]
ZANE VĀRPIŅA | COUNTRIES OF OLD MEN?
Baltic states

23
Interactions with diaspora communities, howe-ver, should avoid being emotional but rather re-main constructive. The underlying reasons for economic mobility will remain financial – return migrants do assess their expected economic si-tuation upon return. These policies should also remain fair toward the population already living in the country. If returning migrants would enjoy spe-cial benefits just because policymakers want to re-attract them, this could cause adverse effects, first in the general mood and attitude toward re-migrants by the current population, which could become hostile, and second by more people con-sidering leaving in the short term to benefit from privileges upon returning. Hence, return migration policies should come in addition to general poli-cies of brushing up the labour market and eco-nomy.
There is a history of successful policies by other countries. For example, in the period from 1990 to 2004, Ireland re-attracted a big share of emigrants who had gone to the US, the UK and other coun-tries. This was facilitated by opening and growing the economy, a shortage of labour and associated rising salaries, and foreign direct investment that increased productivity. “These returned migrants were encouraged by the government efforts to in-form the diaspora of job opportunities in Ireland, and by the focus of employment and training agencies on return migration” (OECD 2015).
Smart immigration
In addition to general policies concerned with fi-xing the major emigration drivers (productivity/sa-lary differences) and remigration activities, there will also be a need for immigration to complement the shrinking labour market. Decision makers in the Baltic countries, stimulated by employers, are gradually realising the need and inevitability of im-migration. Technically, the labour markets in Esto-nia, Latvia and Lithuania are open for hiring from third countries, but in practice lots of administ-rative barriers exist: only certain professions are eligible, employers need to pay an average salary, and so on. Estonia (discussed in section 4) is se-veral steps ahead of Latvia and Lithuania in terms of attracting a foreign labour force, as proved by statistics of the previous two years.
Immigration from culturally related but poorer neighbouring countries (Ukraine, Belarus, Geor-gia) still carries a lot of potential. But focus should not only be restricted to these countries. Com-petition for labour among European countries is expected to increase further, and neighbouring Eastern European and CIS countries are the clo-sest. Timing plays a role; countries that manage to attract a population of immigrants will receive further immigration from these countries due to network effects.
While countries can afford selected immigration, they should be designing smart migration policies. One way would be via higher education, attracting students from abroad who upon graduation could be given a time-restricted work permit (for examp-le, for five years).
5.3. Policies to affect the labour market
This is the most important territory of action for addressing demographic challenges and also the area where foreign investors as well as local bu-sinesses are inviting action. The Baltic countries have to exert maximum effort to use their remai-ning labour force to its full extent by intensifying workforce participation and productivity (Atoyan, 2016).
Labour force participation
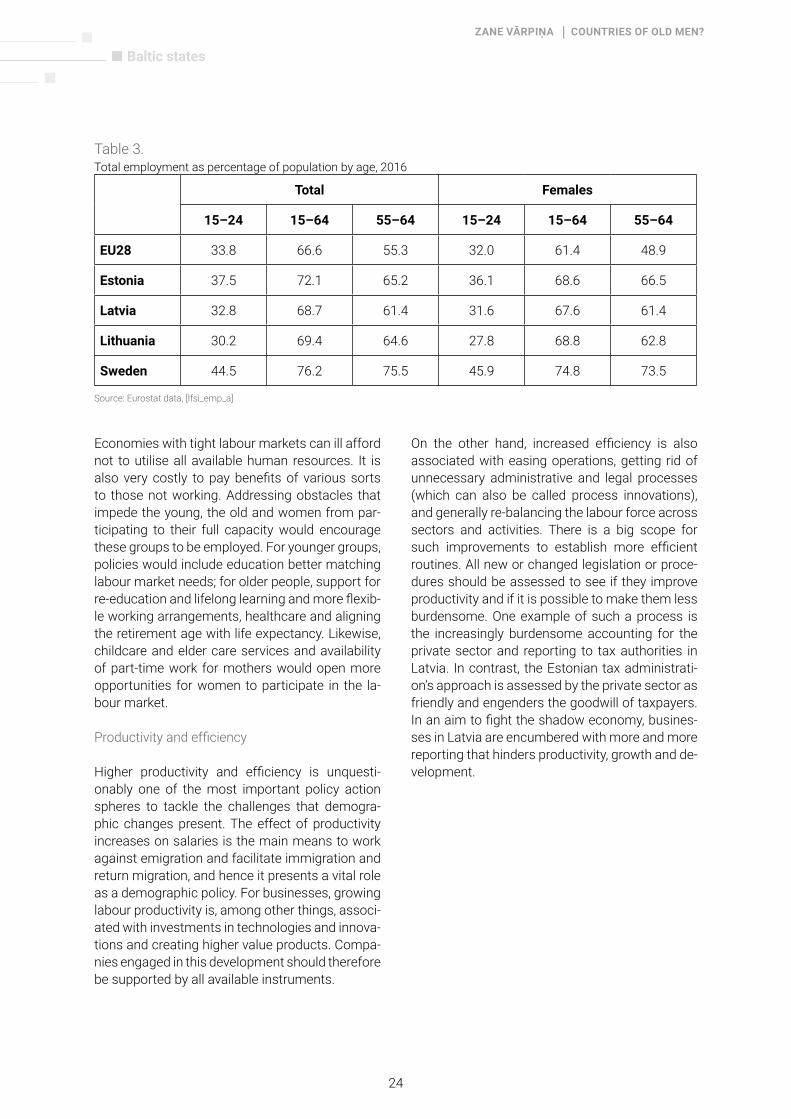
There are important gaps in labour participation for youth, older workers and females. Employ-ment in the Baltic countries (Estonia 72%, Latvia 69% and Lithuania 69%, on average) is below that of Sweden (76%), where it is the highest in the European Union (Table 3). The gap between the employment rate of older workers (ages 55 to 64) in the Baltic states is 10 percentage points less than in Sweden, and in Latvia 12 percentage points less. The gap between youth employment is even bigger: 15 percentage points for Lithuania, 12 for Latvia and somewhat less for Estonia at 7 percentage points. Similarly, the gap between fe-male employment at all ages remains below that of Sweden, especially for younger workers.
ZANE VĀRPIŅA | COUNTRIES OF OLD MEN?
Baltic states
24
Table 3.Total employment as percentage of population by age, 2016
Source: Eurostat data, [lfsi_emp_a]
Economies with tight labour markets can ill afford not to utilise all available human resources. It is also very costly to pay benefits of various sorts to those not working. Addressing obstacles that impede the young, the old and women from par-ticipating to their full capacity would encourage these groups to be employed. For younger groups, policies would include education better matching labour market needs; for older people, support for re-education and lifelong learning and more flexib-le working arrangements, healthcare and aligning the retirement age with life expectancy. Likewise, childcare and elder care services and availability of part-time work for mothers would open more opportunities for women to participate in the la-bour market.
Productivity and efficiency
Higher productivity and efficiency is unquesti-onably one of the most important policy action spheres to tackle the challenges that demogra-phic changes present. The effect of productivity increases on salaries is the main means to work against emigration and facilitate immigration and return migration, and hence it presents a vital role as a demographic policy. For businesses, growing labour productivity is, among other things, associ-ated with investments in technologies and innova-tions and creating higher value products. Compa-nies engaged in this development should therefore be supported by all available instruments.
Total Females
15–24 15–64 55–64 15–24 15–64 55–64
EU28 33.8 66.6 55.3 32.0 61.4 48.9
Estonia 37.5 72.1 65.2 36.1 68.6 66.5
Latvia 32.8 68.7 61.4 31.6 67.6 61.4
Lithuania 30.2 69.4 64.6 27.8 68.8 62.8
Sweden 44.5 76.2 75.5 45.9 74.8 73.5
On the other hand, increased efficiency is also associated with easing operations, getting rid of unnecessary administrative and legal processes (which can also be called process innovations), and generally re-balancing the labour force across sectors and activities. There is a big scope for such improvements to establish more efficient routines. All new or changed legislation or proce-dures should be assessed to see if they improve productivity and if it is possible to make them less burdensome. One example of such a process is the increasingly burdensome accounting for the private sector and reporting to tax authorities in Latvia. In contrast, the Estonian tax administrati-on’s approach is assessed by the private sector as friendly and engenders the goodwill of taxpayers. In an aim to fight the shadow economy, busines-ses in Latvia are encumbered with more and more reporting that hinders productivity, growth and de-velopment.
ZANE VĀRPIŅA | COUNTRIES OF OLD MEN?
Baltic states

25
Technologies
Robotisation, which is often feared for taking work from the workers and establishing a useless wor-king class in need of a universal income (see the discussion in The Economist), can become the great sauveur for the Baltic countries. Machines and computers are seen to replace not only ma-nual work but also part of the intellectual work performed by people (think of artificial intelligen-ce software that recognises faces and emotions). However, with the current state of development, not all work can be replaced by technology. Nur-ses, doctors, teachers, drivers, and numerous other professions are not expected to be replaced in the foreseeable future, in the Baltic states or elsewhere. Instead, investments in technologies that replace manual low-skilled work that takes many hours and is slow when accomplished by humans is just the development the Baltic coun-tries need to raise productivity and to liberate their scarce workforces. Governments should not ex-pect, though, that the private sector will do this without, for example, tax incentives.
Education
Education is the means to increase the quality of human capital. Policies that upgrade skills and di-minish mismatches between labour market needs and skills acquired in educational institutions would increase productivity and make workers more efficient. A professional path of education is especially important for adjusting supply and demand in the economy, and this presents a sco-pe for cooperation between educators, employers and authorities. Academic education is widely available in the Baltic countries, but the quality of skills and demand for them is often lagging. The higher education system in Latvia, for example, with 50-plus institutions, is too large for the shrin-king population.
As described in section 3, participation of adults in continued professional development is extremely weak in the Baltic states, especially in Latvia and Lithuania. It constitutes one of the weakest points of the labour market as labour force skills are gra-dually becoming outdated. Conditions should be
provided to facilitate further professional develop-ment by helping employers offer or pay for training courses and by giving employees opportunities to participate on a regular basis.
Modernising education is also important because educational institutions create scientific and tech-nological hubs where skills are concentrated, cre-ating scale effects and attracting other related ex-pertise and businesses. They serve as centres of knowledge and excellence and would encourage brain gain from abroad, retain people in search of new challenges and opportunities, and also have technology spill-overs in the form of new products and services.
Retirement age increase (will also reduce budget spending)
A rising pension age in the not-so-distant future will be inevitable – and unpopular. Pension sys-tems in all three Baltic countries are very similar; they are all three-pillar systems. The first pillar is the state pension (funded from current social tax payers); the second pillar is individual accounts (mandatory for Latvians and Estonians, voluntary for Lithuanians); and the third pillar is voluntary pension savings. The retirement age at which peo-ple become eligible to receive a pension is being increased in all Baltic countries and will reach 65 in 2022 (Latvia) or 2026 (Estonia and Lithuania). That has been the plan so far. With these dates coming closer, however, pension fund administra-tors are ringing alarm bells saying that the pension systems are becoming unsustainable because of the changing age structure and rising dependency ratios (see section 2.2). Fewer working age people are available to pay social contributions and more pension age people are in need of support. No re-turn is possible to the previous equilibrium – not in the Baltic states or anywhere else in Europe.
In 2017, Estonia undertook a move toward a more flexible pension system. The government propo-ses tying the pension age to life expectancy, along with other changes in the pension system. With increasing life expectancy, this ultimately means an increase in the retirement age (Piirits, Masso and Kadarik, 2017). The respective legislation is to
ZANE VĀRPIŅA | COUNTRIES OF OLD MEN?
Baltic states

26
be drafted in the first quarter of 2018. The questi-on of a further increase in the pension age is cur-rently dormant in Latvia and Lithuania, illustrating the reluctance of policymakers to touch these sensitive and unpopular decisions. On a European scale, other countries too are debating increasing the pension age. For instance, the UK has decided that the state pension age will increase from 67 to 68 in 2039 – seven years ahead of the previous schedule – to reflect increasing longevity (The Guardian, 19 July 2017). The state pension age is set to increase also in several other Western Euro-pean countries: in Ireland to 68 in 2028, in Spain to 67 in 2027, in The Netherlands to 67 in 2024 and linked to life expectancy thereafter, and in France to 67 in 2023.
The official retirement age, however, is not the same as the effective retirement age. Govern-ments should aim to raise the effective age at which people retire. To encourage working longer, financial incentives play an important role: for example, higher pensions once retired, or lower taxes, or lower social contributions for people working longer than the official retirement age. For most European countries, people tend to re-tire earlier on average than the official retirement age, while at the same time there is an increa-sing tendency to work longer. Hargreaves Lans-down (2017) found that in the UK, for example, the number of women working past 70 has more than doubled, to 11%, between 2012 and 2016. He also finds that an “increase in the number of people working over 70 is predominately because they want to work later, not because they need to.” One might conclude that these people are in good health and in well-established positions in skil-led professions. However, this may change with countries’ social budgets shaking.
Working longer also has one beneficial aspect: staying mentally and physically active prolongs healthy life expectancy. Working in older ages may not be possible on exactly the same terms and positions as at younger ages. Some work is simply not possible (such as heavy physical la-bour), and age can also require more flexible wor-king hours to allow for more rest or health visits; but if employers can find a way to make people
stay at work by offering appropriate tasks and trai-ning, both parties can benefit. In a time of scarce human resources and equally scarce social bud-gets, countries cannot afford releasing resources to pensions. It also makes retired people better off financially if they retire later. Hence, the way to facilitate working longer is for employers to pro-vide more flexible working arrangements and for employers and governments to ensure availability of education and training programmes so people are able to switch positions. A longer working life should be encouraged rather than imposed on the population.
More to that, a recent study shows that Baltic people’s willingness to work as long as possible is high (Eurofound, 2017). According to the Euro-pean Working Conditions Survey 2015, close to 45% (the highest proportion in the EU) of males in Estonia and Latvia spontaneously replied that they are willing to work “as late as possible.” From this information alone it is impossible to infer rea-sons for such statements, which can lie anywhere between attachment to the job and financial rea-sons, and the length of career in mind can also be subjective. However, it indicates that people can be flexible and do not have a set retirement date in mind.
The period of demographic dividends (a time with relatively few children and older people and a big working age population) has ended, but demo-graphers talk of a possible “second demographic dividend” that can be generated when the aged accumulate assets and become an important economic power. This second demographic di-vidend is an opportunity to create economic be-nefits by capitalising on an older population. How well the second demographic dividend materiali-ses depends on how well a country prepares and organises support for the aged. If the population over working age accumulates sufficient funds to sustain themselves, and if assets at older ages are rationally invested rather than purely consu-med, that adds also to economic growth on top of financing consumption. Asian countries in parti-cular are looking into employing this situation.
ZANE VĀRPIŅA | COUNTRIES OF OLD MEN?
Baltic states

27
Health
Discussion about a longer working life cannot be isolated from health issues. While life expectan-cy in the Baltic countries has risen, the same has not happened with healthy life expectancy (HLE). In Latvia, HLE has even decreased in recent ye-ars. For example, female life expectancy at birth is 79.8 years (2017), but it is expected that for only 54 years (two-thirds of life) on average will a woman live in good health, i.e. without severe or moderate health problems. The last one-third of her life will be met with medium or severe health problems affecting quality of life. Men live in good health relatively longer (for three-fourths of their lives), but this is due to a lower life expectancy. Stagnation or decreasing healthy life expectancy presents serious challenges to raising the retire-ment age, which may not be realistic.
Improving the population’s health is therefore a vital key to mitigating the effects of demographic change. Better population health of a population, of course, is an ultimate aim, but carries additional benefits in the context of ageing. Healthier popu-lations can work longer and requires less spen-ding on healthcare. Healthy ageing, however, does not start when people get old. Health in elder older ages depends on living conditions and lifestyle th-roughout the course of life. It is also a collective as well as an individual responsibility (Zeng, 2018). Health improvement and healthy lifestyle promo-tion should hence be part of demographic policy.
5.4. Mitigating effects from emigration
There are a few additional instruments that can be exploited to mitigate, in particular, the effects of emigration.
Remittances for investment, not consumption
Remittances are an important flow of funds bet-ween residence countries of emigrants and their countries of origin. Most of these remittances to home countries are spent on consumption, while the investment potential is not used to its capaci-ty. There could be ways to facilitate investment of
funds earned abroad, if, for example, an appropri-ate environment for entrepreneurship were esta-blished. In that way, remittances could be better leveraged and used for investment, not consump-tion.
EU-wide structural and cohesion funds to com-pensate for emigration
Finally, since migration benefits receiving coun-tries and the EU as a whole, the migration donor countries, the Baltic states in this context but also other Central European and South-East European countries, should seek compensation for their po-pulations that other countries have received. This should be achieved via EU structural and cohesi-on funds. If allocation of funds explicitly takes into account the effects of emigration, it would preci-sely serve the fund’s objective to “reduce econo-mic and social disparities in the EU and promote sustainable development.” The IMF in its discussi-on note (2016) also puts forward structural funds redistribution as one possible response to migra-tion trends.
If these funds are efficiently invested (in human capital, infrastructure, education, and innovations) they will improve productivity and growth and cre-ate a better economic environment for the popu-lation to stay. It would be recommended for the next structural funds planning period to establish demographic projections as one of the core de-terminants of allocation. This invites joint action and agreement by governments from migration donors (Central European and South-East Europe-an countries) and recipient countries (especially Germany, Ireland, and the Nordic countries).
ZANE VĀRPIŅA | COUNTRIES OF OLD MEN?
Baltic states

28
6. Concluding remarks
The Baltic countries all turn 100 years old this year. They have common and parallel histories, allied societies, and interconnected economies. Regar-ding demographic developments and their under-lying factors, however, there are more differences than commonalities. Each of the Baltic countries will have to actively search for solutions to mitiga-te the economic effects of its shrinking population but will also have to learn to live with smaller and older communities to different extents.
Developed countries, in which group the Baltic countries belong, are experiencing negative natu-ral population growth accompanied by ageing so-cieties. In addition, being among the less wealthy members of the EU, Estonia, Latvia and Lithuania have suffered from emigration, amplifying this ne-gative population trend.
Developments of the latter few years and projec-tions for the future point at diverse paths of de-velopment for Estonia and Latvia/Lithuania. Es-tonia has attained thin but positive immigration that is expected to continue in the following years, while Latvia is expected to continue losing 7,000 to 8,000 in net migration and Lithuania more than 20,000 people yearly. Estonia’s population is pro-jected to stay younger, similar to the EU average in comparison with Latvia’s and Lithuania’s, which are among the fastest ageing populations in Euro-pe. Since birth and death rates are the same, the answer is in immigration.
There are four broad areas of policy action to ta-ckle demographic challenges: boosting fertility, affecting migration, affecting the labour market, and using specific tools to mitigate or make use of migration. While pronatalist policies are favoured by most governments in the EU, they are expensi-ve and largely inefficient. There is no proof in the literature that more financial support to families significantly increases fertility rates.
The most powerful instruments from the policy toolbox for Baltic countries are those that affect the labour market: improving productivity, increa-sing labour participation and working beyond the current retirement age. The latter two are doable only by educating and re-educating the workforce and improving the population’s health.
Equally important, policies aimed at migration should not be limited to calling for the return of emigrated nationals and comprising a list of wel-come professions. Primarily and most important-ly, these policies have to be concerned with im-proving institutions – government trust, efficiency and transparency, legislation, the court system, protection of rights, etc. These are areas where Lithuania and especially Latvia fall far behind com-pared to Estonia and the EU average. The spurt in institutional quality is potentially the prime reason for Estonia’s performing so much better in terms of migration trends.
Further, intra-EU migration gives strong grounds for Baltic countries to claim EU structural funds redistribution in the following programming peri-ods to compensate for migration losses. The Bal-tic countries should also keep up to date with the latest instruments and policies being developed for utilising an older population as a resource, hence exploiting the so-called second demogra-phic dividend.
ZANE VĀRPIŅA | COUNTRIES OF OLD MEN?
Baltic states

Literature Atoyan, M. R., Christiansen, L. E., Dizioli, A., Ebeke, M. C., Ilahi, M. N., Ilyina, M. A., ... & Raei, M. F. (2016). Emigration and its economic impact on Eastern Europe. International Monetary Fund.
Clements, M. B. J., Kamil Dybczak, Vitor Gaspar, Sanjeev Gupta, and Mauricio Soto (2015). The fiscal consequences of shrinking populations. IMF Staff Discussion Note. International Monetary Fund.
Eurofound (2017). Extending work life: what do workers want? Eurofound, Dublin. Available at: https://www.eurofound.europa.eu/observatories/eurwork/articles/extending-working-life-what-do-workers-want (accessed 10.01.2018).
Eurostat (2017). First population estimates. EU population up to almost 512 million at 1 January 2017. Increase Driven by migration. News release 110/2017, 10 July 2017.
Hargreaves Lansdown, 2017. https://www.theguardian.com/money/2017/mar/22/number-of-women-working-past-70-in-uk-doubles-in-four-years-retirement
Modigliani, Franco (1966). „The Life Cycle Hypothesis of Saving, the Demand for Wealth and the Supply of Capital“. Social Research. 33 (2): 160–217. JSTOR 40969831.
Piirits, Magnus, Masso, Mart, Kadarik, Inge, (2017). Estonia: First steps towards a more flexible pension system. Avai-lable at https://www.eurofound.europa.eu/observatories/eurwork/articles/estonia-first-steps-towards-a-more-flexib-le-pension-system (Accessed 13.12.2017)
Sauka A. (2018). FICIL Sentiment Index 2017.The development of the investment climate in Latvia: the viewpoints of foreign investors. SSE Riga.
Schwab, K. (2017,). The global competitiveness report 2017-2018. Geneva: World Economic Forum.
Springe, I., 2017. A Country for Old Men. https://en.rebaltica.lv/2017/09/a-country-for-old-men/ (accessed 12.01.2018)
The Guardian, July 19 2017. https://www.theguardian.com/money/2017/jul/19/state-pension-age-to-increase-seven-years-earlier-than-planned
UN Population Division database: https://esa.un.org/unpd/wpp/Download/Standard/Population/
Willekens, Frans, Carey, J., Li, Q. (2018). Interdisciplinary Research on Healthy Aging: Introduction, Demographic Re-search, Vol 38, Article 10.
World Bank (2009). World Development Report: Reshaping Economic Geography. Washington
Literature
ZANE VĀRPIŅA | COUNTRIES OF OLD MEN?
Baltic states

ISBN 978-3-96250-058-0The views expressed in this publication are not necessarily those of the Friedrich-Ebert-Stiftung or of the organization for which the author works.
Imprint
Friedrich-Ebert-Stiftung | Riga Offi ce37-64 Dzirnavu street | Riga, LV-1010
Responsible:Dr. Tobias Mörschel | Director of the FES in the Baltic StatesTel.: Tel.: +371 6783 05 39 | Fax: +371 6783 03 26http://www.fes-baltic.org
Commercial use of all media published by theFriedrich-Ebert-Stiftung (FES) is not permitted without thewritten consent of the FES.
About the author
Zane Varpina is Assistant Professor in Stockholm School of Economics in Riga where she teaches undergraduate and graduate Research Methods course and is a faculty advisor for bachelor and master students writing their theses. Zane has a Doctoral degree in demography with specialization in demographics of education. Her research interests are demo-graphics and population studies, impact of population change on economy, higher education, study careers, family as an institution, and effects of education and values on reproducti-ve behavior. She is also a researcher in Advanced Social and Political Research Institute, University of Latvia and has broad researcher experience in the Baltic International Centre for Economic Policy Studies (BICEPS).
About the FESThe Friedrich-Ebert-Stiftung (FES) was established in 1925 as a political legacy of Germany`s fi rst democratically elec-ted president, Friedrich Ebert. Ebert, a Social Democrat from a humble crafts background, who had risen to hold the highest political offi ce in his country in response to his own painful ex-perience in political confrontation, proposed the establishment of a foundation to serve the following aims: – furthering poli-tical and social education of individuals from all walks of life in the spirit of democracy and pluralism, – facilitating access to university education and research for gifted young people by providing scholarships, – contributing to international un-derstanding and cooperation. As a private, cultural, non-profi t institution, it is committed to the ideas and basic values of social democracy.
FES in the Baltic StatesShortly after the restoration of independence, in 1992, the Friedrich Ebert Foundation started its activities in the three Bal-tic States and opened offi ces in Riga, Tallinn and Vilnius. The core concern was to support the democratic transition proces-ses, to accompany the Baltic States on their way to the Euro-pean Union and to promote the dialogue between the Baltic States and Germany, and among the countries of this region.
The current focus of the work of the Friedrich Ebert Foundationin Estonia, Latvia and Lithuania is:
• strengthening democracy and active civil society• supporting the European integration process• contributing to the development of a common European
foreign and security policy• promoting a fair and sustainable development of
economic and social policies in the Baltic States and in the EU
Imprint