Counting poverty orderings and deprivation curves Casilda Lasso de la Vega University of the Basque...
18
Counting poverty orderings and deprivation curves Casilda Lasso de la Vega University of the Basque Country 10th International Meeting of the Society for Social Choice and Welfare Moscow, Russia, July 21-24, 2010
-
date post
21-Dec-2015 -
Category
Documents
-
view
215 -
download
1
Transcript of Counting poverty orderings and deprivation curves Casilda Lasso de la Vega University of the Basque...

Counting poverty orderings anddeprivation curves
Casilda Lasso de la VegaUniversity of the Basque Country
10th International Meeting of the Society forSocial Choice and Welfare
Moscow, Russia, July 21-24, 2010

Counting poverty orderings and deprivation curves
• Deprivation/Poverty are multidimensional phenomena.
• Most of the multidimensional indices proposed deal well only with
quantitative data.
• Most of the data available to measure capabilities or dimensions of
poverty are either ordinal or categorical.
• An alternative to the traditional indices is the counting approach
(Atkinson, 2003): the number of (weighted) dimensions in which a
person is deprived. (Chakravarty and D’Ambrosio, 2006, Bossert et al, 2007,
Alkire and Foster , 2007 and Bossert et al, 2009)
Motivation:

Counting poverty orderings and deprivation curves
The measurement of poverty involves:
- method to identify the poor,
- an aggregative procedure.
Aim:
Dominance criteria that provides unanimous rankings for
- a range of identification cut-offs and
- a wide class of counting multidimensional measures.
(Shorrocks,1983, and Foster and Shorrocks, 1988)
Motivation (cont):

Counting poverty orderings and deprivation curves
Outline:
• The vector of deprivation counts and the identification method.
• Counting poverty measures.
• FD-curves: graphical representation for the headcount ratio and
dominance criteria.
• SD-curves: graphical representation for the multidimensional
headcount ratio and for the adjusted headcount ratio, and dominance
criteria.
• Conclusions and further research.

0
1 1 1 1
1 1 0 1
1 0 1 1
1 0 0 1
1 0 1 0
0 1 0 0
1 0 0 0
1 0 0 0
0 0 0 0
0 0 0 0
g
4,3,3,2,2,1,1,1,0,0c
1.5 4 5 2
1 3 7 2.5
... ... ... ...
6 10 8 6
A
1. The vector of deprivation counts and the identification method.
n=10 individuals and d=4 dimensions
A: achievement matrix
2 5 6 3z
4
3
3
2
2
1
1
1
0
0
vector of deprivation counts
Why is it important to focus on this vector of deprivation counts?

2 5 22 4,3,3,2,2,0,0,0,0,0k q c
4 1 44 4,0,0,0,0,0,0,0,0,0
intersection approach
k q c
4,3,3,2,2,1,1,1,0,0c
3 3 33 4,3,3,0,0,0,0,0,0,0k q c
1 8 11 4,3,3,2,2,1,1,1,0,0
union approach
k q c
headcount
q kH k
nratio
1 ii n adjusted headc
c kM k ount ratio
nd
4 0.1
3 0.3
2 0.5
1 0.8
H
H
H
H
1. The vector of deprivation counts and the identification method.
Who are the poor?
4 0.1
3 0.25
2 0.35
1 0.425
M
M
M
M

1. Focus (F).
2. Symmetry (S).
3. Replication Invariance (RI).
4. Dimesional Monotonicity (M).
5. Distribution sensitivity (DS).
2. Counting poverty measures.
The number of dimensions is fixed.
Let G be the set of all vectors of deprivation counts.
:P G counting poverty measure
4,3,3,2,2,1,1,1,0,0c ' 4, ,3,2,2,1,1,14 ,0,0c
3 2' 4, ,3,2, ,1,1,1,0,0c '' 4, ,3,2, ,1,1,1 04 ,1 ,0c
4 24, ,3,2, ,1,1,1,0,0c
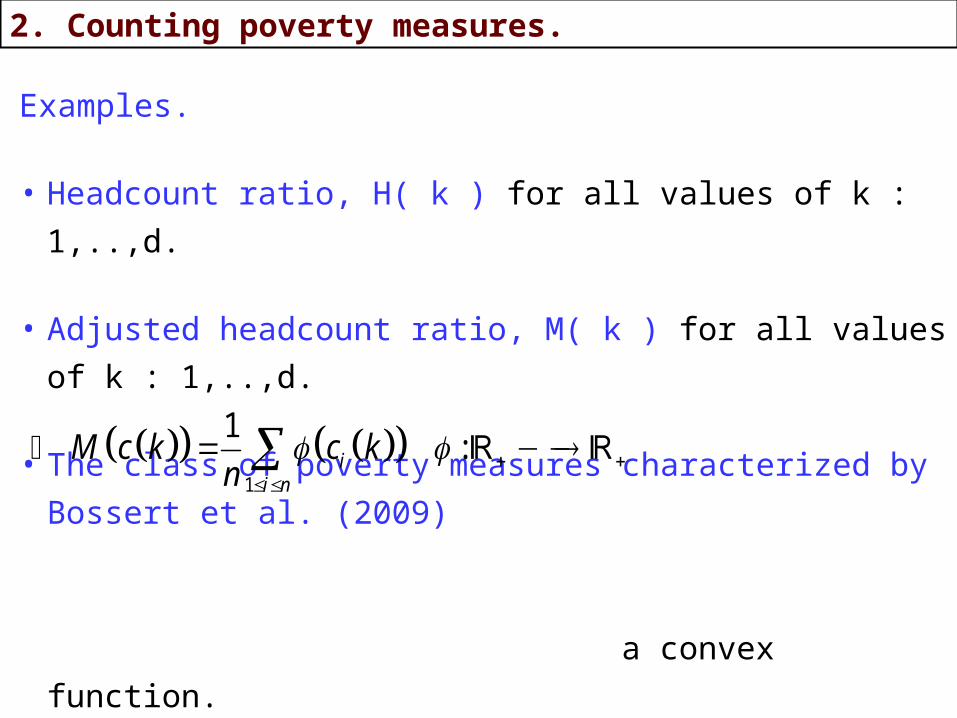
Examples.
• Headcount ratio, H( k ) for all values of k : 1,..,d.
• Adjusted headcount ratio, M( k ) for all values of k : 1,..,d.
• The class of poverty measures characterized by Bossert et al. (2009)
a convex function. 1
1:i
i n
M c k c kn
2. Counting poverty measures.

4,3,3,2,2,1,1,1,0,0c
3. FD-curves: the headcount ratio.
FD-curve
k=4 k=3 k=2 k=1
H (k) 0.1 0.3 0.5 0.8
p=0k=4
p=3k=1
p=2k=2
p=1k=3
H4
H3
H2
H1
p=4

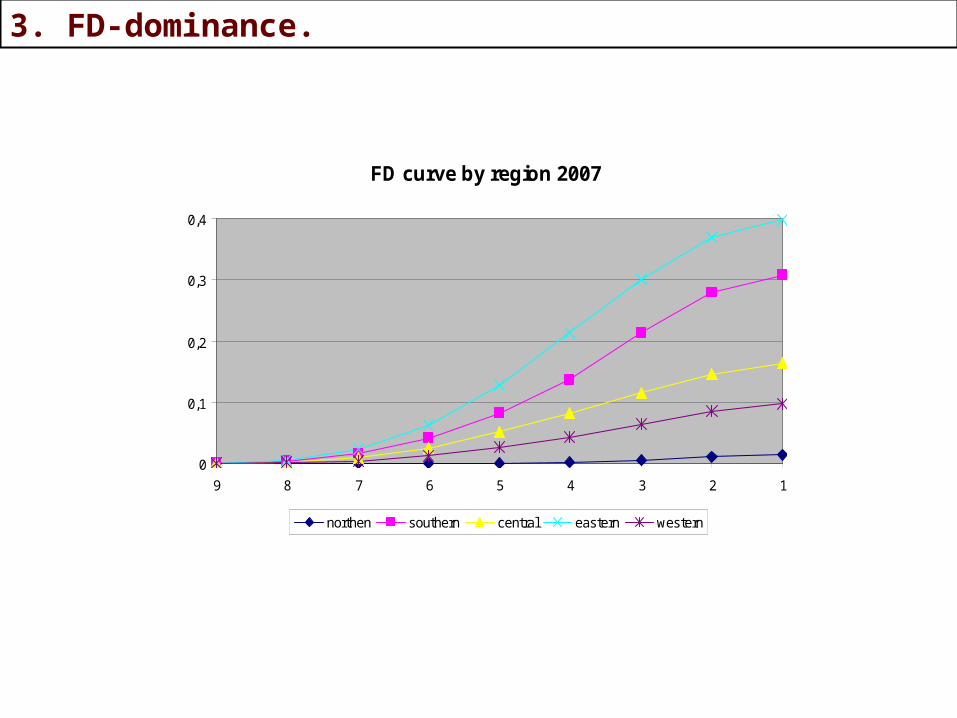
Given two vectors of deprivation counts c and c’, we say that
c’ FD dominates c if FD (c’ ; p) ≥ FD (c ; p) and the strict inequality
holds at least once.
3. FD-dominance.
FD-dominance:
FD curve by region 2007
0
0,1
0,2
0,3
0,4
123456789
northen southern central eastern western

: / , ,P G P satisfies F S RI and M 1M
Proposition 1.
c’ FD dominates c
if and only if
P( c’ ) ≥ P( c )
for all P M1 and for all identification cut-offs k
3. FD-dominance.
Let G be the set of all vectors of deprivation counts.
3. FD-dominance.
FD curve by region 2007
0
0,1
0,2
0,3
0,4
123456789
northen southern central eastern western

3. FD-dominance.
FD curve by origin
0,0
0,2
0,4
0,6
12345678
indigenous 1997 no indigenous 1997
indigenous 2007 no indigenous 2007

4,3,3,2,2,1,1,1,0,0c
4. SD-curves: the headcount ratio and the adjusted headcount ratio.
SD-curve
k=4 k=3 k=2 k=1
H (k) 0.1 0.3 0.5 0.8
M (k) 0.1 0.25 0.35 0.425
0
1
0 1H4 H3 H2 H1
M4
M3
M2
M1
cumulative sum of the poverty scores divided by the total deprived dimensions
cumulative population share

Given two vectors of deprivation counts c and c’, we say that
c’ SD dominates c if SD (c’ ; p) ≥ SD (c ; p) and the strict inequality holds
at least once.
4. SD-dominance.
SD-dominance:
0
1
0 1c c'

Proposition 2.
c’ SD dominates c
if and only if
P( c’ ) ≥ P( c )
for all P M2 and for all identification cut-offs k.
4. SD-dominance.
Let G be the set of all vectors of deprivation counts.
: / , ,P G P satisfies F S RI M and DS 2M

4. SD-dominance.
SD curve by origin
0,0
0,1
0,2
0,3
0,4
0,0 0,1 0,2 0,3 0,4 0,5 0,6 0,7 0,8
Título del eje
indigenous 1997 indigenous 2007
no indigenous 1997 no indigenous 2007
0,0
0,2
0,4
0,6
12345678

Conclusions and further research.
• The deprivation curves provide a graphical representation of the headcount
ratio, the adjusted headcount ratio.
• They also provide a tool for checking unanimous orderings according to a wide
class of poverty measures and to a range of identification cut-offs.
• Weighted dimensions may be incorporated in the analysis.
• Statistical inference tests may be implemented.
Thank you for your attention