Counterparty Risk in Material Supply Contracts Risk in Material Supply Contracts ... This paper...
49
This paper presents preliminary findings and is being distributed to economists and other interested readers solely to stimulate discussion and elicit comments. The views expressed in this paper are those of the authors and do not necessarily reflect the position of the Federal Reserve Bank of New York or the Federal Reserve System. Any errors or omissions are the responsibility of the authors. Federal Reserve Bank of New York Staff Reports Counterparty Risk in Material Supply Contracts Nina Boyarchenko Anna M. Costello Staff Report No. 694 October 2014 Revised January 2015
Transcript of Counterparty Risk in Material Supply Contracts Risk in Material Supply Contracts ... This paper...

This paper presents preliminary findings and is being distributed to economists
and other interested readers solely to stimulate discussion and elicit comments.
The views expressed in this paper are those of the authors and do not necessarily
reflect the position of the Federal Reserve Bank of New York or the Federal
Reserve System. Any errors or omissions are the responsibility of the authors.
Federal Reserve Bank of New York
Staff Reports
Counterparty Risk in Material Supply
Contracts
Nina Boyarchenko
Anna M. Costello
Staff Report No. 694
October 2014
Revised January 2015

Counterparty Risk in Material Supply Contracts Nina Boyarchenko and Anna M. Costello
Federal Reserve Bank of New York Staff Reports, no. 694
October 2014; revised January 2015
JEL classification: G14, G19, L00, L14
Abstract
This paper explores the sources of counterparty risk in material supply relationships. Using long-
term supply contracts collected from SEC filings, we test whether three sources of counterparty
risk—financial exposure, product quality risk, and redeployability risk—are priced in the equity
returns of linked firms. Our results show that equity holders require compensation for exposure to
all three sources of risk. Specifically, offering trade credit to counterparties and investing in
relationship-specific assets increase the firm’s exposure to counterparty risk. Further, we show
that contracts with protective financial covenants and product warranties mitigate the
transmission of risk. Overall, we provide evidence on the channels of supply-chain risk, and we
show that shareholders recognize the role of contractual features in mitigating counterparty risk.
Key words: supply contracts, financial covenants, counterparty risk premia
_________________
Boyarchenko: Federal Reserve Bank of New York (e-mail: [email protected]).
Costello: MIT Sloan School of Management (e-mail: [email protected]). The authors thank
Bruno Biais, Stijn van Nieuwerburgh, and Or Shachar for helpful comments and discussions.
Matthew Yeaton provided excellent research assistance. The views expressed in this paper are
those of the authors and do not necessarily reflect the position of the Federal Reserve Bank of
New York or the Federal Reserve System.

1 Introduction
Forming long-term partnerships with customers and suppliers often creates a compet-
itive advantage for the firm due to resource sharing, easing financing constraints, and
encouraging investment in relationship-specific capital. Consistent with these advan-
tages, Allen and Phillips (2000) find that the formation of product market relationships
results in increased stock prices, investment, and operating performance. In addition,
Chan, Kensinger, Keown, and Martin (1997) find a positive stock price reaction around
the announcement of strategic alliances and find that knowledge and information sharing
contribute to the observed positive abnormal returns. Finally, several papers show that
supply partners often provide valuable capital to constrained trade partners in the form
of trade credit financing (Biais and Gollier, 1997; Petersen and Rajan, 1997).
While significant relationships with customers and suppliers can be beneficial, they
also increase firms’ exposure to their counterparty’s risk. Customers and suppliers often
represent significant stakeholders in a firm’s operations, particularly if the firms transact
on a repeated basis or exchange large volumes of goods. Indeed, research shows that eco-
nomically linked firms have predictably linked stock returns (Cohen and Frazzini, 2008).
Further, the prior literature shows that firms are exposed to their supply partners’ neg-
ative credit events. When major customers enter bankruptcy, the firm suffers negative
stock returns and an increase in CDS spreads (Hertzel, Li, Officer, and Rodgers, 2008;
Jorion and Zhang, 2009; Boone and Ivanov, 2012). These observations lead to two impor-
tant and unanswered questions in the literature. First, which specific characteristics of
the trade relationship make a firm more vulnerable to negative spillovers from its supply
chain partners? Second, if managers understand these vulnerabilities, can they design a
contract to mitigate exposures to negative events?
To answer these questions, we develop a dataset of supply chain links using material
contract disclosures from SEC filings. Regulation S-K requires publicly filing firms to dis-
1

close contracts with suppliers and customers if the transactions represent purchases or
sales that are material to the filer. Therefore, our setting captures economically signifi-
cant product market relationships that are most likely to influence firm value. Further,
we observe the detailed terms of trade, which allows us to identify whether managers
anticipate negative supply chain spillovers ex ante and mitigate those spillovers with
contractual mechanisms.
To illustrate the effect that contractual terms of trade can have on the transmission of
shocks along the supply network, consider the supply contracts between LaJolla Pharma-
ceutical and BioMarin and LaJolla Pharmaceutical and Abbott Laboratories. On Febru-
ary 12, 2009, LaJolla Pharmaceutical announced that its leading drug candidate, Riquent,
failed its Phase 3 clinical trials. The news resulted in a 90% decline in the value of LaJolla’s
stock. At the time of the announcement, LaJolla had material supply contracts with both
BioMarin and Abbott Laboratories, but BioMarin was significantly more exposed to a
negative spillover. Specifically, the supply contract with BioMarin required a $15 million
up-front payment to LaJolla for the marketing rights of Riquent. In contrast, the con-
tract with Abbott Laboratories did not involve up-front payments. As shown in Figure 1,
variation in the terms of trade resulted in differential equity market reactions; BioMarin
stock declined in value by approximately 35%, while the stock of Abbott Laboratories
was largely unaffected.
The above example illustrates our primary hypothesis: can features of the inter-firm
supply agreement impact the relative exposure of firms to supply chain risk? To test
this hypothesis, our empirical strategy separates a firm’s linked counterparties into two
classes based on the degree of exposure the firm has to its counterparty’s risk. The first
group includes upstream or downstream relationships governed by contracts that restrict
the firm’s exposure to counterparty risk. The second group includes counterparties that
do not face restrictive contractual clauses, and therefore leaves the firm more exposed
to spillovers. We then construct long-short equity portfolios for the firm based on the
2

Figure 1. LaJolla Pharmaceutical, BioMarin and Abbott Laboratories. Stock prices ofLaJolla Pharmaceutical, BioMarin and Abbott Laboratories in February 2009. Prices arenormalized (02/05/2009=100). Source: CRSP.
020
4060
80100
05feb2009
07feb2009
09feb2009
11feb2009
13feb2009
15feb2009
17feb2009
19feb2009
21feb2009
23feb2009
AbbottLaJollaBioMarin
news embedded in the equities of linked firms. The central prediction is that, while the
returns of linked supply partners forecast the future returns of the firm, this return pre-
dictability varies with respect to contractual protections that mitigate negative supply
chain spillovers.
We rely on economic theory to identify three specific channels that can cause coun-
terparty risk to be priced in market returns: credit exposure, product quality risk, and
redeployability risk. First, firms can be exposed to the financial risk of their supply chain
counterparties if they provide credit to their suppliers or customers when exchanging
goods or services. Since trade creditors typically hold subordinate, unsecured claims
on the debtor’s assets, they face significant downside risk in the event their supplier or
customer enters bankruptcy. In addition to the potential loss of trade credit exposures,
3

financially distressed counterparties can have a significant impact on the firm’s future
operations. For example, a distressed customer may reduce its demand for the firm’s
products and a distressed supplier may reduce the supply of important raw materials. If
it is costly for the firm to fill the supply and demand from alternative trade partners, the
firm will have a higher exposure to its counterparty’s financial distress.
We test whether the financial risk of supply chain counterparties is incorporated in the
firm’s equity price using three proxies: whether the contract contains financial covenants,
whether trade credit is extended, and whether the counterparty has a speculative-grade
credit rating. Costello (2013) shows that financial covenants in supply contracts require
counterparties to maintain a minimum level of financial performance. Violation of a fi-
nancial covenant indicates that the party is in default and must cure the default or pay
damages. Therefore, a firm that contractually requires their suppliers and customers to
maintain financial performance standards should be more protected from financial coun-
terparty risk than a firm that does not. We also test whether trade credit, measured as
explicit financing terms in the contract, generates a risk premium. If the firm serves as a
creditor to its suppliers by advancing funds before receiving goods or to their customers
by allowing them to pay late, it should be more exposed to financial counterparty risk
than firms that do not act as creditors to their partners. Finally, if the firm enters trade
relationships with speculative-grade counterparties, it is likely to be more exposed to
financial risk than if the firm has trade relationships with investment-grade counterpar-
ties. We provide evidence that the firm’s exposure to credit risk is recognized by market
participants; large credit exposures through inter-firm loans result in predictably linked
stock returns. We also show that market participants understand the role of financial
covenants in mitigating the firm’s exposure to linked firms’ credit risks. The firm’s stock
returns are less correlated with their supply partner’s returns when the contract has pro-
tective covenants than when the contract does not have protective covenants. We do not
find that contracting with speculative-grade trade partners impacts risk premiums.
4

The second channel of counterparty risk that we investigate is product quality risk.
Firms can be exposed to product quality risk because their suppliers are better informed
about the quality of inputs and effort used in production. Since it may be costly for firms
to distinguish between low- and high-quality products, suppliers will have an incentive
to shirk on product quality (Titman, 1984; Maksimovic and Titman, 1991). Even absent
incentive conflicts, supply chain glitches due to production problems can impose signifi-
cant costs on the firm if their suppliers cannot meet expectations (Hendricks and Singhal,
2003).
It is important to note that firms are exposed to product quality risk primarily through
their suppliers, rather than through their customers. Therefore, we expect that a shock to
a supplier’s product quality will have a greater impact on a firm’s returns than a shock to
a customer’s product quality. To test the product quality channel, we investigate whether
product warranties mitigate product quality risk. Specifically, if product warranties pro-
vide insurance in the event of product failure, firms should have a lower sensitivity to
their supplier’s risk when their contracts require suppliers to provide warranties. Con-
sistent with this hypothesis, we find that the predictability of customers’ return following
shocks to their suppliers is reduced when the contract includes product warranties, while
the predictability of suppliers’ returns in response to shocks to their customers is not af-
fected.
The final channel of counterparty risk is redeployability risk. If the exchange between
the firm and its suppliers and customers requires investments in relationship-specific as-
sets, the firm may find it difficult to find a replacement trade partner. Therefore, the coun-
terparty’s economic health may affect not only current credit exposures, but it may also
impact the firm’s ability to source raw materials and to generate revenue in the future.
We use two empirical proxies to capture firms that are more exposed to redeploya-
bility risk. First, we determine whether the firm makes a significant investment in capi-
tal related to the exchange. This information is taken from the investment requirements
5
identified in the contract. If the firm makes a capital investment, it is more exposed to
the counterparty’s returns since it is costly to switch to an alternative partner. Second, we
measure the concentration index of the counterparty’s industry. If the firm’s suppliers or
customers operate in highly concentrated industries, it is more difficult to switch to alter-
native supply partners than if their partners operate in dispersed, competitive industries.
We provide evidence that counterparty risk due to relationship-specific investments com-
mands a risk premium. However, we do not find that contracting with a customer or a
supplier in a concentrated industry exposes the firm to additional risk.
Our evidence is consistent with the hypothesis that three types of supply chain risks
— financial risk, product quality risk, and redeployability risk — exacerbate the firm’s
exposure to negative spillovers and that these risks can be mitigated through contractual
features. However, we recognize that our inferences could be confounded by omitted
variables. First, one might observe higher return predictability among linked firms due
to a common economic shock, rather than due to the transmission of financial, product
quality, or redeployability risk from the contractual counterparty. Second, it is possible
that an omitted variable determines both the propensity of firms to include contractual
features and the correlation in stock returns. We address these concerns in three ways.
First, we conduct a placebo test for the return predictability of linked firms in the period
before they form a contractual relationship. We do not observe linked returns during this
placebo period, indicating that the results are not merely a reflection of a correlation in
cash flows rather than a contractual exposure. Second, we conduct an event study around
the press release announcing the supply partnership and an event study around the dis-
closure of the full supply contract. The evidence suggests that market participants price
contractual features only at contract disclosure date, when the specific terms of trade are
publicly available. This finding mitigates the concern that an omitted variable drives both
the use of contractual clauses and the correlation in stock returns. Finally, we include firm
fixed effects in the analyses and draw inferences from the subsample of firms that have
6

contracts both with and without contractual protections. We show that the return pre-
dictability results hold only for the contracts with contractual features, even when con-
trolling for time-invariant firm characteristics. Overall, these tests mitigate the concerns
that an omitted variable drives the results.
We contribute to the literature on return predictability across economically linked
firms. Cohen and Frazzini (2008) was the first paper to document that limited attention
on the part of investors leads to predictable stock returns for linked firms: stock prices
underreact to negative (positive) news involving related firms, which in turn generates
negative (positive) subsequent price drift. Menzly and Ozbas (2010) document that the
cross-predictability along the supply chain at the firm level is also present at the indus-
try level, with equity returns of industries predicted by past equity returns of upstream
and downstream industries in the United States. Shahrur, Becker, and Rosenfeld (2009)
extend this analysis to developed markets around the world and also find that stock re-
turns from downstream industries lead stock returns on supplier industries. This paper
deviates from the previous literature on return predictability by integrating the role of
contractual relationships between firms and their suppliers and customers. Specifically,
if maintaining significant supply chain relationships increases the firm’s exposure to var-
ious risks, firms should be able to design contractual relationships to mitigate some of
this exposure. Investigating the role of the contractual relationship on equity return pre-
dictability is the primary contribution of our paper.
Our second contribution is to provide evidence on the channels of supply chain risk
exposures. While prior studies focus only on the existence of customer-supplier links,
our research setting allows us to exploit variation in exposures to financial, product, and
redeployability risk. The benefit of our research setting is threefold. First, the disclosure
requirements apply to both upstream and downstream relationships; thus, we are able
to test whether the source of counterparty risk from suppliers differs from the source
of counterparty risk from customers. Second, since firms are required to disclose sup-
7

ply contracts in their entirety, we are able to test whether contractual provisions such as
covenants, product warranties, relationship-specific investments, and financial exposures
impact the perceived degree of counterparty risk from supply chain partners. Third, the
contracts allow us to identify relationships with suppliers and customers that are material
enough to influence operations and are thus likely to have a salient effect on the firm’s
market value.
The rest of the paper is organized as follows. We describe the sample construction
in Section 2. In Section 3 we conduct an event study around press releases and contract
disclosures. Section 4 demonstrates the basic return predictability results and outlines
how differences in return predictability are used to test for sources of risk premia. We
investigate three sources of counterparty risk in Section 5 and study the robustness of the
results in Section 6. Section 7 concludes.
2 Data
2.1 Sample Selection and Descriptive Statistics
We construct our upstream and downstream relationships from material contracts filed
with the SEC. Regulation S-K of the Securities Act of 1933 requires publicly filing com-
panies to disclose supply contracts, in their entirety, as exhibits to 10-Ks, 10-Qs, or 8-Ks.
Contracts must be disclosed if they represent a material portion of the filer’s purchases
or sales during the fiscal year. We begin by searching SEC filings for exhibits with supply
or procurement in the title and buyer and supplier or seller in the first paragraph. Each re-
sulting exhibit is checked to ensure the existence of an upstream or downstream supply
agreement, and the identity of the counterparty listed in the contract is recorded. Contrac-
tual features including relationship-specific investments, product characteristics, product
8
warranties, financial covenants, and trade credit terms are recorded.1 For our empiri-
cal analyses, we assume that two firms are contractually linked starting on the contract
start date (the filing date or the commencement date) and ending at contract expiry. We
determine contract expiry in two ways. First, we determine the contract duration from
the terms of the agreement and calculate an end date based on these terms. If a contract
renewal is not filed, the calculated end date is used as the contract expiry date. Second,
we search 8-K filings for contract terminations.2 If a firm reports that the contract was
terminated, we use the termination date as the contract expiry date.
Each filing firm in our contract dataset is matched to CRSP/Compustat using the
Central Indexing Key provided in the filing. We then hand match the counterparty to
CRSP/Compustat database using the company name and location. Our sample consists
of all contracts in which both counterparties are publicly listed firms with non-missing
values of book equity (BE) and market equity (ME) at the fiscal quarter end for each
quarter that a contractual link exists. The final sample contains 1,762 distinct firm-year
relationships, representing a total of 427 unique supplier-customer relationships between
1994 and 2013.
Table 1 shows the summary statistics for the equity-matched sample. In Panel A we
report the coverage of the firms in our data as a fraction of the universe of CRSP common
stocks. One important feature of the sample of contracts we analyze is the relative size
of the two counterparties to the contract. In contrast to Cohen and Frazzini (2008), the
customers and the suppliers in our sample have a similar size distribution, which is tilted
toward large cap securities: the average customer size is above the 67th percentile of
CRSP firms, and the average supplier size is above the 63rd percentile of CRSP firms.
This difference in the size distribution, relative to the Cohen and Frazzini (2008) sample,
reflects the differences in reporting requirements. For the non-contractual relationships
1See Costello (2013) for details on the data collection procedure and a list of contractual variables col-lected.
2Material contract terminations are required to be disclosed under Item 1.02 of the 8-K.
9

collected in Cohen and Frazzini (2008), firms are required to report the identity of any
customer that represents more than 10% of total reported sales, which tilts the sample
toward large customers. In our sample, both suppliers and customers are required to file
supply contracts if the contract constitutes a material part of their business. Thus, while
our sample is still tilted toward large cap stocks, the size distribution of customers and
suppliers is more similar.
In Panel C, we report the sample properties of contractual features of interest. The
most prevalent contractual features are financial covenants (35% of contract-month ob-
servations on average), deferment of payment by the customer (70%), and product war-
ranties (54%). In contrast, the customer extends a loan to the supplier in only 3.6% of
contract-month observations on average, and only 28% of contracts require the supplier
to make relationship-specific investments. It is also interesting to note that in 75% of ob-
servations, the supplier has a speculative-grade credit rating, in 80% the customer has
a speculative-grade credit rating, and in 58% both counterparties to the contract have
speculative-grade credit ratings.
2.2 Determinants of Contractual Features
As discussed in the introduction, a possible concern with our research design is that firms
that have contractual protections are inherently different from firms that do not have con-
tractual protections. For example, firms that demand financial covenant protections in
their supply contracts might be more resilient to their supply chain exposures than firms
that are unable to demand such protections. Therefore, an omitted variable (financial re-
silience) would explain the mitigated response to supply shocks rather than the inclusion
of covenant protections themselves.
To shed light on this issue, we compare the characteristics of firms that have contrac-
tual protections to those that do not have contractual protections, reported in Tables 2
and 3. Contractual features that exacerbate the firm’s exposure to counterparty risk in-
10

clude the extension of trade credit or loans, relationship-specific investments, and con-
tracts with speculative-grade counterparties. Therefore, we should observe more pro-
nounced return predictability for firms that have contracts with these features. An alter-
native explanation for a more pronounced correlation in returns is that the firm has poor
bargaining power or is financially weak; these firms may be more likely to enter contracts
where they are more exposed to risk (due to their weaker bargaining power) and are thus
more vulnerable to negative shocks.
The statistics reported in Table 2 do not support this alternative explanation. Firms
that offer trade credit and loans and firms that make relationship-specific investments are
larger, older, and more profitable than firms that do not have contracts that exacerbate
counterparty risk. We also do not find any statistical differences in the relative size or the
relative market power of firms in contracts with clauses that exacerbate risk versus con-
tracts without such clauses. Overall, we conclude from Table 2 that an omitted variable
related to bargaining power or financial strength is unlikely to explain our results.
In Table 3, we investigate differences in the characteristics of firms that have contrac-
tual features mitigating counterparty risk and those that do not. Contractual features that
mitigate the firm’s exposure to counterparty risk include financial covenants and product
warranties. We expect that these features should mitigate the firm’s exposure to coun-
terparty events. An alternative explanation for a less pronounced return predictability is
that the firm has stronger bargaining power or greater financial strength. If these firms
are able to demand favorable contracts that protect them from risk and they are more
resilient to economic shocks, our inferences could be threatened.
The statistics reported in Table 3 show that buyers that have financial covenant protec-
tions are larger and older than buyers that do not have such protections. Further, sellers
that have covenant protections are marginally larger than sellers that are not protected
by covenants. However, we find that firms with covenant protections have lower mar-
ket shares (HHI), and there is no significant difference in the relative size or the relative
11

market power of buyers and suppliers in contracts with covenants versus contracts with-
out covenants (Buyer/Supplier Size and Buyer/Supplier Mkt. Power). We also find that
buyers that request product warranties are smaller, younger, and less profitable than buy-
ers without warranty protections. Overall, the evidence indicates that differences in the
relative market power of the contracting parties are unlikely to explain our results. To
further ensure that omitted firm characteristics are not driving our results, we perform
supplemental tests using firm fixed effects.
3 Event Study
In order for stock returns to reflect the firm’s exposure to supply chain risk, two con-
ditions must be met. First, the information needs to be available to investors, and sec-
ond, the information needs to be salient enough for investors to process. Therefore, we
should expect market participants to reflect the differences in the firm’s relative expo-
sure to counterparty risk only when the information about the detailed trade relationship
becomes available. If market participants reflect this information before detailed trade
contracts are disclosed, then either (1) details of the contract are leaked to some investors
before the contract disclosure date or (2) non-contract-specific characteristics, such as the
firm’s market power or industry norms, explain the correlation in returns, rather than the
contractual features themselves.
To explore these issues, we collect the date of the press announcement revealing that
the firms are entering into a supply agreement. The press announcement typically reveals
only the name of the counterparty, the product that will be exchanged, and the date that
the contract will commence. Other details of the trade relationship are not available until
the entire contract is disclosed in the 10K at the end of the fiscal year. To collect press
announcement dates, we search LexisNexis for news articles with both the buyer’s and
the supplier’s names. We manually check the results of our search to ensure that (1) the
12

press announcement refers to the contract in our sample and (2) the press announcement
occurs before the contract disclosure date.
Table 4 reports the (-2,2) day cumulative abnormal return for suppliers (Panel A) and
customers (Panel B). For the contract filing date, we compute the abnormal return in ex-
cess of the abnormal return normally earned by the firm on 10K filing dates. In columns
(1) and (4) of Panels A and B, we compute abnormal returns for the event dates, control-
ling only for industry fixed effects. Our results indicate that there are significant abnormal
returns to customers announcing their partnership with a major supplier. The abnormal
returns are realized on both the press release date and the contract filing date. How-
ever, we do not document abnormal returns to suppliers that announce their partnership
with a major customer. This evidence highlights one of the important contributions of
our research setting: previous studies document supply chain links using the major cus-
tomer database in Compustat, which provides information only about downstream rela-
tionships. However, we show that disclosing information about upstream relationships
results in significant abnormal returns to the filing firm.
Next, we conduct an event study analysis of the press release date and the date that
the full contract was disclosed in a public filing. If market participants use the informa-
tion in contracts to identify the firm’s relative exposure to counterparty risk, we should
observe market reactions to contractual features only at the contract filing date, rather
than at the press announcement date. Overall, we show that information about the con-
tractual features is impounded in returns only at the contract filing date, rather than at the
press release date. Suppliers that obtain loans from their customers exhibit more negative
abnormal returns at the contract filing date.3 Further, customers who have covenant pro-
tections exhibit more positive abnormal returns at the contract filing date. Columns 4-6
3Our prediction regarding the direction of abnormal returns for suppliers receiving loans from cus-tomers is, ex ante, ambiguous. On one hand, receiving additional capital could be beneficial if it allows theseller to invest in positive NPV projects. On the other hand, Costello (2014) shows that sellers receivingloans are financially weak and have been rationed from traditional credit markets. If the loan providesinformation to investors on the financial health of suppliers, the return could be negative.
13

report that none of the contractual features impact the firm’s returns on the press release
date.4 The evidence provided in Table 4 is consistent with our prediction that investors
are responding to information about the specific contractual terms, rather than to more
general information about the buyer-supplier link.
4 Return Predictability, Limited Attention, and Counter-
party Risk
In this Section, we describe how return predictability can be used to test which channels
of counterparty risk are priced in market returns. Under the limited attention hypoth-
esis of Cohen and Frazzini (2008), stock prices underreact to information about related
firms, creating return predictability across assets. Investors’ limited attention has impli-
cations for return predictability if two conditions are satisfied: information overlooked
by investors is both salient and available before prices evolve. In this paper, we argue
that contractual features that reduce counterparty risk also reduce the saliency of infor-
mation about linked firms for the firm’s own stock return. Thus, by testing the impact of
contractual features on return predictability, we can identify whether different sources of
counterparty risk command a risk premium.
To test for return predictability, we study quarterly returns on calendar-time portfolios
formed by sorting stocks on their lagged counterparty returns. We consider two strate-
gies: one based on the transmission of shocks from customers to their suppliers, “up-
stream momentum,” and one based on the transmission of shocks from suppliers to their
customers, “downstream momentum.” Since some firms in our sample have multiple
customers (suppliers) over many periods, we construct the customer (supplier) return for
4We omit the indicator for the speculative-grade counterparty in Panel A because for the press releasesample, all of the customers are of speculative-grade. In Column 6 of Panel A, the loan indicator is omittedas all of the suppliers for whom we have balance sheet information (EBITDA and sales) do not receive loansfrom their customers.
14

a given firm as the equal-weighted portfolio return of all the customers (suppliers) of the
firm at a given date. At the beginning of each month, we rank stocks in ascending order
based on the customer (supplier) returns between months t− 4 and t− 1 and assign them
to one of five quintile portfolios. All stocks are value-weighted within a given portfolio,
and the portfolios are rebalanced every calendar month to maintain value weights.
We construct the downstream (upstream) momentum strategy as the zero-cost port-
folio that holds the top 20% of high-customer (supplier)-return stocks and sells short the
bottom 20% of low-customer (supplier)-return stocks. Since these investment rules are
based entirely on observable, lagged returns, they should earn zero abnormal returns in
a fully efficient market. On the other hand, positive portfolio abnormal returns in excess
of traded factor exposure following positive customer (supplier) returns are indicative of
the presence of upstream (downstream) momentum and, hence, indicate underreaction
to news about linked firms. Since the opposite is true for negative news, a long-short
portfolio that sorts on customer (supplier) news should generate positive returns.
In Table 5, we report the average excess return to the long-short upstream (Panel A)
and downstream (Panel B) momentum strategies. While the upstream momentum strat-
egy generates significant returns, with Fama and French (1993) abnormal returns of 1.84%
per quarter or approximately 7.5% per year, the returns to the downstream momentum
strategy are much smaller and are not statistically significant. Adjusting the returns of the
upstream momentum strategy by augmenting the factor model with the Carhart (1997)
momentum factor and the traded liquidity factor of Pastor and Stambaugh (2003) has a
negligible effect on the results: the abnormal return on the long-short portfolio is 1.81%
for the four factor model at a quarterly horizon and 1.88% for the five factor model. The
results show that, even after controlling for past returns or a reversal measure of liquidity,
high (low) upstream momentum stocks earn high (low) risk-adjusted subsequent returns.
There are two potential (not mutually exclusive) explanations for the failure of the
downstream momentum strategy to generate significant returns: either the investors re-
15

act in a timely manner to news about a firm’s suppliers (so that the information is incor-
porated immediately into the firm’s stock return), or investors are unaware of the sup-
pliers of the firm (so that the information about the supplier is never incorporated into
the stock return). The results in Section 5 give credence to the former explanation, since
downstream momentum is present when the contract does not protect the customer from
exposure to the supplier. It is worth noting that, although the downstream momentum
strategy does not generate statistically significant returns, augmenting the factor model
with the Carhart (1997) momentum factor and the Pastor and Stambaugh (2003) liquidity
factor has little effect in this case as well: the abnormal return on the long-short down-
stream portfolio is 0.59% for the four factor model and 1.19% for the five factor model.
The last column of Table 5 tests whether all of the excess returns to the long-short
strategies are generated persistently by the same firms by including firm fixed effects. The
inclusion of supplier fixed effects in the upstream momentum strategy increases the five
factor alpha to 1.95% but does not impact the significance of the point estimate. Similarly,
the inclusion of customer fixed effects in the downstream momentum strategy increases
the five factor alpha to 1.56%. Thus, for a given supplier, market participants demand
additional compensation for risk during months when the supplier’s customers under-
perform and less compensation for risk during months when the customers outperform
the customers of other suppliers.
We conclude this Section by investigating whether market participants perceive shocks
from contractually linked counterparties to be more detrimental than shocks from non
contractually linked counterparties. We merge our dataset of contractually linked coun-
terparties with the major customer dataset used by Cohen and Frazzini (2008) and assume
that any link not present in our dataset is non contractual. We test for the impact of a con-
tractual link by estimating the following model:
rxt = α0 + α11Contract + ∑i(βi0FFit + βi1FFit × 1Contract) + εt, (4.1)
16

where rxt is the portfolio return in excess of the risk-free rate in month t, 1Contract is the
indicator variable of whether the relationship is contractual, FFit is the return on the ith
hedging factor, and FFit × 1Contract is the interaction between the factor return and the
contract indicator variable. If contracts make customer-supplier relationships harder to
terminate, return predictability will be higher for relationships created through contracts.
Thus, α1 should be positive.
Table 6 reports the returns for the upstream momentum (Panel A) and downstream
momentum (Panel B) strategies, controlling for whether the relationship is contractual.
The existence of a contract between the two counterparties generates significant increases
in the returns to the upstream momentum strategy, with the Fama and French (1993) ab-
normal return 2.11% points higher for contractually linked counterparties. As with the
baseline momentum strategy of Table 5, adjusting the returns of the upstream momen-
tum strategy by augmenting the factor model with the Carhart (1997) momentum factor
and the traded liquidity factor of Pastor and Stambaugh (2003) has a negligible effect on
the results: having a contractual relationship raises the four factor alpha by 2.03% and
the five factor alpha by 2.05% per quarter. Finally, the last column of Table 6 shows that
return predictability is higher when the shocks originate from contractually linked cus-
tomers, even after controlling for supplier fixed effects. This suggests that for suppliers
that have both contractual customers and non-contractual customers, return predictabil-
ity manifests only through contractual links.
Panel B shows that all of the returns to the downstream momentum strategy are
earned from contractually linked firms (although the point estimate is insignificant). The
point estimate on the contract indicator, however, does not change significantly when we
include the Carhart (1997) momentum factor, the traded liquidity factor of Pastor and
Stambaugh (2003), or customer fixed effects in the regression specification.
To summarize, the results of this section show that market participants demand com-
pensation for the risk of shock transmission between trading partners. This compensation
17

is higher when the shock is transmitted from customers to suppliers (upstream momen-
tum) and if the two counterparties are linked through a contract. Thus, although there
are beneficial aspects of product market relationships, there are also costs associated with
the large legal obligations created through long-term contracts. In the rest of the paper,
we examine how contracts can be designed to mitigate these adverse effects.
5 Sources of Counterparty Risk
5.1 Financial exposure and credit risk
We begin by examining whether greater financial exposure through long-term contracts is
priced in the equity market. As shown in Jorion and Zhang (2009), unsecured claim hold-
ers of defaulting firms experience negative abnormal equity returns and increased CDS
spreads following the credit default of major counterparties. In this section, we examine
whether this adverse effect on the firm’s equity is priced ex ante. We consider three sets
of proxies for financial exposure through supply contracts: whether the contract contains
financial covenants, whether trade credit is extended, and whether the counterparty has
a speculative-grade credit rating.
Costello (2013) shows that financial covenants are used in long-term supply contracts
as early warning signs of a partner’s financial distress. The most common covenants
used in supply contracts require the contracting parties to maintain minimum levels of net
worth or net income; such performance requirements mitigate financial exposure because
covenant violations allow the non defaulting party to demand immediate repayment or to
exit the contract. Therefore, financial covenants allow firms to collect their claims before
becoming an unsecured claim holder in the event that their supply partner enters default.
18

We test for the impact of financial covenants by estimating the following model:
rxt = α0 + α11Fin. Covenant + ∑i(βi0FFit + βi1FFit × 1Fin. Covenant) + εt, (5.1)
where rxt is the portfolio return in excess of the risk-free rate in month t, 1Fin. Covenant
is the indicator variable of whether the contract includes financial covenants, FFit is the
return on the ith hedging factor, and FFit × 1Fin. Covenant is the interaction between the fac-
tor return and the financial covenant indicator variable. If financial covenants mitigate a
dimension of counterparty risk that is priced in equity returns, then return predictabil-
ity will be lower for relationships based on contracts with financial covenants. Thus, α1
should be negative, and α0 should be positive.
Table 7 reports the returns for the upstream momentum (Panel A) and downstream
momentum (Panel B) strategies, controlling for the presence of financial covenants in
the contract. When the contract does not include financial covenants, the upstream mo-
mentum strategy generates positive and significant returns, with Fama and French (1993)
abnormal returns of 3.3% per quarter or approximately 15% per year. The inclusion
of financial covenants in the contract lowers this return by 4.5% per quarter, which is
both economically and statistically significant. Augmenting the factor model with the
Carhart (1997) momentum factor, the Pastor and Stambaugh (2003) liquidity factor, and
supplier fixed effects has a negligible effect on the results: the abnormal return on the
long-short portfolio of contracts without financial covenants is 2.8% for the five factor
model with supplier fixed effects at a quarterly horizon, and the inclusion of covenants
lowers that return by 4.3%. Thus, even though high (low) upstream momentum stocks
earn high (low) risk-adjusted subsequent returns, the inclusion of financial covenants
dramatically reduces these returns. These results suggest that equity markets perceive
financial covenants as mitigating upstream counterparty risk. Because many suppliers
have both contracts with and contracts without covenants, we are able to include firm
19

fixed effects to capture within-firm variation in the contribution of covenants to counter-
party risk. The results in column 5 indicate that firms are less exposed to risk only for
their contracts with covenants.
Panel B of Table 7 shows that the downstream momentum strategy also generates sig-
nificant returns: in the absence of financial covenants, the downstream momentum strat-
egy has Fama and French (1993) abnormal returns of 2.03% per quarter or approximately
8.4% per year. The inclusion of financial covenants reduces that abnormal return by 3.03%
per quarter, which is both economically and statistically significant. Thus, the absence
of financial covenants is a priced source of risk for downstream momentum strategies,
implying that market participants believe that financial covenants mitigate downstream
counterparty risk. These results hold even after we augment the factor model with the
Carhart (1997) momentum factor, the Pastor and Stambaugh (2003) liquidity factor, and
customer fixed effects: the abnormal return on the long-short portfolio of contracts with-
out financial covenants is 3.1% for the five factor model with customer fixed effects, and
the inclusion of covenants lowers that return by 3.06%.
Next, we analyze the impact of financial exposure on return predictability using the
terms of trade credit established in the contract. We investigate whether exposures through
trade credit are priced ex ante in equity returns.5 Trade credit represents the financing
terms associated with the exchange of goods and services. For the contracts in the sam-
ple, trade financing can take three forms: deferrals, advances, and loans. Deferrals allow
the customer to purchase goods or services from suppliers on account, with the ability to
pay at a later date. Deferrals can increase the firm’s exposure to its customers’ credit risk
since suppliers become unsecured creditors in the event of a customer default. Advances
provide funds to suppliers before the delivery of goods, and the liability is settled upon
product delivery. Therefore, advances can increase the firm’s exposure to its supplier’s
5Jorion and Zhang (2009) find that, for non financial firms, when a creditor unexpectedly defaults, a1% exposure in market equity terms is associated with a roughly 1% wealth loss for the non defaultingcounterparty.
20

credit risk if the supplier defaults before product delivery. Finally, loans provide general
purpose financing to suppliers with the promise to pay the customer the principal and
interest at a future date. Costello (2014) finds that firms extend loans to their suppliers
for large capital expenditures necessary for the trade relationship, including specialized
equipment and manufacturing facilities. The average repayment period for loans is three
years. Loans increase the firm’s exposure to its suppliers’ credit risk over the repayment
period.
We test for the impact of trade credit by estimating the following model:
rxt = α0 + α11Trade Credit + ∑i(βi0FFit + βi1FFit × 1Trade Credit) + εt, (5.2)
where 1Trade Credit is the indicator of trade credit extended to the counterparty, rxt is the
portfolio return in excess of the risk-free rate in month t, and FFit is the return on the
ith hedging factor. If financial exposure through trade credit commands an equity risk
premium, α1 and α0 + α1 should be positive, so that increased exposure increases the
impact of negative news about customers or suppliers on the firm’s return.
Panel A of Table 8 reports the returns for the upstream momentum strategy, control-
ling for whether the payment from the customer to the supplier is deferred past the de-
livery date of the product. If payment deferral increases the seller’s risk exposure, we
expect it to affect the upstream momentum strategy. We do not find statistical support
for this prediction in any of the specifications estimated. In Panel B of Table 8, we report
the impact of payment advances on the downstream momentum strategy. If advances
increase the firm’s exposure to supplier risk, we would expect more significant returns to
the downstream momentum strategy for firms advancing funds to their sellers. We do
not find statistically significant differences between exposures with trade credit advances
versus exposures without trade credit advances. The results in Panels A and B suggest
that trade credit exposures through deferrals and advances do not contribute to signifi-
21

cant differences in counterparty risk. We hypothesize that the trade credit exposures for
our sample are, on average, small or short in duration, which would mitigate negative
spillovers.
In Panel C, we report the returns for the downstream momentum strategy, controlling
for whether the customer extends a loan to the supplier.6 While loans are relatively infre-
quent in our sample, the large financial exposure they create has a significant impact —
both economically and statistically — on the return the strategy that holds the top 50%
high supplier return stocks and sells short the bottom 50% low supplier return stocks.
The Fama and French (1993) abnormal return to the downstream momentum strategy
is 7.6% higher for contracts that feature a loan to the supplier. Augmenting the factor
model with the Carhart (1997) momentum factor, the Pastor and Stambaugh (2003) liq-
uidity factor, and customer fixed effects changes the point estimate of the effect but not its
significance: extending a loan to the supplier raises the five factor alpha, controlling for
customer fixed effects, by 10.9% per quarter. We note that most of the effect comes from
the adverse impact on the abnormal return of the short leg of the portfolio: the abnormal
return to holding the bottom 50% low supplier return stocks is 10.7% lower when the cus-
tomer extends a loan to the supplier. Since the trade creditor is an unsecured claimant in
bankruptcy, exposure through loans to suppliers with poor returns adversely affects the
customers’ equity return.
Finally, we test whether financial exposures impact counterparty risk using informa-
tion on the supply partners’ credit ratings. Specifically, trading with supply partners that
have speculative-grade credit ratings should expose the firm to greater financial risk since
these firms have a higher probability of defaulting on their debt obligations. Since the
trade creditor becomes an unsecured claimant in bankruptcy, trading with speculative-
grade firms increases financial exposure, relative to trading with investment-grade firms.
6We omit the results for the upstream momentum strategy for brevity. Consistent with the theoreticalpredictions, loans to the supplier do not affect the returns to the upstream momentum strategy.
22

We test for the impact of credit risk by estimating the following model:
rxt = α0 + α11Speculative Grade + ∑i
(βi0FFit + βi1FFit × 1Speculative Grade
)+ εt, (5.3)
where 1Speculative Grade is an indicator equal to one if the counterparty has a speculative-
grade credit rating (below BBB- on the S & P scale), rxt is the portfolio return in excess of
the risk-free rate in month t, and FFit is the return on the ith hedging factor. If exposure to
credit risk commands an equity risk premium, α1 and α0 + α1 should be positive, so that
increased exposure increases the impact of negative news about customers or suppliers
on the firm’s return.
Table 9 reports the returns for the upstream momentum (Panel A) and downstream
momentum (Panel B) strategies, controlling for whether the customer (supplier) has a
speculative-grade credit rating. Neither the upstream nor the downstream momentum
strategy generates significant returns after controlling for the counterparty’s credit qual-
ity, even after augmenting the factor model with the Carhart (1997) momentum factor,
the Pastor and Stambaugh (2003) liquidity factor, and firm fixed effects. In unreported
results, we exploit variation in the relative credit quality of the supply chain partners.
Specifically, we test whether contracting with a counterparty whose credit rating is lower
than the firm’s increases the abnormal return to the upstream or downstream momentum
strategies. We find that the effect for the upstream momentum strategy is positive and
statistically significant; for the downstream momentum strategy, the effect is positive but
not statistically significant.7 Thus, overall, investors in the equity market perceive con-
tracts with lower quality counterparties as increasing firms’ exposures to credit risk and
are paid a risk premium for exposure to firms with lower rated counterparties. This is
consistent with an ex ante pricing of the negative return experienced by unsecured credi-
tors of defaulting firms.
7The results for an investment-grade firm contracting with a speculative-grade counterparty are quali-tatively similar.
23

5.2 Product quality risk
Next, we examine whether exposure to product quality risk is priced in the equity market.
Firms can be exposed to product quality risk because their suppliers are better informed
about the quality of inputs and effort used in production. If it is costly for managers to
distinguish between high quality and low quality producers, the low quality suppliers
have incentives to shirk on quality. Exposure to this type of risk can result in significant
losses to the firm. For example, Hortaçsu, Matvos, Syverson, and Venkataraman (2013)
find that automobile prices are significantly lower when suppliers cannot provide high
quality service parts and maintenance. One way to curtail these costs is to purchase prod-
uct warranties, which provide guarantees of product quality by granting the purchaser
insurance against product defects.
Warranties can reduce product quality concerns in two ways. Spence (1977) argues
that warranties serve a signaling role; high quality producers offer full insurance since
their products are unlikely to break down. Therefore, customers can differentiate between
high and low quality suppliers ex ante. Second, warranties promise a high level of prod-
uct quality that is ex post verifiable. This verifiability reduces the suppliers’ incentives
to shirk ex post (Kambhu, 1982; Cooper and Ross, 1985). Based on these arguments, we
expect that firms entering contracts with product warranties are less exposed to product
quality risk than those entering contracts without product warranties.
In Table 10, we test for the impact of product warranties by estimating the following
model:
rxt = α0 + α11Product Warranty + ∑i
(βi0FFit + βi1FFit × 1Product Warranty
)+ εt, (5.4)
where 1Product Warranty is the indicator variable equal to one if a product warranty is in-
cluded in the contract, rxt is the portfolio return in excess of the risk-free rate in month
t, and FFit is the return on the ith hedging factor. If product warranties mitigate expo-
24

sure to quality risk and product risk is priced in equity returns, then return predictability
will be lower for relationships based on contracts with product warranties. Since product
warranties protect the customer only, the inclusion of product warranties should impact
the profitability of the downstream momentum strategy only. Thus, for the upstream
momentum strategy, α0 should be positive and α1 should be zero. For the downstream
momentum strategy, α1 should be negative and α0 + α1 should be close to zero.
Consistent with predictions, Panel A of Table 10 shows that product warranties do
not affect the upstream momentum strategy. Since product warranties only protect the
customer from product risk, they do not mitigate or exacerbate upstream momentum.
In Panel B of Table 10, we show that product warranties do have a significant effect on
the profitability of the downstream momentum strategy. The Fama and French (1993)
abnormal return to the downstream momentum strategy for customers not protected by
product warranties is 1.64% per quarter, whereas the downstream momentum strategy
for customers with product warranties decreases the return by 2.19%. Thus, the absence
of product warranties is a priced source of risk for downstream momentum strategies,
implying that market participants believe that product warranties mitigate input product
risk. These results hold even after we augment the factor model with the Carhart (1997)
momentum factor, the Pastor and Stambaugh (2003) liquidity factor, and customer fixed
effects: the abnormal return on the long-short downstream portfolio of contracts without
product warranties is 2.79% for the five factor model with fixed effects. The inclusion of
product warranties reduces the five factor abnormal return by 2.69% per quarter, with
both coefficients statistically significant.
It is important to note that financial covenants can also mitigate the risk of moral haz-
ard related to product quality. Maksimovic and Titman (1991) show that financial distress
may cause suppliers to shirk on product quality. Similarly, theory of the firm (Jensen
and Meckling, 1976) suggests that borrowers are likely to engage in risk-shifting when
financial distress becomes more likely. Financial covenants counteract these incentives
25

by transferring decision rights to the non defaulting party in states of the world where
incentive conflicts are high (Aghion and Bolton, 1992). Costello (2013) finds that financial
covenants are more likely to be used to monitor counterparties when information asym-
metry between customers and suppliers is high. The results of Table 7 are consistent with
this interpretation as well, with financial covenants protecting customers from potential
moral hazard on the part of their suppliers and vice versa.
5.3 Redeployability risk
The final source of counterparty risk that we address is the redeployability of assets. Re-
deployability risk arises when it is difficult to find alternative trade partners in the event
that a linked party enters distress. We use two proxies to capture redeployability risk:
first, if the exchange between buyers and suppliers involves investments in relationship-
specific assets (RSIs), it becomes more costly to find alternative trade partners. Second,
if the counterparty operates in a concentrated industry, there are fewer substitute trade
partners available.
Sunk investments in specific assets increase the costs associated with finding a re-
placement partner and thus increase the exposure of the investing party to the perfor-
mance of its counterparty. For example, Samsung Electronics is the primary provider of
electronic chips for Apple’s iPads and iPhones. The large volume of Apple ARM chip or-
ders required that Samsung dramatically increase their investment in chip manufacturing
plants. The investments related to Apple-specific chip manufacturing increase Samsung’s
exposure to Apple’s performance.
To capture RSIs, we determine the capital requirements, if any, from the supply con-
tract. The contract provides information about capital requirements including property,
plant, and machinery additions or improvements required to fill orders. The contract also
provides information on which party to the contract funds these investments; therefore,
we classify RSIs as customer-specific or supplier-specific. We predict that a customer-
26

specific RSI will increase the customer’s exposure to their supplier’s risk, and a supplier-
specific RSI will increase the supplier’s exposure to their customer’s risk.
We test for the impact of RSIs by estimating the following model:
rxt = α0 + α11Investment + ∑i(βi0FFit + βi1FFit × 1Investment) + εt, (5.5)
where 1Investment is an indicator variable equal to one if the firm invested in a contractually
specified RSI. If equity market participants perceive RSIs as increasing redeployability
risk, then α1 should be positive.
Table 11 reports the returns for the upstream momentum (Panel A) and downstream
momentum (Panel B) strategies, controlling for whether the contract includes relationship-
specific investment. Consistent with predictions, we find a positive coefficient on the
investment indicator. In particular, the Fama and French (1993) abnormal return to the
upstream momentum strategy when the supplier does not invest in relationship-specific
assets is -6.7% per quarter, which increases by 7.63% when the supplier does invest. That
is, nearly all of the return to the unconditional upstream momentum strategy is earned
from contracts in which the supplier is exposed to redeployability risk. The economic
magnitude and the statistical significance of this result is little changed when we aug-
ment the factor model with the Carhart (1997) momentum factor, the Pastor and Stam-
baugh (2003) liquidity factor, and supplier fixed effects: the abnormal return is -5.75%
when the supplier does not invest and increases by 7.2% when the supplier does invest.
Panel B shows that the results for the downstream momentum strategy are qualitatively
similar, although the point estimates of the coefficients are not statistically significant. The
Fama and French (1993) abnormal return to the downstream momentum strategy when
the customer does not invest in RSIs is -2.3% per quarter, which increases by 6.86% when
the supplier does invest.
Next, we develop a measure of the costliness of switching to an alternative trade part-
27

ner based on the concentration index of the counterparty’s industry. This measure cap-
tures the potential for the firm to find a replacement trade partner. For example, if the firm
sells to customers in a concentrated industry, we predict that the firm is more exposed to
counterparty risk since there are fewer opportunities to find alternative customers. This
measure, however, is not unambiguous; a firm operating in a concentrated industry may
be more resilient to shocks if, by exercising oligopolistic power, it can pass along losses to
its end customers rather than to its trading partners.
In Table 12, we test for the impact of contracting with a counterparty in a concentrated
industry by estimating the following model:
rxt = α0 + α11High HHI + ∑i
(βi0FFit + βi1FFit × 1High HHI
)+ εt, (5.6)
where 1High HHI equals one if the counterparty belongs to an industry in the upper 50th
percentile of the distribution of industry-level Herfindahl indexes within a given month,
and zero otherwise. If contracting with a firm in a high concentration industry leads to
redeployability concerns, α1 and α0 + α1 should be positive. Panel A of Table 12 shows
that contracting with a customer in a highly concentrated industry lowers the five fac-
tor abnormal return to the upstream momentum strategy by 5.61%, consistent with the
notion that customers with more market power can choose to impose losses on their cus-
tomers instead of their suppliers. This effect is both economically and statistically sig-
nificant; the five factor alpha on the upstream momentum strategy for firms contracting
with customers in non concentrated industries is 5.82% per quarter. The results in Panel
B show that firms contracting with suppliers in concentrated industries do not generate
statistically different return predictability than those that contract with suppliers in non
concentrated industries.
Overall, we provide some evidence that redeployability risk impacts the firm’s expo-
sure to its supply chain partners. The primary channel through which redeployability
28

risk impacts returns is investments in RSIs.8
6 Robustness Tests
6.1 Non-overlapping returns
Table 13 reports the five factor abnormal returns including fixed effects on the long-short
momentum strategies computed using non-overlapping observations of returns. More
specifically, at the beginning of each quarter t, we rank stocks in ascending order based
on the customer’s (supplier’s) returns over quarter t − 1 and assign them to one of five
quintile portfolios. All stocks are value-weighted within a given portfolio, and the port-
folios are rebalanced every calendar quarter to maintain value weights.
Panel A of Table 13 shows that the unconditional upstream momentum strategy still
generates positive abnormal returns when non-overlapping returns are used. Consistent
with the results for the sample of overlapping returns, the presence of financial covenants
lowers the quarterly return by 4.2%, which is both economically and statistically signif-
icant. The other contractual features do not retain the significance of the corresponding
coefficients, although the point estimates remain largely unchanged. Thus, for example,
deferred payments to the suppliers earn a positive risk premium, and contracting with
customers in a highly concentrated industry earns a negative risk premium.
In Panel B of Table 13, we see that the five factor abnormal return on the downstream
momentum strategy is larger than in the overlapping sample specification, with abnormal
returns of around 1.6% per quarter for the unconditional strategy. For contracts in which
the customer extends a loan to the supplier, the abnormal return increases by 7.05% per
quarter, which is both economically and statistically significant. Likewise, product war-
ranties decrease the transmission of shocks from suppliers to customers, with an abnor-
8In unreported analyses, we include other measures of exposure to redeployability risk including theRauch (1999) product differentiation and input differentiation indices. We do not find that inclusion ofthese indices has a significant impact on the firm’s abnormal returns.
29

mal return on the long-short strategy that is 5.8% lower for contracts with product war-
ranties in place. Overall, these results suggest that contracting features mitigate shock
transmission between counterparties even if we measure the transmission channel using
non-overlapping returns.
6.2 Falsification test
In order to rule out the possibility that return predictability is a function of linked cash
flows absent contractual relationships, we test whether the predictability of returns is
present before the two counterparties enter into a contract. At the beginning of each cal-
endar month t, we rank stocks in ascending order based on the returns over months t − 4
to t − 1 of their future customers (suppliers) and assign them to one of five quintile port-
folios. All stocks are value-weighted within a given portfolio, and the portfolios are rebal-
anced every month to maintain value weights. We construct the downstream (upstream)
momentum strategy as the zero-cost portfolio that holds the top 20% of high-customer
(supplier)-return stocks and sells short the bottom 20% of low-customer (supplier)-return
stocks. Table 14 reports the five factor abnormal returns to this long-short strategy.
Panel A shows that, as predicted, the upstream momentum strategy fails to yield sig-
nificant returns before the two parties enter into a contract. More importantly, character-
istics of the future contract do not produce a significant spread in returns. Similarly, Panel
B shows that the downstream momentum strategy does not generate significant returns
before the two parties enter into a contract and that characteristics of the future contract
do not produce a significant spread in returns.
7 Conclusion
This paper provides evidence that the design of supply contracts can mitigate the expo-
sure of parties to the contract to their counterparties’ risk events. Comparing contractual
30

to non contractual links, we find that shocks are transmitted only through contractual
links, consistent with contracts creating large legal obligations between the two parties.
The unique feature of our setting is that we observe detailed contractual features of the
links between customers and suppliers, allowing us to disentangle the specific channels
of shock transmission. We provide evidence that financial covenants and product war-
ranties mitigate shock transmission, while trade credit and RSIs exacerbate the transmission
of shocks. Finally, we show that equity markets efficiently incorporate the information
about contractual features when it becomes publicly available.
More broadly, while the prior literature has documented the beneficial aspects of close
product market relationships, we show that there are also costs associated with long-
term relationships. Indeed, Bodnar, Giambona, Graham, Harvey, and Marston (2011) find
that 38% of risk managers cite long-term contracts with customers as the most significant
form of credit risk faced, and 23% cite long-term contracts with suppliers. We provide
evidence that managers can design contracts to mitigate these risks and are rewarded for
well designed contracts by equity market participants.
31

References
AGHION, P. AND P. BOLTON (1992): “An incomplete contracts approach to financial con-tracting,” The Review of Economic Studies, 59, 473–494.
ALLEN, J. W. AND G. M. PHILLIPS (2000): “Corporate equity ownership, strategic al-liances, and product market relationships,” The Journal of Finance, 55, 2791–2815.
BIAIS, B. AND C. GOLLIER (1997): “Trade credit and credit rationing,” Review of FinancialStudies, 10, 903–937.
BODNAR, G., E. GIAMBONA, J. GRAHAM, C. HARVEY, AND R. MARSTON (2011): “Man-aging Risk Management,” Working paper.
BOONE, A. L. AND V. I. IVANOV (2012): “Bankruptcy spillover effects on strategic alliancepartners,” Journal of Financial Economics, 103, 551–569.
CARHART, M. M. (1997): “On persistence in mutual fund performance,” Journal of Fi-nance, 52, 57–82.
CHAN, S. H., J. W. KENSINGER, A. J. KEOWN, AND J. D. MARTIN (1997): “Do strategicalliances create value?” Journal of Financial Economics, 46, 199–221.
COHEN, L. AND A. FRAZZINI (2008): “Economic Links and Predictable Returns,” Journalof Finance, 63, 1977–2011.
COOPER, R. AND T. W. ROSS (1985): “Product warranties and double moral hazard,” TheRAND Journal of Economics, 103–113.
COSTELLO, A. M. (2013): “Mitigating incentive conflicts in inter-firm relationships: Evi-dence from long-term supply contracts,” Journal of Accounting and Economics, 56, 19–39.
——— (2014): “Trade Credit Policy in Long-Term Supply Contracts,” Working paper,SSRN Abstract No. 2379118.
FAMA, E. F. AND K. R. FRENCH (1993): “Common risk factors in the returns on stocksand bonds,” Journal of Financial Economics, 33, 3–56.
HENDRICKS, K. B. AND V. R. SINGHAL (2003): “The effect of supply chain glitches onshareholder wealth,” Journal of Operations Management, 21, 501–522.
HERTZEL, M. G., Z. LI, M. S. OFFICER, AND K. J. RODGERS (2008): “Inter-firm linkagesand the wealth effects of financial distress along the supply chain,” Journal of FinancialEconomics, 87, 374–387.
HORTAÇSU, A., G. MATVOS, C. SYVERSON, AND S. VENKATARAMAN (2013): “IndirectCosts of Financial Distress in Durable Goods Industries: The Case of Auto Manufactur-ers,” Review of Financial Studies, 26, 1248–1290.
32

JENSEN, M. C. AND W. H. MECKLING (1976): “Theory of the firm: Managerial behavior,agency costs and ownership structure,” Journal of Financial Economics, 3, 305–360.
JORION, P. AND G. ZHANG (2009): “Credit Contagion from Counterparty Risk,” The Jour-nal of Finance, 64, 2053–2087.
KAMBHU, J. (1982): “Optimal product quality under asymmetric information and moralhazard,” The Bell Journal of Economics, 483–492.
MAKSIMOVIC, V. AND S. TITMAN (1991): “Financial Policy and Reputation for ProductQuality,” Review of Financial Studies, 4, 175–200.
MENZLY, L. AND O. OZBAS (2010): “Market Segmentation and Cross-predictability ofReturns,” The Journal of Finance, 65, 1555–1580.
PASTOR, L. AND R. F. STAMBAUGH (2003): “Liquidity Risk and Expected Stock Returns,”Journal of Political Economy, 111.
PETERSEN, M. A. AND R. G. RAJAN (1997): “Trade Credit: Theories and Evidence,” Re-view of Financial Studies, 10, 661–691.
RAUCH, J. E. (1999): “Networks versus markets in international trade,” Journal of Interna-tional Economics, 48, 7–35.
SHAHRUR, H., Y. L. BECKER, AND D. ROSENFELD (2009): “Return predictability alongthe supply chain: the international evidence,” Working paper, Bentley University andState Street Global Advisors.
SPENCE, M. (1977): “Consumer Misperceptions, Product Failure and Producer Liability,”Review of Economic Studies, 44.
TITMAN, S. (1984): “The effect of capital structure on a firm’s liquidation decision,” Jour-nal of Financial Economics, 13, 137–151.
33

Table 1: Summary Statistics. Summary statistics for contracts where both counterparties have commonlytraded equity. “Speculative-grade” refers to firms rated below BBB- by S&P. Source: SEC filings, CRSP,Mergent.
Min Max Mean SD Median
Panel A: Time Series (22 annual observations, 1993 – 2014)
Number of contracts in the sample per year 14 233 163.2 63.7 186.0Number of unique customers per year 7 131 89.6 36.0 103.5Number of unique suppliers per year 7 134 91.6 37.7 106Supplier % coverage (EW) 0.1 1.7 1.1 0.5 1.3Customer % coverage (EW) 0.1 1.8 1.2 0.5 1.3Supplier % coverage (VW) 0.2 13.6 6.8 3.4 7.8Customer % coverage (VW) 0.2 13.4 6.8 3.1 7.4
Panel B: Firms (Pooled Firm-Year Observations)
Supplier size percentile 1 100 61.7 30.3 68Customer size percentile 1 100 63.6 29.5 70Supplier book-to-market percentile 2 100 41.0 26.8 36Customer book-to-market percentile 1 100 40.1 26.8 34
Panel C: Contracts Time Series (22 annual observations, 1993 – 2014)
% of contracts with financial covenants 23.5 44.4 37.6 6.6 39.7% of contracts with loans 1.1 5.1 2.6 1.3 2.3% of contracts with payment deferred 52.3 100.0 67.3 11.7 63.2% of contracts with speculative-grade customers 75.7 90.6 84.2 3.6 85.2% of contracts with speculative-grade suppliers 63.9 85.7 77.1 4.3 77.1% of contracts with both speculative grade 44.4 71.4 62.9 6.2 64.1% of contracts with product warranty 28.6 68.9 54.3 9.2 53.7% of contracts with customer investing 0.7 4.0 2.5 0.9 2.5% of contracts with supplier investing 14.3 52.8 28.2 9.6 27.3
34

Tabl
e2:
Dif
fere
nces
inD
eter
min
ants
ofC
ontr
actu
alFe
atur
esEx
acer
bati
ngC
ount
erpa
rty
Ris
k.C
oun-
terp
arty
char
acte
rist
ics,
prod
uct
mar
ket
char
acte
rist
ics,
and
mac
roec
onom
icco
ndit
ions
for
cont
ract
sth
atin
clud
e(c
olum
n2)
and
dono
tin
clud
e(c
olum
n1)
trad
ecr
edit
,in
clud
e(c
olum
n5)
and
dono
tin
clud
e(c
olum
n4)
loan
sto
the
supp
lier,
incl
ude
(col
umn
8)an
ddo
not
incl
ude
(col
umn
7)re
lati
onsh
ip-s
peci
ficin
vest
men
t,ar
ew
ith
asp
ecul
ativ
e-gr
ade
(col
umns
11an
d14
)or
inve
stm
ent-
grad
eco
unte
rpar
ty(c
olum
ns10
and
13).
Col
umns
3,6,
9,12
,and
15re
port
ifth
edi
ffer
ence
sar
esi
gnifi
cant
,wit
h**
*si
gnifi
cant
at1%
,**
sign
ifica
ntat
5%,*
sign
ifica
ntat
10%
.Tr
ade
Cre
dit
Loan
Inve
stm
ent
Buye
rSp
ec.G
rade
Supp
lier
Spec
.Gra
de=
0=
1D
iff.
=0
=1
Diff
.=
0=
1D
iff.
=0
=1
Diff
.=
0=
1D
iff.
Buy
erC
hara
cter
isti
cs
Size
5.54
35.
818
∗∗5.
619
5.96
65.
535
6.12
4∗∗
∗6.
022
5.59
3∗∗
Age
14.4
4513
.709
14.1
9514
.818
13.6
9216
.997
∗∗∗
17.0
9213
.954
∗∗
Profi
t.-0
.136
-0.1
43-0
.137
-0.1
66-0
.140
-0.1
34-0
.092
-0.1
42M
/B3.
184
4.13
0∗
3.42
66.
065
∗∗3.
343
4.39
8∗
2.60
53.
593
Leve
rage
0.18
70.
171
0.18
30.
143
0.18
30.
179
0.22
10.
178
∗∗
Supp
lier
Cha
ract
eris
tics
Size
5.77
96.
180
∗∗∗
5.86
66.
021
6.04
05.
890
Age
16.1
0616
.294
15.9
8517
.957
∗19
.802
15.7
94∗∗
∗
Profi
t-0
.137
-0.0
78∗∗
-0.1
28-0
.076
0.00
4-0
.131
∗∗∗
M/B
3.29
04.
105
3.58
53.
335
4.31
33.
472
Leve
rage
0.18
30.
187
0.18
40.
191
0.19
00.
183
Prod
uctM
arke
tCha
ract
eris
tics
Buye
r/Su
pplie
rSi
ze2.
525
1.11
32.
104
1.71
71.
878
3.10
72.
158
2.07
60.
662
2.47
6Bu
yer/
Supp
lier
Mkt
.Pow
er10
36.5
2415
4.55
578
6.92
614
0.34
986
6.32
729
0.05
710
12.9
1670
8.50
427
.747
966.
043
Supp
lier
HH
I0.
174
0.17
80.
176
0.16
60.
172
0.19
1∗
0.19
20.
174
0.16
70.
177
Buye
rH
HI
0.16
20.
167
0.16
40.
148
0.16
60.
153
0.18
00.
162
∗∗0.
160
0.16
4
Mac
roec
onom
icC
ondi
tion
s
Baa-
Trea
s.2.
315
2.38
8∗∗
∗2.
338
2.34
62.
309
2.54
1∗∗
∗2.
418
2.33
22.
294
2.34
1G
DP
grow
th4.
934
4.84
34.
910
4.70
34.
975
4.48
3∗∗
∗4.
672
4.92
1∗
4.94
44.
902
Obs
erva
tion
s42
5242
5241
9942
5342
53
35
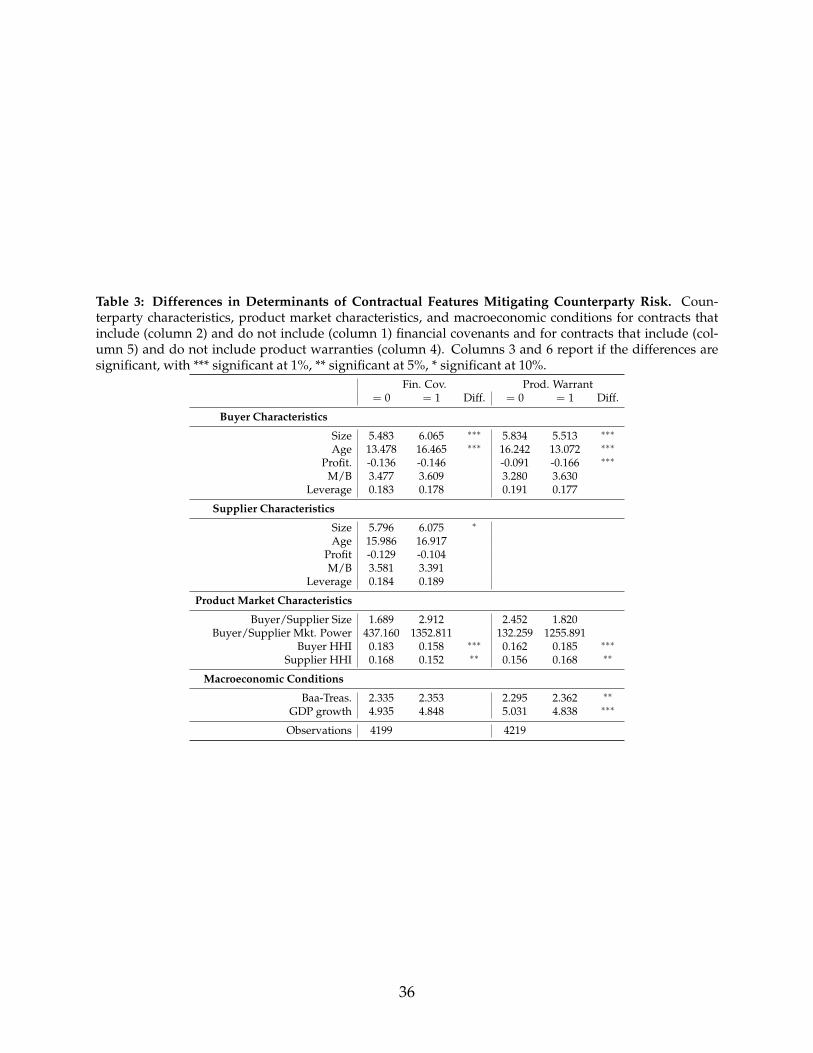
Table 3: Differences in Determinants of Contractual Features Mitigating Counterparty Risk. Coun-terparty characteristics, product market characteristics, and macroeconomic conditions for contracts thatinclude (column 2) and do not include (column 1) financial covenants and for contracts that include (col-umn 5) and do not include product warranties (column 4). Columns 3 and 6 report if the differences aresignificant, with *** significant at 1%, ** significant at 5%, * significant at 10%.
Fin. Cov. Prod. Warrant= 0 = 1 Diff. = 0 = 1 Diff.
Buyer Characteristics
Size 5.483 6.065 ∗∗∗ 5.834 5.513 ∗∗∗
Age 13.478 16.465 ∗∗∗ 16.242 13.072 ∗∗∗
Profit. -0.136 -0.146 -0.091 -0.166 ∗∗∗
M/B 3.477 3.609 3.280 3.630Leverage 0.183 0.178 0.191 0.177
Supplier Characteristics
Size 5.796 6.075 ∗
Age 15.986 16.917Profit -0.129 -0.104M/B 3.581 3.391
Leverage 0.184 0.189
Product Market Characteristics
Buyer/Supplier Size 1.689 2.912 2.452 1.820Buyer/Supplier Mkt. Power 437.160 1352.811 132.259 1255.891
Buyer HHI 0.183 0.158 ∗∗∗ 0.162 0.185 ∗∗∗
Supplier HHI 0.168 0.152 ∗∗ 0.156 0.168 ∗∗
Macroeconomic Conditions
Baa-Treas. 2.335 2.353 2.295 2.362 ∗∗
GDP growth 4.935 4.848 5.031 4.838 ∗∗∗
Observations 4199 4219
36

Table 4: Contract Announcement Date Abnormal Returns. Five day cumulative abnormal returns aroundcontract filing dates and the date of the first press release mentioning the contract. Abnormal returns arecalculated relative to the market portfolio, using (−2, 2) day event window. “× Fin. Covenant” is theindicator of financial covenants in the contract, “× Payment Deferred” is the indicator of payment deferredpast delivery date, “× Speculative Grade” is the indicator of a speculative-grade customer (supplier) forthe supplier (customer) panel; “× Product Warranty” is the indicator of product warranties in the contract;“× Investment” is the indicator of relationship-specific investment by the supplier; “× Conc. Industry” isthe indicator of the customer (supplier) being in a concentrated industry. Regressions include industry (4digit SIC code) fixed effects. Clustered (by year) standard errors shown in brackets. *** significant at 1%, **significant at 5%, * significant at 10%.
Panel A: SuppliersContract Filing Press Release
1 2 3 4 5 6
Abn. Ret. 0.015 1.826 1.171 0.253 0.933 1.409[0.302] [1.140] [0.810] [0.862] [2.948] [15.549]
× Fin. Covenant 0.022 0.140 -0.788 -0.337[0.511] [0.473] [1.376] [0.603]
× Loan Extended -2.267 -2.212 7.051[1.128]∗ [1.114]∗ [4.374]
× Payment Advanced -0.882 -0.173 2.848 -0.869[0.752] [0.521] [2.626] [4.199]
× Speculative Grade -0.767 -1.134[0.722] [0.666]
× Product Warranty -0.639 0.054 -4.581 -6.803[0.899] [0.416] [3.468] [8.840]
× Investment -0.343 -0.194 -0.950 -4.403[0.931] [0.935] [2.627] [4.936]
× EBITDA/AT 0.185 -16.939[1.152] [7.564]∗
× Sales/AT -0.099 4.049[0.811] [14.073]
Observations 1173 1161 1154 70 70 36
Panel B: CustomersContract Filing Press Release
1 2 3 4 5 6
Abn. Ret. 0.585 0.530 0.186 2.110 4.637 4.104[0.281]∗ [1.222] [1.524] [0.621]∗∗∗ [4.198] [7.027]
× Fin. Covenant 1.332 1.406 0.077 0.305[0.820] [0.805]∗ [1.435] [2.342]
× Loan Extended -0.095 -0.125 1.033 4.227[1.874] [1.888] [3.427] [4.381]
× Payment Deferred -0.567 -0.496 -0.133 0.277[0.440] [0.448] [1.077] [1.630]
× Speculative Grade 0.261 0.351 -1.956 2.883[1.351] [1.319] [4.483] [4.015]
× Product Warranty -0.305 -0.394 -0.922 0.020[0.563] [0.649] [1.357] [2.615]
× Investment -0.852 -0.894 -1.694 0.006[0.852] [0.837] [1.780] [3.654]
× EBITDA/AT -0.191 -0.706[1.300] [1.266]
× Sales/AT 0.386 -9.473[0.683] [9.631]
Observations 1351 1343 1335 64 64 47
37

Table 5: Momentum Strategy, Abnormal Returns 1994–2013. Calendar-time portfolio abnormal returns.At the beginning of every calendar month, stocks are ranked in ascending order on the basis of the return ofa portfolio of its publicly traded customers (suppliers) over the preceding three months. The ranked stocksare assigned to one of five quintile portfolios. All stocks are value weighted within a given portfolio, andthe portfolios are rebalanced every calendar month to maintain value weights. Upstream (downstream)momentum refers to the impact of news about customers (suppliers) on the return of the supplier (cus-tomer). Alpha is the intercept on a regression of the quarterly excess returns from the rolling strategy thatholds the top 20% of high customer (supplier) return stocks and sells short the bottom 20% of low customer(supplier) return stocks. The explanatory variables are the quarterly returns from Fama and French (1993)mimicking portfolios, Carhart (1997) momentum factor, the Pastor and Stambaugh (2003) traded liquid-ity factor, and supplier (customer) fixed effects. Returns and alphas are in quarterly units. Newey-Weststandard errors (3 lags) in brackets. *** significant at 1%, ** significant at 5%, * significant at 10%.
Panel A: Upstream Momentum
Excess Ret. 3 Factor Alpha 4 Factor Alpha 5 Factor Alpha 5 Factor Alpha
High-Low Customer Return 0.744 1.838 1.807 1.879 1.951[0.985] [0.879]∗∗ [0.865]∗∗ [0.878]∗∗ [0.883]∗∗
Supp. FE No No No No Yes
Adj. R2 0.001 0.186 0.188 0.188 0.239N. obs 13948 13948 13948 13895 13895
Panel B: Downstream MomentumExcess Ret. 3 Factor Alpha 4 Factor Alpha 5 Factor Alpha 5 Factor Alpha
High-Low Supplier Return 0.395 0.206 0.592 1.190 1.556[0.972] [0.784] [0.792] [0.872] [0.940]∗
Cust. FE No No No No Yes
Adj. R2 0.001 0.224 0.226 0.226 0.273N. obs 14232 14232 14232 14173 14173
38

Table 6: Momentum Strategy and Contractual Relationship, Abnormal Returns 1994–2013. Calendar-time portfolio abnormal returns. At the beginning of every calendar month, stocks are ranked in ascendingorder on the basis of the return of a portfolio of its publicly traded customers (suppliers) over the preced-ing three months. The ranked stocks are assigned to one of five quintile portfolios. All stocks are valueweighted within a given portfolio, and the portfolios are rebalanced every calendar month to maintainvalue weights. Upstream (downstream) momentum refers to the impact of news about customers (suppli-ers) on the return of the supplier (customer). Alpha is the intercept on a regression of the quarterly excessreturns from the rolling strategy that holds the top 20% of high customer (supplier) return stocks and sellsshort the bottom 20% of low customer (supplier) return stocks. “× Contract” is the coefficient on the indi-cator variable of a contractual relationship between the customer and supplier. The explanatory variablesare the quarterly returns from Fama and French (1993) mimicking portfolios, Carhart (1997) momentumfactor, the Pastor and Stambaugh (2003) traded liquidity factor, and supplier (customer) fixed effects. Re-turns and alphas are in quarterly units. Newey-West standard errors (3 lags) in brackets. *** significant at1%, ** significant at 5%, * significant at 10%.
Panel A: Upstream Momentum
Excess Ret. 3 Factor Alpha 4 Factor Alpha 5 Factor Alpha 5 Factor Alpha
High-Low Customer Return -0.080 -0.062 -0.064 -0.063 -0.159[0.029]∗∗∗ [0.024]∗∗∗ [0.024]∗∗∗ [0.023]∗∗∗ [0.080]∗∗
× Contract 0.824 2.111 2.031 2.051 2.098[0.985] [0.884]∗∗ [0.880]∗∗ [0.868]∗∗ [0.842]∗∗
Supp. FE No No No No Yes
Adj. R2 0.013 0.188 0.190 0.197 0.227N. obs 161622 161622 161622 161569 161569
Panel B: Downstream MomentumExcess Ret. 3 Factor Alpha 4 Factor Alpha 5 Factor Alpha 5 Factor Alpha
High-Low Supplier Return -0.051 -0.254 -0.087 0.157 0.175[0.015]∗∗∗ [0.111]∗∗ [0.153] [0.174] [0.177]
× Contract 0.493 0.881 0.847 0.833 1.037[0.978] [0.786] [0.788] [0.789] [0.789]
Cust. FE No No No No Yes
Adj. R2 0.061 0.264 0.264 0.268 0.292N. obs 98991 98991 98991 98932 98932
39
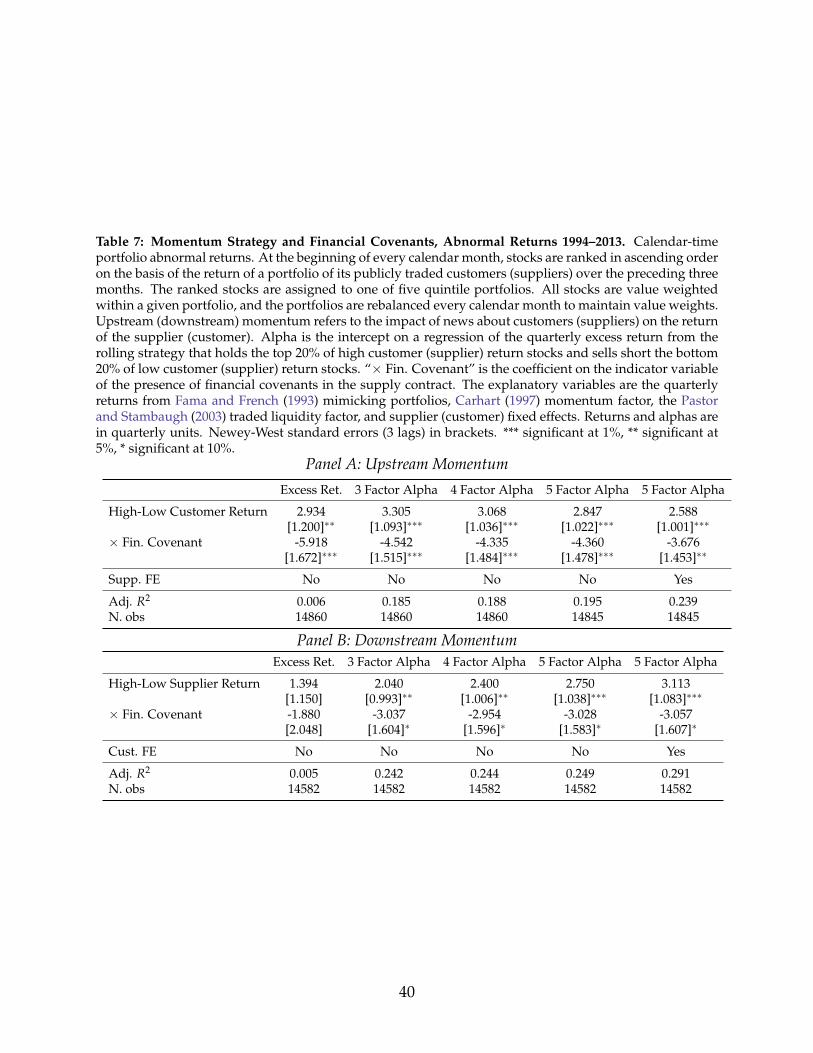
Table 7: Momentum Strategy and Financial Covenants, Abnormal Returns 1994–2013. Calendar-timeportfolio abnormal returns. At the beginning of every calendar month, stocks are ranked in ascending orderon the basis of the return of a portfolio of its publicly traded customers (suppliers) over the preceding threemonths. The ranked stocks are assigned to one of five quintile portfolios. All stocks are value weightedwithin a given portfolio, and the portfolios are rebalanced every calendar month to maintain value weights.Upstream (downstream) momentum refers to the impact of news about customers (suppliers) on the returnof the supplier (customer). Alpha is the intercept on a regression of the quarterly excess return from therolling strategy that holds the top 20% of high customer (supplier) return stocks and sells short the bottom20% of low customer (supplier) return stocks. “× Fin. Covenant” is the coefficient on the indicator variableof the presence of financial covenants in the supply contract. The explanatory variables are the quarterlyreturns from Fama and French (1993) mimicking portfolios, Carhart (1997) momentum factor, the Pastorand Stambaugh (2003) traded liquidity factor, and supplier (customer) fixed effects. Returns and alphas arein quarterly units. Newey-West standard errors (3 lags) in brackets. *** significant at 1%, ** significant at5%, * significant at 10%.
Panel A: Upstream Momentum
Excess Ret. 3 Factor Alpha 4 Factor Alpha 5 Factor Alpha 5 Factor Alpha
High-Low Customer Return 2.934 3.305 3.068 2.847 2.588[1.200]∗∗ [1.093]∗∗∗ [1.036]∗∗∗ [1.022]∗∗∗ [1.001]∗∗∗
× Fin. Covenant -5.918 -4.542 -4.335 -4.360 -3.676[1.672]∗∗∗ [1.515]∗∗∗ [1.484]∗∗∗ [1.478]∗∗∗ [1.453]∗∗
Supp. FE No No No No Yes
Adj. R2 0.006 0.185 0.188 0.195 0.239N. obs 14860 14860 14860 14845 14845
Panel B: Downstream MomentumExcess Ret. 3 Factor Alpha 4 Factor Alpha 5 Factor Alpha 5 Factor Alpha
High-Low Supplier Return 1.394 2.040 2.400 2.750 3.113[1.150] [0.993]∗∗ [1.006]∗∗ [1.038]∗∗∗ [1.083]∗∗∗
× Fin. Covenant -1.880 -3.037 -2.954 -3.028 -3.057[2.048] [1.604]∗ [1.596]∗ [1.583]∗ [1.607]∗
Cust. FE No No No No Yes
Adj. R2 0.005 0.242 0.244 0.249 0.291N. obs 14582 14582 14582 14582 14582
40

Table 8: Momentum Strategy and Trade Credit, Abnormal Returns 1994–2013. Calendar-time portfolioabnormal returns. At the beginning of every calendar month, stocks are ranked in ascending order onthe basis of the return of a portfolio of its publicly traded customers (suppliers) over the preceding threemonths. The ranked stocks are assigned to one of five quintile portfolios. All stocks are value weightedwithin a given portfolio, and the portfolios are rebalanced every calendar month to maintain value weights.Upstream (downstream) momentum refers to the impact of news about customers (suppliers) on the returnof the supplier (customer). Alpha is the intercept on a regression of the quarterly excess return from therolling strategy that holds the top 20% of high customer (supplier) return stocks and sells short the bottom20% of low customer (supplier) return stocks. “× Payment Deferred (Advanced)” is the coefficient onthe indicator variable of contractually-specified deferment (advance) of payment by the customer to thesupplier on delivery; “× Loan Extended” is the coefficient on the indicator variable of a contractually-specified loan from the customer to the supplier. The explanatory variables are the quarterly returns fromFama and French (1993) mimicking portfolios, Carhart (1997) momentum factor, the Pastor and Stambaugh(2003) traded liquidity factor, and supplier (customer) fixed effects. Returns and alphas are in quarterlyunits. Newey-West standard errors (3 lags) in brackets. *** significant at 1%, ** significant at 5%, * significantat 10%.
Panel A: Upstream Momentum
Excess Ret. 3 Factor Alpha 4 Factor Alpha 5 Factor Alpha 5 Factor Alpha
High-Low Customer Return 0.929 2.106 2.049 2.126 1.659[1.625] [1.336] [1.316] [1.316] [1.271]
× Payment Deferred -0.312 -1.488 -1.512 -1.268 -0.663[1.920] [1.559] [1.589] [1.554] [1.553]
Supp. FE No No No No Yes
Adj. R2 0.003 0.182 0.188 0.196 0.237N. obs 14425 14425 14425 14391 14391
Panel B: Downstream MomentumExcess Ret. 3 Factor Alpha 4 Factor Alpha 5 Factor Alpha 5 Factor Alpha
High-Low Supplier Return -0.374 -0.046 0.012 0.490 1.072[1.270] [0.982] [1.014] [1.097] [1.136]
× Payment Advanced 1.022 1.202 1.156 1.021 0.379[1.966] [1.610] [1.602] [1.586] [1.651]
Cust. FE No No No No Yes
Adj. R2 0.008 0.245 0.248 0.252 0.287N. obs 14113 14113 14113 14113 14113
Panel C: Downstream MomentumExcess Ret. 3 Factor Alpha 4 Factor Alpha 5 Factor Alpha 5 Factor Alpha
High-Low Supplier Return 0.445 0.173 0.294 0.541 0.399[0.675] [0.566] [0.576] [0.606] [0.625]
× Loan Extended -1.977 7.629 10.381 11.391 10.928[6.881] [3.699]∗∗ [3.980]∗∗∗ [4.125]∗∗∗ [3.743]∗∗∗
Cust. FE No No No No Yes
Adj. R2 0.000 0.221 0.222 0.225 0.265N. obs 13905 13905 13905 13846 13846
41

Table 9: Momentum Strategy and Credit Risk, Abnormal Returns 1994–2013. Calendar-time portfolioabnormal returns. At the beginning of every calendar month, stocks are ranked in ascending order onthe basis of the return of a portfolio of its publicly traded customers (suppliers) over the preceding threemonths. The ranked stocks are assigned to one of five quintile portfolios. All stocks are value weightedwithin a given portfolio, and the portfolios are rebalanced every calendar month to maintain value weights.Upstream (downstream) momentum refers to the impact of news about customers (suppliers) on the returnof the supplier (customer). Alpha is the intercept on a regression of the quarterly excess return from therolling strategy that holds the top 20% of high customer (supplier) return stocks and sells short the bottom20% of low customer (supplier) return stocks. For the upstream (downstream) momentum portfolio,“×Speculative Grade” is the coefficient on the indicator variable that the customer (supplier) has a speculativegrade (below BBB-) rating. The explanatory variables are the quarterly returns from Fama and French(1993) mimicking portfolios, Carhart (1997) momentum factor, the Pastor and Stambaugh (2003) tradedliquidity factor, and supplier (customer) fixed effects. Returns and alphas are in quarterly units. Newey-West standard errors (3 lags) in brackets. *** significant at 1%, ** significant at 5%, * significant at 10%.
Panel A: Upstream Momentum
Excess Ret. 3 Factor Alpha 4 Factor Alpha 5 Factor Alpha 5 Factor Alpha
High-Low Customer Return -1.519 3.047 4.601 4.490 2.536[4.766] [2.960] [2.668]∗ [2.672]∗ [2.692]
× Speculative Grade 2.631 -0.684 -2.536 -2.337 -0.516[4.873] [3.116] [2.804] [2.792] [2.829]
Supp. FE No No No No Yes
Adj. R2 0.002 0.195 0.199 0.206 0.248N. obs 12543 12543 12543 12504 12504
Panel B: Downstream MomentumExcess Ret. 3 Factor Alpha 4 Factor Alpha 5 Factor Alpha 5 Factor Alpha
High-Low Supplier Return 5.298 3.593 2.431 3.833 2.949[3.976] [3.618] [3.507] [3.121] [2.914]
× Speculative Grade -5.590 -2.988 -1.679 -2.179 -0.927[4.123] [3.740] [3.613] [3.207] [3.074]
Cust. FE No No No No Yes
Adj. R2 0.004 0.250 0.251 0.258 0.295N. obs 12184 12184 12184 12143 12143
42

Table 10: Momentum Strategy and Product Warranties, Abnormal Returns 1994–2013. Calendar-timeportfolio abnormal returns. At the beginning of every calendar month, stocks are ranked in ascending orderon the basis of the return of a portfolio of its publicly traded customers (suppliers) over the preceding threemonths. The ranked stocks are assigned to one of five quintile portfolios. All stocks are value weightedwithin a given portfolio, and the portfolios are rebalanced every calendar month to maintain value weights.Upstream (downstream) momentum refers to the impact of news about customers (suppliers) on the returnof the supplier (customer). Alpha is the intercept on a regression of the quarterly excess return from therolling strategy that holds the top 20% of high customer (supplier) return stocks and sells short the bottom20% of low customer (supplier) return stocks. “× Product Warranty” is the coefficient on the indicatorvariable of the presence of a product warranty in the supply contract. The explanatory variables are thequarterly returns from Fama and French (1993) mimicking portfolios, Carhart (1997) momentum factor, thePastor and Stambaugh (2003) traded liquidity factor, and supplier (customer) fixed effects. Returns andalphas are in quarterly units. Newey-West standard errors (3 lags) in brackets. *** significant at 1%, **significant at 5%, * significant at 10%.
Panel A: Upstream Momentum
Excess Ret. 3 Factor Alpha 4 Factor Alpha 5 Factor Alpha 5 Factor Alpha
High-Low Customer Return 0.700 1.375 1.187 1.160 1.089[1.227] [1.100] [1.021] [1.001] [0.963]
× Product Warranty 0.794 1.110 1.390 1.727 1.677[1.748] [1.550] [1.508] [1.483] [1.477]
Supp. FE No No No No Yes
Adj. R2 0.004 0.178 0.187 0.193 0.238N. obs 14924 14924 14924 14894 14894
Panel B: Downstream MomentumExcess Ret. 3 Factor Alpha 4 Factor Alpha 5 Factor Alpha 5 Factor Alpha
High-Low Supplier Return 2.576 1.641 1.927 2.427 2.789[1.384]∗ [1.127] [1.121]∗ [1.143]∗∗ [1.169]∗∗
× Product Warranty -4.339 -2.168 -1.930 -2.299 -2.693[1.830]∗∗ [1.478] [1.464] [1.458] [1.487]∗
Cust. FE No No No No Yes
Adj. R2 0.007 0.221 0.222 0.230 0.268N. obs 14889 14889 14889 14889 14889
43

Table 11: Momentum Strategy and Relationship-Specific Investment, Abnormal Returns 1994–2013.Calendar-time portfolio abnormal returns. At the beginning of every calendar month, stocks are rankedin ascending order on the basis of the return of a portfolio of its publicly traded customers (suppliers) overthe preceding three months. The ranked stocks are assigned to one of five quintile portfolios. All stocksare value weighted within a given portfolio, and the portfolios are rebalanced every calendar month tomaintain value weights. Upstream (downstream) momentum refers to the impact of news about customers(suppliers) on the return of the supplier (customer). Alpha is the intercept on a regression of the quarterlyexcess return from the rolling strategy that holds the top 20% of high customer (supplier) return stocksand sells short the bottom 20% of low customer (supplier) return stocks. “× Investment” is the coefficienton the indicator variable of contractually-specified investment by the supplier (customer). The explana-tory variables are the quarterly returns from Fama and French (1993) mimicking portfolios, Carhart (1997)momentum factor, the Pastor and Stambaugh (2003) traded liquidity factor, and supplier (customer) fixedeffects. Returns and alphas are in quarterly units. Newey-West standard errors (3 lags) in brackets. ***significant at 1%, ** significant at 5%, * significant at 10%.
Panel A: Upstream Momentum
Excess Ret. 3 Factor Alpha 4 Factor Alpha 5 Factor Alpha 5 Factor Alpha
High-Low Supplier Return -4.683 -6.729 -6.465 -5.677 -5.748[2.360]∗∗ [2.714]∗∗ [2.807]∗∗ [2.846]∗∗ [2.851]∗∗
× Investment 5.487 7.633 7.449 7.149 7.202[2.628]∗∗ [2.884]∗∗∗ [2.932]∗∗ [2.953]∗∗ [2.948]∗∗
Cust. FE No No No No Yes
Adj. R2 0.003 0.201 0.202 0.218 0.280N. obs 5243 5243 5243 5213 5213
Panel B: Downstream MomentumExcess Ret. 3 Factor Alpha 4 Factor Alpha 5 Factor Alpha 5 Factor Alpha
High-Low Supplier Return -3.684 -2.324 -2.303 -2.297 -2.111[1.364]∗∗∗ [1.121]∗∗ [1.179]∗ [1.215]∗ [1.318]
× Investment 4.153 6.857 6.662 6.347 6.340[5.889] [4.846] [4.991] [4.696] [4.772]
Cust. FE No No No No Yes
Adj. R2 0.017 0.328 0.331 0.337 0.350N. obs 4753 4753 4753 4723 4723
44

Table 12: Momentum Strategy and Industry Concentration, Abnormal Returns 1994–2013.Calendar-timeportfolio abnormal returns. At the beginning of every calendar month, stocks are ranked in ascending orderon the basis of the return of a portfolio of its publicly traded customers (suppliers) over the preceding threemonths. The ranked stocks are assigned to one of four quantile portfolios. All stocks are value weightedwithin a given portfolio, and the portfolios are rebalanced every calendar month to maintain value weights.Upstream (downstream) momentum refers to the impact of news about customers (suppliers) on the returnof the supplier (customer). Alpha is the intercept on a regression of the quarterly excess return from therolling strategy that holds the top 20% of high customer (supplier) return stocks and sells short the bottom20% of low customer (supplier) return stocks. For the upstream (downstream) momentum portfolio, “×Conc. Industry” is the coefficient on the indicator variable of the customer (supplier) belonging to a highconcentration industry. The explanatory variables are the quarterly returns from Fama and French (1993)mimicking portfolios, Carhart (1997) momentum factor, the Pastor and Stambaugh (2003) traded liquid-ity factor, and supplier (customer) fixed effects. Returns and alphas are in quarterly units. Newey-Weststandard errors (3 lags) in brackets. *** significant at 1%, ** significant at 5%, * significant at 10%.
Panel A: Upstream Momentum
Excess Ret. 3 Factor Alpha 4 Factor Alpha 5 Factor Alpha 5 Factor Alpha
High-Low Customer Return 6.138 5.612 5.518 5.753 5.823[1.721]∗∗∗ [1.589]∗∗∗ [1.512]∗∗∗ [1.520]∗∗∗ [1.430]∗∗∗
× Conc. Industry -7.656 -5.430 -5.377 -5.268 -5.613[2.027]∗∗∗ [1.908]∗∗∗ [1.852]∗∗∗ [1.824]∗∗∗ [1.724]∗∗∗
Supp. FE No No No No Yes
Adj. R2 0.009 0.186 0.187 0.192 0.233N. obs 13970 13970 13970 13955 13955
Panel B: Downstream MomentumExcess Ret. 3 Factor Alpha 4 Factor Alpha 5 Factor Alpha 5 Factor Alpha
High-Low Supplier Return -0.829 -0.486 -0.301 0.202 0.274[1.462] [1.222] [1.225] [1.277] [1.270]
× Conc. Industry 1.947 1.342 1.457 1.163 1.079[1.940] [1.555] [1.545] [1.530] [1.529]
Cust. FE No No No No Yes
Adj. R2 0.002 0.248 0.250 0.256 0.293N. obs 13812 13812 13812 13812 13812
45

Table 13: Momentum Strategy, Non-overlapping Abnormal Returns. Calendar-time, non-overlappingsamples portfolio returns. At the beginning of every calendar quarter, stocks are ranked in ascending orderon the basis of the return of a portfolio of its publicly traded customers (suppliers) over the preceding quar-ter. The ranked stocks are assigned to one of five quintile portfolios. All stocks are value weighted withina given portfolio, and the portfolios are rebalanced every calendar month to maintain value weights. Up-stream (downstream) momentum refers to the impact of news about customers (suppliers) on the returnof the supplier (customer). Alpha is the intercept on a regression of the quarterly excess return from therolling zero-cost portfolio that holds the top 20% of high customer (supplier) return stocks and sells shortthe bottom 20% of low customer (supplier) return stocks. The explanatory variables are the quarterly re-turns from Fama and French (1993) mimicking portfolios, Carhart (1997) momentum factor, the Pastor andStambaugh (2003) traded liquidity factor, and supplier (customer) fixed effects. “× Fin. Covenant” is theindicator of financial covenants in the contract, “× Payment Deferred” is the indicator of payment deferredpast delivery date, “× Speculative Grade” is the indicator of a speculative grade customer (supplier) forthe upstream (downstream) panel; “× Product Warranty” is the indicator of product warranties in the con-tract. Alphas are in quarterly units. Newey-West standard errors (1 lag) in brackets. *** significant at 1%, **significant at 5%, * significant at 10%.
Panel A: Upstream Momentum
High-Low Customer Return 2.509 2.998 1.634 5.419 1.463 -1.034 6.987[1.359]∗ [1.472]∗∗ [2.011] [3.686] [1.386] [4.669] [1.969]∗∗∗
× Fin. Covenant -4.510[2.060]∗∗
× Payment Deferred 0.216[2.338]
× Speculative Grade -3.095[3.815]
× Product Warranty 1.841[2.195]
× Investment 4.281[4.837]
× Conc. Industry -6.724[2.345]∗∗∗
Adj. R2 0.257 0.264 0.237 0.249 0.256 0.288 0.257N. obs 4694 5171 5016 4416 5209 1800 4883
Panel B: Downstream MomentumHigh-Low Customer Return 2.774 3.009 2.486 0.741 -0.235 2.276 1.036 1.020
[1.577]∗ [1.701]∗ [1.518] [0.464] [2.809] [1.735] [1.879] [1.906]× Fin. Covenant -1.665
[2.438]× Payment Advanced -0.611
[2.379]× Loan Extended 20.094
[5.405]∗∗∗
× Speculative Grade 2.394[3.139]
× Product Warranty -0.044[2.293]
× Investment 14.817[6.381]∗∗
× Conc. Industry 0.217[2.457]
Adj. R2 0.244 0.272 0.250 0.223 0.286 0.252 0.369 0.268N. obs 4762 5281 5134 4733 4736 5292 1633 4919
46

Table 14: Momentum Strategy, Pre-Contract Abnormal Returns. Calendar-time portfolio returns. At thebeginning of every calendar month, stocks are ranked in ascending order on the basis of the return of aportfolio of its publicly traded customers (suppliers) over the preceding three months. The ranked stocksare assigned to one of five quintile portfolios. All stocks are value weighted within a given portfolio, andthe portfolios are rebalanced every calendar month to maintain value weights. Upstream (downstream)momentum refers to the impact of news about customers (suppliers) on the return of the supplier (cus-tomer). Alpha is the intercept on a regression of the quarterly excess return from the rolling zero-costportfolio that holds the top 20% of high customer (supplier) return stocks and sells short the bottom 20%of low customer (supplier) return stocks. The explanatory variables are the quarterly returns from Famaand French (1993) mimicking portfolios, Carhart (1997) momentum factor, the Pastor and Stambaugh (2003)traded liquidity factor, and supplier (customer) fixed effects. “× Fin. Covenant” is the indicator of financialcovenants in the future contract, “× Payment Deferred” is the indicator of payment deferred past deliverydate, “× Speculative Grade” is the indicator of a speculative-grade customer (supplier) for the upstream(downstream) panel; “× Product Warranty” is the indicator of product warranties in the contract. Alphasare in quarterly units. Newey-West standard errors (3 lags) in brackets. *** significant at 1%, ** significantat 5%, * significant at 10%.
Panel A: Upstream Momentum
High-Low Customer Return 0.008 -0.024 -0.009 -0.007 0.022 -0.046 -0.051[0.037] [0.037] [0.045] [0.081] [0.041] [0.038] [0.060]
× Fin. Covenant 0.045[0.055]
× Payment Deferred -0.007[0.055]
× Speculative Grade 0.004[0.085]
× Product Warranty -0.129[0.052]∗∗
× Investment 0.018[0.062]
× Conc. Industry 0.002[0.065]
Adj. R2 0.785 0.194 0.191 0.217 0.179 0.217 0.164N. obs 29727 29613 29284 25063 29977 28582 26450
Panel B: Downstream MomentumHigh-Low Customer Return -0.073 -0.079 -0.070 -0.173 -0.054 -0.064 -0.180
[0.069] [0.071] [0.066] [0.089]∗ [0.071] [0.072] [0.067]∗∗∗
× Fin. Covenant -0.018[0.043]
× Payment Advanced -0.044[0.043]
× Speculative Grade 0.065[0.070]
× Product Warranty 0.021[0.042]
× Investment -0.064[0.050]
× Conc. Industry 0.009[0.042]
Adj. R2 0.270 0.232 0.239 0.256 0.244 0.228 0.262N. obs 28514 27954 27941 25459 28398 27859 26753
47