Council on Homelessness 2013 Report - dcf.state.fl.us on Homelessness 2013 Report Submitted June...
24
Council on Homelessness 2013 Report Submitted June 2013 to: Governor Rick Scott Senate President Don Gaetz House Speaker Will Weatherford Secretary David E. Wilkins Council on Homelessness Department of Children and Families 1317 Winewood Boulevard Tallahassee, Florida 32399-0700 850-922-4691 www.myflfamilies.com/service-programs/homelessness
Transcript of Council on Homelessness 2013 Report - dcf.state.fl.us on Homelessness 2013 Report Submitted June...
Council on Homelessness 2013 Report
Submitted June 2013 to:
Governor Rick Scott Senate President Don Gaetz House Speaker Will Weatherford Secretary David E. Wilkins
Council on Homelessness Department of Children and Families 1317 Winewood Boulevard Tallahassee, Florida 32399-0700 850-922-4691 www.myflfamilies.com/service-programs/homelessness
i
ii
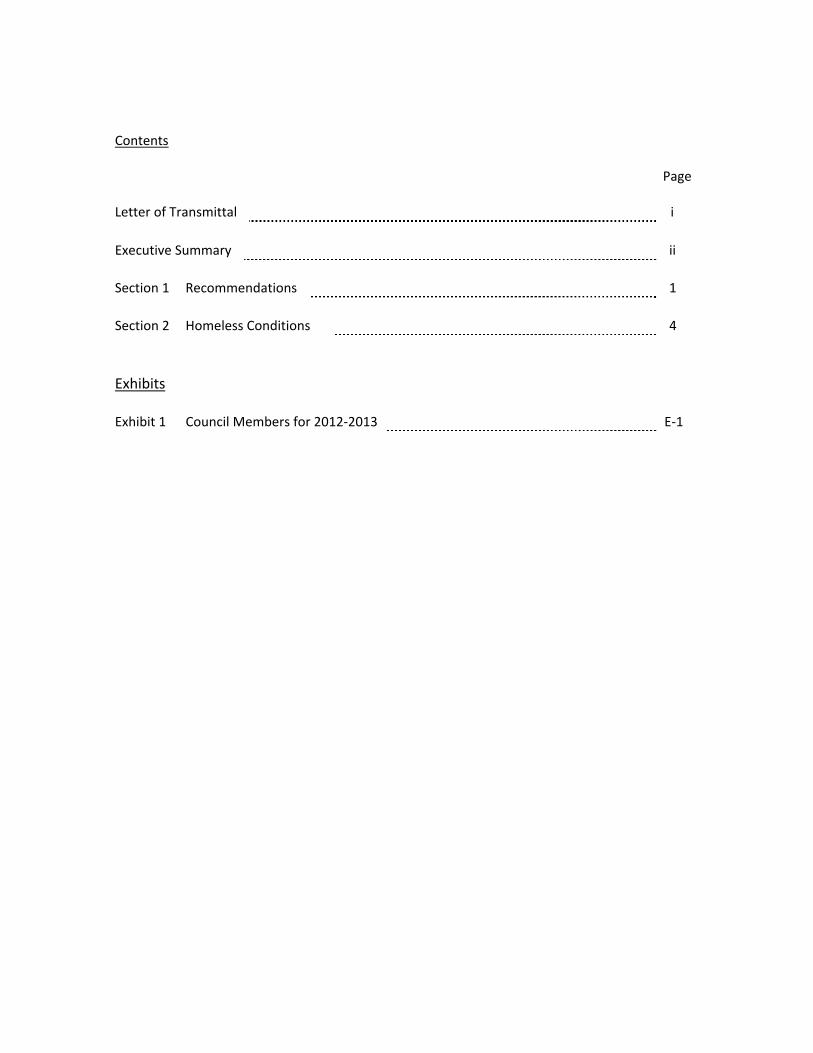
Contents
Page
Letter of Transmittal
Executive Summary
Section 1 Recommendations
Section 2 Homeless Conditions
Exhibits
Exhibit 1 Council Members for 2012-2013
1
4
E-1

Executive Summary
Implementing what is now a national best practice, in 2001 Florida created an inter-agency Council on Homelessness; the purpose of which is to develop recommendations for state leadership on how to reduce homelessness throughout the state.
In accordance with section 420.622(9), Florida Statutes, the Council on Homelessness submits its annual report to the Governor and Florida Legislature summarizing recommended actions to reduce homelessness, plus data concerning those persons currently experiencing homelessness in Florida.
On one day and one night in January 2013, local communities counted 45,364 persons who were living on the street, or in an emergency shelter. This data covers 54 counties and all 28 reporting homeless continuum of care planning areas. Thirteen (13) counties did not conduct a count of the unsheltered homeless due to the lack of resources to do the count.
Nationally, the U.S. Department of Housing and Urban Development reports homelessness amongst families with children as the fastest growing homeless population. This is also true for Florida. For school year 2011-2012, Florida’s public schools identified 63,685 students as homeless. This includes families that have lost their housing and are staying with family and friends.
The Council on Homelessness submits its recommendations for state action to reduce the number of Floridians who are without a home. These inter-related recommendations focus on: meeting the housing needs of households with Extremely Low Incomes, especially those with a disability or other special need; continuing support of community agencies which lead the homeless continuum of care planning process; providing flexible funding to support local initiatives to help persons exit homelessness; and prioritizing a state pilot to conduct a cost benefit analysis of providing affordable housing linked with support services for high utilizers of crisis services.
ii
Section 1 Recommendations to Reduce Homelessness
The Council on Homelessness submits four recommendations of critical actions the state can undertake to enable communities across Florida to reduce the number of persons experiencing homelessness.
Recommendation One Create Housing for Extremely Low Incomes, especially households with Special Needs as defined by Florida Administrative Rule, 67-48.002.
Appropriate resources to Florida Housing Finance Corporation to produce housing for households with Extremely Low Income, homeless households and persons with special needs.
Rationale: There are approximately 450,000 Extremely Low Income (ELI) renter households in Florida. These are households with incomes at or below 30 percent of the area median income (AMI) for their communities. This equates to a family of four in Orlando earning $17,550 or less per year; or an elderly couple in the Panhandle with an annual income of $11,550. A large majority (75%) of ELI households are cost burdened, spending 40 percent or more of their income on housing. Between 2005 and 2011, the number of cost-burdened ELI renter households increased 24 percent, from 256,357 in 2005 to 317,990 in 2011.
Across the state, the need for housing affordable to ELI households far exceeds the supply. A 2013 analysis conducted by the University of Florida’s Shimberg Center on Housing Studies for Florida Housing Finance Corporation found that in all regions of the state, except the Northwest and Northeast non-metropolitan counties, the need is twice the supply. For every 100 ELI renter households there are 50 or fewer affordable and available units. Statewide the average is 31 affordable and available rental units for every 100 ELI renter households.
Based upon the 2013 HUD Point in Time Count statewide data and 2011-2012 Florida Department of Education counts of homeless students, the Shimberg Center on Housing Studies reports there are 42,476 homeless individuals and 31,148 homeless families with children in Florida. The Shimberg Center on Housing Studies reports that these statistics undercount the real number of homeless individuals and families. They do not include 6,798 unaccompanied homeless youth working to stay in school and 24,815 families with children in school who live in unstable housing such as motels and doubled up with friends, neighbors or relatives.
In addition to the cost burden necessary for ELI households to access permanent housing, these individuals and families frequently have other issues that adversely impact their ability to access and/or retain permanent housing. These issues can include a disabling condition, escaping a domestic violence situation, suddenly becoming unemployed or underemployed or losing their home to foreclosure. Many of these issues create barriers to passing landlord screenings.
1

Recommendation Two Sustain Ongoing Funding for Local Homeless Coalitions
Continue recurring funding for local homeless coalitions and lead agencies sufficient to ensure capacity to secure essential federal resources targeted to reducing homelessness.
Rationale: Continued state financial assistance is essential to helping community partners carry out federally required planning, data collection, program coordination and grant writing necessary to successfully compete for significant grant funding to house persons experiencing homelessness.
Each year the federal government appropriates resources to community agencies to reduce homelessness. These community organizations have secured more than $300 million in federal, local and private financing for community services and housing in Florida. In 2012, they brought nearly $80 million in federal grants to Florida.
Based on a sample of small and medium sized homeless planning areas, the community partners have identified the workload and costs incurred to carry out these prerequisite actions for eligibility to apply for federal homeless housing grants.
Table 1 Workload and Cost for Federal Prerequisite Activities
Federal Requirement Staffing Needed Cost to
Carry Out Action
Annual point in time count of the sheltered and unsheltered homeless
1.0 FTE $18,300
Homeless continuum of care planning – year round
0.75 FTE $31,450
Preparation of federal continuum of care application for funds
0.8 FTE $23,210
Coordinated Assessment System for intake, need assessment, and referral
0.5 FTE $14,920
Homeless Management Information System for data collection on all persons served
0.75 FTE $38,780
Local coordination across all service providers
1.67 FTE $67,370
TOTAL: 5.47 FTE $126,660
Source: 2013 Survey of Agencies leading local continuum of care planning, Office on Homelessness, Department of Children and Families. April 2013
Planning Areas Responding: Suncoast Partnership, Lee County, St. Johns, Monroe County, Marion County, Suwannee Valley, Pinellas County, Charlotte County, Okaloosa Walton CoC
2
Recommendation Three Support State Funding for Community Efforts to Reduce Homelessness
Provide a flexible source of state financial aid to local homeless coalitions and lead agencies to fund
priority services and housing for the homeless.
Rationale: Communities need resources to reduce and eliminate homelessness. Each community has differing needs and priorities. The communities should be provided flexible state support, which they can utilize to best meet their identified priorities.
Such funding can be an essential source of cash match for federal and private grants. The funding should be flexible so as to address a broad array of needs including housing, education, job training and placement, health services, childcare and other support services. Use of the aid should be consistent with the community’s homeless service plan.
A flexible funding source can enable communities to pilot best practices, and new service delivery models that might otherwise not be possible. Future state funding can also fill gaps in local service budgets, should federal grant in aid dollars be cut in coming budget plans.
Recommendation Four Prioritize a State Pilot to Provide Florida-specific Data
Prioritize a state pilot to conduct a cost benefit analysis of providing affordable housing linked with support services for high utilizers of crisis services.
Rationale: Persons experiencing homelessness interact with multiple organizations and systems providing or responsible for public healthcare, emergency services, basic needs; as well as law enforcement, the courts and correctional facilities. Studies in other states have documented significant fiscal and social benefits associated with aligning appropriate and adequate resources and programs to efficiently link affordable housing with support services for homeless persons or families with the greatest need that facilitates and supports stable and productive lives in their communities.
Florida does not have reliable data concerning the cost benefits across its multiple systems. A pilot project to assess the inter-connected cross-agency savings associated with targeting aligned public and private resources to high-utilizers of crisis services will enable Florida to develop strategies and policies, which will result in the best results for the persons served while providing the most cost-effective utilization of public resources
3
Section 2 Homeless Conditions in Florida
Point in Time Counts – 2013
The Department of Housing and Urban Development (HUD) requires that the homeless continuums of care conduct an annual count of the homeless persons who are sheltered in emergency shelters, transitional housing and safe havens on a single night during the last ten days of January. Further, HUD requires that the continuums of care also must conduct a count of the unsheltered homeless population every other year, required on odd numbered years. For 2013, the state’s 28 homeless continuums of care carried out both the sheltered and unsheltered counts required.
The goal is to produce an unduplicated count, or statistically reliable estimate of the homeless in the community.
Who is counted as Homeless?
The intent is to identify those men, women and children who meet HUD’s definition of a homeless person. This is limited to:
(1) Those living in a publicly or privately operated shelter providing temporary living arrangements;
(2) Those persons whose primary nighttime residence is a public or private place not intended to be used as an accommodation for human beings, such as: a car, park, abandoned building or camping ground;
(3) A person who is exiting from an institution, where he or she lived for 90 days or less, and who was otherwise homeless immediately prior to entering that institution;
(4) A person who is fleeing from a domestic violence situation;
(5) A person who will lose their primary nighttime residence within 14 days, where no subsequent dwelling has been found and the individual lacks the resources to obtain permanent housing.
Who is not counted as homeless?
• Persons residing in permanent supportive housing programs, such as rental assistance vouchers;
• Persons living in emergency shelters and temporary housing that is not dedicated to serving the homeless, such as alcohol detox centers;
• Individuals and families temporarily staying with family or or friends due to the loss of their own housing or economic reasons (doubled up or sofa surfing).
4
• Persons living in permanent housing with assistance from a government program.
The count is undertaken on a single day, and night. The federally approved methods include a report of all homeless persons counted, or a statistically valid sampling to arrive at the unduplicated estimate of the homeless. The unsheltered count methods typically are either street counts, street counts with interviews, or screening and interviewing persons at supportive service agencies, such as soup kitchens where the homeless seek help.
Conducting these point in time counts is challenging, and requires many volunteers. The continuums of care continue to make remarkable success in compiling those one-day counts. Even so, the results can be influenced by many factors, some of which are outside the control of the local continuum. As a result, year-to-year comparisons at the community level can be misleading, especially if the observed trends are due to differing strategies used to undertake the count.
2013 One Day and Night Count Results
To fulfill the federal mandate and instructions, the state’s 28 local continuum of care planning areas conducted a one-day and one night count of the homeless persons in their planning area.
For the 28 continuum of care planning areas reporting, the total number of sheltered and unsheltered homeless persons in 2013 was 45,364. The 2012 number of homeless persons was 54,972 for these 28 planning areas. The 2013 count reflects a decrease of 9,608 persons, a drop of 17.5% statewide.
The number of homeless persons by county reflects differing trends. For 19 of the counties, the homeless population increased from 2012, while 26 counties reported fewer homeless in 2013. Thirteen rural county areas did not have point in time count conducted in 2013.
In reporting their count results, the lead agencies identified a number of factors that impacted the totals, both up and down.
Factors Cited as Contributing to a Decreased Number of Homeless
• Successful programs implemented in the county over past two years;
• Stricter enforcement of trespass ordinances made the street homeless less visible, and harder to find and count;
• Changes in the method used for the count contributed to a lower count, and more reliable count numbers;
• Adjusting count results to ensure that only those who are literally homeless are reported, resulting in decreases particularly by eliminating school age children and other homeless who are in jail.
5
• Fewer emergency shelters that serve and target the homeless were identified in 2013 than prior years;
• The lack of service providers in rural counties made it harder to identify the homeless, and where to find them during the count;
• Change in federal count instructions that limited shelter counts to only those facilities identified in the planning area’s homeless housing inventory;
• Large emergency shelter provider in area did not report their homeless service data for night of the count;
• The continuum of care had fewer dollars, and volunteers available to carry out their street count;
• 2013 count was not able to get out into the woods, compared to the past street count;
• More permanent supportive housing beds available in 2013 to serve the homeless, whereby those housed are no longer counted as homeless;
• Good, warm and dry weather on day of count kept the street homeless out of cold night shelters, and made them harder to find.
Factors Cited as Contributing to Increased Count
• Better planning for the street count to identify encampments, and recruitment of more volunteers;
• Large increase in homeless families found;
• More transient homeless were found during the count as result of having homeless persons help do the street count;
• Shelter count up due to more beds available that serve homeless veterans;
• Better count system used in 2013, including more homeless persons involved in the street count effort.
Efforts to improve data quality, including developing consistent and better methodologies for conducting the point in time counts of the homeless, are needed, and are being called for by national homeless advocacy groups. Until those changes are made, the early caution is repeated – year-to-year comparisons at the community level can be misleading. Too many variables can cause widely different results.
6
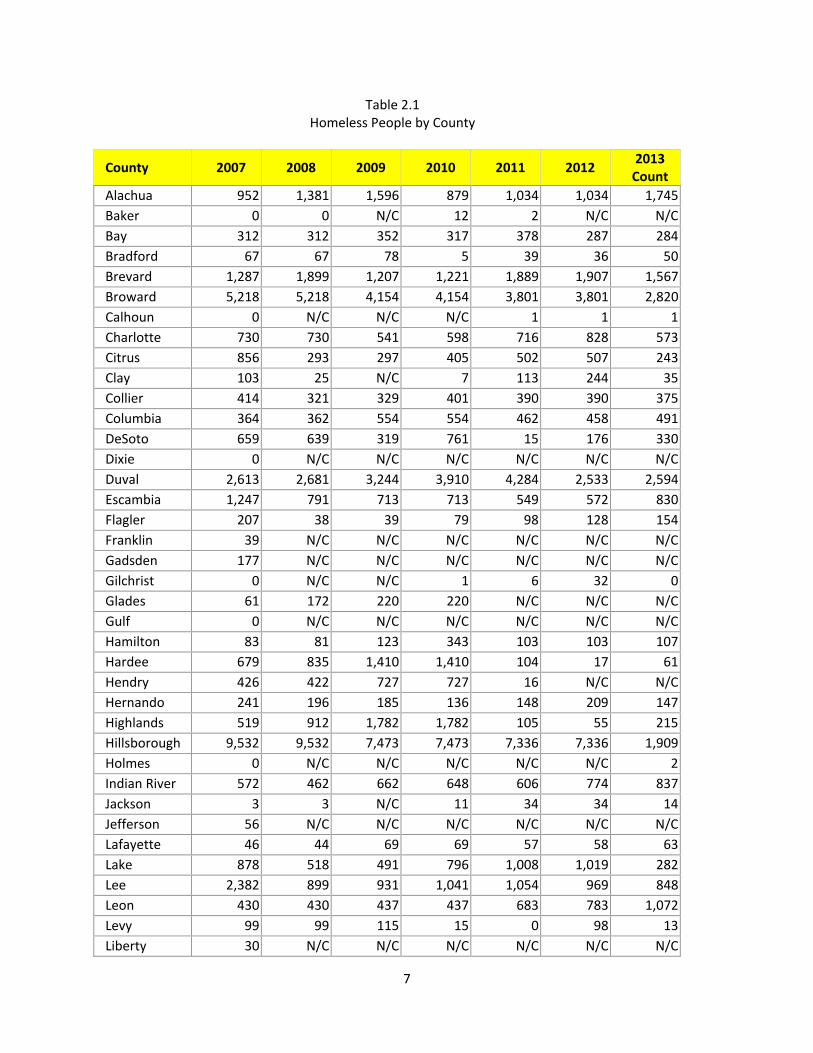
Table 2.1 Homeless People by County
County 2007 2008 2009 2010 2011 2012 2013
Count Alachua 952 1,381 1,596 879 1,034 1,034 1,745 Baker 0 0 N/C 12 2 N/C N/C Bay 312 312 352 317 378 287 284 Bradford 67 67 78 5 39 36 50 Brevard 1,287 1,899 1,207 1,221 1,889 1,907 1,567 Broward 5,218 5,218 4,154 4,154 3,801 3,801 2,820 Calhoun 0 N/C N/C N/C 1 1 1 Charlotte 730 730 541 598 716 828 573 Citrus 856 293 297 405 502 507 243 Clay 103 25 N/C 7 113 244 35 Collier 414 321 329 401 390 390 375 Columbia 364 362 554 554 462 458 491 DeSoto 659 639 319 761 15 176 330 Dixie 0 N/C N/C N/C N/C N/C N/C Duval 2,613 2,681 3,244 3,910 4,284 2,533 2,594 Escambia 1,247 791 713 713 549 572 830 Flagler 207 38 39 79 98 128 154 Franklin 39 N/C N/C N/C N/C N/C N/C Gadsden 177 N/C N/C N/C N/C N/C N/C Gilchrist 0 N/C N/C 1 6 32 0 Glades 61 172 220 220 N/C N/C N/C Gulf 0 N/C N/C N/C N/C N/C N/C Hamilton 83 81 123 343 103 103 107 Hardee 679 835 1,410 1,410 104 17 61 Hendry 426 422 727 727 16 N/C N/C Hernando 241 196 185 136 148 209 147 Highlands 519 912 1,782 1,782 105 55 215 Hillsborough 9,532 9,532 7,473 7,473 7,336 7,336 1,909 Holmes 0 N/C N/C N/C N/C N/C 2 Indian River 572 462 662 648 606 774 837 Jackson 3 3 N/C 11 34 34 14 Jefferson 56 N/C N/C N/C N/C N/C N/C Lafayette 46 44 69 69 57 58 63 Lake 878 518 491 796 1,008 1,019 282 Lee 2,382 899 931 1,041 1,054 969 848 Leon 430 430 437 437 683 783 1,072 Levy 99 99 115 15 0 98 13 Liberty 30 N/C N/C N/C N/C N/C N/C
7
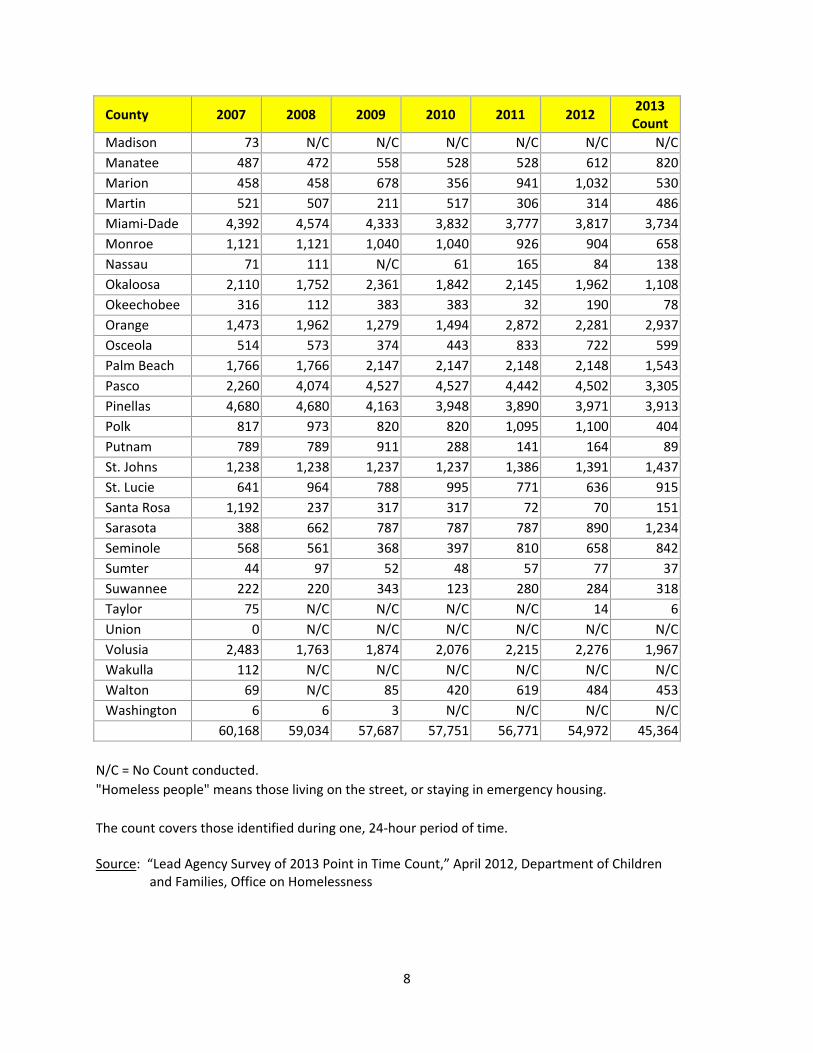
County 2007 2008 2009 2010 2011 2012 2013
Count Madison 73 N/C N/C N/C N/C N/C N/C Manatee 487 472 558 528 528 612 820 Marion 458 458 678 356 941 1,032 530 Martin 521 507 211 517 306 314 486 Miami-Dade 4,392 4,574 4,333 3,832 3,777 3,817 3,734 Monroe 1,121 1,121 1,040 1,040 926 904 658 Nassau 71 111 N/C 61 165 84 138 Okaloosa 2,110 1,752 2,361 1,842 2,145 1,962 1,108 Okeechobee 316 112 383 383 32 190 78 Orange 1,473 1,962 1,279 1,494 2,872 2,281 2,937 Osceola 514 573 374 443 833 722 599 Palm Beach 1,766 1,766 2,147 2,147 2,148 2,148 1,543 Pasco 2,260 4,074 4,527 4,527 4,442 4,502 3,305 Pinellas 4,680 4,680 4,163 3,948 3,890 3,971 3,913 Polk 817 973 820 820 1,095 1,100 404 Putnam 789 789 911 288 141 164 89 St. Johns 1,238 1,238 1,237 1,237 1,386 1,391 1,437 St. Lucie 641 964 788 995 771 636 915 Santa Rosa 1,192 237 317 317 72 70 151 Sarasota 388 662 787 787 787 890 1,234 Seminole 568 561 368 397 810 658 842 Sumter 44 97 52 48 57 77 37 Suwannee 222 220 343 123 280 284 318 Taylor 75 N/C N/C N/C N/C 14 6 Union 0 N/C N/C N/C N/C N/C N/C Volusia 2,483 1,763 1,874 2,076 2,215 2,276 1,967 Wakulla 112 N/C N/C N/C N/C N/C N/C Walton 69 N/C 85 420 619 484 453 Washington 6 6 3 N/C N/C N/C N/C
60,168 59,034 57,687 57,751 56,771 54,972 45,364
N/C = No Count conducted. "Homeless people" means those living on the street, or staying in emergency housing.
The count covers those identified during one, 24-hour period of time.
Source: “Lead Agency Survey of 2013 Point in Time Count,” April 2012, Department of Children and Families, Office on Homelessness
8

Homeless Population Characteristics
The 28 local continuum of care planning agencies have reported the following information on the make-up of the homeless population. They captured this information from direct interviews, or from agency data on homeless persons served as entered into the homeless management information system [HMIS]. The 2013 data is compared to 2011 data, as the last complete sheltered and unsheltered count conducted by all 28 continuums.
Gender
Men made up the majority of the homeless persons. Of the 37,579 persons surveyed, 25,261 were men (67%). This data for 2013 remains consistent with past year’s results.
Gender
Year Men Women 2011 66% 34% 2013 67% 33%
Age
The breakdown of the age of the 2013 homeless population, by age range, was reported.
Age Ranges Number of Persons % of Total Under 18 6,658 17.8%
18 - 24 3,087 8.2% 24 - 60 25,616 68.3%
Over 60 2,131 5.7% 37,492
These results are consistent with the focus of the count — those persons living in shelters or staying on the streets. Families with children are more likely to be sharing the housing of others, and are not allowed to be included in the federal counts, due to this living arrangement.
Age Ranges Year Under 18 18 – 60 Over 60
2011 18.3% 76.4% 5.3% 2013 17.8% 76.5% 5.7%
Ethnicity
In 2013, 3,910 homeless persons out of 32,254 responding, indicated that they were either Hispanic or Latino. At 12.1% of the homeless population, this is up slightly from the 2011 level of 11.2% of the homeless.
Race
The reported race of the homeless population continues to reflect an over-representation of Black/African Americans, with over 36% of the homeless.
9
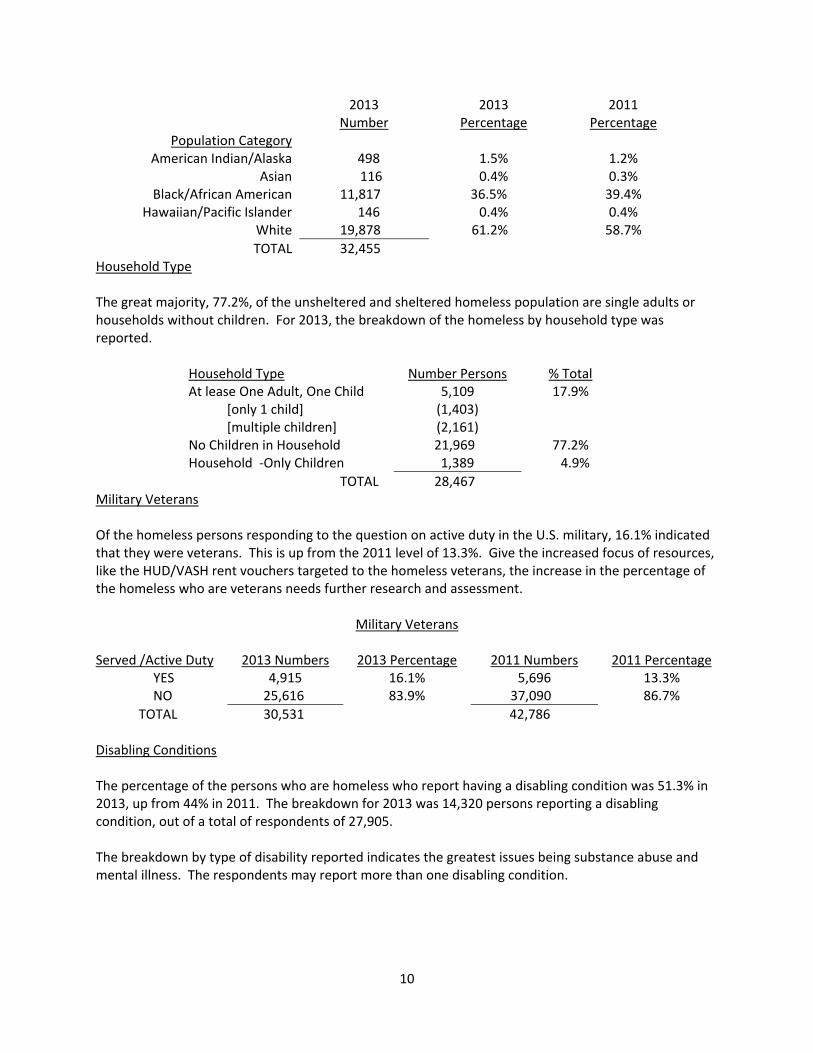
2013 2013 2011 Number Percentage Percentage
Population Category American Indian/Alaska 498 1.5% 1.2%
Asian 116 0.4% 0.3% Black/African American 11,817 36.5% 39.4%
Hawaiian/Pacific Islander 146 0.4% 0.4% White 19,878 61.2% 58.7% TOTAL 32,455
Household Type
The great majority, 77.2%, of the unsheltered and sheltered homeless population are single adults or households without children. For 2013, the breakdown of the homeless by household type was reported.
Household Type Number Persons % Total At lease One Adult, One Child 5,109 17.9%
[only 1 child] (1,403) [multiple children] (2,161)
No Children in Household 21,969 77.2% Household -Only Children 1,389 4.9%
TOTAL 28,467 Military Veterans
Of the homeless persons responding to the question on active duty in the U.S. military, 16.1% indicated that they were veterans. This is up from the 2011 level of 13.3%. Give the increased focus of resources, like the HUD/VASH rent vouchers targeted to the homeless veterans, the increase in the percentage of the homeless who are veterans needs further research and assessment.
Military Veterans
Served /Active Duty 2013 Numbers 2013 Percentage 2011 Numbers 2011 Percentage YES 4,915 16.1% 5,696 13.3% NO 25,616 83.9% 37,090 86.7%
TOTAL 30,531 42,786
Disabling Conditions
The percentage of the persons who are homeless who report having a disabling condition was 51.3% in 2013, up from 44% in 2011. The breakdown for 2013 was 14,320 persons reporting a disabling condition, out of a total of respondents of 27,905.
The breakdown by type of disability reported indicates the greatest issues being substance abuse and mental illness. The respondents may report more than one disabling condition.
10
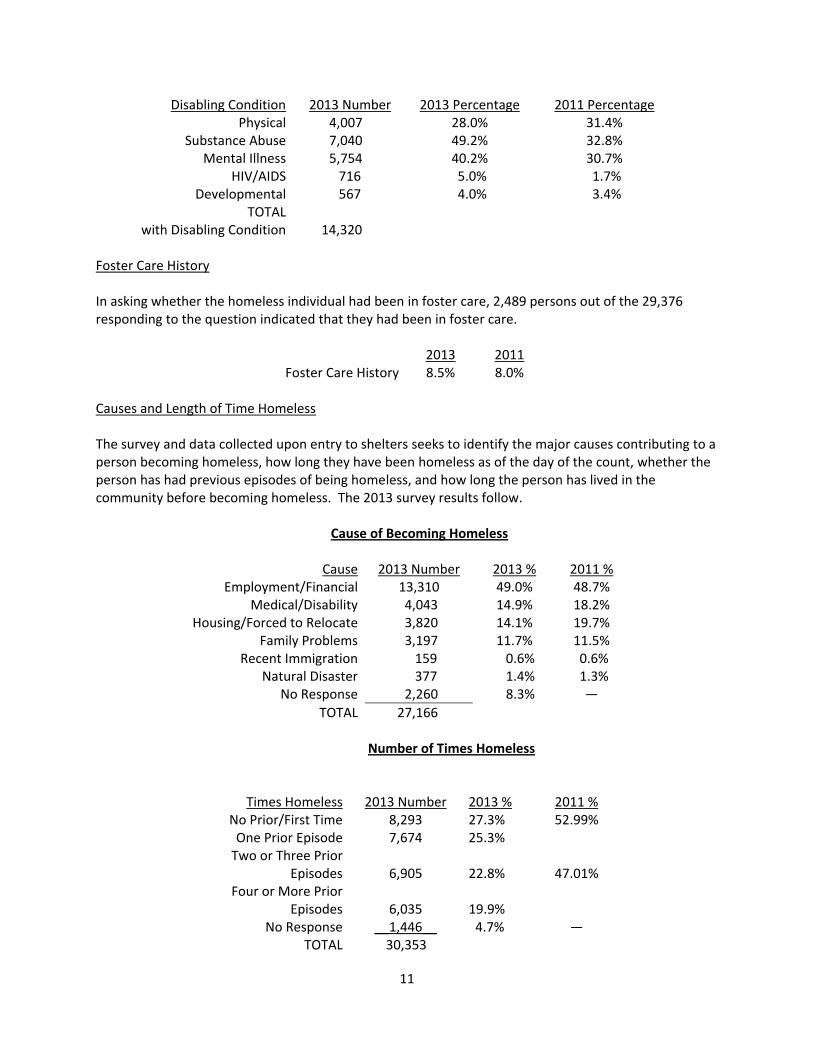
Disabling Condition 2013 Number 2013 Percentage 2011 Percentage Physical 4,007 28.0% 31.4%
Substance Abuse 7,040 49.2% 32.8% Mental Illness 5,754 40.2% 30.7%
HIV/AIDS 716 5.0% 1.7% Developmental 567 4.0% 3.4%
TOTAL with Disabling Condition 14,320
Foster Care History
In asking whether the homeless individual had been in foster care, 2,489 persons out of the 29,376 responding to the question indicated that they had been in foster care.
2013 2011 Foster Care History 8.5% 8.0%
Causes and Length of Time Homeless
The survey and data collected upon entry to shelters seeks to identify the major causes contributing to a person becoming homeless, how long they have been homeless as of the day of the count, whether the person has had previous episodes of being homeless, and how long the person has lived in the community before becoming homeless. The 2013 survey results follow.
Cause of Becoming Homeless
Cause 2013 Number 2013 % 2011 % Employment/Financial 13,310 49.0% 48.7%
Medical/Disability 4,043 14.9% 18.2% Housing/Forced to Relocate 3,820 14.1% 19.7%
Family Problems 3,197 11.7% 11.5% Recent Immigration 159 0.6% 0.6%
Natural Disaster 377 1.4% 1.3% No Response 2,260 8.3% —
TOTAL 27,166
Number of Times Homeless
Times Homeless 2013 Number 2013 % 2011 % No Prior/First Time 8,293 27.3% 52.99%
One Prior Episode 7,674 25.3% Two or Three Prior
Episodes 6,905 22.8% 47.01% Four or More Prior
Episodes 6,035 19.9% No Response __1,446__ 4.7% —
TOTAL 30,353
11
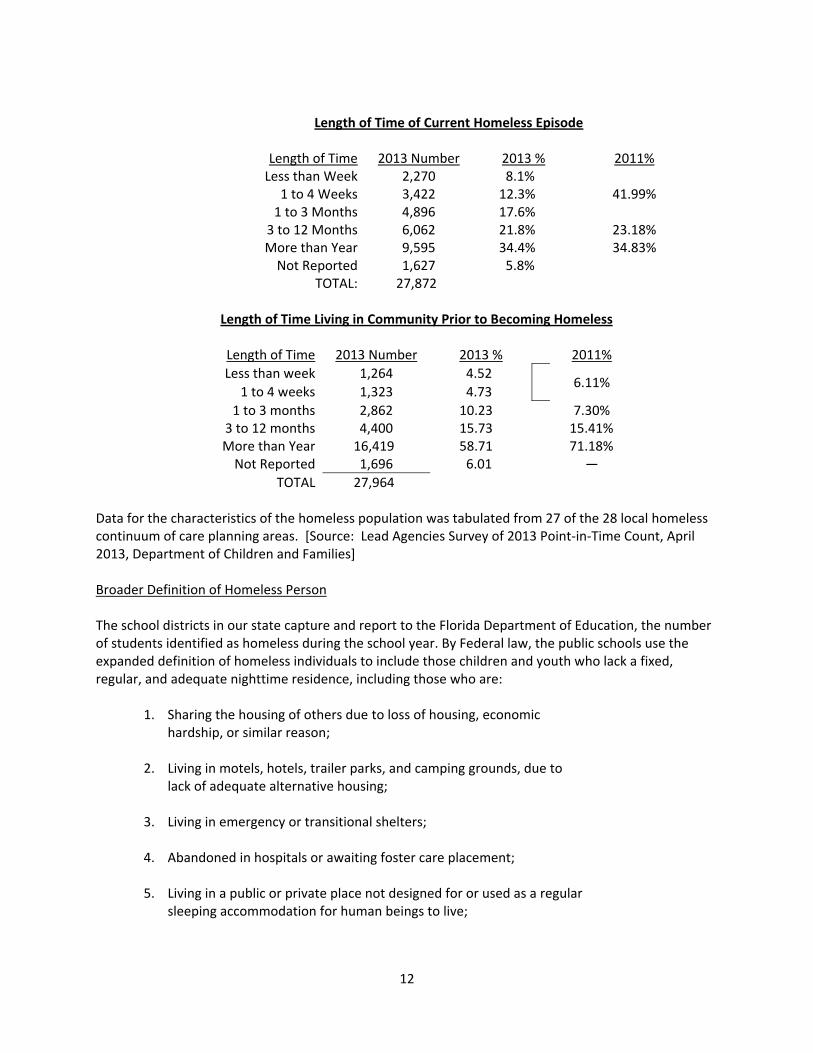
Length of Time of Current Homeless Episode
Length of Time 2013 Number 2013 % 2011% Less than Week 2,270 8.1%
1 to 4 Weeks 3,422 12.3% 41.99% 1 to 3 Months 4,896 17.6%
3 to 12 Months 6,062 21.8% 23.18% More than Year 9,595 34.4% 34.83%
Not Reported 1,627 5.8% TOTAL: 27,872
Length of Time Living in Community Prior to Becoming Homeless
Length of Time 2013 Number 2013 % 2011% Less than week 1,264 4.52
6.11%1 to 4 weeks 1,323 4.73
1 to 3 months 2,862 10.23 7.30% 3 to 12 months 4,400 15.73 15.41% More than Year 16,419 58.71 71.18%
Not Reported 1,696 6.01 — TOTAL 27,964
Data for the characteristics of the homeless population was tabulated from 27 of the 28 local homeless continuum of care planning areas. [Source: Lead Agencies Survey of 2013 Point-in-Time Count, April 2013, Department of Children and Families]
Broader Definition of Homeless Person
The school districts in our state capture and report to the Florida Department of Education, the number of students identified as homeless during the school year. By Federal law, the public schools use the expanded definition of homeless individuals to include those children and youth who lack a fixed, regular, and adequate nighttime residence, including those who are:
1. Sharing the housing of others due to loss of housing, economic hardship, or similar reason;
2. Living in motels, hotels, trailer parks, and camping grounds, due to lack of adequate alternative housing;
3. Living in emergency or transitional shelters;
4. Abandoned in hospitals or awaiting foster care placement;
5. Living in a public or private place not designed for or used as a regular sleeping accommodation for human beings to live;
12

6. Living in cars, parks, abandoned buildings, bus or train stations; substandard housing or similar setting; and
7. Migratory children living in any of the above circumstances.
During the 2011-2012 school year, the Florida school districts identified 63,685 children and youth who were homeless. This is a 12% increase from 2010-2011. Of those identified, 6,798 (11%) were “unaccompanied youth.” An “unaccompanied youth” is defined as one who is not in physical custody of a parent or guardian. The majority, 47,191 (74%) were reported as homeless and temporarily sharing the housing of other persons due to the loss of their housing or economic hardship; the same percent as reported from the previous school year.
Homeless Students Reported in Florida Public Schools
School Year
Homeless Students
Change
2007 - 2008 34,375 +11% 2008 - 2009 41,286 +20% 2009 - 2010 49,112 +19% 2010 - 2011 56,680 +15% 2011 - 2012 63,685 +12%
Source: 2011 – 2012 Survey 5 Student Demographic Format and Federal State Indicator Format. Florida Department of Education, Automated Student Database System.
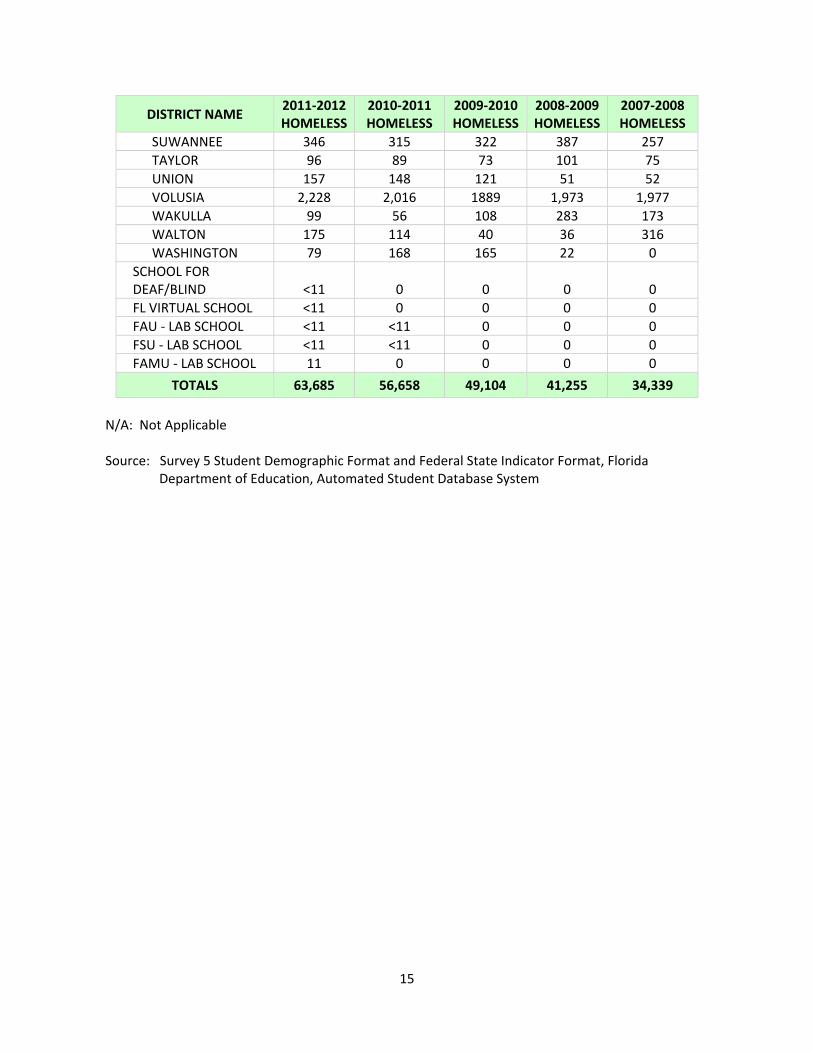
Homeless Students by Florida County
DISTRICT NAME 2011-2012 HOMELESS
2010-2011 HOMELESS
2009-2010 HOMELESS
2008-2009 HOMELESS
2007-2008 HOMELESS
ALACHUA 632 594 446 707 616 BAKER 304 249 191 153 72 BAY 1,477 1,175 641 700 685 BRADFORD 215 154 122 <11 <11 BREVARD 1,350 1,165 965 478 205 BROWARD 2,158 2,101 2953 1,807 1,596 CALHOUN 84 58 47 12 <11 CHARLOTTE 488 495 441 376 366 CITRUS 328 323 371 483 469 CLAY 862 741 824 816 695 COLLIER 1,281 1,407 1360 814 612 COLUMBIA 567 403 380 423 89 DADE 5,773 4,406 4268 2,581 2,382 DESOTO 278 225 223 193 257 DIXIE 31 48 60 12 15 DUVAL 1,422 1,169 947 2,144 1,931 ESCAMBIA 1,423 1,091 1237 1,036 878 FLAGLER 367 322 246 166 71
13

DISTRICT NAME 2011-2012 HOMELESS
2010-2011 HOMELESS
2009-2010 HOMELESS
2008-2009 HOMELESS
2007-2008 HOMELESS
FRANKLIN 205 160 126 140 110 GADSDEN 556 533 713 689 725 GILCHRIST 17 20 27 <11 <11 GLADES 26 34 18 <11 <11 GULF <11 <11 <11 <11 <11 HAMILTON 343 326 342 251 236 HARDEE 183 188 146 49 71 HENDRY 200 156 139 74 95 HERNANDO 645 497 242 207 156 HIGHLANDS 429 92 61 37 64 HILLSBOROUGH 3,559 3,659 3124 2,054 2,073 HOLMES 90 62 24 <11 <11 INDIAN RIVER 273 311 347 349 209 JACKSON 177 158 119 182 139 JEFFERSON <11 <11 <11 <11 <11 LAFAYETTE 195 196 141 105 89 LAKE 3,541 2,992 2162 778 324 LAKE WALES CHARTER 136 N/A N/A N/A N/A LEE 1,392 1,282 1143 1,030 839 LEON 650 762 523 329 309 LEVY 128 182 263 114 88 LIBERTY 41 21 22 23 16 MADISON 103 74 57 89 43 MANATEE 1,641 1,788 1684 1,770 1,574 MARION 2,223 1,911 1691 1,675 1,060 MARTIN 115 80 68 48 42 MONROE 343 328 298 317 243 NASSAU 210 230 145 54 105 OKALOOSA 573 404 482 335 451 OKEECHOBEE 396 318 203 130 60 ORANGE 4,844 3,887 1324 2,467 1,811 OSCEOLA 2,825 1,923 1364 1,251 1,213 PALM BEACH 1,636 1,443 1960 1,339 801 PASCO 1,997 2,230 2093 1,815 1,599 PINELLAS 3,085 2,915 2462 1,870 962 POLK 2,304 2,446 2219 2,024 1,662 PUTNAM 885 736 720 623 525 ST. JOHNS 584 493 344 149 86 ST. LUCIE 324 348 222 72 27 SANTA ROSA 1,651 1,467 1328 943 996 SARASOTA 877 1,229 872 1,006 1,068 SEMINOLE 1,865 1,697 1322 1,008 632 SUMTER 155 48 124 105 47
14
DISTRICT NAME 2011-2012 HOMELESS
2010-2011 HOMELESS
2009-2010 HOMELESS
2008-2009 HOMELESS
2007-2008 HOMELESS
SUWANNEE 346 315 322 387 257 TAYLOR 96 89 73 101 75 UNION 157 148 121 51 52 VOLUSIA 2,228 2,016 1889 1,973 1,977 WAKULLA 99 56 108 283 173 WALTON 175 114 40 36 316 WASHINGTON 79 168 165 22 0
SCHOOL FOR DEAF/BLIND <11 0 0 0 0 FL VIRTUAL SCHOOL <11 0 0 0 0 FAU - LAB SCHOOL <11 <11 0 0 0 FSU - LAB SCHOOL <11 <11 0 0 0 FAMU - LAB SCHOOL 11 0 0 0 0
TOTALS 63,685 56,658 49,104 41,255 34,339
N/A: Not Applicable
Source: Survey 5 Student Demographic Format and Federal State Indicator Format, Florida Department of Education, Automated Student Database System
15

Continuum of Care Planning
What is a homeless continuum of care plan?
The local homeless assistance continuum of care plan is intended to be a framework for a comprehensive and seamless array of emergency, transitional, and permanent housing and services to address the various needs of homeless persons, as well as those at risk of becoming homeless. [Section 420.624, Florida Statutes]
This locally driven plan reflects the community’s vision for solutions to its specific homeless needs. This planning is required by the Department of Housing and Urban Development to be eligible to apply for and compete for federal grants to develop and operate housing for the homeless.
The continuum of care plan outlines the strategies and actions planned at the community level to accomplish the federal goal for reducing and ending homelessness. Each continuum of care plan serves a specific geographical area, and the local planning effort shall identify an agency to lead this planning. These lead agencies are local homeless coalitions, units of local government or other private nonprofit entities.
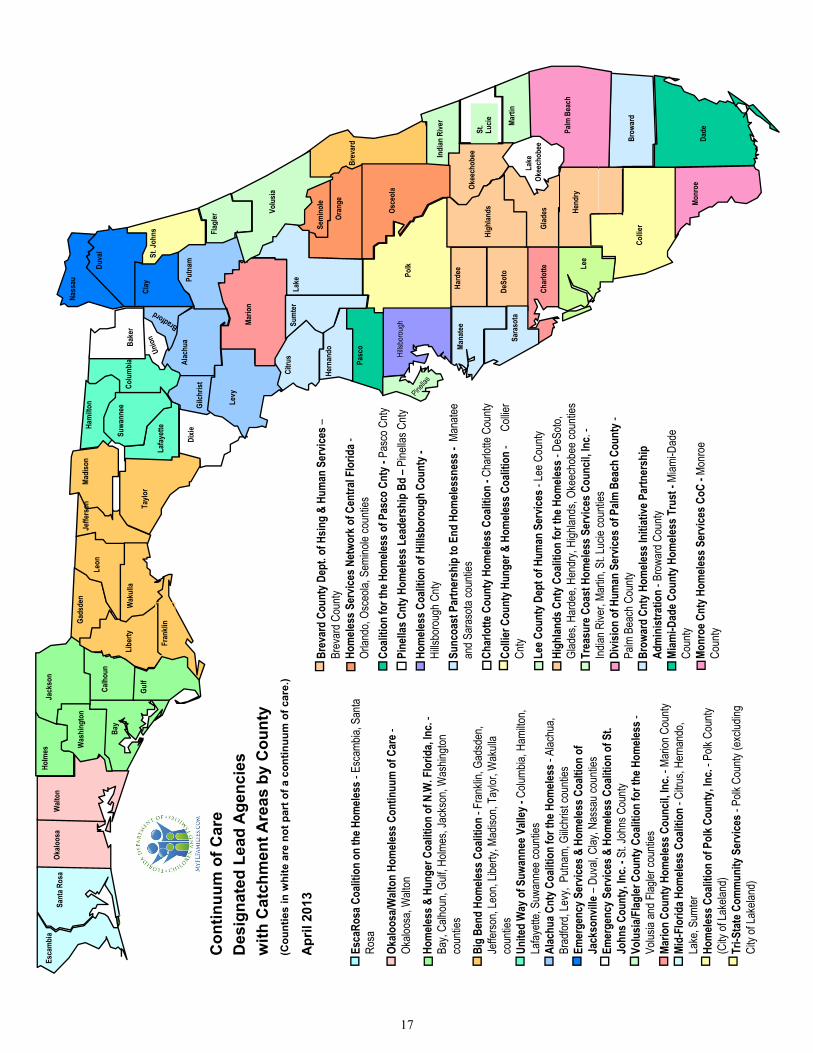
Florida’ Planning Effort
In 2013, there are 28 local continuum of care planning areas covering 64 of the 67 counties. The present planning areas are depicted on the attached map, which also identifies the agency leading the homeless plan. The three counties, which have elected not to be part of planning, are Baker, Union and Dixie.
Return on the Planning Investment
The state’s continuum of care areas have become very successful in competing for and receiving housing grants from the Department of Housing and Urban Development, to create transitional and permanent housing for the homeless. In the most recent grant cycle, (FY2012), the 28 continuums have received grant awards totaling $78,554,056. This helps to fund over 350 local projects in Florida. The growth in grant funding being secured to help serve Florida’s homeless is reflected in the following table of awards.
Year Continuum of Care
Total Awards 2001 $48,692,766 2002 $41,239,338 2003 $51,396,280 2004 $59,060,266 2005 $58,053,746 2006 $56,269,722 2007 $62,693,380 2008 $67,181,336 2009 $73,836,367 2010 $77,739,489 2011 $78,767,112 2012 $78,554,056
16
Sant
a Ros
a Ok
aloos
a W
alton
Ho
lmes
Ja
ckso
n
Was
hing
ton
Bay
Calh
oun
Gads
den
Leon
Je
ffers
on
Madi
son
Ham
ilton
Suwa
nnee
Nass
au
Duva
l
Esca
mbi
a
Taylo
r
Wak
ulla
Libe
rty
Fran
klin
Gulf
Lafa
yette
Suwa
nnee
Co
lum
bia Al
achu
a Di
xie
Gilch
rist
Clay
St
. Joh
ns
Putn
am
Flag
ler
Bake
r
17
Con
tinuu
m o
f Car
e C
ontin
uum
of C
are
Des
igna
ted
Lead
Age
ncie
sw
ith C
atch
men
t Are
as b
y C
ount
y(C
ount
ies
in w
hite
are
not
par
t of a
con
tinuu
m o
f car
e.)
Apr
il 20
13
Apr
il 20
13
Esca
Rosa
Coa
litio
n on
the H
omele
ss -
Esca
mbia,
San
ta Ro
sa
Okalo
osa/W
alton
Hom
eless
Con
tinuu
m o
f Car
e -Ok
aloos
a W
alton
Ok
aloos
a, W
alton
Hom
eless
& H
unge
r Coa
litio
n of
N.W
. Flo
rida,
Inc.
-Ba
y, Ca
lhoun
, Gulf
, Holm
es, J
acks
on, W
ashin
gton
coun
ties
Big
Bend
Hom
eless
Coa
litio
n -F
rank
lin, G
adsd
en,
Jeffe
rson,
Leon
, Libe
rty, M
adiso
n, Ta
ylor,
Wak
ulla
coun
tities
Unite
d W
ay o
f Suw
anne
e Vall
ey -
Colum
bia, H
amilto
n,La
fayett
e, Su
wann
ee co
untie
sAl
achu
a Cnt
y Coa
litio
n fo
r the
Hom
eless
-Al
achu
a, Br
adfor
d, Le
vy, P
utnam
, Giilc
hrist
coun
ties
Emer
genc
y Ser
vices
& H
omele
ss C
oalti
on o
f Ja
ckso
nville
– Du
val, C
layy, N
assa
u co
untie
s Em
erge
ncy S
ervic
es &
Hom
eless
Coa
litio
n of
St.
John
s Cou
nty,
Inc.
-St. J
ohns
Cou
ntyVo
lusia
/Flag
ler C
ount
y Coa
litio
n fo
r the
Hom
eless
-Vo
lusia
and F
lagler
coun
ties
Mario
n Co
unty
Hom
eless
Cou
ncil,
Inc.
-Mar
ion C
ounty
Mid-
Flor
ida H
omele
ss C
oalit
ion
-Citru
s, He
rnan
do,
Lake
Sum
ter
Lake
, Sum
terHo
mele
ss C
oalit
ion
of P
olk C
ount
y, In
c. -P
olk C
ounty
(City
of La
kelan
d)Tr
i-Sta
te C
omm
unity
Ser
vices
-Po
lk Co
unty
(exc
luding
City
of La
kelan
d)
Brev
ard
Coun
ty D
ept.
of H
sing
& Hu
man
Ser
vices
– Br
evar
d Cou
ntyHo
mele
ss S
ervic
es N
etwo
rk o
f Cen
tral F
lorid
a -Or
lando
, Osc
eola,
Sem
inole
coun
ties
Coali
tion
for t
he H
omele
ss o
f Pas
co C
nty -
Pasc
o Cnty
Pi
nella
s Cnt
yy Hom
eless
Lea
ders
hipp
Bd –
Pine
llas C
ntyy
Hom
eless
Coa
litio
n of
Hills
boro
ugh
Coun
ty -
Hills
boro
ugh
Cnty
Sunc
oast
Par
tner
ship
to E
nd H
omele
ssne
ss -
Mana
tee
and S
aras
ota co
untie
sCh
arlo
tte C
ount
y Hom
eless
Coa
litio
n -C
harlo
tte C
ounty
C
lli C
t H
& H
l C
liti
CCollie
rCo
llier C
ount
y Hun
ger &
Hom
eless
Coa
litio
n -
lli Cn
tyLe
e Cou
nty D
ept o
f Hum
an S
ervic
es -
Lee C
ounty
High
lands
Cnt
y Coa
litio
n fo
r the
Hom
eless
-De
Soto,
Gl
ades
, Har
dee,
Hend
ry, H
ighlan
ds, O
keec
hobe
e co
untie
sTr
easu
re C
oast
Hom
eless
Ser
vices
Cou
ncil,
Inc.
-Ind
ian R
iver
Martin
St L
ucie
coun
ties
Indian
Rive
r, Ma
rtin, S
t. Luc
ie co
untie
sDi
visio
n of
Hum
an S
ervic
es o
f Palm
Bea
ch C
ount
y -Pa
lm B
each
Cou
ntyBr
owar
d Cn
ty H
omele
ss In
itiat
ive P
artn
ersh
ip
Adm
inist
ratio
n -B
rowa
rd C
ounty
Miam
i-Dad
e Cou
nty H
omele
ss T
rust
-Mi
ami-D
ade
Coun
tyMo
nroe
Cnt
y Hom
eless
Ser
vices
CoC
-Mo
nroe
Co
unty
Flag
ler
Mario
n
Levy
Citru
s
Volu
sia
Sum
ter
Lake
Pasc
o
Hern
ando Hills
boro
ugh
Polk
Sem
inol
e
Oran
ge
Brev
ard
Osce
ola
Mana
tee
Polk
Hard
ee
DeSo
to
Okee
chob
eeIndi
an R
iver
St.
Lucie
High
lands
Sara
sota
De
Soto
Char
lotte Le
e
Glad
es Hend
ry
Marti
n
Palm
Bea
ch
Lake
Okee
chob
ee
Collie
r Br
owar
d
Monr
oeMo
nroe
Da
de
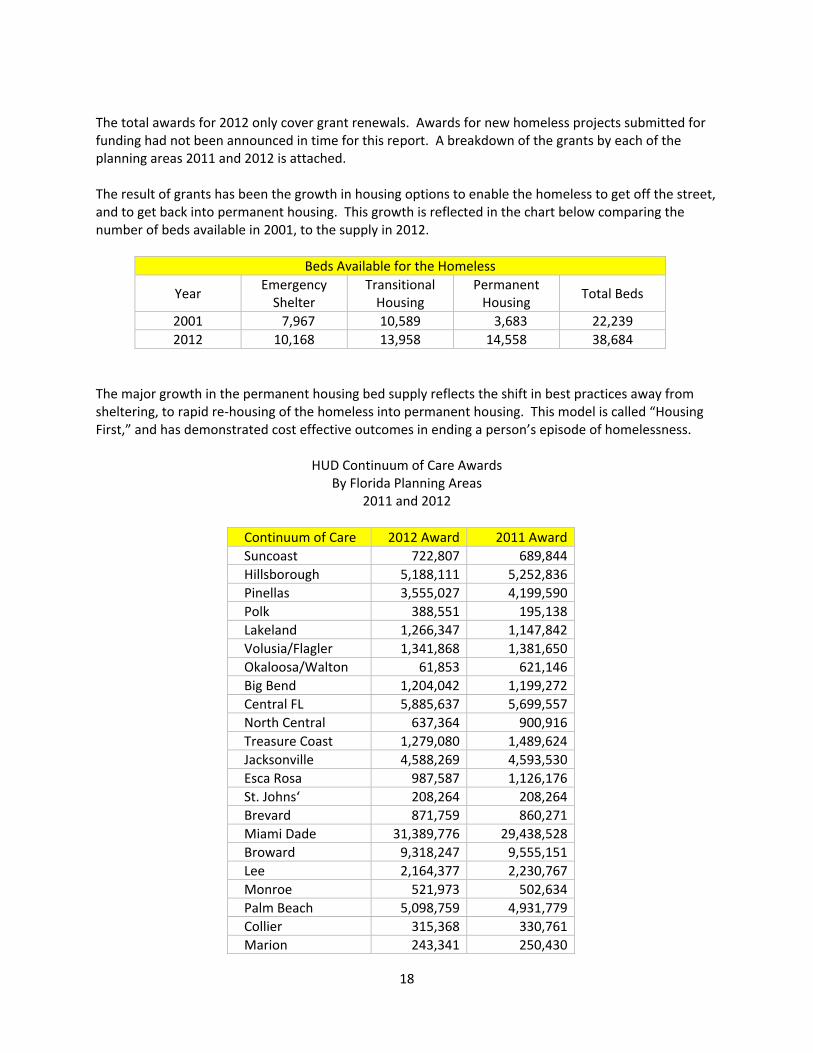
The total awards for 2012 only cover grant renewals. Awards for new homeless projects submitted for funding had not been announced in time for this report. A breakdown of the grants by each of the planning areas 2011 and 2012 is attached.
The result of grants has been the growth in housing options to enable the homeless to get off the street, and to get back into permanent housing. This growth is reflected in the chart below comparing the number of beds available in 2001, to the supply in 2012.
Beds Available for the Homeless
Year Emergency
Shelter Transitional
Housing Permanent
Housing Total Beds
2001 7,967 10,589 3,683 22,239 2012 10,168 13,958 14,558 38,684
The major growth in the permanent housing bed supply reflects the shift in best practices away from sheltering, to rapid re-housing of the homeless into permanent housing. This model is called “Housing First,” and has demonstrated cost effective outcomes in ending a person’s episode of homelessness.
HUD Continuum of Care Awards By Florida Planning Areas
2011 and 2012
Continuum of Care 2012 Award 2011 Award Suncoast 722,807 689,844 Hillsborough 5,188,111 5,252,836 Pinellas 3,555,027 4,199,590 Polk 388,551 195,138 Lakeland 1,266,347 1,147,842 Volusia/Flagler 1,341,868 1,381,650 Okaloosa/Walton 61,853 621,146 Big Bend 1,204,042 1,199,272 Central FL 5,885,637 5,699,557 North Central 637,364 900,916 Treasure Coast 1,279,080 1,489,624 Jacksonville 4,588,269 4,593,530 Esca Rosa 987,587 1,126,176 St. Johns‘ 208,264 208,264 Brevard 871,759 860,271 Miami Dade 31,389,776 29,438,528 Broward 9,318,247 9,555,151 Lee 2,164,377 2,230,767 Monroe 521,973 502,634 Palm Beach 5,098,759 4,931,779 Collier 315,368 330,761 Marion 243,341 250,430
18
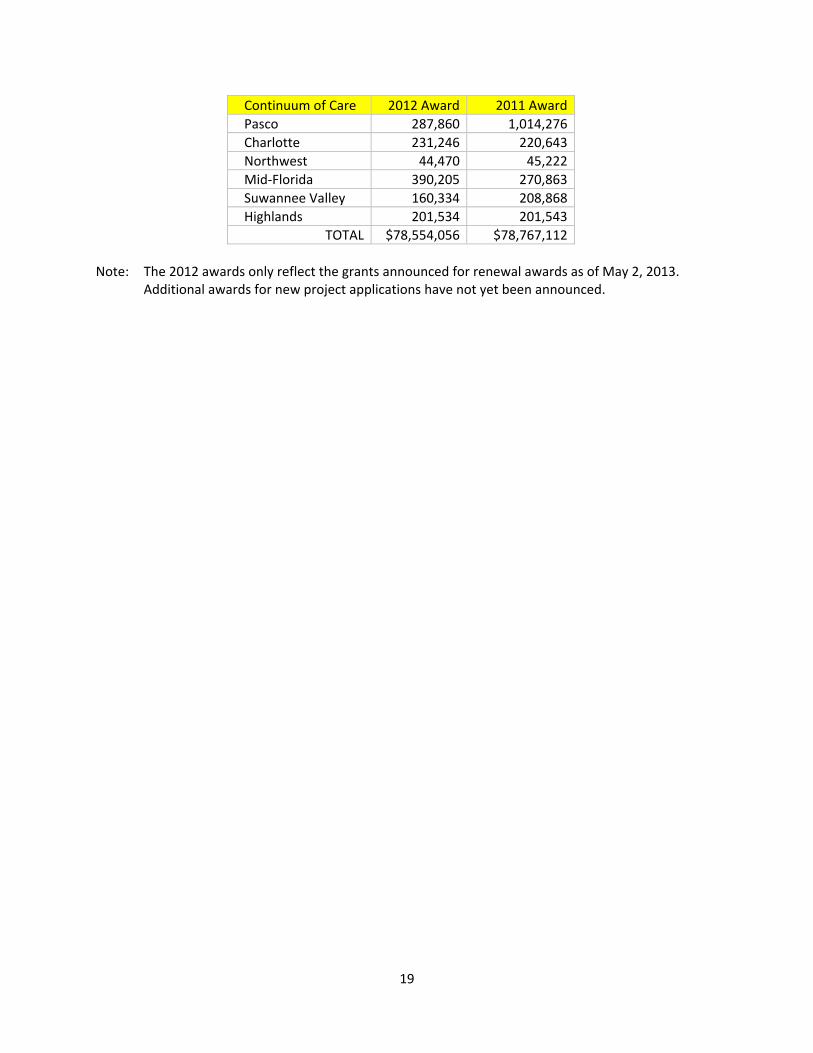
Continuum of Care 2012 Award 2011 Award Pasco 287,860 1,014,276 Charlotte 231,246 220,643 Northwest 44,470 45,222 Mid-Florida 390,205 270,863 Suwannee Valley 160,334 208,868 Highlands 201,534 201,543
TOTAL $78,554,056 $78,767,112
Note: The 2012 awards only reflect the grants announced for renewal awards as of May 2, 2013. Additional awards for new project applications have not yet been announced.
19
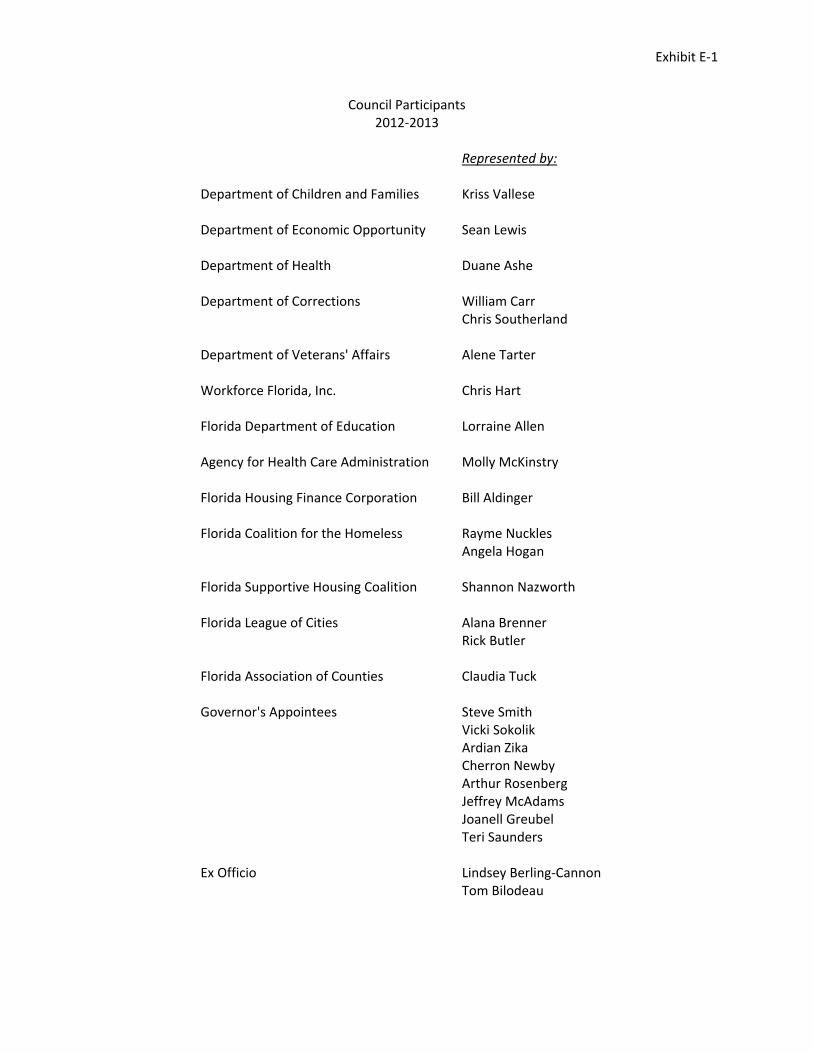
Exhibit E-1
Council Participants 2012-2013
Represented by:
Department of Children and Families Kriss Vallese
Department of Economic Opportunity Sean Lewis
Department of Health Duane Ashe
Department of Corrections William Carr Chris Southerland
Department of Veterans' Affairs Alene Tarter
Workforce Florida, Inc. Chris Hart
Florida Department of Education Lorraine Allen
Agency for Health Care Administration Molly McKinstry
Florida Housing Finance Corporation Bill Aldinger
Florida Coalition for the Homeless Rayme Nuckles Angela Hogan
Florida Supportive Housing Coalition Shannon Nazworth
Florida League of Cities Alana Brenner Rick Butler
Florida Association of Counties Claudia Tuck
Governor's Appointees Steve Smith Vicki Sokolik Ardian Zika Cherron Newby Arthur Rosenberg Jeffrey McAdams Joanell Greubel Teri Saunders
Ex Officio Lindsey Berling-Cannon Tom Bilodeau