Council, 3 December 2014 Professionalism study – final ... · Council, 3 December 2014...
55
Council, 3 December 2014 Professionalism study – final interim report Executive summary and recommendations Introduction Durham University are nearing the end of a research study looking at measuring professionalism. This was a five year study, the first component of which was the published qualitative study which explored the concept and development of professionalism through focus groups and interviews with educators and students. The second stage study involved developing a quantitative tool for measuring professionalism through piloting with two institutions in the paramedic profession. This work is due to conclude in May/June 2015 and the final interim report is appended to note. The anticipated outcomes of the research are a validated tool which can be used by registrants and their employers to explore issues about professionalism. The research is also likely to make a useful contribution to this area, highlighting the benefits and limitations of such tools and the practical barriers to their implementation. This research forms part of a programme of work exploring issues related to continuing fitness to practise. A verbal update about this work was provided at the Council’s away day in October 2014. A paper discussing this area of work, including the context which informs it and the findings to date will be presented at the February 2015 Council meeting. Decision This paper is to note; no decision is required. Background information HCPC (2011). Professionalism in healthcare professionals http://www.hcpc-uk.org/publications/research/index.asp?id=511 Council meeting, May 2013. Revalidation – update and PSA report. http://www.hcpc-uk.org/assets/documents/10003FDDenc06- updateontherevalidationresearchprogramme.pdf 2
Transcript of Council, 3 December 2014 Professionalism study – final ... · Council, 3 December 2014...

Council, 3 December 2014 Professionalism study – final interim report Executive summary and recommendations Introduction Durham University are nearing the end of a research study looking at measuring professionalism. This was a five year study, the first component of which was the published qualitative study which explored the concept and development of professionalism through focus groups and interviews with educators and students. The second stage study involved developing a quantitative tool for measuring professionalism through piloting with two institutions in the paramedic profession. This work is due to conclude in May/June 2015 and the final interim report is appended to note. The anticipated outcomes of the research are a validated tool which can be used by registrants and their employers to explore issues about professionalism. The research is also likely to make a useful contribution to this area, highlighting the benefits and limitations of such tools and the practical barriers to their implementation. This research forms part of a programme of work exploring issues related to continuing fitness to practise. A verbal update about this work was provided at the Council’s away day in October 2014. A paper discussing this area of work, including the context which informs it and the findings to date will be presented at the February 2015 Council meeting. Decision This paper is to note; no decision is required. Background information HCPC (2011). Professionalism in healthcare professionals http://www.hcpc-uk.org/publications/research/index.asp?id=511 Council meeting, May 2013. Revalidation – update and PSA report. http://www.hcpc-uk.org/assets/documents/10003FDDenc06-updateontherevalidationresearchprogramme.pdf
2

Resource implications None Financial implications None Appendices
Durham University (2014). Measuring professionalism as a multi-dimensional construct. Interim report.
Date of paper 19 November 2014
3

Measuring professionalism as a multi‐
dimensional construct
Professionalism and Conscientiousness in Healthcare
Professionals – Study 2
Interim report for the HCPC
September 2014
Dr Madeline Carter
Dr Hannah Hesselgreaves
Dr Bryan Burford
Dr Paul Tiffin
Ms Charlotte Rothwell
Dr Gill Morrow
Prof John McLachlan
Prof Jan Illing
Centre for Medical Education Research
Durham University
Interim report
Centre for Medical Education Research
4

Executive Summary The Health and Care Professions Council (HCPC) commissioned research to investigate professionalism and conscientiousness in healthcare professionals. The study aim was to explore whether a quantitative approach to assessing professionalism could be developed, and to investigate links with the Conscientiousness Index (CI) and the American Board of Internal Medicine (ABIM) scale of professionalism. The objectives addressed in the current report include:
1. To develop a professionalism scale or scales (PS), informed by existing theoretical approaches to professionalism and related constructs such as professional identity.
2. To adapt the Conscientiousness Index (CI) for use with paramedics. 3. To explore the psychometric properties of both the PS and CI, including their concurrent
validity and reliability. 4. To monitor the time costs involved in administering both tools.
Three organisations were involved in this study. Ambulance Trust A, University B and Ambulance Trust C. Questionnaire development: The scale to measure professionalism in paramedics was developed in several phases. Literature on the measurement of professionalism was reviewed and items were generated, informed by findings from the qualitative study. The questionnaire was tested and refined following workshops and piloting of the questionnaire with student paramedics. Key dimensions of professionalism identified during questionnaire development included: professional status, professional identity, attitudes, behaviours, organisational context, and situational awareness. These themes were used to generate and organise 137 candidate items, with the addition of two global items (ABIM, 1995; Papadakis et al, 2008). The draft questionnaire was revised and a 79 item version was developed. The questionnaire included two global items designed to measure overall professionalism, one based on the ABIM nine‐point scale, and one on a relative scale (see Box 1). The other items used a five‐point response scale and covered the following:
• Professional identity • Professional status
o Normative elements such as regulation and social status o Comparative perceived status in relation to other professions
• Adherence to ethical practice principles • Interactions with patients • Interactions with staff • Reliability • Competence, knowledge and improvement • Pride in the profession • Appearance • Flexibility • Behaviour outside work • The organisational context
5

To provide some evidence on the concurrent validity of the questionnaire, and to address the questions of bias arising from an entirely self‐report questionnaire, global ratings of professionalism were also obtained from trainers in both Ambulance Trust A and University B. Conscientiousness Index (CI) data was obtained from Ambulance Trust A and from University B. The CI tool is an objective, behaviourally based measure of conscientious acts, which has been found to correlate with educator and peer ratings of professionalism (McLachlan et al, 2009). The components of the CI are flexible and are tailored to the environment in which it is applied, but it typically includes measures of attendance and punctual submission of work. Data analysis Data analyses were conducted using several statistical software packages. Parallel analysis (adapted for ordinal questionnaire responses) was conducted using Factor (Urbano Lorenzo‐Seva), exploratory and confirmatory factor analyses using MPlus 7.2, and other analyses (descriptives, correlations, regression and t‐tests) were conducted using SPSS v.20. Results A total of 233 new questionnaire responses were obtained. This included 43 responses from Ambulance Trust A and 190 responses from University B. Across the study, 556 questionnaire responses have been collated. All of the students who were present for the teaching sessions in which the questionnaire was distributed agreed to participate. Construct validity and reliability A parallel analysis was conducted to identify the number of dimensions that were present in the dataset, this identified seven dimensions. This guided an Exploratory Factor Analysis (EFA) that was conducted in MPlus to identify the underlying factor structure. Following refinement, a six‐factor solution was identified with satisfactory fit (CFI = 0.913, TLI = 0.905), meaning that the data adequately (statistically) represented the hypothesised model generated by the EFA. This model was tested on new data and also demonstrated satisfactory fit (CFI = 0.916, TLI = 0.909). The EFA and theoretical judgements identified six factors: feeling valued by the public, appropriate behaviours, organisational and professional care, positive/proactive professional behaviours, professional identity and pride, and learning orientation. The internal consistency of the factors identified in the CFA model was tested using Cronbach’s alpha (α). Results show that all factors reached 0.7, the standard threshold for good internal consistency, albeit to one decimal place in the case of some factors. This indicates that the factors formed coherent sub‐scales. All professionalism factors, except organisational and professional care, correlated positively with self‐rated ABIM. This indicated that these factors are relevant to self‐rated global professionalism, and offered evidence of construct validity. There was a weak but significant relationship between self‐rated and trainer‐rated global measures of professionalism. However, when focusing on the extremes of the scale (i.e. high or low professionalism), student self‐ratings could be used to distinguish between students with low versus high levels of professionalism, as rated by the trainer. Scores on the professionalism factors were not related to trainer ratings of overall professionalism. Some discrepancies between trainer ratings and self‐ratings of professionalism were found, suggesting that some students were not accurate in their self‐assessment of professionalism. Other research has also reported evidence of low performers over‐estimating, and high performers under‐estimating, their ability and performance (Kruger & Dunning, 1999).
6

Predictive validity There have been only 4 ‘cases’ identified of individuals who have experienced professional difficulties. Given the low frequency of such cases, this presents a challenge in establishing predictive validity. An earlier interim report for Study 2 (Burford et al, 2013) highlighted this low base rate and indicated that a very large dataset would be required to provide more evidence. This report also highlighted that the influential US study by Papadakis and colleagues (2008) identified 638 cases in a sample of over 66,000 doctors over 16 years. The low prevalence of ‘cases’ is therefore a known challenge when testing the predictive validity of professionalism measures. Conscientiousness Index Organisational differences were evident in the CI results. These were likely due to differences in data quality. Where there were more data points (i.e. more recorded opportunities to display conscientiousness), CI scores were related to both self‐ratings and trainer‐ratings of professionalism. They were also able to differentiate between students rated as high on professionalism and those rated as low on professionalism by trainers. Utility of questionnaire The questionnaire is a self‐report measure and subject to concerns about the accuracy of self‐assessment. Unsurprisingly, no paramedics rated themselves in the unsatisfactory range on the self‐rated ABIM global scale, whereas the trainers used the full range of the scale. There was evidence of a group of questionnaire respondents (n=20) who self‐rated as high on professionalism, but were rated as low by trainers. This particular discrepancy between trainer‐ and self‐rated scores may highlight individuals who are overconfident in comparison to the assessments of their trainers and may indicate a group for further analysis and interest to HCPC. This suggests that the measure developed here may have identified a group for further targeted training. Conversely, there was also a group of respondents who self‐rated as low on professionalism, but were rated as high by trainers (n=27). These inaccuracies in self‐assessment have been observed in other research on the ‘unskilled and unaware’ and on under‐estimation of performance by highly competent individuals (e.g. Kruger & Dunning, 1999). Practical Implications This research has highlighted several important practical implications associated with measuring professionalism using a self‐rated tool, alongside global ratings and CI data. Firstly, the measure of professionalism developed by this research demonstrates potential to identify over‐confident individuals, when concurrent trainer ratings are also captured. This could be used to provide specific feedback for improvement and to target additional training where individuals may not be aware of poor professional practice. During development, the questionnaire has been used to prompt discussion and reflection on professionalism in educational workshops with paramedics. One potential practical application of the tool is in educational settings as a means of self‐reflection and to highlight key issues relating to professionalism. The current form of the self‐report professionalism questionnaire is designed for use with paramedics. However, the questionnaire may be developed in a generic form which could have educational utility in small group learning or CPD, during which the factors may elicit discussion of professional behaviours and situational judgement. This was also borne out in the workshops in the development of the tool. Finally, the collection of CI data has, as discussed in Phase 1, been challenging. The feasibility issues experienced by participating organisations undermine its current potential for use as a measure of professionalism among students. To explore whether CI could reach potential as an objective measure of professionalism, higher quality data may be required (i.e., a greater number of ‘data
7

points’ for each student). The possibility of obtaining a greater number of behavioural episodes (e.g. attendance per day or per lecture) is currently being explored. Conclusion This study reports on the development of a valid and reliable questionnaire for measuring professionalism in paramedics. The tool measures different attitudinal and behavioural dimensions of professionalism, reflecting the breadth of the construct. A six factor model has been identified through factor analysis. The measure presented here demonstrates construct validity, especially in its strong associations with self‐rated professionalism using a global measure. However, interpretation of self‐rated scores on this measure must take account of the anonymous research context, the role of situational judgement, and possible inaccuracies in self‐assessment. Relationships between the questionnaire tool, trainer‐rated professionalism and conscientiousness were also investigated. The questionnaire factors were not related to trainer ratings of professionalism, but two factors (organisational and professional care, positive/proactive professional behaviours) were related to CI scores where data was of higher quality. The nature and quality of CI data and trainer assessment on professionalism in practice require improvement in order to fulfil the potential of a valid concurrent measurement against which to identify low or high levels of professionalism. Future work Research is ongoing and plans for future work include the following activities:
The factor structure presented in this report will be tested in future cohorts and psychometric analyses will continue.
Data collection is ongoing, and collection of further questionnaire, CI and trainer ratings is planned for September 2014 in Ambulance Trust A, and for Autumn 2014 in University B.
A third global rating will be obtained where possible, which will ask trainers to rate their agreement with the following statement: “I believe he/she behaves professionally at all times” using a 5‐point scale ranging from strongly disagree to strongly agree. This global question will also be adapted and added to the student questionnaire.
The possibility of obtaining academic performance measures from University B and outcomes in the early post‐registration years in both organisations is being explored.
Feasibility issues will continue to be monitored.
Data will be checked against any highlighted cases for concern.
Where longitudinal data are available, the development of professionalism over time will be explored.
Workshops will be conducted with a range of professional groups, including Allied Health Professionals, scientists, and social workers to provide face validity for a new, shorter, generic version of the professionalism tool. This tool may have educational utility.
To provide a draft Final Report for comment to HCPC by the end of March 2015.
8

TableofContents
1 Introduction .................................................................................................................................. 11
1.1 Overview of previous work ................................................................................................... 12
1.2 Outline of current report ...................................................................................................... 13
2 Method ......................................................................................................................................... 13
2.1 Questionnaire Design ............................................................................................................ 13
2.2 Trainer ratings of professionalism ........................................................................................ 15
2.3 Conscientiousness Index (CI) ................................................................................................ 15
2.4 Questionnaire distribution .................................................................................................... 16
2.5 Data analysis ......................................................................................................................... 16
3 Results ........................................................................................................................................... 17
3.1 Participants ........................................................................................................................... 17
3.2 Content validity ..................................................................................................................... 17
3.3 Development of a Measurement Model: Factor analysis ..................................................... 17
3.3.1 Parallel Analysis ............................................................................................................. 18
3.3.2 Exploratory Factor Analysis ........................................................................................... 19
3.3.3 Confirmatory Factor Analysis on the ‘training’ dataset (Dataset A) ............................. 19
3.3.4 Confirmatory Factor Analysis on the ‘prediction’ dataset (Dataset B) ......................... 20
3.3.5 Interpretation of factors ............................................................................................... 23
3.3.6 Excluded items .............................................................................................................. 24
3.4 Reliability of sub‐scales ......................................................................................................... 25
3.5 Descriptive statistics and intercorrelations between factors ............................................... 27
3.6 Concurrent validity ................................................................................................................ 28
3.6.1 Concurrent validity of global measures (trainer and student ratings) ......................... 29
3.6.2 Discrepancies between self‐rated and trainer‐rated ABIM .......................................... 31
3.7 Concurrent validity of professionalism factors ..................................................................... 33
3.8 Conscientiousness Index ....................................................................................................... 36
3.9 Regression analyses .............................................................................................................. 39
3.9.1 Prediction of Self‐rated ABIM ....................................................................................... 39
3.9.2 Prediction of Trainer ABIM ........................................................................................... 41
3.9.3 Prediction of CI .............................................................................................................. 43
3.10 Predictive validity: Cases for concern ................................................................................... 44
3.11 Group differences on professionalism measures ................................................................. 46
3.11.1 Student versus qualified paramedics ............................................................................ 46
3.11.2 Gender .......................................................................................................................... 46
3.11.3 Age ................................................................................................................................ 47
3.12 Free text comments .............................................................................................................. 47
9

4 Feasibility ...................................................................................................................................... 49
4.1 Questionnaire ....................................................................................................................... 49
4.2 Conscientiousness Index (CI) ................................................................................................ 49
5 Use of the professionalism tool in education ............................................................................... 50
6 Discussion...................................................................................................................................... 50
6.1 Professionalism factors, global measures and the CI ........................................................... 51
6.2 Challenges in the development of a professionalism measure ............................................ 52
7 Future work ................................................................................................................................... 53
8 Dissemination ............................................................................................................................... 53
9 Conclusion ..................................................................................................................................... 54
10 References ................................................................................................................................ 55
10

HCPC Interim Report 2014
1 Introduction The Health and Care Professions Council (HCPC) commissioned a research project to investigate professionalism and conscientiousness in healthcare professionals. This included: Study 1) a qualitative study to explore the perceptions of professionalism held by healthcare professionals, and Study 2) a quantitative study to investigate the measurement of professionalism in paramedics. This report summarises progress on the quantitative study. Specifically, it describes progress since April 2013 on the development, data collection and analysis of tools designed to measure different aspects of professionalism, including several dimensions that were identified in the qualitative Study 1 (Morrow et al., 2011). While Study 1 considered three professional groups (paramedics, occupational therapists, podiatrists), Study 2 is concerned solely with paramedics. The aim of study 2, as stated in the research protocol, was “To develop a meaningful quantitative approach to assessing professionalism, and to investigate links with the Conscientiousness Index (CI)”. Objectives included:
1. To develop a professionalism scale or scales (PS), informed by existing theoretical approaches to professionalism and related constructs such as professional identity.
2. To adapt the Conscientiousness Index (CI) for use with paramedics. 3. To explore the psychometric properties of both the PS and CI, including their concurrent
validity and reliability. 4. To examine any relationships between the two measures and academic results over the
training course, and with outcomes in the first post‐registration years. 5. To compare the component PS scores of the trainee sample with those of qualified
paramedics, to see which elements of professionalism may develop over time. 6. To monitor the time costs involved in administering both tools.
This report addresses objectives 1, 2, 3, and 6. Comparisons with qualified paramedics (objective 5) were addressed in a previous report (Burford, 2013) and the final report will examine professionalism over time, where multiple questionnaire responses are available. Work is ongoing to obtain academic performance data and outcomes in the early post‐registration years (objective 4). As described in the earlier interim reports on Study 2 (Burford et al, 2011, 2013), there have been issues related to the implementation of the Conscientiousness Index (a measure involving the collation of basic, objective behaviours which may be linked to professionalism, McLachlan et al., 2009). These have included both logistical issues (the workload and feasibility of reliably collecting CI information for all students), and ethical (the feeling of some staff that such monitoring is antithetical to the educator‐student relationship). This has meant that data collection has continued to be somewhat challenging. Some CI data has been collected and is presented here, although several issues remain and are described in the ‘Feasibility’ section. Three organisations were involved in the quantitative part of the study – referred to as Ambulance Trust A, University B and Ambulance Trust C. Some analyses are focused on new data from Ambulance Trust A and University B, obtained since the previous interim report (Burford et al., 2013), but some analyses use the original dataset (described in more detail in Burford et al., 2013) or combine it with the new dataset.
11

The following key can be used to identify which data are used in analyses: Dataset A: Original dataset presented in April 2013. Dataset B: New data collected between December 2013 and March 2014. Dataset AB: All quantitative data collected in Study 2. This dataset has had duplicate data (more
than 1 completed questionnaire from the same individual) removed.
1.1 Overview of previous work Earlier phases of work have been reported in detail elsewhere (Burford et al., 2011; 2013) but are summarised below. A questionnaire to measure professionalism in paramedics was developed in several phases. Firstly, literature on the measurement of professionalism was reviewed alongside findings from the qualitative study. Key dimensions of professionalism which should be incorporated in measures were identified, including: professional status, professional identity, attitudes, behaviours, organisational context, and situational awareness. Professional attitudes and behaviours were organised with reference to the five clusters of professionalism identified by Wilkinson et al. (2009):
Adherence to ethical practice principles
Effective interactions with patients and people important to those patients
Effective interactions with others working in the healthcare system
Reliability
Commitment to autonomous maintenance and continuous improvement of competence Items were also designed to reflect additional themes which were identified in the qualitative study:
Pride in profession
Appearance
Flexibility
Behaviour outside work These themes were used to generate and organise 137 candidate items, with the addition of two global items (ABIM, 1995; Papadakis et al, 2008), for the professionalism questionnaire. These items were reviewed by the research team to eliminate redundant and ambiguous items. Following this process, a first draft questionnaire of 105 questionnaire items (plus demographic questions) was developed for piloting. Two pre‐pilot workshops were conducted with student paramedics to scrutinise the items for clarity, relevance and utility. Following a series of eliminations (some of which were reinstated in the second round workshop), revisions and additions, a questionnaire comprising 102 scale items was prepared for pilot administration. Pilot questionnaire data were collected at University B and, following analysis, the questionnaire was further refined. A version of the questionnaire was developed and tested with 79 items designed to measure professionalism. In addition to the questionnaire, global trainer ratings were collected using adapted versions of the two global ratings used for self‐assessment in the student questionnaire.
12

1.2 Outline of current report This interim report describes ongoing data collection and analysis on the questionnaire, trainer ratings and Conscientiousness Index. The method section outlines questionnaire design, data collection procedures and participants. The results section describes new participants and then reports the findings on assessment of the reliability and validity of the professionalism measures and explores group differences. Feasibility issues are considered, as is the potential use of the questionnaire as an educational tool. Finally, findings are discussed and future work is outlined.
2 Method
2.1 Questionnaire Design Following the analysis reported in the 2013 interim report (Burford et al., 2013), a 79‐item version of the questionnaire was developed. The questionnaire included two global items designed to measure overall professionalism, one rated on a nine‐point response scale with ‘compound anchors’, and one on a relative scale with end‐point and mid‐point anchors (see Box 1):
1. ABIM measure of professionalism with compound anchors (ABIM, 1995; Papadakis, 2008)
2. Professionalism relative to other paramedics
The ABIM measure of professionalism has been used as a rating tool for trainers, but it has not previously been used as a self‐rating instrument. However, its design has a significant drawback: the scale has compound anchors which mean that individuals are rating multiple constructs using the same scale. The ABIM measure rates the constructs of respect, compassion, integrity, honesty, role‐modelling of responsible behaviour, commitment to self‐assessment, willingness to acknowledge errors and consideration for the needs of others in a single scale; whereas raters may, for example, want to rate a student as high in compassion but low on willingness to acknowledge errors. These broad descriptions can conflate interpretations of the numerical components of the scale. This approach is often avoided in questionnaire design because it contains assumptions that each respondent interprets the descriptor similarly and therefore that the descriptors vary in the same way. There is consequently a risk of misrepresenting a respondent’s views. The second scale was included to mitigate some of this risk, and focus the rater on comparing the student with others, rather than a numerical value associated with professionalism.
13

Box 1: Global measures of professionalism
Global measures
1. ABIM scale
Overall, I think my standard of professionalism is…(please circle a number)
1 2 3 4 5 6 7 8 9
‐‐‐‐‐‐‐‐Unsatisfactory‐‐‐‐‐‐‐‐ ‐‐‐‐‐‐‐‐Satisfactory‐‐‐‐‐‐‐‐ ‐‐‐‐‐‐‐‐Superior‐‐‐‐‐‐‐‐
Where unsatisfactory includes: Lacks respect, compassion, integrity, honesty; disregards need for self‐assessment; fails to acknowledge errors; does not consider needs of patients, families, or colleagues; does not display responsible behaviour Superior includes: Always demonstrates respect, compassion, integrity, honesty; teaches/role models responsible behaviour; total commitment to self‐assessment; willingly acknowledges errors; consistently considers needs of patients, families, or colleagues
2. Relative scale Mark the line to indicate where you think your professionalism lies compared to other paramedics you know:
The other 77 professionalism items used a five‐point response scale, either ranging from strongly disagree to strongly agree, or from never to always, with a ‘not applicable’ option. These items were designed to reflect the a priori constructs identified in the literature review and pilot work, including:
Professional identity
Professional status
o Normative elements such as regulation and social status
o Comparative perceived status in relation to other professions
Adherence to ethical practice principles
Interactions with patients
Interactions with staff
Reliability
Competence, knowledge and improvement
Pride in the profession
Appearance
Flexibility
Behaviour outside work
The organisational context
In addition, respondents were asked to provide information about their job or training, experience in
the ambulance service, age and sex, as well as a free text area for further comments.
The professionalism constructs constitute areas which the earlier work suggests may be dimensions of global professionalism. Some are reflections of attitudes and beliefs, some perceptions of behaviour, and one perception of context.
Much lower
Much higher
About the same
14

2.2 Trainer ratings of professionalism To provide some evidence on the concurrent validity of the questionnaire, and to address the questions of bias arising from an entirely self‐report questionnaire, global ratings were also obtained from trainers in both Ambulance Trust A and University B, using the two scales presented in Box 1 , but with the wording adapted from “my professionalism” to “his/her professionalism”. Trainer ratings were obtained from Ambulance Trust B in April and July 2014, and from University B in February 2014. In July 2014, a third scale was added, which asked trainers to rate their agreement with the statement “I believe he/she behaves professionally at all times” on a 5‐point scale ranging from strongly disagree to strongly agree. In this scale, each response has a single anchor (e.g. strongly agree) and the 5‐point scale simplifies responding. The focus of the question is on whether students always exhibit professional behaviour, rather than a more general ‘standard of professionalism’ (which may include attitudes). Ratings were matched by trainers to student responses using the anonymised identifier. One site produced a single rating of each student agreed by consensus between two members of staff, the other provided a single rating from a member of staff who was familiar with all students in a particular year group. One site reported that as their rating on the ABIM scale was based on relative judgments, there was no difference in their use of the scales.
2.3 Conscientiousness Index (CI) Conscientiousness Index (CI) data was obtained from Ambulance Trust A in April and July 2014, and from University B in March 2014. The CI tool is an objective, behaviourally based measure of conscientious acts, which has been found to correlate with educator and peer ratings of professionalism (McLachlan et al, 2009). The components of the CI are flexible and are tailored to the environment in which it is applied, but it typically includes measures of attendance, punctuality in submission of work, and completion of feedback. In the current study, the CI was adapted to the availability and accessibility of data in Ambulance Trust A and University B. The components of the CI were developed in consultation with trainers within each institution. At Ambulance Trust A, two trainers collated CI data using a class register. Attendance during training sessions was routinely‐collected, but data on uniform and punctuality was collected for the purposes of the research. CI data was based on three measures, recorded for each half‐day during training sessions. This produced between 64 and 216 possible data points for each measure (depending on the cohort). The measures included:
1) Attendance: Attendance was recorded for each half‐day of training over the course (length of training course varied by cohort).
2) Punctuality: Punctual arrival was recorded for each half‐day of training. 3) Uniform compliance: Any deviations from full uniform were recorded for each half‐day of
training.
15

At University B, one trainer collated CI data based on four measures. Each measure provided only one data point for the CI. The measures included:
1) Attendance in class: Detailed daily attendance data was not available therefore a significant absence of seven or more sessions per year was recorded.
2) Use of an online learning tool/organiser: Students were expected to login to the online tool. Detailed data on number of logins was not available therefore usage that amounted to less than 50% of the average usage for a given module was recorded.
3) Attendance on campus: Students were expected to ‘swipe in’ to the university monitoring system to indicate their presence on campus. Detailed data were not available therefore a significant absence of three weeks or more without registering presence (no swipe in) was recorded.
4) Late submission of assignments: Data were recorded on assignments which were submitted after the deadline without prior agreement of an extension.
Given the disparity in the total number of CI data points, calculations involving CI were conducted separately for Ambulance Trust A and University B. Furthermore, it is important to note that there were numerous logistical issues and some ethical concerns which acted as barriers to CI data collection. These are described in more detail in the Feasibility section below.
2.4 Questionnaire distribution At University B, the questionnaire was distributed, completed and collected during teaching sessions for Foundation and BSc students in January 2014. At Ambulance Trust A, questionnaires were distributed, completed and collected during teaching sessions for Year 1 and Year 2 students in December 2013 and March 2014. To allow these responses to be linked to CI data and global ratings by trainers, questionnaires included an identifying number which was linked to the student’s name on a cover sheet which was detached and retained by the University/NHS Trust. The questionnaires, which featured the number but no identifying details, were then passed on to Durham University researchers.
2.5 Data analysis Data analyses were conducted using several statistical software packages. Parallel analysis (adapted for ordinal questionnaire responses) was conducted using Factor (Urbano Lorenzo‐Seva), exploratory and confirmatory factor analyses were conducted using MPlus 7.2, and other analyses (descriptives, correlations, regression and t‐tests) were conducted using SPSS v.20. Statistical advice was provided by Dr Paul Tiffin at the School of Medicine, Pharmacy and Health at Durham University.
16

3 Results
3.1 Participants A total of 233 new questionnaire responses were obtained. This included 43 responses from Ambulance Trust A and 190 responses from University B. All of the students who were present for the teaching sessions in which the questionnaire was distributed agreed to participate. The sample includes 120 males (51.5%), 104 females (44.6%) and 9 respondents who did not disclose their gender (3.9%). Figure 1 presents the frequencies of respondents within each age group and shows that the majority of respondents belonged to the younger age categories. Figure 1: Respondent age categories
The sample profile for dataset A was presented in a previous report (Burford et al., 2013).
3.2 Content validity Content validity was established during the development process, which included a review of relevant literature and workshops. This means that the questionnaire items are relevant and meaningful to the respondents and so will gain meaningful responses. It was also assessed by checking for systematic patterns in missing values indicating that some items are not completed and may not yield useful information. Further details are available in a previous report (Burford et al., 2013).
3.3 Development of a Measurement Model: Factor analysis The questionnaire was designed to reflect the multiple dimensions of professionalism that were identified in the literature review, the qualitative analysis from Study 1, and from workshops conducted as part of the development of the tool. However, it is important to establish the construct validity of the questionnaire. Construct validity is the degree to which a measure behaves like the
150
47
20
71
8
0
20
40
60
80
100
120
140
160
18‐24 25‐34 35‐44 45‐54 55 or over Not disclosed
Frequency
Age Group
17

theory says a measure of that construct should behave (Brown, 1996; Cronbach & Meehl, 1955), and is related to the overall validity of the measure. One key pre‐requisite of construct validity is a good measurement model: when the dimensions measured by the questionnaire are understood, then the relationships between the dimensions and key constructs of interest can be examined, and evidence relating to construct validity can be gathered. To test the measurement properties of the questionnaire, a series of analyses were conducted following good practice, as outlined in Brown (2006, see Figure 2). Figure 2: Analyses conducted to develop and test the measurement model An additional aim of the factor analyses was to reduce the number of items in the questionnaire.
3.3.1 Parallel Analysis The purpose of parallel analysis is to identify the maximum number of dimensions (or factors) in a dataset, to guide factor analysis. In the previous interim report (Burford et al., 2013), parallel analysis had identified 12 factors in the original dataset. Following consultation with a psychometrician, this parallel analysis was repeated using Factor version 9.2 (statistical software) using a more robust approach involving polychoric analysis. Attitudinal and behavioural scales, such as those used in the questionnaire, are typically analysed as continuous scales. In polychoric analysis, the data are treated as ordinal rather than interval. With ordinal data, the order of values is meaningful, but the difference between values is not. This means that the analysis recognised that, for example, an ‘agree’ response is between a ‘strongly agree’ response and a ‘neither agree nor disagree’ response; but it did not assume that there was an equal difference between individuals who gave a ‘strongly agree’ and ‘agree’ response and between individuals who gave an ‘agree’ and ‘neither agree nor disagree’ response. This approach reduced the probability of identifying artefactual dimensions in the exploratory factor analysis (EFA).
Parallel analysis on original data
EFA on original data
CFA on original data (used for EFA)
CFA on independent data
Model refinement and fit tests
Final model
18

The parallel analysis found that we should identify no more than seven factors in the EFA, although we can use fewer than seven factors based on theoretical judgement.
3.3.2 Exploratory Factor Analysis Factor analysis is a statistical method used to describe variability among observed, correlated variables. It identifies underlying factors by correlating homogenous items to create new, unobserved variables called factors. It also allows a reduction in the number of items contributing to the identification of a factor, therefore reducing the number of redundant items. Exploratory factor analysis (EFA) is used to identify complex relationships among items that are part of unified concepts. The researcher makes no a priori assumptions about relationships among factors. Following the results of the parallel analysis, an EFA was conducted in MPlus to identify the underlying factor structure of dataset A. Fit refers to how well the hypothesised model reproduces the actual data. A seven‐factor solution was identified with adequate fit (CFI = 0.905, TLI = 0.885). Six‐ and five‐factor solutions were also tested but they demonstrated inferior fit. Items with factor loadings of >0.4 were examined and items which did not meet this criteria were excluded. Crossloadings of items onto multiple factors were examined and the questionnaire was refined further. Factors were checked for theoretical coherence and to ensure coverage of the construct of professionalism.
3.3.3 Confirmatory Factor Analysis on the ‘training’ dataset (Dataset A) Confirmatory factor analysis (CFA) is a theoretically‐driven statistical procedure designed to develop and test measurement models. A CFA tests hypothetical associations between items and factors, as suggested by the outcome of an EFA. During the CFA process, it was important to ensure coverage of the construct of professionalism while still refining the model to maximise fit. Modification indices show the potential improvement in model fit if a particular item is removed or is allowed to correlate with other factors, and therefore may direct the researcher to refine the model. To further refine and test the factor structure underlying the questionnaire, a CFA was conducted on the original dataset. This process tests the interpretation of the EFA using the same dataset (Hurley et al., 1997). Models tested contained no double‐loading indicators and all measurement error was presumed to be uncorrelated. Goodness of fit was assessed using the comparative fit index (CFI), the Tucker‐Lewis index (TLI) and the root mean square error of approximation (RMSEA). Following guidance from (Brown, 2006), satisfactory fit was defined by the following criteria: CFI (≥0.9), TLI (≥0.9), RMSEA (close to ≤0.06). Confidence intervals (90%) around RMSEA, in which the upper limit is close to ≤0.06 are also an indicator of fit.
What does this tell us? Based on the relationships between the items, EFA found that there were seven professionalism factors.
19

The original seven factor solution was submitted to CFA. Model fit statistics fell below the satisfactory standards for model fit as defined by CFI (CFI = 0.66). The comparative fit index (CFI) analyzes the model fit by examining the discrepancy between the data and the hypothesized model, while adjusting for the issues of sample size. CFI values range from 0 to 1, with larger values indicating better fit; a CFI value of .90 or larger is generally considered to indicate acceptable model fit. An iterative process of refining the model on conceptual and statistical grounds and testing for fit was conducted. Firstly, all items with factor loadings of less than 0.45 in the EFA were deleted. This eliminated items with relatively low loadings on their respective factors. In addition, one 3‐item factor was dropped for both statistical and conceptual reasons: two of the item loadings were below 0.45 and the third was borderline at 0.451; and these items did not share a discernable theoretical connection. This resulted in a refined six‐factor model which demonstrated some improvements on model fit indices, but still fell short of adequate standards. Secondly, modification indices were examined to improve model fit. After checking for theoretical importance, three items which had high crossloadings (loadings on more than one factor) were deleted sequentially. The model was tested after each deletion and satisfactory fit was achieved. The possibility of a second‐order ‘g factor’ representing an overall construct of professionalism was also tested, but this did not improve model fit. Model fit statistics with this six‐factor structure with 37 items was satisfactory: CFI = 0.913, TLI = 0.906, RMSEA = 0.059. This model was tested on the new, independent data and satisfactory fit was achieved. However, on examination of the standardized factor loadings for this model, the loading of one item onto the relevant factor fell below desirable levels (<0.3). This item was deleted and re‐tested on the original dataset and model fit remained satisfactory. The final CFA model, original EFA loadings and standardized CFA are presented in Table 1. Model fit for this six‐factor structure with 36 items was satisfactory: CFI = 0.913, TLI = 0.905, RMSEA = 0.060 (90% CI: 0.056‐0.065). With a model structure with many factors, it is important to strike a balance between over‐specifying a model to fit a particular dataset (which would improve model fit) and ensuring that the final factor structure will be generalizable to new datasets. Therefore, adequate model fit was accepted.
3.3.4 Confirmatory Factor Analysis on the ‘prediction’ dataset (Dataset B) The final stage of structure validation involves testing the factor structure on an independent dataset. This is to ensure that the structure generalizes beyond the dataset on which it was developed. Following this protocol, a CFA was conducted on the new dataset (n=195). Any repeat
What does this tell us? Further testing identified the items that best explained professionalism as well as redundant items. By dropping those items that did not contribute significantly, these analyses refined the structure into a six‐factor model with 36 items.
20

respondents (i.e. individuals who had completed questionnaires for both the original and new datasets) were excluded from this analysis. Given the large number of factors, it can be challenging to achieve conventional levels of model fit (Marsh, Hau & Wen, 2004). However, the six‐factor model presented in Table 1 was tested on the new dataset and demonstrated satisfactory model fit: CFI = 0.916, TLI = 0.909, RMSEA = 0.049 (90% CI: 0.042‐0.056). Therefore, the proposed six‐factor structure generalized to an independent dataset with satisfactory fit and was accepted as the final model. Table 1: Final CFA model
Factor and Items EFA
loading
Stzd CFA loading – orig data
Stzd CFA loading – new data
Factor 1: Feeling valued by the public
14.Paramedics are as valued by the general public as fire fighters
0.916 0.910 0.902
15.Paramedics are as valued by the general public as police officers
0.891 0.899 0.928
16.Paramedics are as valued by the general public as nurses 0.812 0.847 0.839
17.Paramedics are as valued by the general public as doctors 0.724 0.781 0.629
Factor 2: Appropriate behaviours
21.It is not always possible to follow codes of conduct to the letterR
0.650 0.611 0.741
22.It is not always possible to follow procedures exactlyR 0.722 0.659 0.777
39.‘Take the mick’/banter with colleagues while they are thereR
0.541 0.584 0.690
40.‘Take the mick’ out of colleagues when they are not thereR 0.538 0.726 0.615
41.Use humour about patients as a way of letting off steam after a jobR
0.527 0.698 0.616
42.Swear around colleaguesR 0.481 0.718 0.528
Factor 3: Organisational and professional care
3.The organisation I work for allows me to be professional 0.460 0.730 0.631
4.The organisation I work for looks after my welfare 0.679 0.830 0.743
5.The organisation I work for is professional 0.658 0.814 0.734
6.Patients are more important than targets to my organisation
0.512 0.651 0.371
29.Feel some patients waste the ambulance service’s timeR 0.708 0.638 0.557
30.See some referrals from other healthcare providers (e.g. GPs, urgent care centres) as a waste of timeR
0.709 0.641 0.409
72.I have a good work/life balance 0.460 0.527 0.387
21

Factor and Items EFA
loading
Stzd CFA loading – orig data
Stzd CFA loading – new data
Factor 4: Positive / proactive professional behaviours
34.Make sure patients understand what is happening 0.484 0.473 0.648
37.Try to take time to reassure patients/their families 0.452 0.588 0.528
51.Approach work in an organised way 0.465 0.480 0.624
63.Take the initiative to improve or correct my behaviour 0.570 0.734 0.657
64.Accept constructive criticism in a positive manner 0.513 0.744 0.521
65.Make sure my uniform is well presented (ironed, shoes polished)
0.486 0.741 0.718
66.Make sure I look clean, tidy and well‐groomed at work 0.640 0.811 0.885
68.Adjust how I speak to different colleagues 0.756 0.443 0.358
69.Tailor information to a patient’s or relative’s needs 0.712 0.424 0.359
Factor 5: Professional identity and pride
7.I think of being a paramedic as ‘a career’, not just a job 0.517 0.754 0.588
18.I feel I represent the ambulance service when I am wearing the uniform in public
0.454 0.588 0.657
19.I try to always act in a manner that brings credit to the profession
0.511 0.695 0.772
73.Being a paramedic is important to me 0.713 0.876 0.884
74.Being a paramedic makes me feel good about myself 0.603 0.903 0.837
Factor 6: Learning orientation
12.It is important that paramedics have their own professional organisations (such as the College of Paramedics)
0.472 0.450 0.442
56.Read books and articles on paramedic practice 0.742 0.760 0.536
57.Attend training which is not mandatory 0.805 0.847 0.704
58.Keep my CPD portfolio up to date 0.585 0.726 0.810
59.Regularly refresh my skills 0.560 0.812 0.729
Note: R identifies items which have been reverse‐scored. EFA loadings=Dataset A, CFA – orig data=Dataset A, CFA – new data=Dataset B
What does this tell us? Our six‐factor model was tested on a different sample of paramedics and the results supported this model. The model’s ability to transfer to the new sample means the six‐factor model is a robust description of professionalism for paramedics.
22

3.3.5 Interpretation of factors Factor labels were derived from interpretation of the items loading onto that factor. Throughout the process of exploratory and confirmatory factor analysis, retained items and factors were assessed according to theoretical criteria to ensure that a broad coverage of the construct of professionalism was retained. Factor 1: Feeling valued by the public Factor 1 includes four items which ask whether paramedics are as valued by the general public as other professionals working in healthcare (doctors, nurses) and the emergency services (fire, police). This suggests that, when compared with other recognised professional groups, individuals who score highly on this factor feel a sense of respect and value from the public. Factor 2: Appropriate behaviours Factor 2 includes six items which represent behaviours that may be perceived as unprofessional by some, such as not always following codes of conduct and swearing around colleagues. These could be considered as ‘borderline behaviours’ but are sometimes seen as acceptable in very particular circumstances. Although an ‘ideal’ professional may not exhibit any of these behaviours, in practice, some of these behaviours do occur and some may reflect cultural norms and/or use of situational judgement. Factor 3: Organisational and professional care Factor 3 includes seven items, four of which refer to perceptions of organisational support for professionalism, the organisation’s concern for individual welfare and work‐life balance. The other three items describe perceptions of the importance of patients over organisational targets and of some patients and referrals being a waste of time (of which two were reverse‐scored). Individuals who score highly on this factor are likely to hold positive perceptions of the organisation and regard all patients and calls as important. This implies that the factor measures perceptions of organisational care for employees and paramedics’ care for patients. Factor 4: Positive/proactive professional behaviours Factor 4 includes nine items which include reference to patient care, being organised, openness to feedback and improving behaviour. This factor also includes items on professional appearance and positive flexible communication with patients and colleagues. Taken together, this factor refers to positive and proactive displays of professionalism, including both verbal and behavioural communication to patients and colleagues. This would include being well groomed and maintaining a professional appearance. Factor 5: Professional identity and pride Factor 5 includes five items related to professional identity and positive associations with the role. This factor primarily measures attitudes describing a positive sense of attachment and belonging to the profession, as well as feeling like a representative of the ambulance service and/or paramedic profession. Factor 6: Learning orientation Factor 6 includes five items relating to learning and maintenance of skills and training, including discretionary activities such as attending non‐mandatory training and reading about paramedic practice. One item also measures the importance placed on being part of a professional body. In the context of this factor, importance given to the existence of a professional body (such as the College of Paramedics) may relate to its role in formalising standards for education and learning. Taken together, these items represent an ongoing commitment to learning.
23

3.3.6 Excluded items Following model testing and refinement, 36 items were excluded from the questionnaire. Items were initially deleted based on the magnitude of their factor loadings from the EFA, then based on the magnitude of their cross‐loading with other factors in the CFA (as identified in the modification indices). The final adjustment to the factor structure was in response to the standardized beta coefficients of the model when tested on independent data. Each deletion was considered according to conceptual criteria as well as statistical criteria. Specifically, the item was examined to assess its theoretical importance, whether it was theoretically related to other items loading on a given factor, whether removal of the item would limit the conceptual breadth of coverage of the questionnaire (e.g. would it eliminate coverage of one of Wilkinson’s five clusters of professionalism), and whether the item was redundant and the concept was represented by other items. This process ensured that key dimensions of professionalism were still represented, to maintain construct validity. Excluded items are presented in Table 2.
What does this tell us? Based on an interpretation of the items and understanding of the professionalism literature, we identified and described six factors of professionalism. These were: feeling valued by the public, appropriate behaviours, organisational and professional care, positive/proactive professional behaviours, professional identity and pride, and learning orientation.
What does this tell us? We excluded 36 items which did not contribute to our model of professionalism, allowing us to reduce the length of the questionnaire.
24

Table 2: Items excluded from the questionnaire
3.4 Reliability of sub‐scales The internal consistency reliability of the factors identified in the CFA model was tested using Cronbach’s alpha (α). Reliabilities are presented in Tables 3 and 4 below.
Deleted from EFA for loading <0.4 Q8. I think paramedics should have to regularly update their skills Q11. Becoming a paramedic requires a high degree of expertise and knowledge Q13. It is important that paramedics are a regulated profession with a protected register Q20. Members of the public expect paramedics to be professional Q24. It is a waste of time to report a minor collision in an ambulance, if there was no damage and no one else was
involved Q25.It is a waste of time reporting a near miss if no one was aware of it and there were no adverse consequences Q26. Sometimes there are good reasons to delay making myself available for the next job after taking a patient to
hospital Q28. If I witnessed a paramedic delivering substandard care, I would report them Q31. Think patients may be responsible for their problems (through alcohol, drug misuse, obesity) Q33. Allow my liking or dislike for patients to affect the way I approach them Q36. Enjoy talking to patients Q38. Disclose personal information about myself to patients Q43. Work well with other healthcare professions, in general Q44. Talk or don’t pay attention during lectures or training courses Q46. Leave station duties for other people Q47. Arrive late for work Q48. Check equipment at the start of a shift Q49. Complete the appropriate paperwork as soon as I am able to, after each job Q52. Think about my next break or end of shift when I am working Q53. Think doing a job ‘well enough’ is acceptable Q54. Feel able to justify my actions/clinical decisions Q61. Get bored in training about non‐clinical elements of practice Q70. Post comments about work on the internet (e.g. Facebook, other social media) Q71. Discuss a bad job with family or friends outside work as a way of coping
Deleted from CFA for high cross‐loadings Q50. Take responsibility for my own work Q60. Feel enthusiastic about going to work Q67. Adjust how I speak to different patients (e.g. how formal to be, vocabulary to use)
Deleted for loading on EFA <0.45
Q9. Paramedics have special qualities which mark them out from other professions Q23. I have occasionally realised after the event that I did not follow the rules regarding informed consent Q27. If I witnessed a paramedic delivering substandard care……I would intervene directly Q32. Treat all patients with respect and sensitivity Q35. Listen carefully to patients’ concerns Q45. Arrive late for training/classes Q55. Act decisively in critical situations Q62. Seek help when I need it
Deleted for loading on CFA <0.4 Q10. The paramedic profession is vital to society
25

Results show that all factors reached 0.7, the standard threshold for good internal consistency reliability, albeit to one decimal place in the case of some factors. This indicates that the factors form coherent sub‐scales. Table 3: Internal consistency reliabilities for factors (Dataset B, n=195)
Factor α
F1: Feeling valued by the public 0.826
F2: Appropriate behaviours 0.742
F3: Organisational and professional care 0.673
F4: Positive/proactive professional behaviours 0.683
F5: Professional identity and pride 0.701
F6: Learning orientation 0.713
Table 4: Internal consistency reliabilities for factors (Dataset AB, n=518)
Factor α
F1: Feeling valued by the public 0.859
F2: Appropriate behaviours 0.742
F3: Organisational and professional care 0.771
F4: Positive/proactive professional behaviours 0.685
F5: Professional identity and pride 0.735
F6: Learning orientation 0.777
What does this tell us? Our factors are reliable in the sense of being internally consistent. This means that individual items in a factor are consistently measuring the same suggested underlying dimension (e.g. learning orientation).
26

3.5 Descriptive statistics and intercorrelations between factors Table 5 presents mean scores, standard deviations, and range of the factors. Each mean factor score has a possible range from 1 to 5. The descriptive statistics indicate that all factors have a reasonable range. Table 5: Descriptive statistics for professionalism factors
Factor n Mean Std Dev Min Max
F1: Feeling valued by the public Total sample Ambulance Trust A University B Ambulance Trust C
517 99 325 93
3.04 2.97 3.14 2.77
1.00 0.98 0.95 1.15
1.00 1.00 1.00 1.00
5.00 5.00 5.00 5.00
F2: Appropriate behaviours A Total sample Ambulance Trust A University B Ambulance Trust C
518 99 326 93
2.97 2.99 3.02 2.75
0.65 0.66 0.64 0.61
1.00 1.33 1.00 1.17
5.00 4.67 4.67 5.00
F3: Organisational and professional care Total sample Ambulance Trust A University B Ambulance Trust C
518 99 326 93
3.26 3.01 3.47 2.76
0.66 0.62 0.57 0.62
1.43 1.43 1.71 1.57
4.86 4.14 4.86 4.00
F4: Positive/proactive professional behaviours Total sample Ambulance Trust A University B Ambulance Trust C
518 99 326 93
4.48 4.44 4.51 4.42
0.34 0.37 0.32 0.37
3.44 3.44 3.44 3.44
5.00 5.00 5.00 5.00
F5: Professional identity and pride Total sample Ambulance Trust A University B Ambulance Trust C
518 99 326 93
4.52 4.49 4.60 4.26
0.49 0.51 0.41 0.62
2.20 2.20 3.20 2.40
5.00 5.00 5.00 5.00
F6: Learning orientation Total sample Ambulance Trust A University B Ambulance Trust C
518 99 326 93
3.79 3.89 3.85 3.45
0.59 0.53 0.52 0.73
1.00 2.40 2.40 1.00
5.00 5.00 5.00 5.00
Dataset AB Table 6 presents the intercorrelations between the six factors, overall and by organisation. The correlation matrix indicates that the factors are related to each other and all of the correlations are statistically significant. This is as expected, given the factors are all designed to measure aspects of professionalism. However, the table shows that there are no very high correlations which would suggest redundancy of factors.
27

Table 6: Intercorrelations between the six factors, overall and by organisation
Factor F1 F2 F3 F4 F5 F6
F1: Feeling valued by the public 1
F2: Appropriate behaviours Total sample Ambulance Trust A University B Ambulance Trust C
.145**.178 .121* .086
1
F3: Organisational and professional care Total sample Ambulance Trust A University B Ambulance Trust C
.298**.272**.244**.405**
.341** .390** .258** .358**
1
F4: Positive/proactive professional behaviours Total sample Ambulance Trust A University B Ambulance Trust C
.111**.058 .109* .101
.235** .328** .215** .167
.206**.272**.197**.040
1
F5: Professional identity and pride Total sample Ambulance Trust A University B Ambulance Trust C
.239**.324**.158**.287**
.183** .176 .118* .228*
.421**.435**.346**.453**
.336** .323** .305** .403**
1
F6: Learning orientation Total sample Ambulance Trust A University B Ambulance Trust C
.133**.297**.074 .050
.218** .332** .128* .189
.249**.356**.197**.096
.385** .284** .389** .452**
.330** .401** .254** .355**
1
Dataset AB, * Significant at 0.05 level, **Significant at 0.01 level
3.6 Concurrent validity Concurrent validity (a form of criterion validity) refers to the extent to which a measure correlates with scores on a related independent measure, when scores on both measures are obtained at the same time. In the current study, there is no ‘true’ measure of professionalism against which to test the student’s global ratings of professionalism or their scores on the professionalism factors. Therefore, trainers were asked to rate the overall professionalism of each student, using the anonymous identifier code. The trainer ratings of global professionalism were used to test for concurrent validity.
What does this tell us? Our six professionalism factors are related to each other, as would be expected, but each factor measures different aspects of professionalism.
28
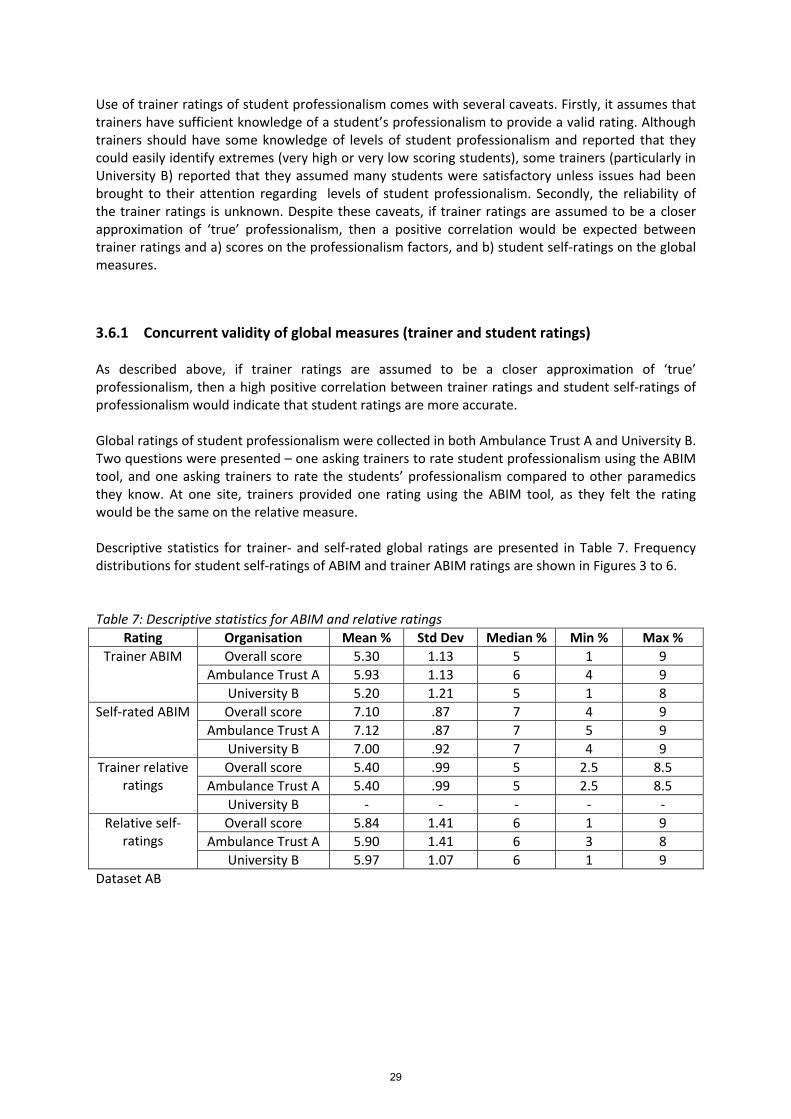
Use of trainer ratings of student professionalism comes with several caveats. Firstly, it assumes that trainers have sufficient knowledge of a student’s professionalism to provide a valid rating. Although trainers should have some knowledge of levels of student professionalism and reported that they could easily identify extremes (very high or very low scoring students), some trainers (particularly in University B) reported that they assumed many students were satisfactory unless issues had been brought to their attention regarding levels of student professionalism. Secondly, the reliability of the trainer ratings is unknown. Despite these caveats, if trainer ratings are assumed to be a closer approximation of ‘true’ professionalism, then a positive correlation would be expected between trainer ratings and a) scores on the professionalism factors, and b) student self‐ratings on the global measures.
3.6.1 Concurrent validity of global measures (trainer and student ratings) As described above, if trainer ratings are assumed to be a closer approximation of ‘true’ professionalism, then a high positive correlation between trainer ratings and student self‐ratings of professionalism would indicate that student ratings are more accurate. Global ratings of student professionalism were collected in both Ambulance Trust A and University B. Two questions were presented – one asking trainers to rate student professionalism using the ABIM tool, and one asking trainers to rate the students’ professionalism compared to other paramedics they know. At one site, trainers provided one rating using the ABIM tool, as they felt the rating would be the same on the relative measure. Descriptive statistics for trainer‐ and self‐rated global ratings are presented in Table 7. Frequency distributions for student self‐ratings of ABIM and trainer ABIM ratings are shown in Figures 3 to 6. Table 7: Descriptive statistics for ABIM and relative ratings
Rating Organisation Mean % Std Dev Median % Min % Max %
Trainer ABIM Overall score 5.30 1.13 5 1 9
Ambulance Trust A 5.93 1.13 6 4 9
University B 5.20 1.21 5 1 8
Self‐rated ABIM Overall score 7.10 .87 7 4 9
Ambulance Trust A 7.12 .87 7 5 9
University B 7.00 .92 7 4 9
Trainer relative ratings
Overall score 5.40 .99 5 2.5 8.5
Ambulance Trust A 5.40 .99 5 2.5 8.5
University B ‐ ‐ ‐ ‐ ‐
Relative self‐ratings
Overall score 5.84 1.41 6 1 9
Ambulance Trust A 5.90 1.41 6 3 8
University B 5.97 1.07 6 1 9
Dataset AB
29

Figure 3: Student ratings of ABIM Figure 4: Student ratings of ABIM by organisation
Figure 5: Trainer ratings of ABIM Figure 6: Trainer ratings of ABIM by organisation
Correlational analyses were conducted to assess the association between student and trainer ratings and are presented in Table 8. Table 8: Correlations (rho) between self‐rated and trainer global ratings of student professionalism
Trainer ABIM
Trainer Relative Measure
Trainer Professional
Behaviours rating
Self‐rated ABIM Total sample Ambulance Trust A University B
0.147** (n=312) 0.085 (n=45)
0.145* (n=267)
‐0.207 (n=45) ‐0.207 (n=45)
‐‐
0.085 (n=22) 0.085 (n=22)
‐‐
Self‐rated Relative Measure Total sample Ambulance Trust A University B
0.145* (n=309) 0.052 (n=46) 0.136*(n=263)
‐0.096 (n=46) ‐0.096 (n=46)
‐‐
‐0.146 (n=22) ‐0.146 (n=22)
‐‐
Dataset AB
0
50
100
150
200
250
1 2 3 4 5 6 7 8 9
Frequency
ABIM score
0
20
40
60
80
100
120
140
1 2 3 4 5 6 7 8 9
Frequency
ABIM score
Ambulance TrustA
University B
0
20
40
60
80
100
120
140
1 2 3 4 5 6 7 8 9
Frequency
ABIM score
0
20
40
60
80
100
120
1 2 3 4 5 6 7 8 9
Frequency
ABIM score
Ambulance Trust A
University B
30

The correlations presented in Table 8 show that there is statistically significant relationship between student self‐ratings and trainer ratings on the ABIM tool, although the association is fairly weak. There is also a fairly weak relationship between the student self‐rating of relative professionalism and the trainer ABIM rating. No statistically significant relationships were found between either of the student self‐ratings and the trainer relative measure or the trainer professional behaviours measure (although data are only available from Ambulance Trust A for these measures). When only new data (dataset B) were tested, there was a significant correlation between the student relative measure and the trainer ABIM measure (rho=0.134, p.046), but no significant associations were found between the remaining global measures. Further analyses were conducted to test whether there was a significant difference on student self‐ratings between those rated as more professional by trainers on the ABIM tool (Trainer ABIM score of ≥6) and those rated as less professional by trainers (Trainer ABIM score of ≤4). Students who were rated as more professional by trainers (high trainer ABIM) had significantly higher self‐ratings on the ABIM tool (mean ABIM self‐rating = 7.18) than students who were rated as less professional by trainers (mean ABIM self‐rating = 6.85): t(197)=2.314, p=0.022. This indicates that the self‐rated ABIM can differentiate between individuals rated as high vs low by trainers on the same measure.
3.6.2 Discrepancies between self‐rated and trainer‐rated ABIM The relatively weak correlation between self‐rated and trainer‐rated ABIM indicated that there were discrepancies between these global ratings. Of particular concern are students who were rated as low on professionalism by trainers but who self‐rated as high. Table 9 below shows the frequencies of individuals who were rated as low on professionalism by trainers (trainer ABIM score between 1 and 4) compared to the rest of the sample (trainer ABIM score between 5 and 9), split by their self‐rating as high (self‐rated ABIM score of 8 or 9) compared to the rest of the sample (self‐rated ABIM score between 1 and 7). Table 9: Frequencies of high individuals with low trainer ABIM and high self‐rated ABIM, compared to rest of sample
Low trainer ABIM (% of total)
High/average trainer ABIM (% of total)
Total (% of total)
Low/average self‐rated ABIM 48 (15.4) 164 (52.6) 212 (67.9)
High self‐rated ABIM 20 (6.4) 80 (25.6) 100 (32.1)
Total 68 (21.8) 244 (78.2) 312 (100.0)
Dataset AB
What does this tell us? Trainer ratings and students’ self‐ratings of professionalism were related, but only weakly. However, when we cut out the middle range of trainer ratings of professionalism and focus on high and low trainer scores, the student self‐rating can distinguish between students given high and low trainer scores.
31

Table 9 shows that 6.4% of the sample were rated as low on professionalism by trainers but rated themselves as high on the global professionalism measure. These individuals are of particular concern as the discrepancy in ratings suggests that they have a lack of awareness of their own deficiencies. This pattern of the ‘unskilled and unaware’ has been observed in other research (e.g., Dunning et al., 2003; Ehrlinger et al., 2008; Kruger & Dunning, 1999). These studies reported that low performers tend to overestimate their performance across a range of cognitive and social domains, whereas top performers tend to underestimate their relative performance. One explanation is that the skills that are required for good performance in a given domain are the same skills that are needed to assess the level of one’s performance in that domain (Dunning et al., 2003). These inaccuracies in self‐assessment for low‐ and high‐performing individuals tend to be more apparent when the domain is broad and ambiguous (Ackerman et al., 2002). Therefore, self‐assessment of the broad, non‐specific domain of professionalism may be prone to inaccuracies. Mean factor scores for individuals with low trainer ABIM and high self‐rated ABIM were compared to the rest of the sample. Results are presented in Table 10 and show that these individuals had significantly higher scores on the factors measuring feeling valued by the public and professional identity and pride. Table 10: Mean factor scores for individuals with low self‐rated ABIM and high trainer‐rated ABIM, compared to rest of sample
Factors Low trainer + High self‐rated ABIM
mean
Mean for rest of sample
t
F1: Feeling valued by the public 3.60 3.03 ‐2.66*
F2: Appropriate behaviours 3.10 2.95 ‐1.00
F3: Organisational and professional care 3.51 3.28 ‐1.20
F4: Positive/proactive professional behaviours 4.56 4.46 ‐1.34
F5: Professional identity and pride 4.81 4.50 ‐3.89*
F6: Learning orientation 3.91 3.78 ‐0.95
* p<.05, Dataset AB Another group of interest were the students who underrated their own levels of professionalism. That is, the 8.7% of students who rated themselves as low on global professionalism, but who trainers rated as high on global professionalism. Table 11 shows the frequencies of individuals who were rated as high on professionalism by trainers (trainer ABIM score between 6 and 9) compared to the rest of the sample (trainer ABIM score between 1 and 5), split by their self‐rating as low (self‐rated ABIM score of 1 to 6) compared to the rest of the sample (self‐rated ABIM score between 7 and 9). As described above, these findings may be explained by the tendency for high performers to underestimate their performance (Kruger & Dunning, 1999). Table 11: Frequencies of individuals with high trainer ABIM and low self‐rated ABIM, compared to rest of sample
Low/average trainer ABIM
(% of total)
High trainer ABIM (% of total)
Total (% of total)
Low self‐rated ABIM 59 (18.9%) 27 (8.7%) 86 (27.6)
High/average self‐rated ABIM 122 (39.1%) 104 (33.3%) 226 (72.4%)
Total 181 (58.0%) 131 (42.0%) 312 (100.0)
Dataset AB
32

Mean factor scores for individuals with high trainer ABIM and low self‐rated ABIM were compared to the rest of the sample. Results are presented in Table 12 and show that these individuals had significantly lower scores on the factor measuring professional identity and pride. Table 12: Mean factor scores for individuals with low self‐rated ABIM and high trainer‐rated ABIM, compared to rest of sample
Factors High trainer + Low self‐rated ABIM
mean
Mean for rest of sample
t
F1: Feeling valued by the public 2.81 3.10 1.46
F2: Appropriate behaviours 2.77 3.00 1.87
F3: Organisational and professional care 3.33 3.29 ‐0.34
F4: Positive/proactive professional behaviours 4.42 4.50 1.20
F5: Professional identity and pride 4.30 4.55 2.82*
F6: Learning orientation 3.66 3.80 1.25
* p<.05, Dataset AB
3.7 Concurrent validity of professionalism factors Table 13 presents the correlations between the professionalism factors, trainer global ratings and CI percentages, overall and by organisation (Ambulance Trust A and University B). Although the correlations for the total sample are presented, there are differential relationships between measures in the different organisations. Therefore, relationships were examined separately for the two organisations. As expected, there were several positive correlations between the professionalism factors and the self‐rated ABIM measure. Statistically significant correlations were found between self‐rated ABIM and factor 2 (Appropriate behaviours), factor 4 (Positive/proactive professional behaviours), factor 5 (Professional identity and pride) and factor 6 (Learning orientation) across both organisations. There was also a positive correlation between self‐rated ABIM and factor 1 (Feeling valued by the public) in University B. These positive relationships indicate that students who had higher scores on these professionalism factors tended to score themselves as higher on the ABIM global self‐rating of professionalism. This suggests that the professionalism factors are measuring constructs which are related to a student’s self‐rating of overall professionalism.
What does this tell us? There were discrepancies between student and trainer ratings, suggesting that some students were poor at self‐assessment. Of greatest concern were the 6.4% of students who had rated themselves as high on professionalism, whereas the trainers rated them as low on professionalism. There was also a group of 8.7% of students who rated themselves as low on professionalism, but who the trainers had rated as high on professionalism.
33

No significant associations were detected between scores on factor 3 (Organisational and professional care) and self‐rated ABIM in either organisation. This may be because perceptions that the organisation supports professionalism and cares for patients may not be closely related to an individual’s construction of their own professionalism. The professionalism factors, as self‐rated by students, did not correlate significantly with trainer ratings (trainer ABIM or the trainer relative measure) of professionalism. This may reflect the well‐established finding that self‐assessment of performance is frequently inaccurate (Ehrlinger et al., 2008; Kruger & Dunning, 1999). One exception was factor 3 (Organisational and professional care), which was positively related to trainer ratings in Ambulance Trust A, but negatively related to trainer ratings in University B. The positive relationship found in Ambulance Trust A suggests that students who believe that patients do not waste service time, and who believe that the organisation is more supportive, tend to be rated as being more professional by trainers. The negative correlation between factor 3 and trainer ABIM in University B is more difficult to explain, as it suggested that students who believe that the organisation is more supportive and who do not think some patients waste their time tend to be rated as less professional by trainers. On closer examination of the items loading onto factor 3, it may be that they are less relevant to paramedic students in a university setting, as their views of the organisation (presumably the university) are less relevant to their professional practice as a paramedic. Another possible interpretation is related to this: if students are rating “the organisation” as their employing organisation, as the items intends, the rating expertise of students in a university setting may be limited by less exposure to professional practice settings than those in Ambulance Trust A. This may also explain the negative relationship between Factor 3 and self‐rated ABIM global scores in University B, where the “other paramedics” known to them, against which they score, may be other students not observed by the student rater in a practice setting. Student expertise as raters of professional practice is an area for further exploration, especially in light of the marginal internal consistency of Factor 3.
What does this tell us? The factors are measuring relevant aspects of professionalism, most of which are related to students’ self‐ratings of overall professionalism. This contributes to the validity of the measure.
What does this tell us? Student ratings on the professionalism factors were not related to trainer‐ratings of their overall professionalism.
34

Table 13: Correlations between professionalism factors, global measures (trainer and student) and CI percentage, overall and by organisation
Measure Self‐rated ABIM Self‐rated Relative
Trainer ABIM Trainer Relative
Trainer Professional Behaviour
CI%
F1 Total sample Ambulance Trust A University B
0.106* (n=501) 0.143 (n=95)
0.116* (n=313)
0.095 (n=383) 0.225 (n=60) ‐0.007 (n=307)
‐0.011 (n=326) ‐0.098 (n=48) 0.025 (n=278)
‐0.180 (n=48) ‐0.180 (n=48)
‐‐
‐0.403 (n=22) ‐0.403 (n=22
‐‐
‐0.114 (n=233) ‐0.170 (n=43) ‐0.091 (n=190)
F2 Total sample Ambulance Trust A University B
0.193** (n=502) 0.202* (n=95) 0.230** (n=314)
0.056 (n=384) ‐0.030 (n=60) 0.028 (n=308)
‐0.105 (n=327) ‐0.208 (n=48) ‐0.098 (n=279)
0.004 (n=48) 0.004 (n=48)
‐‐
0.017 (n=22) 0.017 (n=22)
‐‐
0.004 (n=233) ‐0.029 (n=43) 0.022 (n=190)
F3 Total sample Ambulance Trust A University B
0.030 (n=502) 0.095 (n=95) 0.055 (n=314)
‐0.004 (n=384) 0.163 (n=60)
‐0.158** (n=308)
‐0.130* (n=327) 0.205 (n=48)
‐0.142* (n=279)
0.310* (n=48) 0.310* (n=48)
‐‐
0.423* (n=22) 0.423* (n=22)
‐‐
‐0.197** (n=233) 0.296 (n=43) ‐0.122 (n=190)
F4 Total sample Ambulance Trust A University B
0.291** (n=502) 0.272** (n=95) 0.267** (n=314)
0.065 (n=384) ‐0.112 (n=60) 0.108 (n=308)
0.062 (n=327) 0.157 (n=48) 0.060 (n=279)
0.201 (n=48) 0.201 (n=48)
‐‐
0.316 (n=22) 0.316 (n=22)
‐‐
‐0.145* (n=233) 0.313* (n=43) ‐0.160* (n=190)
F5 Total sample Ambulance Trust A University B
0.238** (n=502) 0.303**(n=95) 0.247** (n=314)
0.108* (n=384) 0.377** (n=60) 0.005 (n=308)
0.004 (n=327) 0.237 (n=48) ‐0.047 (n=279)
0.247 (n=48) 0.247 (n=48)
‐‐
0.211 (n=22) 0.211 (n=22)
‐‐
‐0.056 (n=233) 0.250 (n=43) ‐0.139 (n=190)
F6 Total sample Ambulance Trust A University B
0.149** (n=502) 0.265** (n=95) 0.172** (n=314)
0.261** (n=384) 0.307* (n=60) 0.188** (n=309)
0.088 (n=327) 0.207 (n=48) 0.053 (n=279)
0.155 (n=48) 0.155 (n=48)
‐‐
0.203 (n=22) 0.203 (n=22)
‐‐
0.076 (n=233) 0.369* (n=43) ‐0.029 (n=190)
Dataset AB
35

3.8 Conscientiousness Index Conscientiousness Index (CI) data was obtained from both Ambulance Trust A and University B, although the type and quality of the data varied by organisation. As described in the Methods section, three types of data (attendance, punctuality and uniform compliance) were collected over many sessions at Ambulance Trust A. Therefore, the CI score is based on multiple behavioural episodes. At University B, four types of data (attendance in class, use of an online learning tool, attendance on campus and late submission of assignments) were collected, but threshold criteria were set (e.g. one point was deducted if the student had been absent more than seven times over a year). Therefore, at University B, the CI score is based on only four data points and it does not have the same granularity as a measure based on multiple behavioural episodes. As CI data from Ambulance Trust A and University B are substantially different, analyses were conducted separately for each organisation. Descriptive data are presented in Table 14. Table 14: Descriptive statistics for CI data, by organisation
Organisation Mean % Std Dev Median % Min % Max %
Ambulance Trust A 99.29 0.99 100.0 96.35 100.0
University B 76.71 14.33 75.0 25.0 100.0
Dataset AB Figures 7 and 8 present the frequency distributions for CI scores (percentages) in both organisations. In Ambulance Trust A, it is clear that many students have a perfect CI score of 100% but there is range of scores from 96.4 to 99.5%. In University B, the majority of students have a CI score of 75%. Figure 7: Frequency distribution of CI scores at Ambulance Trust A
0
5
10
15
20
25
Frequency
CI Percentage
36

Figure 8: Frequency distribution of CI scores at University B
Correlations between CI, trainer global ratings, student global ratings and the professionalism factors are presented in Table 15. At Ambulance Trust A, CI scores show a strong positive correlation with trainer ABIM ratings and the trainer rating of whether the student exhibits professional behaviour at all times. That means that students who demonstrate more conscientious behaviours on an objective measure (CI) tend to be rated as more professional by trainers. Similarly, CI scores are positively related to self‐rated ABIM ratings, suggesting that students who attend training, are punctual and comply with uniform regulations tend to rate themselves as more professional than students who do not demonstrate these conscientious behaviours. At Ambulance Trust A, CI score was positively related to professionalism factors 4 (positive/proactive professional behaviours) and 6 (learning orientation). These relationships indicate that students who display more conscientious behaviours self‐report that they act professionally and keep their knowledge and skills up to date. CI score was also correlated at borderline levels of significance (p=0.054) with factor 3 (organisational and professional care). At University B, CI scores correlated (albeit weakly) with trainer ABIM rating but did not correlate significantly with student global ratings. The correlation between CI and trainer ABIM suggests that, like Ambulance Trust A, students who demonstrate conscientious behaviours are rated as more professional by trainers. None of the correlations between CI scores and the professionalism factors reached significance at University B, with the exception of factor 4 (positive/proactive professional behaviours) which demonstrates a weak negative relationship. This suggests that students who score lower on an objective measure of conscientious behaviours (CI) tend to rate themselves higher on a measure of demonstrating positive professional behaviours. This unexpected relationship may indicate issues with CI data quality in University B. However, when taken together with the lack of relationship between CI and student global ratings at University B it may be also indicate some disconnect between demonstrating professional behaviours in paramedic practice (e.g. effective
0
20
40
60
80
100
120
140
25 50 75 100
Frequency
CI Percentage
37

communications with patients, well‐groomed appearance) and conscientious behaviours in an academic environment (e.g. using online learning tools). Table 15: Correlations between CI, trainer global ratings, student global ratings and the professionalism factors, by organisation
CI (Ambulance Trust A) CI (University B)
Self‐rated ABIM 0.336* (n=42) 0.092 (n=183)
Self‐rated Relative 0.070 (n=43) 0.021 (n=180)
Trainer ABIM 0.502** (n=43) 0.150* (n=190)
Trainer Relative 0.276 (n=43) ‐‐
Trainer Professional Behaviour 0.618** (n=22) ‐‐
F1 ‐0.170 (n=43) ‐0.091 (n=190)
F2 ‐0.029 (n=43) 0.022 (n=190)
F3 0.296 (n=43) ‐0.122 (n=190)
F4 0.313* (n=43) ‐0.160* (n=190)
F5 0.250 (n=43) ‐0.139 (n=190)
F6 0.369* (n=43) ‐0.029 (n=190)
* Significance level <.05, ** Significance level <.01, Dataset AB To test whether the CI scores were significantly different for students rated as low on the ABIM professionalism measure by trainers (with a score of 4 or less) and students rated as high on the ABIM measure by trainers (with a score of 6 or more), the sample was split and a t‐test was conducted to compare CI scores for the two groups. Given the differences in the range of CI scores between Ambulance Trust A and University B, these analyses were conducted separately for the two organisations. In Ambulance Trust A, the CI scores were significantly higher for individuals who had been rated as high on the ABIM tool by trainers compared to those who had been rated as low on the ABIM tool: t(24) = 7.30, p<.001. In University B, there was no statistically significant difference between CI scores for individuals rated as low on the ABIM measure by trainers compared to high on the ABIM measure: t(116) = 1.77, p=.08. These results suggest that the CI scores can be used to differentiate between students who are rated by trainers as high versus low on a global professionalism measure in Ambulance Trust A, but not at University B. The lack of a significant difference at University B may be, in part, due to the poorer quality of the CI data and issues with the trainer ratings, discussed in the Feasibility section.
What does this tell us? The utility of CI depended on the quality of the CI data. When there was higher quality CI data, CI was related to trainer‐ratings and self‐ratings of overall professionalism.
38

3.9 Regression analyses Linear and logistic regression analyses were conducted to test whether the professionalism factors predicted the global measures of professionalism.
3.9.1 Prediction of Self‐rated ABIM The six professionalism factors were regressed onto the global ABIM self‐rating. Results indicated that, taken together, the six factors accounted for 13% of the variance in the ABIM self‐rating (R2=0.131, p<.001). Therefore, the professionalism factors predicted a significant amount of the variance in ABIM self‐ratings, but there remains a considerable portion of unexplained variance, suggesting that there are other influences on the ABIM measure that are not captured in this model. Table 16 presents the coefficients from separate regression analyses, along with the results of significance tests. Larger standardized beta coefficients indicate which variables have a greater influence on the ABIM measure. Results indicate that scores on feeling valued by the public, appropriate behaviours, positive/proactive professional behaviours, professional identity and pride, and learning orientation have a significant influence on ABIM self‐ratings. Table 16: Coefficients for ABIM self‐rating regressed onto professionalism factors
Predictor variables Standardized Beta Coefficient
t Significance
F1: Feeling valued by the public 0.109 2.45 0.015
F2: Appropriate behaviours 0.203 4.64 <0.001
F3: Organisational and professional care 0.040 0.89 0.376
F4: Positive/proactive professional behaviours 0.286 6.68 <0.001
F5: Professional identity and pride 0.231 5.31 <0.001
F6: Learning orientation 0.149 3.38 0.001
Dataset AB
3.9.1.1 Logistic Regression Although conducting linear regression is a conventional approach to exploring the concurrent validity of scales for the prediction of related measures (e.g. global ABIM), this approach has some issues in relation to these criterion measures. Global items (particularly trainer ratings) often do not discriminate well in the middle range of the distribution, although they tend to identify individuals at the extremes. This was evident in the global self‐ratings, which tended to cluster together, and the majority rated themselves as 7 or 8 on the 9‐point ABIM measure (see Figure 3). This may be problematic for linear regression, which uses the range of scores on the global measures. To address some of these concerns, logistic regression was conducted to test whether the professionalism factors could predict whether an individual was rated as low or high on global professionalism, by themselves (ABIM self‐rating) and by trainers (trainer ABIM, reported in the ‘Prediction of Trainer ABIM section below). For the prediction of low or high self‐rated ABIM, the sample was split into two groups. Examination of the frequency graph (see Figure 3) showed that the majority rated themselves as 7 on a 9‐point scale, and the lowest self‐rating was 4. Therefore, ‘low self‐rated ABIM’ was defined as self‐rating as
39

6 or lower, and ‘high self‐rated ABIM’ was defined as self‐rating as 8 or 9 on the self‐rated ABIM. These categories excluded individuals who self‐rated as 7. The predictor variables included all six professionalism factors. Due to the correlation between predictors, they were tested separately in univariate logistic regression analyses and odds ratios were calculated. Predicting low self‐rated professionalism Table 17 presents the odds ratios for the factors predicting self‐rated low professionalism. Table 17: Odds ratios for factors predicting self‐rated low professionalism
Factor Odds Ratio Sig
F1: Feeling valued by the public 0.774 0.033
F2: Appropriate behaviours 0.437 <0.001
F3: Organisational and professional care 0.987 0.939
F4: Positive/proactive professional behaviours 0.098 <0.001
F5: Professional identity and pride 0.306 <0.001
F6: Learning orientation 0.514 0.002
Dataset AB The results indicate that all of the factors, except organisational and professional care, significantly predict global self‐ratings of low professionalism. The odds ratios show that, on average:
For every one point increase in the factor score on feeling valued by the public, the odds of being self‐rated as low on global professionalism decrease by 23%.
For every one point increase in the factor score on appropriate behaviours, the odds of being self‐rated as low on global professionalism decrease by 56%.
For every one point increase in the factor score on positive/proactive professional behaviours, the odds of being self‐rated as low on global professionalism decrease by 90%.
For every one point increase in the factor score on professional identity and pride, the odds of being self‐rated as low on global professionalism decrease by 69%.
For every one point increase in the factor score on learning orientation, the odds of being self‐rated as low on global professionalism decrease by 49% (i.e, the odds are roughly halved for every point on the factor).
Predicting high self‐rated professionalism These analyses were repeated to predict high levels of self‐rated global professionalism. Results are presented in table 18. Table 18: Odds ratios for factors predicting self‐rated low professionalism
Factor Odds Ratio Sig
F1: Feeling valued by the public 1.291 0.033
F2: Appropriate behaviours 2.290 <0.001
F3: Organisational and professional care 1.014 0.939
F4: Positive/proactive professional behaviours 10.199 <0.001
F5: Professional identity and pride 3.272 <0.001
F6: Learning orientation 1.944 0.002
Dataset AB
40

The results indicate that all of the factors, except organisational and professional care, significantly predict global self‐ratings of high professionalism. The odds ratios show that, on average:
For every one point increase in the factor score on feeling valued by the public, the odds of being self‐rated as high on global professionalism increase by 29%.
For every one point increase in the factor score on appropriate behaviours, the odds of being self‐rated as high on global professionalism increase by 130%.
For every one point increase in the factor score on positive/proactive professional behaviours, the odds of being self‐rated as high on global professionalism increase by 1020%. That is, the odds increase by 10 times.
For every one point increase in the factor score on professional identity and pride, the odds of being self‐rated as high on global professionalism increase by 227%.
For every one point increase in the factor score on learning orientation, the odds of being self‐rated as high on global professionalism increase by 94%.
3.9.2 Prediction of Trainer ABIM The six professionalism factors were regressed onto the global trainer ABIM. Results indicated that, taken together, the six factors accounted for only 6.3% of the variance in the trainer ABIM (R2=0.063, p=0.002). As with the ABIM self‐rating, the professionalism factors predicted a significant amount of the variance in trainer ABIM ratings, but there remains a considerable portion of unexplained variance, suggesting that the trainer ABIM measure is influenced by other factors that are not captured in this model. Table 19 presents the coefficients from separate regression analyses, along with the results of significance tests. Results indicate that scores on appropriate behaviours and organisational and professional care have a significant influence on trainer ABIM. Table 19: Coefficients for trainer ABIM regressed onto professionalism factors
Predictor variables Standardized Beta Coefficient
t Significance
F1: Feeling valued by the public 0.006 0.11 0.910
F2: Appropriate behaviours ‐0.129 ‐2.34 0.020
F3: Organisational and professional care ‐0.138 ‐2.51 0.013
F4: Positive/proactive professional behaviours 0.071 1.29 0.199
F5: Professional identity and pride 0.025 0.44 0.658
F6: Learning orientation 0.091 1.65 0.100
Dataset AB
What does this tell us? Taken together, these results demonstrate the importance of five of the professionalism factors for the prediction of both low and high self‐rated ABIM, specifically: feeling valued by the public, appropriate behaviours, positive/proactive professional behaviours, professional identity and pride, and learning orientation.
41

3.9.2.1 Logistic Regression As described above, using multiple linear regression for the prediction of trainer global ratings can be problematic. Trainer global ratings in particular may be useful for identifying extremes of high or low professionalism, but they do not typically differentiate well in the middle of the range. This was supported by feedback from trainers, who indicated that most students were assigned a middle range rating, unless the trainers were aware of them being particularly low or high on professionalism (e.g. the student had been brought to their attention because they were performing poorly). Examination of the frequency graph (see Figure 5) also shows that the majority of students received a trainer rating of 5 or 6 (on a 9‐point scale). For the prediction of low or high trainer ABIM, the sample was split into two groups. The trainers rated most students as 5 on a 9‐point scale, and they used the full range of the scale. Therefore, ‘low trainer ABIM’ was defined as a rating of 4 or lower, and ‘high trainer ABIM’ was defined as rating of 6 or higher on the trainer ABIM measure. These categories excluded individuals who were rated as 5. Predicting low trainer‐rated professionalism Logistic regression was conducted to predict the probability that the trainer rated a student as low on the global professionalism measure (trainer ABIM). As before, the predictor variables included all six professionalism factors, tested in univariate logistic regression analyses. Table 20 presents the odds ratios for the factors predicting low trainer ABIM scores. Table 20: Odds ratios for factors predicting low trainer ABIM
Factor Odds Ratio Sig
F1: Feeling valued by the public 1.054 0.722
F2: Appropriate behaviours 1.601 0.051
F3: Organisational and professional care 1.645 0.061
F4: Positive/proactive professional behaviours 0.617 0.275
F5: Professional identity and pride 1.148 0.693
F6: Learning orientation 0.704 0.201
Dataset AB The results indicated that the factor measuring appropriate behaviours predicted trainer ratings of low professionalism (albeit to two decimal places). However, the odds ratios suggest that higher scores on this factor are related to being rated as low on professionalism by trainers. The odds ratios show that, on average, for every one point increase in the factor score on appropriate behaviours, the odds of being rated by trainers as low on global professionalism increase by 60%. This may be related to the use of situational judgement in ‘borderline’ situations and adaptability to cultural norms. None of the remaining five factors significantly predicted trainer ratings of low professionalism. Predicting high trainer‐rated professionalism These analyses were repeated to predict high levels of trainer‐rated global professionalism (ABIM scores). Results are presented in table 21.
42

Table 21: Odds ratios for factors predicting high trainer‐rated ABIM
Factor Odds Ratio Sig
F1: Feeling valued by the public 0.948 0.722
F2: Appropriate behaviours 0.625 0.051
F3: Organisational and professional care 0.608 0.061
F4: Positive/proactive professional behaviours 1.621 0.275
F5: Professional identity and pride 0.871 0.693
F6: Learning orientation 1.421 0.201
Dataset AB The odds ratios indicate that, on average, for every one point increase in the factor score on appropriate behaviours, the odds of being rated by trainers as high on global professionalism decrease by 37%. The other factors do not significantly predict the odds of trainers rating an individual as low on global professionalism.
3.9.3 Prediction of CI The six professionalism factors were regressed onto the CI score. Results indicated that these variables accounted for 10.3% of the variance in the CI score (R2=0.103, p<0.001). However, a considerable portion of variance in CI scores remains unexplained, suggesting that there are other influences on the CI score measure that are not captured in this model. The six professionalism factors were regressed separately onto the CI score to obtain standardized beta coefficients, presented in table 22. Results indicate that factors measuring organisational and professional care and positive/proactive professional behaviours have a significant influence on CI scores. Table 22: Coefficients for CI regressed onto professionalism factors
Predictor variables Standardized Beta Coefficient
t Significance
F1: Feeling valued by the public ‐0.090 ‐1.38 0.170
F2: Appropriate behaviours 0.016 0.248 0.805
F3: Organisational and professional care ‐0.218 ‐3.39 0.001
F4: Positive/proactive professional behaviours ‐0.162 ‐2.50 0.013
F5: Professional identity and pride ‐0.069 ‐1.06 0.292
F6: Learning orientation 0.062 0.947 0.344
Dataset AB
What does this tell us? These results demonstrate the importance of measuring ‘appropriate behaviours’ for the prediction of trainer ratings of professionalism.
43

3.9.3.1 Logistic Regression Logistic regression was applied to the prediction of low and high CI scores at University B only. Given the differences in the CI measure at Ambulance Trust A and University B, CI data was considered separately by organisation, but insufficient data was available at low and high levels of CI at Ambulance Trust A. Therefore only analyses on University B data (where CI data quality is poorer) are presented. For the prediction of low or high CI scores, the sample was split into two groups. Examination of the frequency graph (Figure 8) showed that most students had a CI score of 75%. Therefore, ‘low CI’ was defined as a CI of 25% or lower, and ‘high CI’ was defined as a CI of 100%. Results indicated that none of the odds ratios were statistically significant. This suggests that the professionalism factors were not able to predict high vs low CI scores.
3.10 Predictive validity: Cases for concern If the professionalism scales measure relevant constructs, then it would be expected that students who have been identified as ‘cases for concern’ would have lower professionalism scores on the range of measures. University B anonymously identified six students who had experienced some issues with their academic or paramedic practice, by supplying their ID code. These codes were checked for evidence of lower professionalism scores on the student and trainer global ratings, CI score and professionalism factors. These analyses act as useful checks of the validity of the measures, but the numbers are too small to conduct statistical analyses or draw any conclusions. Of the six students identified, data are held on four. This indicates that these two students were not present in the lectures in which the questionnaire was administered. Results are presented in table 23.
What does this tell us? There is some evidence that organisational and professional care and positive/proactive professional behaviours have a significant influence on CI scores, but CI data quality may have affected the ability of further analyses to detect whether CI could be predicted by the professionalism factors.
44

Table 23: Cases for concern analysis
Student A Student B Student C Student D Mean values for University
B
Description of issue(s)
Failed to attend lectures and placement. Repeating first year.
Failed to attend lectures. Repeating first year.
Practice concerns
Weak student, failed most elements of university modules and has placement practice issues
Self‐rated ABIM
7 6 8 Missing data 6.99
Self‐rated Relative
5 6 7 Missing data 5.97
Trainer ABIM 2 1 3 2 5.20
CI 25% 50% 75% 75% 76.71%
F1 4.00 3.25 4.50 2.00 3.14
F2 4.17 3.67 4.00 4.35 3.02
F3 3.71 4.43 3.86 4.00 3.47
F4 4.33 4.44 4.78 5.00 4.51
F5 4.00 4.20 5.00 4.60 4.60
F6 3.20 4.20 4.25 4.80 3.85
Dataset AB Student self‐ratings (on ABIM and relative measures) remain around the University mean. Trainer ratings, however, are much lower, as expected. The CI scores for the two students who failed to attend lectures and/or placements (students A and B) are lower than the University mean. However, students C and D who had more performance issues (practice concerns and failed placements) had higher CI scores, more in line with the University average. This may reflect the objective nature of CI data promoting the feature of availability of data, rather than its quality and ability to identify poor levels of professionalism. All students scored higher on factor 2 (appropriate behaviours) which in these four examples, indicates that the students were less accepting of borderline behaviours. Across the other factors, means were generally in line with the University average, with the exception of Student D, who scored much higher on factor 6 (learning orientation). This may reflect an individual difficulty with the course and/or placement, as the student tries to project professional attitudes and behaviours towards learning, in spite of poor performance. These difficulties and poor performance may explain the especially low ratings of perceived value by the public (Factor 1) which may reflect low levels of confidence and feeling of worth of this individual. These cases indicate that the factors, the CI data and student global ratings are less indicative of concern than trainer ratings, although trainer ratings may be influenced by their knowledge of poor performance and attendance.
What does this tell us? Overall, the trainer ratings appear to be more indicative of issues than the professionalism factors, self‐rated global professionalism and the CI. However, it may be that trainers provided their ratings after issues with these students were evident.
45

3.11 Group differences on professionalism measures A factorial multivariate analysis of variance (MANOVA) was conducted to test for group differences on the self‐rated ABIM measure and the professionalism factors between student and qualified paramedics, between males and females, and between different age groups. The MANOVA included seven dependent variables (DVs: the ABIM global measure and the six professionalism factors) and three independent variables (IVs: student/qualified, gender and age). The MANOVA detected a significant multivariate effect for all three IVs: student/qualified, Wilks’ Lambda= 0.893, F(7,440)=7.55, p<0.001; gender, Wilks’ Lambda= 0.943, F(7,440)=3.79, p=0.001; and age, Wilks’ Lambda= 0.911, F(28,1587.87)=1.49, p=0.048. These results indicated that scores on the DVs varied depending on the level of the IVs. No significant interactions were found between IVs. As a follow up to the multivariate test, univariate analyses (analysis of variance, ANOVAs) were conducted to identify differences on the DVs. These are described below. At the univariate level, the Bonferroni correction was applied to adjust for multiple comparisons. Therefore the alpha level used to establish statistical significance (typically 0.05) was divided by the number of comparisons (7), so p=0.05/7=0.007.
3.11.1 Student versus qualified paramedics Univariate analyses found that student paramedics tended to score more highly than qualified paramedics on four factors:
F1: Feeling valued by the public, F(1,446)=8.62, p=0.003.
F2: Appropriate behaviours, F(1,446)=11.32, p=0.001.
F3: Organisational and professional care, F(1,446)=26.64, p<0.001.
F6: Learning orientation, F(1,446)=18.77, p<0.001.
Means for student and qualified paramedics on these factors is presented in Table 24 below. Table 24: Factor means for student and qualified paramedics
Factor Student Mean Qualified Paramedic Mean
F1: Feeling valued by the public 3.42 2.88
F2: Appropriate behaviours 3.20 2.74
F3: Organisational and professional care 3.35 2.72
F6: Learning orientation 4.00 3.56
Dataset AB
3.11.2 Gender Univariate analyses found that females tended to score higher than males on two factors, although the difference was detected at borderline levels of significance for factor 4:
F2: Appropriate behaviours, F(1,446)=7.64, p=0.006.
F4: Positive/proactive professional behaviours, F(1,446)=7.37, p=0.007. Means for male and female paramedics on these factors is presented in Table 25 below.
46

Table 25: Means by gender
Factor Male Mean Female Mean
F2: Appropriate behaviours 2.94 3.06
F4: Positive/proactive professional behaviours
4.43 4.53
Dataset AB
3.11.3 Age Univariate analyses detected a difference across the age groups on factor 2 (appropriate behaviours): F(4,446)=3.90, p=0.004. However, post hoc pairwise comparisons of age groups did not find that any particular age group tended to score higher than another on factor 2. The mean scores for factor 2 in different age groups are presented in Table 26. The means show a trend towards higher scores among older age groups, but tests of statistical significance did not detect a difference between any specific comparisons. Table 26: Factor 2 means by age group
Age group F2 Mean
18‐24 2.76
24‐34 2.94
35‐44 2.85
45‐54 3.19
55 and over 3.50
Dataset AB
3.12 Free text comments All paramedic questionnaire respondents were asked for additional comments about issues of professionalism. Many comments from the new questionnaire data can be categorised into the two distinct themes identified in the previous report (Burford et al, 2013): value perceived of the profession and perceptions of training. However, when taken in light of the new factors identified from confirmatory factor analysis, more nuanced interpretations are possible. For example, a third theme is identified which describes problems in self‐assessing professional behaviour as students.
What does this tell us? Student paramedics tended to have higher scores than qualified paramedics on four professionalism factors, and females tended to have higher scores than male paramedics on two factors. No strong differences due to age were detected.
47

Perceived value of the profession from patients The first relates to respondent experiences and descriptions of professional value, both from the public and from their employing organisation. Some suggested that the professional classification of the ambulance service as an essential service rather than an emergency service devalued the profession from the perspective of patients, and this in turn affected public knowledge about how the service should be used appropriately.
“If the home secretary refers to the professional as ambulance driver, how can we expect the public to be aware of our level of medical knowledge in order to use the service appropriately?”
Items relating to patients’ use of the service are included in Factor 3. Perceived value of the profession from the employing organisation Similar to free text reports from previous datasets, further comments in the new data referred to perceptions of mismanagement of working patterns, rotations, the supply of appropriate uniforms, and tight turn‐around times which may act as proxies to feeling low organisational support.
“Often the hairpin turn‐around times do not leave time to take care of needs and has made it harder to complete necessary breaks.”
Such perceptions may be related to feelings of low organisational support for professional behaviours (for example, ensuring paramedics are well presented and feel resourced to take on necessary tasks). Items relating to paramedic perceptions of the organisational support and care are included in Factor 3. Problems with self‐assessing professional behaviour as students Some students commented that being removed from the practice setting may alter their ratings of professionalism. In particular, students felt less expert as raters on questions about the employing organisation.
“Not employed by service as a student paramedic so it is difficult to answer some questions.” Factor 3 included some items where respondents were asked to rate perceived support from their employing organisation, as well as provide judgements about their organisations’ value of patients (e.g. item 6). Moreover, students may not interpret their placement Trust as an employer, therefore, not provide scores that reflect their own personal professional attitudes about being a professional practitioner.
“I attend work placements with an ambulance trust… I am not employed by the service therefore do not work for them.”
This semantic difference may offer some explanation for items in Factor 3 where the “The organisation I work for…” or “my organisation”, or “service” (items 3‐6) relates to organisations about which students feel they are poor raters. A further interpretation is that student raters may be using their University, training provider, or another unknown organisational body as their reference for these items.
48

Balancing practical learning with assessment Students expressed a preference for learning through experience and practical training over classroom‐based teaching and assessment. Preparation for practice, it is perceived, is best acquired through a more integrated learning model, which balances assessment with learning clinical skills.
“I personally feel that as a student paramedic, exam boards… are more focused on students passing OSCEs and exams as opposed to actually learning clinical skills…”
A further comment highlighted the powerful learning opportunities provided through observation of supervisor behaviours on placement, especially when unprofessional behaviours are exhibited.
4 Feasibility
4.1 Questionnaire Observations of questionnaire administrations with student paramedics indicated that completion of the questionnaire took approximately 10 minutes and no more than 20 minutes. The new, shortened version is likely to take considerably less time to complete. With regard to use of the questionnaire tool for summative purposes, or use in a non‐anonymised context, it may be that student paramedics would feel less able to respond honestly to some items, particularly items asking about borderline/appropriate behaviours. There may be scope to use the questionnaire for formative purposes, potentially as part of a broader teaching session on professionalism (see section 5).
4.2 Conscientiousness Index (CI) Obtaining data for the CI has proved to be challenging on several grounds. Some of these concerns were summarised in an earlier Interim Report (Burford et al., 2011), and included both logistical and ethical issues. The CI was originally designed to be based on a simple collation of existing data. Data for CI use should include data that is routinely collected by the organisation and the CI score should be derived from the low‐burden exercise of collating data across sources. However, when applied to Ambulance Trust A and University B and, there have been several difficulties in obtaining CI data. In Ambulance Trust A, some trainers routinely used an attendance register, although others did not. For the purposes of the research, all trainers maintained a register for each half‐day session. This included 3 dichotomous yes/no ratings of attendance, punctuality and uniform compliance. Prior to CI data collection, trainers had agreed on the criteria for punctuality and uniform compliance. However, upon completion of data collection, discussions with trainers indicated that there may have been some subjectivity in ratings. For example, one trainer reported that they marked students as late if they arrived any time after the start of a teaching session regardless of the reason, whereas another trainer reported that students who were late due to known issues (such as major traffic
49

delays) were not marked as late in the register. These issues are problematic for CI, as the aim of the CI tool was to offer an objective measure of behaviours. In University B, the first batch of CI data was received in March 2014. Trainers reported that the process of data collation had been time‐consuming and had taken approximately 6‐7 hours (although this time calculation would also include linking data to ID codes). This had been challenging in the context of a heavy workload. Furthermore, obtaining the data itself had been difficult and only four data points were available (see section 2.3 for details). This was in contrast to published examples of CI use which had many more data points, often with attendance as a large component. In University B, attendance was reduced to a single dichotomous measure (a significant absence or 7 or more sessions). The possibility of obtaining a greater number of behavioural episodes (e.g. attendance per day or per lecture) is currently being explored. The feasibility of collecting data from portfolios was also investigated in Ambulance A, but there were no clear objective behaviours that could be easily scored within the parameters of the CI and portfolios of paper documents were not easily accessible.
5 Use of the professionalism tool in education There is considerable interest in professionalism among educators and employers, including in how to teach professionalism and encourage professional behaviours. In response to a request from Ambulance Trust A, the professionalism questionnaire was used as part of a broader workshop on professionalism in paramedics. Student paramedics were given a brief introduction to the research study and completed the questionnaire. They then participated in an interactive workshop on professionalism, delivered by the research team with input from the paramedic trainers. The workshop session included a discussion of the key components of professionalism, examples of professional and unprofessional behaviours, and important themes that emerged from the qualitative data collected for Study 1. These themes included situational awareness, professional attitude towards patients, challenges to professionalism, organisational support for professionalism, uniform and appearance, and representing the ambulance service. Feedback from trainers was positive and they reported that the workshop provided the opportunity for them to raise issues related to professionalism, including concerns related to appearance and use of equipment in training.
6 Discussion The aim of the study was to develop a meaningful quantitative approach to assess professionalism, and to investigate links with the Conscientiousness Index (CI) and the ABIM measure of global professionalism. The questionnaire was developed following a review of the literature and qualitative research with paramedics and it was revised following workshops with student paramedics. The constructs identified represent the range of professionalism domains used by paramedics and other healthcare professionals. Therefore the questionnaire reflects a definition of professionalism that is meaningful to paramedics.
50

The new professionalism measure, developed specifically for paramedics, consists of six factors: feeling valued by the public, appropriate behaviours, organisational and professional care, positive/proactive professional behaviours, professional identity and pride, and learning orientation.
These factors represent the broad construct of professionalism and include dimensions measuring attitudes, behaviours and identity, which are reflected in the professionalism literature. The questionnaire presented here contributes to this field of literature by collecting these different facets of professionalism into a single measure which has been submitted to a rigorous analytical process and shows some evidence of validity and reliability.
6.1 Professionalism factors, global measures and the CI The professionalism factors demonstrated some important associations with other measures of professionalism. Firstly, all professionalism factors, except organisational and professional care, correlated positively with self‐rated ABIM. This indicated that these factors are relevant to self‐rated global professionalism, and offered evidence of construct validity. Five of the professionalism factors were identified as particularly important for the prediction of self‐rated global scores of professionalism in logistic regression analyses. Factors measuring feeling valued by the public, appropriate behaviours, positive/proactive professional behaviours, professional identity and pride, and learning orientation predicted both low and high levels of self‐rated professionalism. The factor measuring positive/proactive professional behaviours was particularly important for the prediction of self‐rated global professionalism. The factor measuring appropriate behaviours correlated with low and high trainer ratings of global professionalism, although not in the expected direction. Individuals who self‐reported that they were high on the appropriate behaviours factor were more likely to be rated as low on professionalism by trainers. This may reflect the well‐established finding that under performers are often unable to self‐assess accurately and tend to over inflate their ability (Kruger & Dunning, 1999). Furthermore, the trainer ratings themselves may not capture several facets of professionalism that contribute to an individual’s self‐rating. For example, it is likely that trainers may be less aware of a student’s level of self‐assessed professional identity and pride or how valued they feel by the public, which represent more attitudinal measures. The self‐rated and trainer‐rated ABIM measures were correlated, although the relationship was fairly weak. The self‐rated ABIM scores were able to differentiate between students who were rated as low vs high on the trainer ABIM, offering some evidence of concurrent validity. Organisational differences were evident in the CI results. In Ambulance Trust A, CI was positively correlated with self‐rated and trainer‐rated ABIM, and with factors measuring positive/proactive professional behaviours and learning orientation. In University B, CI correlated with trainer ABIM although this relationship was fairly weak. CI scores were able to differentiate between high vs low professionalism students, as rated by trainers, in Ambulance Trust A but not in University B. These differences may be due to the difference in the quality of CI data, which was higher for Ambulance Trust A, and perhaps a level of disconnect between professionalism in paramedic practice and conscientious behaviours in an academic setting.
51

6.2 Challenges in the development of a professionalism measure Several challenges have emerged during the development of the questionnaire and the CI, some pertaining to the construct of professionalism and its measurement, others to feasibility issues. This study has attempted to develop a valid and reliable measure of professionalism for paramedics that captures the breadth of professionalism as a construct, including attitudinal, behavioural, and identity facets. However, developing a tool that adequately represents all forms of professionalism, as well as the nuances of professional behaviour such as situational judgement, can be challenging. Professionalism itself is not a static construct; it relies on appraisal of circumstances and adaptability to the needs of the situation. Therefore, even if self‐ratings were ‘true’, they may only be so in certain circumstances. Using multiple measures, including the questionnaire presented here, as well as objective measures and ratings from multiple sources, may achieve a more comprehensive understanding of professionalism in paramedics. The questionnaire is a self‐report measure and it will be subject to concerns about the accuracy of self‐assessment. Unsurprisingly, no paramedics rated themselves in the unsatisfactory range on the self‐rated ABIM global scale, whereas the trainers used the full range of the scale. It is well known that under performers are often not able to self‐assess accurately and tend to over inflate their ability. In support of this, there was evidence of a group of questionnaire respondents who self‐rated as high on professionalism, but were rated as low by trainers. Trainer ratings (and others) were used to test for concurrent validity, however trainer ratings are also an imperfect measure of professionalism. Trainer ratings typically identify extremes (high/low professionalism) but are poorer at discriminating in the mid‐range. Also, when rating large groups (as in University B), trainers may be less familiar with levels of professionalism among ratees. It is also likely that some facets of professionalism may be more observable than others to trainers. The questionnaire includes items which represent ‘borderline behaviours’ which may be perceived as unprofessional by some (e.g. “It is not always possible to follow codes of conduct to the letter”). In workshops, these items generated debate and are perhaps one of the most important areas for investigation. Such items must be carefully worded to minimise socially desirable responses in which paramedics provide the socially acceptable answer rather than an honest response. Related to this point and the issue of utility is the context in which the questionnaires were completed. Given the research context, respondents were assured of anonymity. If the questionnaire is used in practice, it will be important to consider whether paramedics will answer honestly if the questionnaire is not anonymous. One of the global professionalism items used in the study is the published ABIM tool, adapted for self‐ratings and trainer ratings. This measure has ‘compound anchors’ – each end of the scale has a number of descriptors. This approach is often avoided in questionnaire design because it may conflate different constructs and beliefs, and contains assumptions that each descriptor varies in the same way. There is consequently a risk of misrepresenting a respondent’s views. The second relative professionalism scale was included to address this problem. A third global measure has recently been added which will be tested in future cohorts. Another objective was to adapt the CI for use with paramedics. This was achieved at both Ambulance Trust A and University B, but the quality of the CI data varied. At Ambulance Trust A, the CI data was based on numerous behavioural episodes (the CI contained between 64 and 216 data points, depending on the cohort) and the correlation between CI and trainer global ratings was stronger. At University B, the availability of data was limited and the CI was based on only 4 data
52

points. The data for the CI was not readily available at either organisation: it was collected as part of a training attendance register at Ambulance Trust A, and was collated across multiple sources with considerable staff time implications at University B.
7 Future work Research is ongoing and plans for future work include the following activities:
The factor structure presented in this report will be tested in future cohorts and psychometric analyses will continue.
Data collection is ongoing, and collection of further questionnaire, CI and trainer ratings is planned for September 2014 in Ambulance Trust A, and for Autumn 2014 in University B.
A third global rating will be obtained where possible, which will ask trainers to rate their agreement with the following statement: “I believe he/she behaves professionally at all times” using a 5‐point scale ranging from strongly disagree to strongly agree. This global question will also be adapted and added to the student questionnaire.
The possibility of obtaining academic performance measures from University B and outcomes in the early post‐registration years in both organisations is being explored.
Feasibility issues will continue to be monitored.
Data will be checked against any highlighted cases for concern.
Where longitudinal data are available, the development of professionalism over time will be explored.
Workshops will be conducted with a range of professional groups, including Allied Health Professionals, scientists, and social workers to provide face validity for a new, shorter, generic version of the professionalism tool. This tool may have educational utility.
To provide a draft Final Report for comment to HCPC by the end of March 2015.
8 Dissemination Since the last interim report, findings from the qualitative research (Study 1) have been published in Medical Education (a peer‐reviewed journal): Burford, B, Morrow, G, Rothwell, C, Carter, M & Illing, J (2014). Professionalism education should reflect reality: findings from three health professions. Medical Education 48: 361‐374. In addition, initial findings from in the last interim report on Study 2 have been disseminated via an oral presentation at an international medical education conference: Carter M, Burford B, Rothwell C, Morrow G, McLachlan J, Hesselgreaves H, Illing J. (2014, May). Measuring professionalism in paramedics. Oral presentation at the Ottawa medical education conference, Ottawa, Canada.
53

9 Conclusion This study reports on the development of a valid and reliable questionnaire for measuring professionalism in paramedics. The tool measures different attitudinal and behavioural dimensions of professionalism, reflecting the breadth of the construct. A six factor model has been identified through factor analysis. The measure presented here demonstrates construct validity, especially in its strong associations with self‐rated professionalism using a global measure. However, interpretation of self‐rated scores on this measure must take account of the anonymous research context, the role of situational judgement, and possible inaccuracies in self‐assessment. Relationships between the questionnaire tool, trainer‐rated professionalism and conscientiousness were also investigated. The questionnaire factors were not related to trainer ratings of professionalism, but two factors (organisational and professional care, positive/proactive professional behaviours) were related to CI scores where data was of higher quality. The nature and quality of CI data and trainer assessment on professionalism in practice require improvement in order to fulfil the potential of a valid concurrent measurement against which to identify low or high levels of professionalism.
54

10 References ABIM. Project Professionalism. 1995. Available from: http://www.abimfoundation.org/en/Resource‐Center/Bibliography/~/media/Files/Resource%20Center/Project%20professionalism.ashx Ackerman PL, Beier ME, Bowen KR. (2002). What we really know about our abilities and knowledge. Personality and Individual Differences, 33, 587‐605. Arnold, L. (2002). Assessing Professional Behavior: Yesterday, Today, and Tomorrow. Academic Medicine. 77 6:502‐515. Bentler, 1990 – check ref from Brown book p.87; Hu & Bentler, 1999; Brown, 2006). Brown, J. D. (1996). Testing in language programs. Upper Saddle River, NJ: Prentice Hall Regents. Brown, TA. (2006). Confirmatory factor analysis for applied research. New York: Guilford. Burford B, Carter M, Morrow G, Rothwell C, Illing J, Mclachlan J. Professionalism and conscientiousness in healthcare professionals. Progress report for Study 2 – Development of quantitative approaches to professionalism. April 2011. Report to Health Professions Council. Burford B, Carter M, Morrow G, Rothwell C, McLachlan J, Illing J. (April 2013). Development of a questionnaire to explore professionalism as a multi‐dimensional construct. Professionalism and Conscientiousness in Healthcare Professionals – Study 2. Interim report for the HCPC.
Cronbach, L. J.; Meehl, P.E. (1955). Construct Validity in Psychological Tests. Psychological Bulletin 52: 281–302. doi:10.1037/h0040957. Dunning D., Johnson K, Ehrlinger J, Kruger J. (2003). Why people fail to recognize their own incompetence. Current Directions in Psychological Science, 12(3), 83‐87. Ehrlinger J, Johnson K, Banner M, Dunning D & Kruger J. (2008). Why the unskilled are unaware: Further explanations of (absent) self‐insight among the incompetent. Organizational Behavior and Human Decision Processes, 105, 98‐121. Hurley A, Scandura T, Schriesheim C, Brannick M T, Seers A, Vendenberg R J, Williams L J. (1997). Exploratory and confirmatory factor analysis: guidelines, issues, and alternatives. Journal of Orgainsational Behaviour 18: 667‐683. Kruger J & Dunning D. (1999). Unskilled and unaware of it: How difficulties in recognizing one’s own incompetence lead to inflated self‐assessments. Journal of Personality and Social Psychology, 77 (6), 1121‐1134. Marsh, H W, Hau K, Wen Z. (2004). In search of golden rules: comment on hypothesis‐testing approaches to setting cutoff values for fit indexes and dangers in overgeneralising Hu and Bentler’s (1999) findings. Structural Equation Modelling: A Multidisciplinary Journal, 11:3, 320‐341. McLachlan JC, Finn G, Macnaughton J. (2009).The conscientiousness index: A novel tool to explore students’ professionalism. Academic Medicine, 84: 559‐565
55

Morrow G, Burford B, Rothwell C, Carter M, McLachlan J, Illing J. Final report for Study 1 – Perceptions of Professionalism. Report for the Health Professions Council, April 2011. [http://www.hcpc‐uk.org/assets/documents/10003771Professionalisminhealthcareprofessionals.pdf] Papadakis MA, Arnold GK, Blank LL, Holmboe ES, Lipner RS. (2008). Performance during Internal Medicine Residency Training and Subsequent Disciplinary Action by State Licensing Boards. Annals of Internal Medicine. 1478:870‐6 Wilkinson TJ, Wade WB, Knock LD. (2009). A blueprint to assess professionalism: results of a systematic review. Academic Medicine, 84(5):551‐8
56