Cotton Physiology TodayKater Hake, Cotton Physiology Education Program - National Cotton Council.)...
4
PHYSIOLOGY TODAY Newsletter of the Cotton Physiology Education Program — NATIONAL COTTON COUNCIL Plant Mapping as a Management Tool (This newsletter is extracted from the Beginning Plant Map Program developed by Kater Hake, Tom Kerby, Fred Bourland and Johnie Jenkins. Copies of this free mapping program are available upon request from Kater Hake, Cotton Physiology Education Program - National Cotton Council.) Upland cotton's unique growing pattern of nodes and branches allows determination of the age of each square or boll, based solely on that fruit's location in the plant. This feature is the basis for plant mapping and allows its use as a management tool. If we know a boll's location, we can predict its bloom date, maturity date, or when that fruit is no longer Boll Weevil bait. Plant mapping has developed throughout the Cotton Belt as a research tool to quantify fruit development and retention. From this extensive body of knowledge has come our current understanding of the importance of specific fruiting positions, namely the first position fruit on the bottom 10 fruiting branches. The degree and type of shed at these key fruiting positions affects many management decisions: such as plant growth regulators, intensity of pest control, irrigation, fertilization, harvest-aid timing and yield prediction. A mid-bloom plant map can indicate if continued square protection or nitrogen fertilization is justified. For example, a late July field with 7 to 8 nodes above the 1 st position white bloom and 75% boll retention below that white bloom would have the potential to set additional bolls and produce a bumper crop. Further square protection and N fertilization might well be war- ranted. Plant mapping also teaches producers and consultants the observation skills to read the plant, even when they do not have time for a complete plant map. The Beginning Plant Mapping Program The Cotton Physiology Education Program has released a Beginning Plant Map Program that is designed to be self explanatory, with instructions and diagrams at each stage. Field Notes are used to collect the data in the field. Back at the office the data is transferred to Summary Sheets. Interpretation Sheets provide you the criteria needed to evaluate a field's performance. A reasonable estimate of the time re- quired to map a field with the Beginning Plant Map is 10 to 20 minutes including plant collection and data recording. The Beginning Plant Map Program is to be used for management decisions during the growing season. Each plant stage from pre-squaring to late Technical Services, January 1990 bloom is mapped with separate field sheets and diagrams. The user can select any crop stage he wishes to map, although we suggest focusing on early stages because the knowledge gained can still be used in production decisions that year. For ex- ample, California's Extension Service has developed a system to determine PIX response based on 2 plant maps during squaring. Research has demonstrated that the yield benefit from PIX in California can be predicted based on square retention, plant height and planting date. The following conditions increase PIX yield response: fruiting starts high on the main-stem, early squares are lost, plants are tall in relation to their node count or planting is late. This mapping program only examines the first posi- tion on the fruiting branch, that is, the one closest to the main-stem. Although 20 to 40% of the final yield may come from other fruiting positions, management decisions are based on fruit retention at the first posi- tion. If insects or environmental factors are causing first position fruit to shed, they'll alsolikely remove the other fruiting positions. Additionally if we lose first position fruit at lower nodes, it doesn't matter what's happening on vegetative or secondary fruiting posi- tions. Heavy loss of key first position fruit dictates that we continue to protect-protect-protect and keep plant height under control. Plant Vigor Plant mapping tells a producer more than just fruit retention. This plant map program generates 3 additional types of information useful in manage- ment decisions: Plant Vigor, Nodes Above the White Bloom and Plant Development. Plant Vigor and Nodes Above the White Bloom are relatively new concepts being developed as management tools in Arkansas and California, although they have ap- plicability Beltwide. The plant vigor index indicates the vigor or growth potential of a cotton plant. This index uses "nodes" to measure plant age (physiological age). Since a severe stress will only slightly reduce node development as measured by heat unit accumulation, node number is a reasonable estimate of physiologi- cal age. Plant height, on the other hand, is very sensi- tive to stress. Thus height at a particular node number reflects the stress that plant has experienced or its potential vigor. Also In This Issue Contamination -A Quality Concern 3 About the Authors 4
Transcript of Cotton Physiology TodayKater Hake, Cotton Physiology Education Program - National Cotton Council.)...

PHYSIOLOGY TODAYNewsletter of the Cotton Physiology Education Program — NATIONAL COTTON COUNCIL
Plant Mapping as a Management Tool (This newsletter is extracted from the Beginning
Plant Map Program developed by Kater Hake, Tom Kerby, Fred Bourland and Johnie Jenkins. Copies of this free mapping program are available upon request from Kater Hake, Cotton Physiology Education Program -National Cotton Council.)
Upland cotton's unique growing pattern of nodes and branches allows determination of the age of each square or boll, based solely on that fruit's location in the plant. This feature is the basis for plant mapping and allows its use as a management tool. If we know a boll's location, we can predict its bloom date, maturity date, or when that fruit is no longer Boll Weevil bait.
Plant mapping has developed throughout the Cotton Belt as a research tool to quantify fruit development and retention. From this extensive body of knowledge has come our current understanding of the importance of specific fruiting positions, namely the first position fruit on the bottom 10 fruiting branches. The degree and type of shed at these key fruiting positions affects many management decisions: such as plant growth regulators, intensity of pest control, irrigation, fertilization, harvest-aid timing and yield prediction. A mid-bloom plant map can indicate if continued square protection or nitrogen fertilization is justified. For example, a late July field with 7 to 8 nodes above the 1st position white bloom and 75% boll retention below that white bloom would have the potential to set additional bolls and produce a bumper crop. Further square protection and N fertilization might well be warranted. Plant mapping also teaches producers and consultants the observation skills to read the plant, even when they do not have time for a complete plant map.
The Beginning Plant Mapping Program The Cotton Physiology Education Program has
released a Beginning Plant Map Program that is designed to be self explanatory, with instructions and diagrams at each stage. Field Notes are used to collect the data in the field. Back at the office the data is transferred to Summary Sheets. Interpretation Sheets provide you the criteria needed to evaluate a field's performance. A reasonable estimate of the time required to map a field with the Beginning Plant Map is 10 to 20 minutes including plant collection and data recording.
The Beginning Plant Map Program is to be used for management decisions during the growing season. Each plant stage from pre-squaring to late
Technical Services, January 1990
bloom is mapped with separate field sheets and diagrams. The user can select any crop stage he wishes to map, although we suggest focusing on early stages because the knowledge gained can still be used in production decisions that year. For example, California's Extension Service has developed a system to determine PIX response based on 2 plant maps during squaring. Research has demonstrated that the yield benefit from PIX in California can be predicted based on square retention, plant height and planting date. The following conditions increase PIX yield response: fruiting starts high on the main-stem, early squares are lost, plants are tall in relation to their node count or planting is late.
This mapping program only examines the first position on the fruiting branch, that is, the one closest to the main-stem. Although 20 to 40% of the final yield may come from other fruiting positions, management decisions are based on fruit retention at the first position. If insects or environmental factors are causing first position fruit to shed, they'll alsolikely remove the other fruiting positions. Additionally if we lose first position fruit at lower nodes, it doesn't matter what's happening on vegetative or secondary fruiting positions. Heavy loss of key first position fruit dictates that we continue to protect-protect-protect and keep plant height under control.
Plant Vigor Plant mapping tells a producer more than just
fruit retention. This plant map program generates 3 additional types of information useful in management decisions: Plant Vigor, Nodes Above the White Bloom and Plant Development. Plant Vigor and Nodes Above the White Bloom are relatively new concepts being developed as management tools in Arkansas and California, although they have applicability Beltwide.
The plant vigor index indicates the vigor or growth potential of a cotton plant. This index uses "nodes" to measure plant age (physiological age). Since a severe stress will only slightly reduce node development as measured by heat unit accumulation, node number is a reasonable estimate of physiological age. Plant height, on the other hand, is very sensitive to stress. Thus height at a particular node number reflects the stress that plant has experienced or its potential vigor.
Also In This Issue Contamination -A Quality Concern 3 About the Authors 4
Stress associated with moisture, seedling disease, nematodes, cool temperatures, salinity and soil compaction decreases plant height thereby decreasing plant vigor. When the vigor of cotton is low, the cause should be identified; and management inputs that further limit plant height (water deficit or PIX) should be generally avoided. When vigor of cotton is high, fruit retention and seed count per boll should be closely examined. Under highly vigorous conditions, management inputs such as PIX or increased insect control may be warranted.
Nodes Above the White Bloom Another component of the Beginning Plant Map
Program is Nodes Above the White Bloom. This is a tool growers can use to determine if fields are too vegetative or plunging into cutout. The number of nodes above a first position white bloom can be used to fine tune management practices because this number summarizes the balance between vegetative growth and reproductive growth.
As the main-stem grows, it develops fruiting branches with new squares, which bloom in approximately 3 to 4 weeks. If the main-stem grows faster than squares develop into bloom, then the white bloom will occur at an increasing distance from the terminal. This condition is considered too vegetati ve and often leads to rank cotton and shaded blooms, which shed as small bolls. On the other hand, if the main-stem slows its growth, the bloom will occur higher and higher in the plant. This condition identifies the onset of cutout. Premature cutout is detrimental to maximum yield and can lead to severe regrowth and defoliation problems.
Stressed Prior to 1st Bloom
NA WB = 7 Oune 25)
Optimum Irrigation
NA WB = 9 Oune 25)
(1989 Stephanie Johnson Hake)
At first bloom, most fields have 9 to 11 Nodes Above the White Bloom. An optimum level during midbloom would be 8-9 for well-balanced vegetative and reproductive growth. If the bloom height stays at 10 or 11 nodes at peak bloom, then fruit retention or boll size is inadequate and late PIX applications may be needed. If the bloom rises to 5 nodes from the terminal at peak bloom, then the plant is in danger of imminent cutout and has not been pushed hard enough with water and nitrogen or was treated unnecessarily with a high rate of PIX. The drawing above from the San Joaquin Valley demonstrates that the Nodes Above the White Bloom
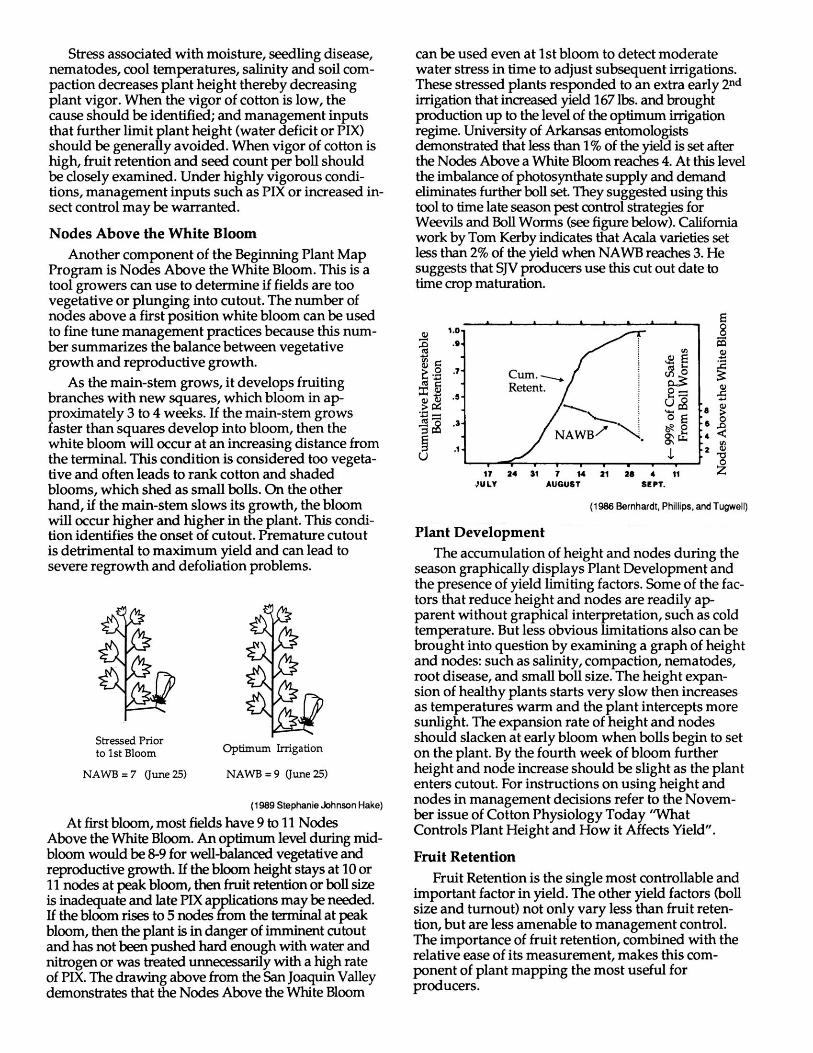
can be used even at 1st bloom to detect moderate water stress in time to adjust subsequent irrigations. These stressed plants responded to an extra early 2nd
irrigation that increased yield 1671bs. and brought production up to the level of the optimum irrigation regime. University of Arkansas entomologists demonstrated that less than 1 % of the yield is set after the Nodes Above a White Bloom reaches 4. At this level the imbalance of photosynthate supply and demand eliminates further boll set. They suggested using this tool to time late season pest control strategies for Weevils and Boll Worms (see figure below). California work by Tom Kerby indicates that Acala varieties set less than 2% of the yield when NA WB reaches 3. He suggests that S]V producers use this cut out date to time crop maturation.
~ 1.0
.g .S .... til ~ (l) 0 .7 ~ ..... ~ .... :r:!il
.5 (l)Q)
>CI:: .~ --c
-3~ .3
§ .1 U
17 24 31 7 14 21 21 4 11 .,-ULY AUGUST SEPT.
(1986 Bernhardt, Phillips, and Tugwell)
Plant Development The accumulation of height and nodes during the
season graphically displays Plant Development and the presence of yield limiting factors. Some of the factors that reduce height and nodes are readily apparent without graphical interpretation, such as cold temperature. But less obvious limitations also can be brought into question by examining a graph of height and nodes: such as salinity, compaction, nematodes, root disease, and small boll size. The height expansion of healthy plants starts very slow then increases as temperatures warm and the plant intercepts more sunlight. The expansion rate of height and nodes should slacken at early bloom when bolls begin to set on the plant. By the fourth week of bloom further height and node increase should be slight as the plant enters cutout. For instructions on using height and nodes in management decisions refer to the November issue of Cotton Physiology Today ''What Controls Plant Height and How it Affects Yield".
Fruit Retention Fruit Retention is the single most controllable and
important factor in yield. The other yield factors (boll size and turnout) not only vary less than fruit retention, but are less amenable to management control. The importance of fruit retention, combined with the relative ease of its measurement, makes this component of plant mapping the most useful for producers.

Knowledge about fruit retention, both the percent and type retained in each zone, allows pr~uc~rs to identify yield limitations- -whether sh:ct IS bemg caused by environmental factors or by InsectS, whether the plant has the potential to get rank or whether the producer should stop selling bales and concentrate on setting a crop.
A verage percent fruit retention has been developed for different regions of the Cotton .Belt. Surprising is the similarity between these regIons. The following graph displays the percent large boll retention for both skip row and solid planted cotton. Since not all plants will have a boll at nodes 6 and 7, retention at these nodes is lower than at nodes 9 and 10. The primary difference in fruit retention patterns from one cotton region to another is at the top of the plant. In the warmer part of ~e ~?tton Be~t where full season cotton is grown, SIgnificant fruit can be set above node 15, but where short season cotton is the norm, such as the Texas High Plains, significant boll retention above node 15 is not typical.
Percent Large Boll Retention (Number of 1st Position Bolls per 100 plants at each node) Node -Mississippi- Calif. Texas High Plains Zone Skip Row Solid Solid Solid
(18-20) 17 6 11 (15-17) 39 24 30 10 (12-14) 57 44 50 36 (9-11) 55 48 62 60 (6-8) 39 33 42 55 «5) 11
(J. Jenkins, T. Kerby, J. Supak)
Square retention should be significantly higher than boll retention. Work by Tom Leigh and Tom Kerby in California indicate that for maximum yield, square retention on the 1 st position should be at least 75%, with the exception of the bottom 3 nodes (6,7 and 8), due to reduced fruiting branch production at these lower nodes. Fields with 1st position square retention below 75% at nodes 9 through 15 need to be scrutinized closely for cause of shed (see the December Cotton Physiology Today on Environmental . Causes of Shed). Square shed at these lower nodes 15
often caused by insect pressure, but as the boll load builds on the plant, environmental causes of shed typically dominate.
The power of in-season plant mapping is ~st . demonstrated with examples. The 3 fIelds depIcted m the figure to the right were plant mapped at harvest. The two low yielding fields could have be:n substantially improved with inseason plant mappmg. T~e lowest yield (1.8 bale) field suffered from very high plant density (80,000 per acre) and subsequentially lost much of the bottom crop due to shading. An early plant map would have indicated the high shed and encouraged protection from further square loss. Unfortunately the field subsequently suffered from a low level of lygus bugs that prevented normal mid crop set. The 2.8 bale field did set an excellent bottom
crop but this was not recognized in time to put ~ore fuel on the fire (N and water) and as a result frUlt retention smoldered in the top crop. The highest yielding field acheived a top yield the only way possible, by setting a high percent of the bottom crop and then avoiding stress.
1.8 Bales / Ac
Nodes (18-20) D (15-17) 0 (12-14) D (9-11) 0 (6-8) 0
I 0% 50%
I 100%
2.8 Bales/ Ac
o D! q
~ I
c::J1 i i 0% 50%
I 100%
3.9 Bales/ Ac
D! c:::J! q
~ I
9 i
0% 50% I
100%
Boll Retention in Various Node Zones
CONTAMINATION-A COTTON QUALITY CONCERN Doug Herber
An often overlooked enemy of cotton quality, and many times one of the wors~, is co~tam~ation. ~y time grease, oil, dirt, or foreIgn objects like plas~c, rubber, or pieces of bale ties are allowe~ to g~t mto the fiber, serious problems are created m textile processing. Contaminants may end up in finished fabrics and create seconds or defective materials which are costly to textile mills and cotton producers.
Mills frequently express concerns about contamination. In some cases, mills have traced specific problems back to a gin and/ or ~roducer an~ h~ve indicated that, if the problem perSIsts, they will dIscontinue purchasing cotton from these individuals. So contamination does have a definite effect on the producer. Contamination problems can be grea~y reduced through simple, inexpensive, yet effective procedures. A National Cotton Council brochure entitled ''Prevent'Lint Contamination," identifies various causes of contamination and explains techniques to prevent them from occurring. The:'e guidelines are fairly simple and by followmg them producers can reduce the possibility of their cotton becoming contaminated.
To reduce the possibility of contamination resulting from inferior bale packagi?g, co~on should be packaged in only those materIals which meet the "Specifications for Bale Pac~&ing Materials." Th~e specifications contain deSCrIptions of ~ale packagmg products which, after numerous studIes ~d extensive testing, have been approved by the Jomt Cotton Industry Bale Packaging Committee and adopted by USDA. You also should remember that your cotton must be packaged in specification materials to be eligible for the Commodity Credit Corporation loan.

Making and keeping U.S. cotton a top quality product requires teamwork and we must remember that contamination is a quality factor. Providing contamination-free, high quality cotton helps to ensure that textile mills can continue to produce high quality cotton yarns and fabrics.
About the Authors Tom Kerby is the Extension Cotton Specialist for
California and was recently awarded the Cotton Foundation/Hoechst-Roussel Cotton Extension Education Award for his innovative program in helping California producers achieve sizeable production gains in the 1980's (16lbs of lint increase per year, on average).
Fred Bourland is Agronomy professor at the Uni versity of Arkansas. His current research interest include seedling vigor and plant mapping with special focus on the refinement of management tools useful to producers, such as Nodes Above the White Bloom.
Johnie Jenkins is a research geneticist with the USDA at Mississippi State. Johnie has worked extensively in Host Plant Resistance to increase the tolerance of cotton to insects. Recent interest include the quality and economic value of various fruiting positions on the plant.
Doug Herber is Manager of Marketing/Processing Technology in the National Cotton Councils Technical Service Department. Doug has primary responsibilities in cotton quality including bale packaging, contamination, and cotton grading systems. Growers and ginners with specific questions in these areas are encouraged to reach Doug at the Memphis office.
The Cotton Physiology Education Program is supported by a grant from The Cotton Foundation, and brought to you as a program of the Technical Services Department, National Cotton Council incooperation with the State Extension Services.
The National Cotton Council (NCC) is the central organization representing all seven sectors of the U.S. cotton industry: producers, ginners, warehousemen, merchants, cottonseed crushers, cooperatives and manufacturers. A majority of elected delegates from each sector must approve all NCC policies, thus assuring unity of purpose and action.
Cotton Physiology Today Edited by Kater Hake, NCC Technical Services Electronically published and printed by
NCC Production A/V Services