Cotton and its by-products in Uganda - UNCTAD |...
33
Project: 1617K - Funded by the United Nations Development Account - 2016-2019 COTTON AND ITS BY-PRODUCTS in Uganda BACKGROUND PAPER UNITED NATIONS CONFERENCE ON TRADE AND DEVELOPMENT
Transcript of Cotton and its by-products in Uganda - UNCTAD |...
Project: 1617K - Funded by the United Nations Development Account - 2016-2019
COTTON AND ITS BY-PRODUCTS in Uganda BACKGROUND PAPER
U N I T E D N AT I O N S C O N F E R E N C E O N T R A D E A N D D E V E L O P M E N T


COTTON AND ITS BY-PRODUCTS
SECTOR IN UGANDA
Background Paper
Prepared by Fredrick Lugojja
March, 2017
Geneva, 2017

Cotton and its By-Products Sector in Uganda
2
Acknowledgments
UNCTAD commissioned this background paper as part of UN Development Account Project 1617K:
"Improving the value added of cotton by-products in Eastern and Southern Africa (ESA)". The paper
was prepared to inform discussions with stakeholders in the early stages of the project. For more
information, please visit the project site at: http://unctad.org/en/Pages/SUC/Commodities/SUC-
Project-1617K.aspx."
This paper was prepared by a consultant, Mr. Fredrick Lugojja, Market Information and Monitoring
Officer at the Cotton Development Organisation (Uganda). The work was supervised by Ms. Yanchun
Zhang, Chief, Commodity Policy Implementation and Outreach Section (CPIOS) with the
contributions of Mr. Kris Terauds, Economic Affairs Officer, Special Unit on Commodities.
Disclaimer
The material in this paper represents the personal views of the author only, and not the views of the
UNCTAD secretariat or its member States.
This is an unedited publication.
The designations employed and the presentation of the material do not imply the expression of any
opinion on the part of the United Nations concerning the legal status of any country, territory, city or
area, or of authorities, or concerning the delimitation of its frontiers or boundaries.
Note
Material in this publication may be freely quoted or reprinted, but acknowledgement is requested,
together with a copy of the publication containing the quotation or reprint to be sent to the UNCTAD
secretariat.
Contacts
For further information on the Special Unit on Commodities, please contact us at:
UNCTAD
Special Unit on Commodities
Palais des Nations
8–14, Avenue de la Paix
1211 Geneva 10
Switzerland
Phone: +41 22 917 1648 / 6286
E-mail: [email protected]
UNCTAD/SUC/MISC/2017/4
Cotton and its By-Products Sector in Uganda
3
Table of Contents
1. Introduction ........................................................................................................................ 6
2. Cotton in Uganda ................................................................................................................ 6
History ..................................................................................................................... 6 2.1.
Cultivation ............................................................................................................... 9 2.2.
2.2.1. Economic importance ......................................................................................... 9
2.2.2. Production trends .............................................................................................. 11
2.2.3. Challenges ........................................................................................................ 12
Value addition........................................................................................................ 13 2.3.
2.3.1. Ginning ............................................................................................................. 13
2.3.2. Textiles ............................................................................................................. 15
2.3.3. Cotton wool ...................................................................................................... 17
2.3.4. Cottonseed oil and cake .................................................................................... 17
2.3.5. Markets ............................................................................................................. 19
3. Impediments to Development ........................................................................................... 20
4. Stakeholder Analysis ........................................................................................................ 21
5. Priority Cotton By-Products for Development ................................................................. 24
Cottonseed oil ........................................................................................................ 24 5.1.
Cottonseed cake as livestock feed ......................................................................... 24 5.2.
Cotton wool ........................................................................................................... 25 5.3.
Particle boards from cotton stalks ......................................................................... 25 5.4.
6. Proposed Survey Questions .............................................................................................. 26
7. Conclusion ........................................................................................................................ 27
8. Biliography ....................................................................................................................... 28
9. Appendices ....................................................................................................................... 30
Map of cotton-producing areas in Uganda ............................................................ 30 9.1.
Map of location of ginneries in Uganda ................................................................ 31 9.2.
List of Tables
Table 1 - Cotton production and earnings since liberalization ..................................................9
Table 2 - Ginneries: Ownership, location and capacity ...........................................................14
Table 3 - Ginning out-turn 2015/16 .........................................................................................15
Table 4 - Operational textile mills ...........................................................................................16
Table 5 - Absorbent cotton wool manufacturing firms ............................................................17
Table 6 - Cottonseed production since 1994 ............................................................................18

Cotton and its By-Products Sector in Uganda
4
Table 7 - Cottonseed processors in Uganda .............................................................................19
Table 8 - Description of cotton stakeholder groups .................................................................21
Table 9 - Stakeholder influence matrix ....................................................................................23
Table 10 - Stakeholder priorities and risks ..............................................................................24
List of Figures
Figure 1 - The cotton value chain in Uganda ...........................................................................11
Figure 2 - Cotton production prior to liberalization in 1994 ....................................................12
Figure 3 - Cotton production since liberalization in 1994 .......................................................12
Figure 4 - Value comparison, exporting raw cottonseed vs. edible oil and seed cake.............25
Figure 5 - Value comparison, exporting cotton lint vs. wool ..................................................25
List of Acronyms
AGOA Africa Growth Opportunity Act
ATM African Textile Mills
CBOs Community Based Organization
CCB Cotton Control Board
CDO Cotton Development Organization
COMESA Common Markets for Eastern and Southern Africa
EAC East African Community
EPA Economic Partnership Agreement
EU European Union
GOT Ginning Out-Turn
GOU Government of Uganda
JITCO Jinda International Textiles Corporation Ltd
LMB Lint Marketing Board
MAAIF Ministry of Agriculture Animal Industry and Fisheries
MDA Ministries Departments and Agencies
MFPED Ministry of Finance Planning and Economic Development
MTIC Ministry of Trade, Industry and Cooperatives
NARO National Agricultural Research Organization
NGO Non-Government Organization
NYTIL Nyanza Textile Industries Limited
TEMAU Textile Manufacturers Association Uganda
TEXDA Textile Development Agency
UCOPA Uganda Cottonseed Oil Processors Association

Cotton and its By-Products Sector in Uganda
5
UDC Uganda Development Corporation
UGCEA Uganda Ginners and Cotton Exporters Association
UIA Uganda Investment Authority
UIRI Uganda Industrial Research Institute
UNCTAD United Nations Conference on Trade and Development
UNECA United Nations Economic Commission for Africa
UNIDO United Nations Industrial Development Organization
WTO World Trade Organization
WUCC Western Uganda Cotton Company

Cotton and its By-Products Sector in Uganda
6
1. Introduction
Agriculture is one of the most important economic sectors in Uganda, with significant
contributions to employment, food security, foreign exchange earnings and production of
industrial raw materials. According to the Uganda Bureau of Statistics, in 2015/16,
agriculture generated 23.6% of the country's GDP and employed over 68% of its population.
Cotton is one of the traditional cash crops grown in Uganda, used both as an export good and
as a raw material for the domestic textile and edible oil industries. The Cotton Development
Organization (CDO) estimates that the cotton value chain employs a total of 2.5 million
people, directly and indirectly, in the production and marketing of its primary products, such
as textiles and garments, as well as its by-products, such as soap, edible oil and animal feed.
2. Cotton in Uganda
History 2.1.
Colonial Period: Cotton was introduced in Uganda by the British Colonial Government in
1903 as the first cash crop (Mukiibi, 2001). By the mid 1930’s production reached 60,000
metric tonnes (MT) (Baffes, 2009). One of the most divisive methods used to encourage
cotton production during colonial rule was the enforcement of a poll tax, used to supply the
British textile industry with cotton. Baffes (2009) explains that the poll tax contributed to
“forced labor conditions,” because cotton was the only crop able to generate cash to pay the
tax. The poll tax law was repealed prior to World War II. But the tax remained in practice
until independence, and refusal to plant cotton resulted in imprisonment. Forced promotion of
cotton during the colonial period displayed a disregard for farmers’ interests by, and in favour
of, the colonial rulers.
Colonial governance also set the stage for heavy government involvement in regulation of the
cotton sector. In 1933, the Cotton Control Board (CCB) increased government restrictions
considerably with the passage of the Cotton Zone Ordinance. The Ordinance established
fourteen zones, each allotted with a ginnery that maintained a monopoly on its zone’s harvest.
Furthermore the Ordinance enacted a minimum price scheme (Lundbæk 2001). Although this
heavy government involvement could protect farmers from sharp price declines, it ultimately
served the interests of ginneries by ensuring that farmers, dependent on government price
protections, produced cotton instead of more lucrative crops. The Lint Marketing Board
(LMB), a government body established with the passage of the Lint Marketing Board Act
(1959), also took an active role in the textile industry. According to Masinga and Ruhweza
(2007), the LMB held a “monopoly on domestic and international trade of cotton lint and
seed, with ginning and marketing functions vested in the cooperative unions.” The LMB also
took on marketing and regulation responsibilities as time progressed (Baffes, 2009). Both the
LMB and Cotton Zone Ordinance were in place until 1994, although their roles essentially
evaporated with the collapse of the cotton industry during the 1970s and 1980s.
Colonization was formative not only in introducing the crop but also introducing social and
governmental structures for the cotton value chain. One of the most notable social structures
brought on by colonization was the influx of citizens from other British colonies. During the
colonial period, ethnic Indians controlled most of the post-harvest activities, such as ginning,
marketing and trade (Baffes, 2009). According to Chell (2013), the influence of early
immigrants can still be seen today in numerous ancestral Indians taking part in production
(e.g. Rwenzori Cotton Ginners Company Ltd.; Southern Range Nyanza; Fine Spinners Ltd.).
Cotton and its By-Products Sector in Uganda
7
Among its many institutional legacies, the colonial period established cotton cultivation as an
important economic activity in Uganda (Chell, 2013).
Pre-Liberalization Period after Independence: Following Uganda’s independence in 1962,
cotton production continued to increase, peaking at 84,000 MT in 1969 (Baffes 2009). The
stable cotton prices experienced during the colonial period continued throughout this period.
The price stability of this period is especially remarkable when compared to the volatile price
fluctuations that followed, from the 1970s onward. Stable prices may have made reliance on
cotton exports appear to be a sustainable development strategy during the early post-
independence period. Citing cotton's relative price stability and historical economic
significance, the new Government of Uganda (GOU) adopted a policy of promoting cotton
farming (Chell, 2013).
Exports for the newly independent Uganda relied heavily on coffee and cotton (Masinga M.
Ruhweza A. 2007). Cooperatives and block farms, established near the end of the colonial
period, expanded during the post-independence years as the cotton sector became
increasingly nationalized. Competition among ginners declined and, a few years after
independence, cooperatives took over all ginning operations. The climate of decreased
competition allowed cooperative ginneries to continue their monopolies on cotton purchases
within zones established during the colonial era. Baffes (2009) notes that growth during the
post-independence phase was unsustainable, as it was based on expansion of land devoted to
crop production. Meanwhile, yield per acre actually decreased during this period. Land
expansion for cotton production was spurred by the unsustainably high prices paid to
growers, often on credit. Price stability had emboldened cooperatives to give large payouts to
farmers, which created short-term incentives to grow more cotton, but proved unsustainable
for ginneries. Poor business practices caught up with many cooperatives, which bought cotton
on credit, only to repay farmers late or not at all.
As cotton markets became globalized in the 1970s, an era of price volatility began. Although
the policy environment in Uganda boosted production over the short term, it was
economically unsustainable once political and price stability was disturbed (Chell, 2013). The
resulting collapse of production, following a period of prosperity, emphasizes the caution
necessary when managing ginneries under a cooperative. For ginneries to be sustainable,
cotton prices paid to farmers need to provide incentives for farmers to grow cotton, while also
keeping the ginnery profitable (Chell, 2013).
The growth in cotton production following independence proved illusory. The unsustainable
expansion of land under cotton cultivation, rising political turmoil, and poor economic
management all destabilized the industry (Chell, 2013). A decline in world cotton prices
deepened the consequences of mismanagement. Even when prices bounced back, the industry
failed to right itself, underlining the importance of effective management and prudent pricing.
Management of the cotton sector was further damaged under the Amin regime (1971-1979).
Its expulsion of Ugandan Asians in 1972 and its subsequent Properties and Businesses
(Acquisition) Decree of 1973 (Asiimwe, 2012), destabilized many post-harvest industries.
Historically, Ugandan Asians owned and managed most post-harvest processing activities -
their expulsion therefore left many businesses without knowledgeable leaders and
technicians.
Management problems also plagued government institutions. For example, the LMB’s
monopoly on cotton lint and seed sales (Ahmed and Ojangole, 2012) became a drag on the
sector as the decade progressed. According to Baffes (2009), “the administrative expenses of
the Lint Board for one bale of cotton rose from UGX66 in 1970 to UGX618 in 1979, an
almost 10-fold increase.” Increased administrative costs reduced farmers' profits during this

Cotton and its By-Products Sector in Uganda
8
time, further discouraging them from growing cotton. In 1972, cotton production remained at
78,000 MT, not a significant decrease from 1969 peak production of 84,000 MT (Baffes,
2009). By the 1974/75 season, the Amin regime's policies had taken effect and cotton prices
fell. In 1976, cotton production collapsed to 14,000 MT (Baffes, 2009).
The fluctuation of 1974/75 was the largest price decline seen in Uganda’s independent history
(Chell, 2013). Although the cotton market recovered quickly, production in Uganda
languished for years to come. Following its collapse in the 1970s, cotton production
continued at a substantially lower rate, reaching a record low of 2,000 MT in 1987 (Baffes,
2009). This period of decline damaged severely the long-term prospects of Uganda’s cotton
industry. As well as a collapse in cotton production, the period was characterized by: a
neglect of research and extension services; inefficient processing, marketing and export
monopolies; a collapse of the ginning industry; poor management of cooperatives; a lack of
production inputs; as well as general insecurity in the country. Reviving the cotton sector
would face many challenges.
Post-Liberalisation Period: In 1986, a new government came into power and, in 1987, it
enacted a macroeconomic reform policy geared at promoting healthy and sustainable
economic development. This included divesting government parastatals through outright sale,
privatization, equity participation or restructuring. Subsequently, the Lint Marketing Board
(LMB), was restructured and the marketing, processing and export functions were fully
liberalized in 1994 (Mukiibi, 2001).
Following the liberalization of the cotton sub-sector and through the enactment of the Cotton
Development Statute of 1994 (now the Cotton Development Act of 2000), the GOU
established the Cotton Development Organisation (CDO) in November 1994 and charged it
with overseeing and promoting the cotton sector, its activities and products (Cotton
Development Act of 2000).
According to the CDO, liberalization has led to a number of achievements in reviving the
cotton sub-sector, including:
Marketing – As a result of liberalization, cotton is sold on cash-on-delivery terms
and farmers are free to sell to the highest bidder.
Ginning capacity – Cooperative union ginneries have been privatized and total
ginning capacity has increased from 100,000 bales (each 185 bale contains 185
kilograms (kg) of cotton lint) in 1994/95 to over 900,000 bales. As a result, operators
must now compete for farmers’ cotton.
Quality control – The quality of lint has greatly improved following strict quality
control and ginnery monitoring as well as refurbishment of the CDO Cotton classing
laboratory. This translates into better prices for premium-grade Ugandan cotton.
Uganda joined the International Cotton Association (ICA) and Bremen Cotton
Exchange (BCE), to promote Uganda’s cotton and harmonize cotton standards.
Training of technicians – Under the Cotton Subsector Development Program
(CSDP), the GOU established a Ginning Training School in 1998 at Busitema
National College Agricultural Mechanization. In 2007 the College became a
University and now offers a Diploma in Ginning Engineering and a Degree in Textile
Engineering.
Cotton production – Production has risen steadily, from 33,000 bales in 1994/95 to a
post-liberalization high of 254,036 bales in 2011/12.

Cotton and its By-Products Sector in Uganda
9
Cultivation 2.2.
According to Baffes (2009), cotton is grown primarily by small farms with an average size of
less than 0.5 hectares. He estimates that 250,000 households are engaged in cotton
production. Cotton is grown across approximately two thirds of Uganda's land area, as shown
in Annex 1. Cotton is grown as either a monoculture or inter-cropped with food crops.
Cultivation is characterized by manual hoeing and low use of inputs. The crop is entirely
rain-fed and harvesting is manual (i.e. hand-picked).
2.2.1. Economic importance
a) Source of income - As shown in Table 1, cotton is a cash crop that is a major source of
revenue for both rural households and the national economy.
b) Food security - Cotton is normally grown as a land-opening crop and in rotation with
other crops. As a land-opening crop, cotton adds nutrients to the soil through its foliage,
thus increasing yields of follow-on crops - such as millet, sorghum or maize - thereby
contributing to food security.
c) Employment – According to the CDO, the cotton sub-sector employs an estimated 2.5
million people, directly and indirectly, as farmers and farm labourers, seed cotton and
cottonseed buyers, transporters, ginnery workers, cotton exporters, textile and garment
manufacturers, oil millers, etc. The CDO also established that cotton production
engages women and youth. Although these two groups typically do not own land, they
can often access it for short periods during the year.
Table 1 - Cotton production and earnings since liberalization
Period / season Cotton lint production
(bales @ 185 kg)
Earnings from lint
sales (US$ million)
Earnings by farmers
(Sh. billion)
1994/95 33,000 12.82 7.39
1995/96 56,416 20.67 11.06
1996/97 110,700 38.09 19.84
1997/98 32,000 10.6 6.99
1998/99 82,000 25.49 18.37
1999/00 117,000 29.0 19.66
2000/01 100,000 27.75 23.52
2001/02 120,000 17.76 18.14
2002/03 110,000 24.42 30.8
2003/04 158,000 43.85 54.12
2004/05 254,000 37.59 45.78
2005/06 102,600 20.88 24.7
2006/07 134,000 27.27 32.5
2007/08 66,500 19.68 25.74
2008/09 125,310 24.57 48.49
2009/10 70,300 20.68 27.94
2010/11 146,894 101.91 179.06
2011/12 254,036 47.94 148.1
2012/13 102,619 30.19 59.83
2013/14 78,364 25.08 49.84
2014/15 93,093 22.04 56.74
2015/16 110,707 25.81 88.01
Av. for 1994-2004 91,911 25.05 20.99
Av. for 2005-2015 128,202 33.64 65.56
Source: Cotton Development Organization, Uganda

Cotton and its By-Products Sector in Uganda
10
d) Raw material - Cotton is a raw material from which a number of products are derived:
- Lint for yarn, textiles, garments, sanitary and medical materials
- Seed cake for animal feeds and fertilizer
- Edible oil for cooking and soap stock
- Hulls for livestock feeds and poultry litter
- Linters for cotton swabs, paper, plastic and films manufacture and pharmaceutical
products
- Cotton stalks can be utilised as wood fuel and are used in the manufacture of
particle boards and paper.
According to the CDO, domestic value addition to lint is at an average of 3.3% of the total
lint produced. Meanwhile, all the cottonseed produced is consumed by domestic millers.
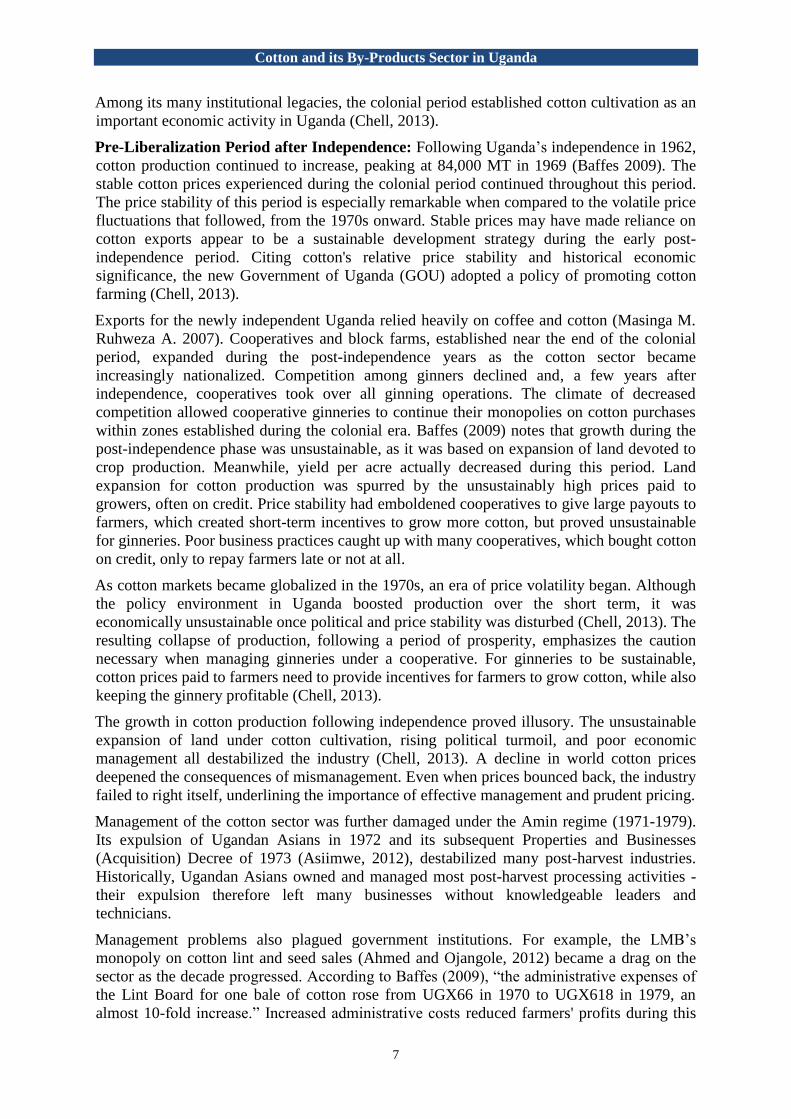
e) Value addition - The cotton value chain in Uganda starts on the farm, with production
of seed cotton by about 200,000 - 250,000 households spread in 2/3 of the country.
Beyond the farm gate, a number of follow-on value addition activities yield a range of
value added products, as shown in Figure 1, and these include:
Ginning: Cotton ginneries in Uganda are entirely dependent on supply from
producers. Ginning is a highly specialized process whereby seed cotton is separated
into cottonseed and cotton lint. The lint is cleaned, and finally pressed into bales.
According to CDO, the average Ginning Out-Turn (GOT) in 2015/16 was 42.75%
lint, 53.3% seed and 3.95% process waste. Additional information is provided in
section 2.3.1 below.
Spinning and Weaving/Knitting: The textile mills in Uganda source all their lint
locally from the ginners. They are largely integrated industries doing spinning,
weaving and knitting, as well as garments. Additional information is provided in
section 2.3.2 below.
Absorbent Cotton Wool Production: The cotton wool manufacturing firms in
Uganda also source all their lint locally from the ginners. At the factories, cotton lint
is processed through a series of steps that render the cotton hydrophilic in character
and free from external impurities. According to a CDO survey on status of cotton
value addition in Uganda carried out in 2016, the average conversion ratio of lint to
cotton wool is 100:86. Additional information is provided in section 2.3.3 below.
Edible oil extraction: All the cotton seed crushed at the mills in Uganda is sourced
locally from the ginners. Oil is extracted from the cottonseed using the expeller–
pressing method, coupled with chemical refining. According to a 2016 CDO survey
on the status of cotton value addition in Uganda, the processing of cotton seeds yields
approximately 12% cotton seed oil, 50% seed cake, with the balance in husks and
linters. Additional information is provided in section 2.3.4 below.
Cotton and its By-Products Sector in Uganda
11
Figure 1 - The cotton value chain in Uganda
Source: Author
2.2.2. Production trends
Figure 2 shows cotton production in Uganda between 1960 and 1994, prior to liberalization
of the sector. During the 1970s and the 1980s, production declined drastically, mainly due to
civil strife, economic turmoil and poor governance.
GINNING
OIL EXTRACTION
WEAVING
Edible oil
Yarn Cotton wool
Cotton lint
Seed cotton
Fabric
Cottonseed
Seed cake
Husks
Textile/garments/apparel
Soap
SPINNING
KNITTING
FABRICATION
FARMING Stalks
Livestock feed

Cotton and its By-Products Sector in Uganda
12
Figure 2 - Cotton production prior to liberalization in 1994
Source: Cotton Development Organization, Uganda
After liberalization, production rose steadily, from 33,000 bales in 1994/95, to a high of
254,036 bales in 2011/12, as shown in Figure 3. Annual fluctuations are largely due to price
movements and the effects of climate change on rainfall.
Figure 3 - Cotton production since liberalization in 1994
Source: Cotton Development Organization, Uganda
2.2.3. Challenges
According to field observations conducted by the CDO, key challenges affecting cotton
production include;
-
50'000
100'000
150'000
200'000
250'000
300'000
350'000
400'000
450'000
500'000N
o. o
f b
ale
s o
f lin
t p
rod
uce
d (
@ 1
85
Kg)
-
50'000
100'000
150'000
200'000
250'000
300'000
19
94
/95
19
95
/96
19
96
/97
19
97
/98
19
98
/99
19
99
/00
20
00
/01
20
01
/02
20
02
/03
20
03
/04
20
04
/05
20
05
/06
20
06
/07
20
07
/08
20
08
/09
20
09
/10
20
10
/11
20
11
/12
20
12
/13
20
13
/14
20
14
/15
20
15
/16
No
. of
bal
es
of
lint
pro
du
ced
(@
18
5 K
g)

Cotton and its By-Products Sector in Uganda
13
Inadequate funding for research and technology development has slowed down
development of new varieties and production technologies, hampering the sector's
ability to adapt to changing stakeholder demands and emerging constraints, in
particular climate change.
Climate change and overdependence on rain-fed production – climatic changes,
including to rainfall patterns and volumes, has adversely affected the timing and
duration of the planting and rainy. Dependence on rain-fed agriculture precludes
farmers mitigating these adverse impacts by using alternative sources of water.
High cost of production inputs – Most of the production inputs (e.g. fertilizers,
pesticides, and spray pumps) are imported from abroad. This makes them costly to
farmers. The situation is further worsened when the shilling weakens against major
foreign currencies.
Declining soil fertility in most parts of the country. This is effect is worst in areas
where land is fragmented into ever-smaller parcels, such as in eastern Uganda.
Weak farmer group cohesion due to the seasonality of cotton production –
Farmer groups are rarely permanent, as farmers tend to move in and out of cotton
production every season, largely in response to fluctuations in cotton prices. This
undermines the continuity of services these groups deliver (e.g. provision of inputs
and marketing), as well as their political influence.
Competition for land and labour from other agricultural enterprises – Since
farmers decide every season whether or not to grow cotton, the area planted to cotton
fluctuates annually. Furthermore, farm labour is often shared across several activities,
resulting in a lack of specialization and low adoption of recommended agronomic
practices for cotton production.
Value addition 2.3.
Cotton has two major components: lint and cottonseed. Lint is the primary product of seed
cotton and is transformed by the textile industry into yarn, textiles, garments and apparel, as
well as into absorbent cotton wool. Meanwhile, cottonseed is a by-product that can be
transformed into four major products, namely: edible oil, cottonseed cake, soap stock and
cotton husks. Stalks are another cotton by-product -they are rarely transformed, but rather
used as wood fuel or burnt in the field to control pests.
2.3.1. Ginning
Ginners are crucial actors within the cotton industry: their position, efficiency and
organization are critical for the effective operation of the entire value chain. Currently, there
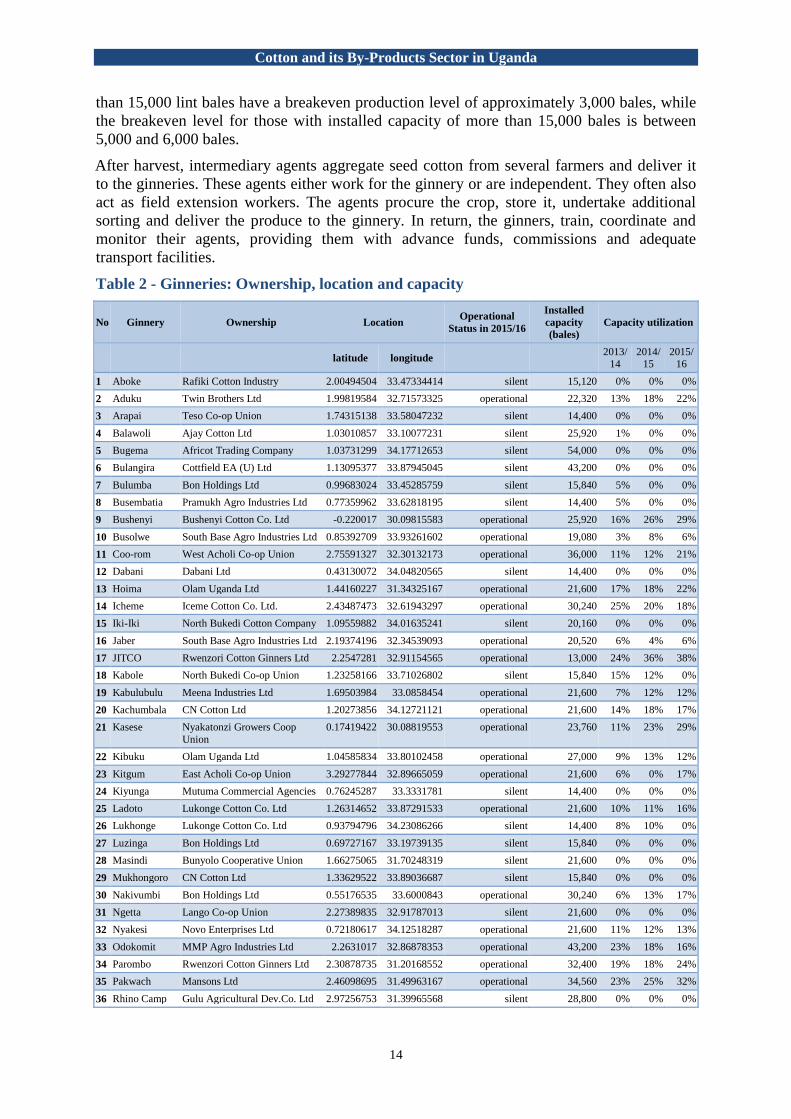
are 39 ginneries in Uganda, with an installed ginning capacity of close to one million bales.
Out of these 21 were operational and 18 silent in the 2015/16 season, as shown in Table 2.
The ginneries are located in the main cotton-growing regions: the Eastern, Northern, West
Nile, Mid-West, Central and Western Regions, as shown in Annex 2.
According to the CDO, 33 ginneries are privately owned while 6 ginneries are owned by the
cooperative unions. The ginneries consume all Uganda’s seed cotton production.
Uganda predominantly uses roller-gin technology, which is preferred for preserving the
integrity of the cotton fibre. Only 3 of the 39 ginneries use saw-gin units. According to the
CDO, lint outturn usually ranges between 40% and 44% (see Table 3). Since seed cotton is
hand-picked, its lint has superior fibre characteristics, as compared to machine-picked
cottons. Seed outturn ranges between 50% and 56%. Ginneries with installed capacity of less
Cotton and its By-Products Sector in Uganda
14
than 15,000 lint bales have a breakeven production level of approximately 3,000 bales, while
the breakeven level for those with installed capacity of more than 15,000 bales is between
5,000 and 6,000 bales.
After harvest, intermediary agents aggregate seed cotton from several farmers and deliver it
to the ginneries. These agents either work for the ginnery or are independent. They often also
act as field extension workers. The agents procure the crop, store it, undertake additional
sorting and deliver the produce to the ginnery. In return, the ginners, train, coordinate and
monitor their agents, providing them with advance funds, commissions and adequate
transport facilities.
Table 2 - Ginneries: Ownership, location and capacity
No Ginnery Ownership Location Operational
Status in 2015/16
Installed
capacity
(bales)
Capacity utilization
latitude longitude
2013/14
2014/15
2015/16
1 Aboke Rafiki Cotton Industry 2.00494504 33.47334414 silent 15,120 0% 0% 0%
2 Aduku Twin Brothers Ltd 1.99819584 32.71573325 operational 22,320 13% 18% 22%
3 Arapai Teso Co-op Union 1.74315138 33.58047232 silent 14,400 0% 0% 0%
4 Balawoli Ajay Cotton Ltd 1.03010857 33.10077231 silent 25,920 1% 0% 0%
5 Bugema Africot Trading Company 1.03731299 34.17712653 silent 54,000 0% 0% 0%
6 Bulangira Cottfield EA (U) Ltd 1.13095377 33.87945045 silent 43,200 0% 0% 0%
7 Bulumba Bon Holdings Ltd 0.99683024 33.45285759 silent 15,840 5% 0% 0%
8 Busembatia Pramukh Agro Industries Ltd 0.77359962 33.62818195 silent 14,400 5% 0% 0%
9 Bushenyi Bushenyi Cotton Co. Ltd -0.220017 30.09815583 operational 25,920 16% 26% 29%
10 Busolwe South Base Agro Industries Ltd 0.85392709 33.93261602 operational 19,080 3% 8% 6%
11 Coo-rom West Acholi Co-op Union 2.75591327 32.30132173 operational 36,000 11% 12% 21%
12 Dabani Dabani Ltd 0.43130072 34.04820565 silent 14,400 0% 0% 0%
13 Hoima Olam Uganda Ltd 1.44160227 31.34325167 operational 21,600 17% 18% 22%
14 Icheme Iceme Cotton Co. Ltd. 2.43487473 32.61943297 operational 30,240 25% 20% 18%
15 Iki-Iki North Bukedi Cotton Company 1.09559882 34.01635241 silent 20,160 0% 0% 0%
16 Jaber South Base Agro Industries Ltd 2.19374196 32.34539093 operational 20,520 6% 4% 6%
17 JITCO Rwenzori Cotton Ginners Ltd 2.2547281 32.91154565 operational 13,000 24% 36% 38%
18 Kabole North Bukedi Co-op Union 1.23258166 33.71026802 silent 15,840 15% 12% 0%
19 Kabulubulu Meena Industries Ltd 1.69503984 33.0858454 operational 21,600 7% 12% 12%
20 Kachumbala CN Cotton Ltd 1.20273856 34.12721121 operational 21,600 14% 18% 17%
21 Kasese Nyakatonzi Growers Coop
Union
0.17419422 30.08819553 operational 23,760 11% 23% 29%
22 Kibuku Olam Uganda Ltd 1.04585834 33.80102458 operational 27,000 9% 13% 12%
23 Kitgum East Acholi Co-op Union 3.29277844 32.89665059 operational 21,600 6% 0% 17%
24 Kiyunga Mutuma Commercial Agencies 0.76245287 33.3331781 silent 14,400 0% 0% 0%
25 Ladoto Lukonge Cotton Co. Ltd 1.26314652 33.87291533 operational 21,600 10% 11% 16%
26 Lukhonge Lukonge Cotton Co. Ltd 0.93794796 34.23086266 silent 14,400 8% 10% 0%
27 Luzinga Bon Holdings Ltd 0.69727167 33.19739135 silent 15,840 0% 0% 0%
28 Masindi Bunyolo Cooperative Union 1.66275065 31.70248319 silent 21,600 0% 0% 0%
29 Mukhongoro CN Cotton Ltd 1.33629522 33.89036687 silent 15,840 0% 0% 0%
30 Nakivumbi Bon Holdings Ltd 0.55176535 33.6000843 operational 30,240 6% 13% 17%
31 Ngetta Lango Co-op Union 2.27389835 32.91787013 silent 21,600 0% 0% 0%
32 Nyakesi Novo Enterprises Ltd 0.72180617 34.12518287 operational 21,600 11% 12% 13%
33 Odokomit MMP Agro Industries Ltd 2.2631017 32.86878353 operational 43,200 23% 18% 16%
34 Parombo Rwenzori Cotton Ginners Ltd 2.30878735 31.20168552 operational 32,400 19% 18% 24%
35 Pakwach Mansons Ltd 2.46098695 31.49963167 operational 34,560 23% 25% 32%
36 Rhino Camp Gulu Agricultural Dev.Co. Ltd 2.97256753 31.39965568 silent 28,800 0% 0% 0%

Cotton and its By-Products Sector in Uganda
15
No Ginnery Ownership Location Operational
Status in 2015/16
Installed
capacity
(bales)
Capacity utilization
latitude longitude
2013/14
2014/15
2015/16
37 Rwenzori Rwenzori Cotton Ginners Ltd 0.1658689 30.08217297 operational 32,400 7% 17% 22%
38 Soroti Country Farm Cotton Co. Ltd 1.71340124 33.59303579 silent 10,800 0% 0% 0%
39 Western
Uganda
Western Uganda Cotton Co. 0.15845452 30.07937199 operational 27,000 9% 22% 30%
Total 923,800 9% 10% 12%
Source: Cotton Development Organization, Uganda
Table 3 - Ginning out-turn 2015/16
No. Ginnery Lint % Seed % Process Loss %
1 Aduku 44.67 52.78 2.55
2 Busolwe 42.70 52.92 4.38
3 Bushenyi 43.22 52.47 4.31
4 Coorom 42.41 54.96 2.63
5 JITCO 41.71 51.80 6.49
6 Hoima 44.77 52.26 2.97
7 Icheme 42.07 56.09 1.84
8 Jaber 40.00 50.00 10.00
9 Kachumbala 43.78 51.53 4.69
10 Kasese 43.70 53.15 3.15
11 Kitgum 44.04 53.60 2.36
12 Kibuku 42.92 53.54 3.54
13 Kobulubulu 43.73 53.84 2.43
14 Ladoto 43.41 54.70 1.89
15 Nakivumbi 42.79 52.32 4.89
16 Nyakesi 41.45 54.40 4.15
17 Odokomit 43.85 51.38 4.77
18 Parombo 40.70 55.90 3.40
19 Pakwach 42.09 56.04 1.87
20 Rwenzori 42.24 53.52 4.24
21 WUCC 41.57 52.10 6.33
Average 42.75 53.30 3.95
Source: Cotton Development Organization, Uganda
Ginners also provide important support to farmers. For example, the Uganda Ginners and
Cotton Exporters Association (UGCEA) offers its Cotton Production Support Program,
which provides farmers with subsidized inputs and tractor rentals, as well as extension
services.
2.3.2. Textiles
According to the National Textile Policy, the Ugandan textile sub-sector was founded in the
1950s and 1960s, spearheaded by the Uganda Development Corporation (UDC), which
worked in tandem with the international partners, such as the Calico Printers Association of
the United Kingdom and Yamato International of Japan, as well as domestic partners, such as
Nyanza Textile Industries Limited (NYTIL) in Jinja, Mulco Textiles in Jinja, African Textile
Cotton and its By-Products Sector in Uganda
16
Mills (ATM) in Mbale and Lira Spinning Mill in Lira. Under the auspices of UDC, a
National Textile Board was established in late 1960s to guide the development of the textile
industry in Uganda, with a focus on import substitution.
Following the Nationalization Policy in the early 1970s, textile mills in Uganda were
nationalized. At its peak in 1972/73 the textile industry consumed approximately 400,000
bales of cotton, 85% of domestic production (IL&FS Clusters, 2014). In 1994, the GOU
liberalized the textile and garment industry and divested government-owned mills.
Nevertheless, in the early 1990s, the sector collapsed under the burden of obsolete machinery
and other operational constraints, especially unreliable and expensive electricity.
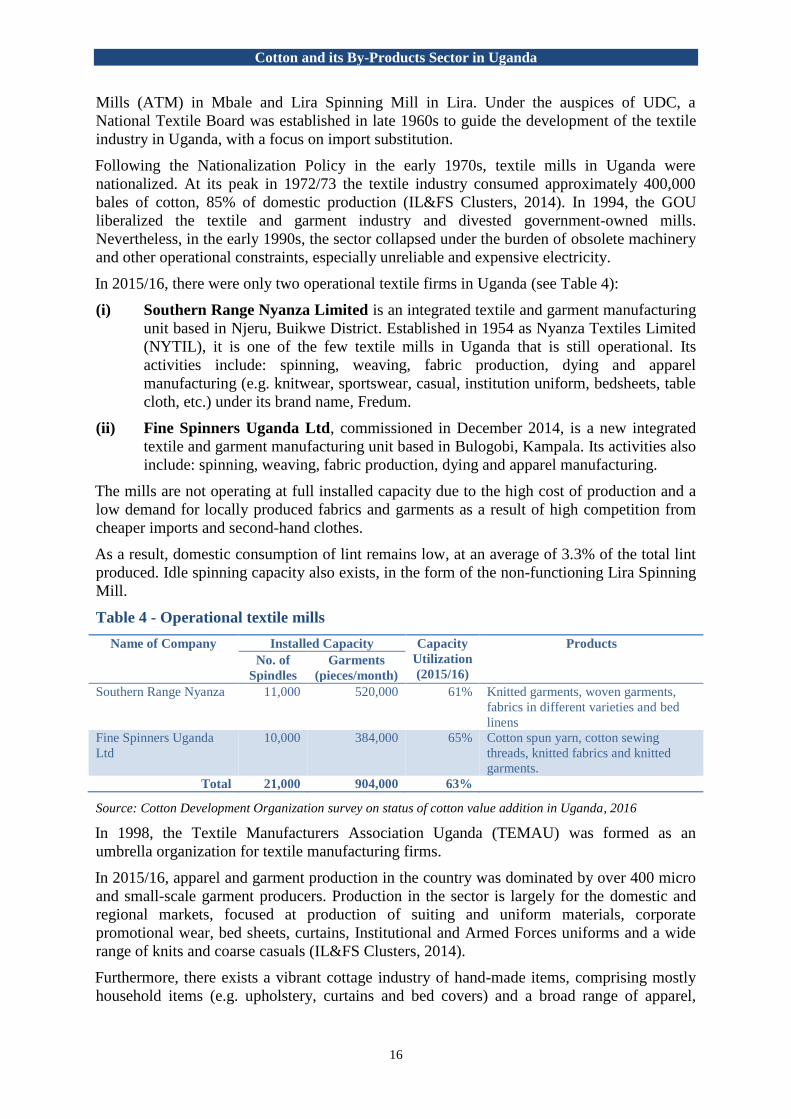
In 2015/16, there were only two operational textile firms in Uganda (see Table 4):
(i) Southern Range Nyanza Limited is an integrated textile and garment manufacturing
unit based in Njeru, Buikwe District. Established in 1954 as Nyanza Textiles Limited
(NYTIL), it is one of the few textile mills in Uganda that is still operational. Its
activities include: spinning, weaving, fabric production, dying and apparel
manufacturing (e.g. knitwear, sportswear, casual, institution uniform, bedsheets, table
cloth, etc.) under its brand name, Fredum.
(ii) Fine Spinners Uganda Ltd, commissioned in December 2014, is a new integrated
textile and garment manufacturing unit based in Bulogobi, Kampala. Its activities also
include: spinning, weaving, fabric production, dying and apparel manufacturing.
The mills are not operating at full installed capacity due to the high cost of production and a
low demand for locally produced fabrics and garments as a result of high competition from
cheaper imports and second-hand clothes.
As a result, domestic consumption of lint remains low, at an average of 3.3% of the total lint
produced. Idle spinning capacity also exists, in the form of the non-functioning Lira Spinning
Mill.
Table 4 - Operational textile mills
Name of Company Installed Capacity Capacity
Utilization
(2015/16)
Products
No. of
Spindles
Garments
(pieces/month)
Southern Range Nyanza 11,000 520,000 61% Knitted garments, woven garments,
fabrics in different varieties and bed
linens
Fine Spinners Uganda
Ltd
10,000 384,000 65% Cotton spun yarn, cotton sewing
threads, knitted fabrics and knitted
garments.
Total 21,000 904,000 63%
Source: Cotton Development Organization survey on status of cotton value addition in Uganda, 2016
In 1998, the Textile Manufacturers Association Uganda (TEMAU) was formed as an
umbrella organization for textile manufacturing firms.
In 2015/16, apparel and garment production in the country was dominated by over 400 micro
and small-scale garment producers. Production in the sector is largely for the domestic and
regional markets, focused at production of suiting and uniform materials, corporate
promotional wear, bed sheets, curtains, Institutional and Armed Forces uniforms and a wide
range of knits and coarse casuals (IL&FS Clusters, 2014).
Furthermore, there exists a vibrant cottage industry of hand-made items, comprising mostly
household items (e.g. upholstery, curtains and bed covers) and a broad range of apparel,

Cotton and its By-Products Sector in Uganda
17
including ceremonial and bridal wear. Women or women's groups run the majority of these
enterprises (IL&FS Clusters, 2014).
2.3.3. Cotton wool
There are four absorbent cotton wool manufacturing firms in Uganda: Mutuma Commercial
Agencies Ltd, Nile Surgicot Ltd, South Base Agro Industries Ltd and Anik Industries (U) Ltd
(see Table 5). A large proportion (90%) of the absorbent cotton wool produced is sold
domestically to National Medical Stores (NMS), Joint Medical Stores (JMS), private
pharmacies and drug shops around the country. The remaining 10% is exported to
neighbouring countries, including Kenya, Rwanda and the Democratic Republic of Congo.
Table 5 - Absorbent cotton wool manufacturing firms
Name of Company Location
(District)
Year of
Establishment
Installed
capacity
(MT/year)
Capacity
utilization
(2015/16)
Products
Anik Industries Ltd Wakiso 1995 880 30% Surgical cotton wool
(Carex)
Mutuma Commercial
Agencies
Luuka 1999 475 34% Surgical cotton wool
(Pearl), Maama Kits
VIVA Holdings Ltd Mukono 2012 233 12% Surgical cotton wool
(Safex), Maama Kits
Nile Surgicot Ltd Jinja 2008 200 75% Surgical cotton wool
(Softouch)
South base Agro
Industries Ltd.
Oyam 1996 150 33% Surgical cotton wool
(Doctor Plus), Maama
Kits
Gulf Cotton Ltd Kampala 2008 72 29% Surgical cotton wool
(Advance)
TOTAL 2,080 34%
Source: Cotton Development Organization survey on status of cotton value addition in Uganda, 2016
2.3.4. Cottonseed oil and cake
The first cottonseed oil mill in Ugandan was established in 1929 (Enger and Burgess, 1989).
Production of edible oil was limited until stimulated by food shortages for soldiers stationed
in Africa during World War 1. In 1944, Uganda had only 10 oil mills. Ten years later, there
were 43 mills in the country. The construction surge began in 1945, when the GOU allowed
free entry of cottonseed processors. After 1955, the number of firms entering the industry
stabilized.
From 1945 to 1972, the edible oil sector was characterized by surplus crushing capacity and
varying degrees of government control. The GOU first controlled entry, allocated cottonseed
and controlled prices to millers. Later, entry and price controls were relaxed, but crushing
seed allocation remained controlled by the Lint Marketing Board (LMB), the government
agency with a marketing monopoly on lint and cottonseed. LMB sold by private negotiation,
but also by open tender to the highest bidder, severely depressing milling profits. In some
years, millers established purchasing cartels to reduce the cost of crushing stocks.
The industry experienced difficulties after the Amin regime expelled Asian owners in 1972.
Oil mills were allocated to owners unable to operate them efficiently. Oilseed production
declined, reaching its lowest point in 1987-88, including only 3,729MT of cottonseed.
Another cause of the industry's decline was the poor condition of equipment, which had been
neglected since 1972. This was in part because of a lack of foreign exchange for purchasing

Cotton and its By-Products Sector in Uganda
18
spare parts. Some machinery was obsolete and not serviceable. Moreover, there were too few
trained technicians to run the mills efficiently (Enger and Burgess, 1989).
In much the same way as for lint, the economic turmoil in Uganda in the 1970s and 1980s
undermined the country's once flourishing oilseeds industry. Not only did the production of
oilseeds, including cottonseed, decline, but processing infrastructure was neglected.
In 1994, the GOU implemented the five-year Cotton Sub-sector Development Project, to
revamp cotton production in all cotton producing regions of the country, Since the
implementation of the Project, cottonseed output has risen continually, as shown in Table 6.
In 2015/16, there were nine cottonseed processors in Uganda, namely: Nile Agro industries
Ltd, Mutuma Commercial Agencies, Singo United Investments Ltd, Wamala Growers
Cooperative Union Ltd, Ekirya Atabaala General Merchandise Ltd, Kasese Oil Mill Ltd,
Rwenzori Cotton Ginners Company Ltd, Western Uganda Cotton Company Ltd and Twin
Brothers Company Ltd (see Table 7). They are represented by the Uganda Cottonseed Oil
Processors Association (UCOPA), formed in 2007.
Table 6 - Cottonseed production since 1994
Period / season
Cotton lint
production (bales
@ 185 kg)
Total Quantity of
Cottonseed produced (MT)
1994/95 33,000 12,000
1995/96 56,416 20,900
1996/97 110,700 40,900
1997/98 32,000 11,800
1998/99 82,000 30,300
1999/00 117,000 43,300
2000/01 100,000 34,700
2001/02 120,000 40,260
2002/03 110,000 38,460
2003/04 158,000 55,950
2004/05 254,000 91,030
2005/06 102,600 35,400
2006/07 134,000 46,500
2007/08 66,500 17,350
2008/09 125,310 42,731
2009/10 70,300 23,972
2010/11 146,894 50,091
2011/12 254,036 86,626
2012/13 102,619 34,993
2013/14 78,364 26,722
2014/15 93,093 31,745
2015/16 110,707 37,751
Average 111,706 38,794.6
Source: Cotton Development Organization, Uganda
According to a 2016 CDO survey on status of cotton value addition in Uganda, the nine oil
mills consume all of the cottonseed ginned in Uganda, an average of approximately
38,794MT per year for the last 22 years. In turn these mills sell their entire edible oil

Cotton and its By-Products Sector in Uganda
19
production, approximately 40,000 MT from all seed types, to domestic wholesalers, bakeries
and confectionaries. A large proportion of the cottonseed cake is also sold domestically to
feed manufacturers and dealers, while the rest is exported mainly to Rwanda and Kenya.
Cottonseed husks are used for mushroom growing and fuel purposes.
Table 7 - Cottonseed processors in Uganda
Name of Company Location
(District)
Year of
Establishment
Installed
capacity
(MT/year)
Capacity
utilization
(2015/16)
Type of Oil
produced
Nile Agro Industries Ltd. Jinja 2000 14,400 76% Refined
Rwenzori Cotton Ginners Co.
Ltd.
Nebbi 2009 9,000 2.4% Single refined
Mutuma Commercial Agencies Luuka 1999 8,640 13% Single refined
Kasese Oil Mill Ltd. Kasese 2005 6,240 6% Crude oil
Western Uganda Cotton
Company
Kasese 2005 5,040 36% Refined
Singo United Investments Ltd. Mityana 1993 4,800 25% Single refined
Twin Brothers Co. Ltd. Lira 1995 3,000 48% Semi-refined
Wamala Growers Coop Union
Ltd
Mityana 2004 2,400 28% Crude oil
Ekirya Atabaala General
Merchandise Ltd.
Masaka 1996 900 30% Semi-refined
TOTAL 54,420 33%
Source: Cotton Development Organization survey on status of cotton value addition in Uganda, 2016
2.3.5. Markets
RATES (2003) observed that Uganda has a relatively small domestic market due to its
population size, low purchasing power and the predominance of the subsistence economy.
RATES (2003) suggested that internal markets could be promoted through improved
infrastructure, dissemination of market information, value addition to products and product
diversification, and the establishment and enforcement of product grades and standards.
Uganda has some comparative advantage within the East African region for the export of
agricultural products including cotton, although capitalizing on this advantage requires the
supply of products in sufficient volumes and quality.
Apart from addressing fundamental domestic impediments to trade, Uganda has also been
active in expanding its multilateral and regional trade relationships. For example, Uganda is
member to the World Trade Organization (WTO), the Cotonou Agreement that governs trade
between the European Union and the African, Caribbean, and Pacific Group of States (ACP).
Within Africa, Uganda is a member of the Common Market for East and Southern Africa
(COMESA) and the East African Community (EAC).
In addition to the above, Uganda benefits from several market access initiatives. These
include the Africa Growth Opportunity Act (AGOA), which grants duty free and quota free
access to the US market for specific products. Uganda also has access to the EU market
through the Economic Partnership Agreement (EPA).
Uganda has opportunities to tap into these regional and global markets to develop cotton by-
products industries.
Cotton and its By-Products Sector in Uganda
20
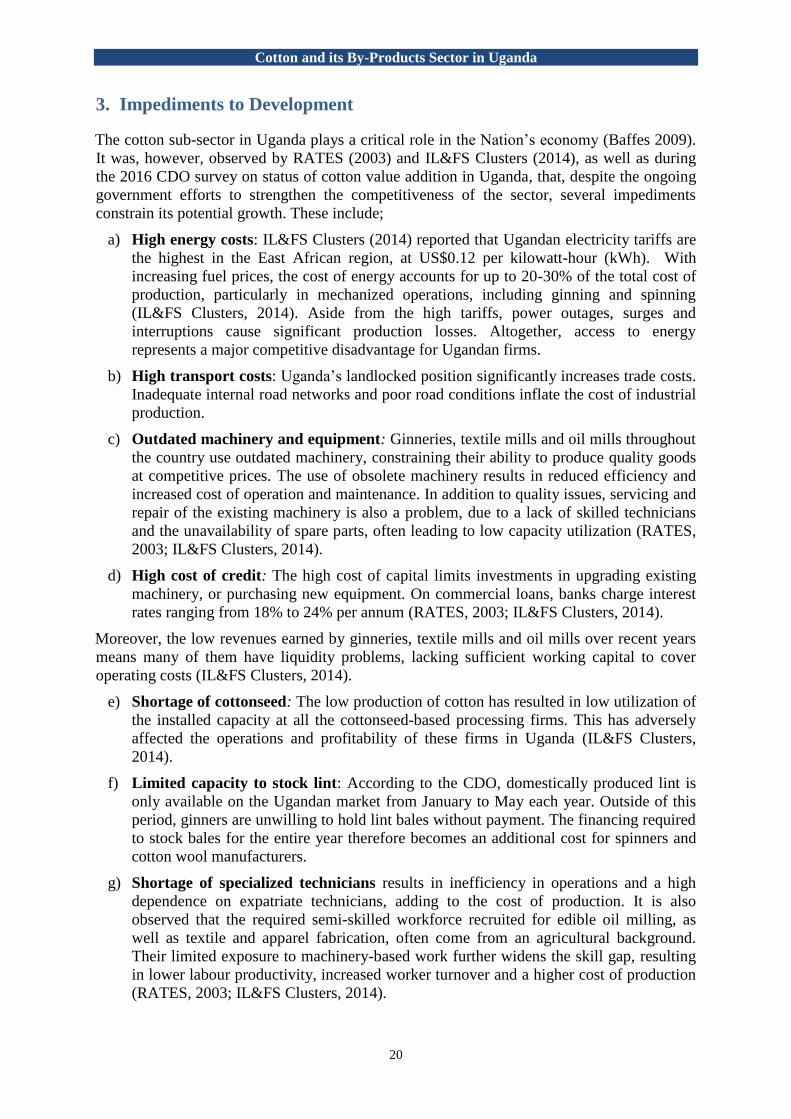
3. Impediments to Development
The cotton sub-sector in Uganda plays a critical role in the Nation’s economy (Baffes 2009).
It was, however, observed by RATES (2003) and IL&FS Clusters (2014), as well as during
the 2016 CDO survey on status of cotton value addition in Uganda, that, despite the ongoing
government efforts to strengthen the competitiveness of the sector, several impediments
constrain its potential growth. These include;
a) High energy costs: IL&FS Clusters (2014) reported that Ugandan electricity tariffs are
the highest in the East African region, at US$0.12 per kilowatt-hour (kWh). With
increasing fuel prices, the cost of energy accounts for up to 20-30% of the total cost of
production, particularly in mechanized operations, including ginning and spinning
(IL&FS Clusters, 2014). Aside from the high tariffs, power outages, surges and
interruptions cause significant production losses. Altogether, access to energy
represents a major competitive disadvantage for Ugandan firms.
b) High transport costs: Uganda’s landlocked position significantly increases trade costs.
Inadequate internal road networks and poor road conditions inflate the cost of industrial
production.
c) Outdated machinery and equipment: Ginneries, textile mills and oil mills throughout
the country use outdated machinery, constraining their ability to produce quality goods
at competitive prices. The use of obsolete machinery results in reduced efficiency and
increased cost of operation and maintenance. In addition to quality issues, servicing and
repair of the existing machinery is also a problem, due to a lack of skilled technicians
and the unavailability of spare parts, often leading to low capacity utilization (RATES,
2003; IL&FS Clusters, 2014).
d) High cost of credit: The high cost of capital limits investments in upgrading existing
machinery, or purchasing new equipment. On commercial loans, banks charge interest
rates ranging from 18% to 24% per annum (RATES, 2003; IL&FS Clusters, 2014).
Moreover, the low revenues earned by ginneries, textile mills and oil mills over recent years
means many of them have liquidity problems, lacking sufficient working capital to cover
operating costs (IL&FS Clusters, 2014).
e) Shortage of cottonseed: The low production of cotton has resulted in low utilization of
the installed capacity at all the cottonseed-based processing firms. This has adversely
affected the operations and profitability of these firms in Uganda (IL&FS Clusters,
2014).
f) Limited capacity to stock lint: According to the CDO, domestically produced lint is
only available on the Ugandan market from January to May each year. Outside of this
period, ginners are unwilling to hold lint bales without payment. The financing required
to stock bales for the entire year therefore becomes an additional cost for spinners and
cotton wool manufacturers.
g) Shortage of specialized technicians results in inefficiency in operations and a high
dependence on expatriate technicians, adding to the cost of production. It is also
observed that the required semi-skilled workforce recruited for edible oil milling, as
well as textile and apparel fabrication, often come from an agricultural background.
Their limited exposure to machinery-based work further widens the skill gap, resulting
in lower labour productivity, increased worker turnover and a higher cost of production
(RATES, 2003; IL&FS Clusters, 2014).

Cotton and its By-Products Sector in Uganda
21
h) Limited apparel production: Despite the sector being labour-intensive and the
country’s eligibility for preferential market access accorded under regional and
international trade agreements (for example EAC, COMESA, and the EU and the US
markets through EPA and AGOA), the commercial-scale production of apparel is
limited. A variety of factors contribute to this situation, including: a limited supply of
fabric; a lack of capital investment in spinning, weaving, yarn and fabric production;
and an unattractive business climate that discourages private investments. Uganda is the
second-largest cotton producer in the region, leaving it considerable potential to
develop a cotton-to-clothing value chain that caters to domestic and regional demand
(IL&FS Clusters, 2014).
i) Reduced competitiveness of domestic textile industry: The influx of cheaper
imported products and second-hand clothing has undercut the competitiveness of
domestic textile manufacturers. With their limited purchasing power, many consumers
are attracted to cheaper imported clothing, which sells at a discount of 25-30% below
domestically produced textiles (IL&FS Clusters, 2014). As a result, many mills have cut
production or closed. Counterfeits and second-hand clothing are also cheap substitutes
for domestic textiles. More generally, many Ugandans perceive that domestically
produced textiles are of lesser quality and, therefore, prefer imported ready-to-wear
garments (RATES, 2003; IL&FS Clusters, 2014).
j) Access to Information: Limited access to information on technology and market
access also constraints profitable business (RATES, 2003; IL&FS Clusters, 2014).
4. Stakeholder Analysis
The CDO classifies primary and secondary cotton stakeholders in Uganda into four groups,
summarized in the Table 8.
Table 8 - Description of cotton stakeholder groups
Stakeholder Group Roles, Functions and Interactions
GROUP A – FARMERS AND THE PRIVATE SECTOR
Cotton Farmers Grow the crop and comprise of 200,000 to 250,000 households spread
across 2/3 of the country. Farmer’s engagement in the cotton value chain
is limited up to the farm-gate. Some of the farmers are also engaged as
commission agents by the ginners, to assist in collection of seed cotton.
Farmers obtain production inputs, extension services as well as tractor
hire services from ginners.
Uganda Ginners and Cotton
Exporters Association
(UGCEA)
Brings together ginners and lint exporters. Formed in 1997, the
Association is a private sector body whose primary objective is to
provide a forum for discussing issues affecting ginners and exporters.
UGCEA is also involved in procurement and distribution of production
inputs as well provision of extension services to farmers.
Uganda Cottonseed Oil
Processors Association
(UCOPA)
Established in 2007, the Association was formed as an umbrella
organization of cottonseed processors. The oil millers purchase
cottonseed from ginneries for milling into cottonseed oil which is used
primarily for cooking oil and cottonseed cake. The seed cake is used in
the compounding livestock feeds.
Textile Manufacturers Established in 1998 as an umbrella organization for textile manufacturing

Cotton and its By-Products Sector in Uganda
22
Stakeholder Group Roles, Functions and Interactions
Association Uganda (TEMAU) firms. TEMAU members procure lint domestically from ginners and
serve both the domestic and export market.
Textile Development Agency
(TEXDA)
A textile training agency established in 1999 and currently funded by
UNIDO under MTIC to work in partnership with TEMAU.
Cotton wool manufacturers Make surgical cotton wool and maama kits from cotton lint. They
procure lint domestically from ginners and sell most of their value-added
products domestically.
NGOs, CBOs and other
community structures
Involved in helping the community members improve their economic
status
GROUP B - GOVERNMENT AND UNCTAD/UNECA/COMESA
Ministry of Agriculture,
Animal Industry and Fisheries
(MAAIF)
The Ministry is mandated is to create an enabling environment in the
agricultural sector, with the objective of: enhancing crop production and
productivity for improved food and nutrition security, employment,
widened export base and improved incomes for farmers. CDO and
NARO are under MAAIF.
Cotton Development
Organization (CDO)
Established in 1994, the CDO assumed some of the functions of the
former Lint Marketing Board. It is a statutory body responsible for the
promotion of cotton, as well as the monitoring of the production,
marketing and processing of cotton in Uganda.
The CDO carries out ginnery inspections and certifications and gives
guidance to farmers and ginners on seed cotton and lint quality, as well
as on packaging requirements.
National Agricultural
Research Organization
(NARO)
A corporate and apex body under MAAIF with a mandate to promote,
coordinate and disseminate all aspects of agricultural research, including
applications such as: crops, livestock, fisheries and forestry. It
collaborates with CDO.
Ministry of Finance, Planning
and Economic Development
(MoFPED)
Coordinates development planning of strategic initiatives. It also
mobilizes public resources and ensures effective accountability in the use
of such resources for the benefit of all Ugandans.
Ministry of Trade, Industry
and Cooperatives (MTIC)
Formulates and supports strategies, plans and programs that promote and
ensure expansion and diversification of tourism, trade, cooperatives,
environmentally sustainable industrialization, appropriate technology,
conservation and preservation of other tradable national products, to
generate wealth for poverty eradication and benefit the country socially
and economically.
Uganda Industrial Research
Institute (UIRI)
Undertakes applied research, and develops and acquires appropriate
technology in order to create a strong, effective and competitive
industrial sector for the rapid industrialization of Uganda.
Uganda Investment Authority
(UIA)
A statutory agency mandated to initiate and support measures that
enhance investment in Uganda and advise GOU on appropriate policies
conducive for investment promotion and growth.
Cotton and its By-Products Sector in Uganda
23
Stakeholder Group Roles, Functions and Interactions
UNCTAD/UNECA/COMESA International organizations providing technical assistance to the cotton
sector.
GROUP C - General Public and Institutions of higher learning
General Public At the periphery of the project, with minimal interest or influence.
Institutions of higher learning Busitema University - established in Busitema University in Busia
District. The institution aims to provide skill training in value-added
cotton products and improving the competitiveness of the sector. It offers
exclusive graduate and diploma courses on Ginning and Textile
Engineering.
Kyambogo University - has strived to give the country’s economy on
average 13 graduates every year (Bachelor of Science in Textile and
Clothing Technology and Diploma in Textile Design) since 2006.
GROUP D - Local Politicians
Local Politicians In cotton-growing areas, local politicians are key stakeholders in
influencing public opinion, including among farmers, about policies,
programmes and projects that affect cotton cultivation.
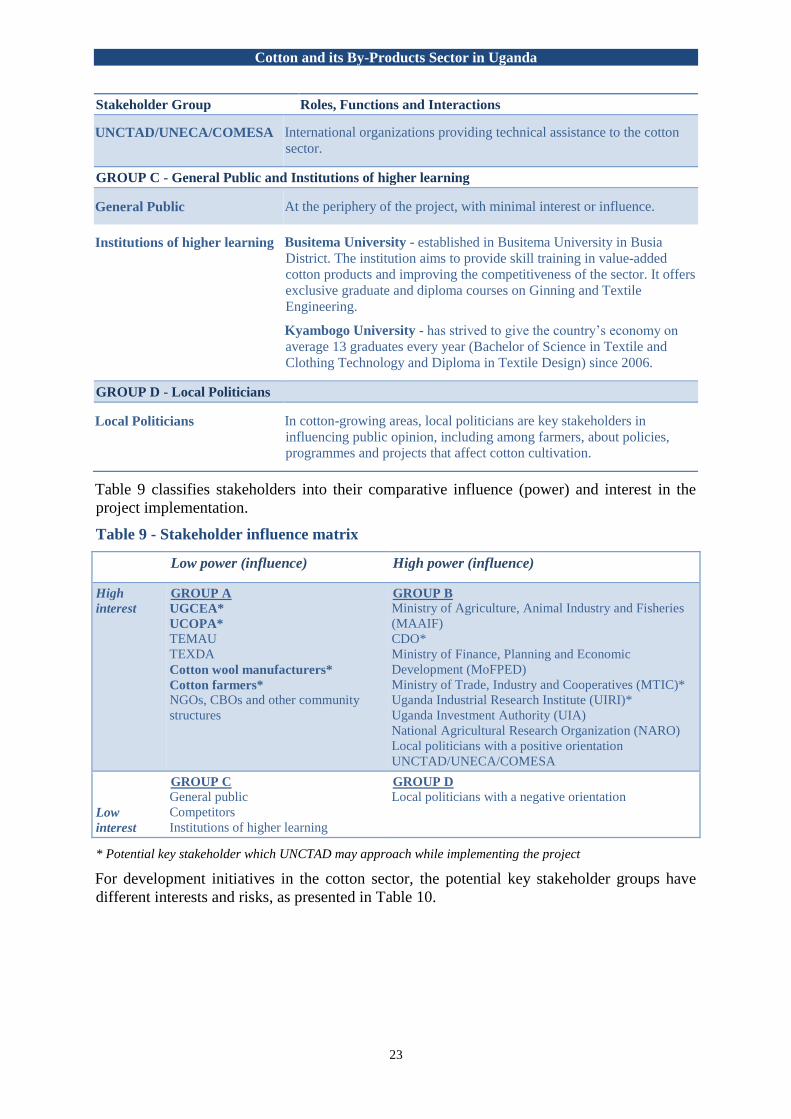
Table 9 classifies stakeholders into their comparative influence (power) and interest in the
project implementation.
Table 9 - Stakeholder influence matrix
Low power (influence) High power (influence)
High
interest
GROUP A
UGCEA*
UCOPA*
TEMAU
TEXDA
Cotton wool manufacturers*
Cotton farmers*
NGOs, CBOs and other community
structures
GROUP B
Ministry of Agriculture, Animal Industry and Fisheries
(MAAIF)
CDO*
Ministry of Finance, Planning and Economic
Development (MoFPED)
Ministry of Trade, Industry and Cooperatives (MTIC)*
Uganda Industrial Research Institute (UIRI)*
Uganda Investment Authority (UIA)
National Agricultural Research Organization (NARO)
Local politicians with a positive orientation
UNCTAD/UNECA/COMESA
Low
interest
GROUP C
General public
Competitors
Institutions of higher learning
GROUP D
Local politicians with a negative orientation
* Potential key stakeholder which UNCTAD may approach while implementing the project
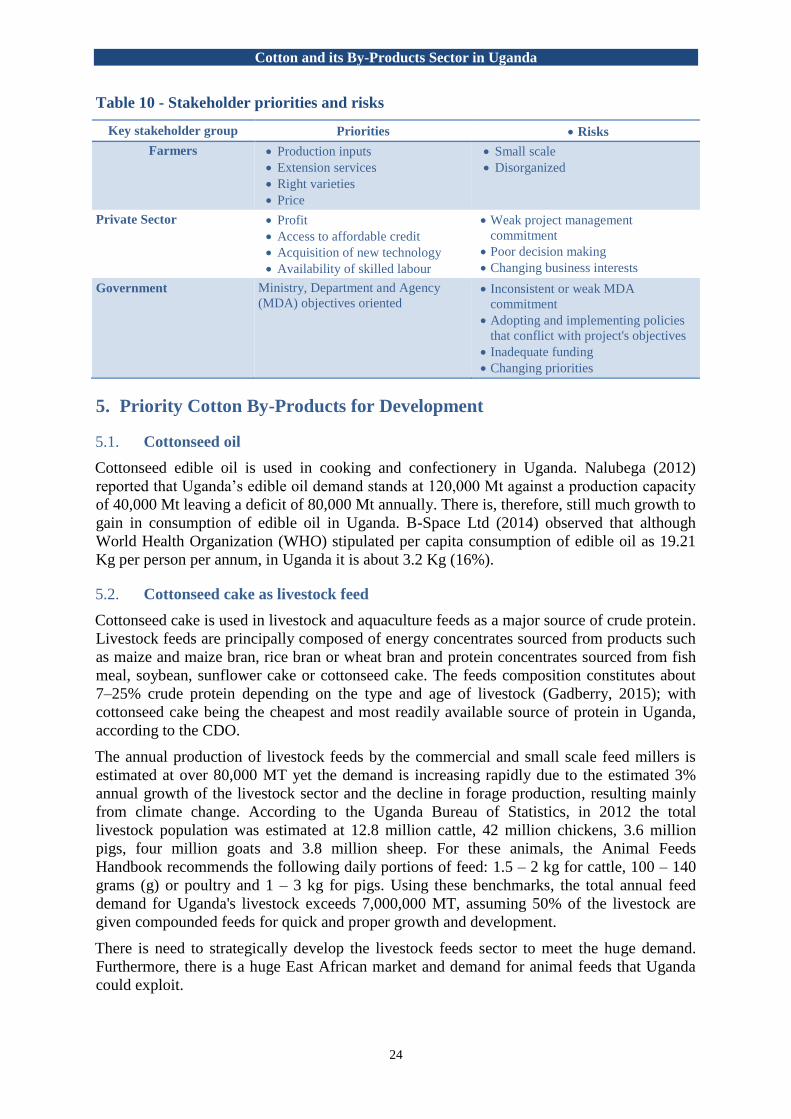
For development initiatives in the cotton sector, the potential key stakeholder groups have
different interests and risks, as presented in Table 10.
Cotton and its By-Products Sector in Uganda
24
Table 10 - Stakeholder priorities and risks
Key stakeholder group Priorities Risks
Farmers Production inputs
Extension services
Right varieties
Price
Small scale
Disorganized
Private Sector Profit
Access to affordable credit
Acquisition of new technology
Availability of skilled labour
Weak project management
commitment
Poor decision making
Changing business interests
Government Ministry, Department and Agency
(MDA) objectives oriented Inconsistent or weak MDA
commitment
Adopting and implementing policies
that conflict with project's objectives
Inadequate funding
Changing priorities
5. Priority Cotton By-Products for Development
Cottonseed oil 5.1.
Cottonseed edible oil is used in cooking and confectionery in Uganda. Nalubega (2012)
reported that Uganda’s edible oil demand stands at 120,000 Mt against a production capacity
of 40,000 Mt leaving a deficit of 80,000 Mt annually. There is, therefore, still much growth to
gain in consumption of edible oil in Uganda. B-Space Ltd (2014) observed that although
World Health Organization (WHO) stipulated per capita consumption of edible oil as 19.21
Kg per person per annum, in Uganda it is about 3.2 Kg (16%).
Cottonseed cake as livestock feed 5.2.
Cottonseed cake is used in livestock and aquaculture feeds as a major source of crude protein.
Livestock feeds are principally composed of energy concentrates sourced from products such
as maize and maize bran, rice bran or wheat bran and protein concentrates sourced from fish
meal, soybean, sunflower cake or cottonseed cake. The feeds composition constitutes about
7–25% crude protein depending on the type and age of livestock (Gadberry, 2015); with
cottonseed cake being the cheapest and most readily available source of protein in Uganda,
according to the CDO.
The annual production of livestock feeds by the commercial and small scale feed millers is
estimated at over 80,000 MT yet the demand is increasing rapidly due to the estimated 3%
annual growth of the livestock sector and the decline in forage production, resulting mainly
from climate change. According to the Uganda Bureau of Statistics, in 2012 the total
livestock population was estimated at 12.8 million cattle, 42 million chickens, 3.6 million
pigs, four million goats and 3.8 million sheep. For these animals, the Animal Feeds
Handbook recommends the following daily portions of feed: 1.5 – 2 kg for cattle, 100 – 140
grams (g) or poultry and 1 – 3 kg for pigs. Using these benchmarks, the total annual feed
demand for Uganda's livestock exceeds 7,000,000 MT, assuming 50% of the livestock are
given compounded feeds for quick and proper growth and development.
There is need to strategically develop the livestock feeds sector to meet the huge demand.
Furthermore, there is a huge East African market and demand for animal feeds that Uganda
could exploit.

Cotton and its By-Products Sector in Uganda
25
Figure 4 illustrates the approximate potential yield and value of deriving oil and seed cake
from cottonseed. In this example, exporting a kilogram of cottonseed would earn US$0.24,
but converting it into oil and cake would generate a total value of US$0.35, or 46% more.
Figure 4 - Value comparison, exporting raw cottonseed vs. edible oil and seed cake
Cotton wool 5.3.
It was observed during the 2016 CDO survey on status of cotton value addition in Uganda
that absorbent cotton wool is made from lint with a lint-to-cotton-wool conversion ratio of
approximately 100:86. The domestic market for cotton wool is quite large, the main buyers
and distributors in Uganda being National Medical Stores (NMS) and Joint Medical Store
(JMS), which must import some cotton wool to meet their annual requirement. At a cotton
wool outturn of 86% and total installed capacity of 2,010 MT, existing companies can
produce all the cotton wool needed in Uganda if barriers related to the development of cotton
by-products in Uganda listed above are addressed.
Figure 5 below illustrates the approximate potential yield and value of deriving cotton wool
from lint. In this example, exporting a kilogram of cotton lint would earn US$1.65, but
spinning it into wool would generate more than double the total value, at US$3.40.
Figure 5 - Value comparison, exporting cotton lint vs. wool
Particle boards from cotton stalks 5.4.
Cotton stalks are one of the important by-products of the cotton crop. It is estimated that
cotton cultivation generates 2-3 MT of stalks per hectare (Patil and others, 2007). It has been
observed in Uganda that most of the cotton stalks are treated as waste, although some are
used as fuel wood by rural communities. The bulk of the stalks are burnt in the fields after the

Cotton and its By-Products Sector in Uganda
26
harvest of the cotton crop, to control pests and disease-causing organisms. Cotton stalk is
comparable to most of the common species of hard wood with regard to fibrous structure and
hence can be used for manufacture of particle boards, preparation of pulp and paper, hard
boards, corrugated boards and boxes, micro-crystalline cellulose and as a substrate for
growing edible mushroom.
Cotton stalks are used industrially to make particle boards in countries such as Turkey and
India. Particle boards are used as door panel inserts, partitions, wall panels, marking furniture
items, floor and ceiling tiles, etc.
With rampant deforestation and the boom in the construction sector in Uganda, it is necessary
to find alternative sources of raw materials in order to preserve forests and protect the
environment. Cotton stalks are a cheap raw material, can meet the required standards for
particle boards and their utilization would give cotton farmers an extra income. The other
benefits would include:
Creation of business opportunities along the cotton stalk supply chain;
Renewable raw material to board industries;
Generation of rural employment;
As many as 250 people will be involved on daily wages in collecting, cleaning and
chipping cotton stocks to supply them to one factory with a capacity of 20 MT/day;
Employment of transporters.
6. Proposed Survey Questions
Cotton by-products have the potential to contribute greatly to Uganda’s economy. A number
of questions, however, need to be answered in order to realize this potential, including:
Ugandan electricity tariffs are high by regional standards, at US$0.12/kWh. In July 2015, the
GOU approved a tariff of US$0.05/kWh for textile mills.
Q1. What can be done to fast track the implementation of the new tariff, to attract
new investors and to reduce costs of operations for existing textile mills?
Ginneries, textile mills and oil mills throughout the country use outdated machinery,
constraining their ability to produce quality goods at competitive prices. The use of obsolete
machinery results in reduced efficiency and increased cost of operation and maintenance. In
addition to quality issues, servicing and repair of the existing machinery is also a problem,
due to a lack of skilled technicians and the unavailability of spare parts, often leading to low
capacity utilization.
Q2. How can the cotton sub-sector be supported in order to stimulate enhanced
efficiency, increased productivity and encourage production of improved
value-added products?
Q3. What measures should the Government put in place to develop technologies
for small and medium scale manufacturers?
The high cost of capital limits investments in upgrading existing machinery, or purchasing
new equipment. On commercial loans, banks charge interest rates ranging from 18% to 24%
per annum.

Cotton and its By-Products Sector in Uganda
27
Q4. What should the Government do to alleviate the cost of borrowing, to provide
the industry with greater access to financial services and long-term credit
resources, so as to upgrade the production and process technologies?
The low production of cotton has resulted in low utilization of the installed capacity at all the
cottonseed-based processing firms. This has adversely affected the industry’s operations and
overall profitability of these firms in Uganda.
Q5. What interventions should be undertaken to increase cotton production and
productivity in Uganda?
Domestically produced lint is only available on the Ugandan market from January to May
each year. Outside of this period, ginners are unwilling to hold lint bales without payment.
The financing required to stock bales for the entire year therefore becomes an additional cost
for spinners and cotton wool manufacturers.
Q6. How can the Government help ensure a year-round supply of raw materials to
domestic factories, without tying up investors’ working capital?
Shortage of specialized technicians results in inefficiency in operations and a high
dependence on expatriate technicians, adding to the cost of production. It is also observed
that the required semi-skilled workforce recruited for edible oil milling, as well as textile and
apparel fabrication, often come from an agricultural background. Their limited exposure to
machinery-based work further widens the skill gap, resulting in lower labour productivity,
increased worker turnover and a higher cost of production.
Q7. What measures should the Government put in place in order to enhance
capacity-building and training in the required skills for the cotton sub-sector
value chain?
Q8. What measures should the Government put in place to improve access to
skilled labour?
The influx of cheaper imported products and second-hand clothing has undercut the
competitiveness of domestic textile manufacturers.
Q9. What measures should the Government put in place to increase the
competitiveness of domestic industries?
Q10. How can Uganda exploit regional and global markets to develop its cotton by-
products industries?
Limited access to information on technology and market access contributes to lack of
awareness on new technology and markets.
Q11. What measures should the Government put in place to improve access to
adequate, up-to-date information on new technology and markets?
7. Conclusion
Cotton is one of the key commodities for generating household incomes, creation of
employment and alleviating poverty in Uganda. The potential for the sub-sector to contribute
to the economic development of Uganda is considerable, given the cotton value chain's
multiple levels of industrial activities (e.g. producing textiles, garments, edible oil and
livestock feeds) and its positive impact on food security. If value addition activities can be
expanded and fully exploited, the cotton sub-sector has the potential to contribute even more
to economic growth, employment and poverty alleviation.

Cotton and its By-Products Sector in Uganda
28
There are a number of benefits that result from promotion of cotton by-products in Uganda,
including:
- Increased returns per kg of lint
- Employment
- Improved and stable farm gate prices accruing from increased returns from sale of
value-added products
- Reduction in high turnover of farmers given the seasonality of cotton production
and provision of additional income to rural households
- Import substitution
All stakeholders must contribute if Uganda is to revitalize its cotton and cotton by-products
sectors, which would help improve the livelihoods of all Ugandans.
8. Biliography
Ahmed, M., & Ojangole, S. (2012). Analysis of Incentives and Disincentives for Cotton in
Uganda. Food and Agriculture Organization of the United Nations (FAO), Monitoring
African Food and Agriculture Policies Project (MAFAP). Rome: Food and Agriculture
Organization of the United Nations (FAO).
Asiimwe, A. (2012). Why Idi Amin expelled the Asians. New African, October. pp. 32-35.
Baffes, J. (2009). The Full Potential of Uganda's Cotton Industry. Development Policy
Review, 27 (1), pp. 67-85.
B-Space Ltd (2014). Assessing market attractiveness of cotton seed oil as a finished
consumer product to serve the BoP Market in Kasese, Uganda. BoP Innovation Centre,
Utrecht, Netherlands.
Chell Daniel, G. (2013). Uganda’s Cotton and Textile Sectors: Current Production
Challenges, Motivations and Effects on Development. SIT Digital Collections. SIT
Study Abroad.
Enger, J.W and D.R. Burgass (1989). Oil Seed Production and Processing. Sector Analysis.
Cooperative Agriculture and Agribusiness Support Project Uganda
Gadberry, S. (2015). Composition of selected Livestock Feeds. University of Arkansas,
United States Department of Agriculture.
IL&FS Cluster Development Initiative Limited (2014). Advisory Document of Cotton in
Uganda. Cotton Technical Assistance Programme for Africa. New Delhi.
Lundbaek, J. (2001). Privatization of the Cotton Sub-Sector in Uganda. Masters Thesis, The
Royal Veterinary and Agricultural University, Economics and Natural Resources,
Frederiksberg, Denmark.
Masiga, M., & Ruhweza, A. (2007). Commodity Revenue Management: Coffee and Cotton
in Uganda. Winnipeg, Canada: International Institute for Sustainable Development
IISD.
Mukiibi, J.K. (2001). Agriculture in Uganda. Vol II. Crops. Fountain
Publishers/CTA/NARO. pp. 322-375.
Nalubega, F. (2012). Uganda Cooking Oil Demand outwits Local Production. In: africa-
Uganda-Business-Travel-Guide.com
Cotton and its By-Products Sector in Uganda
29
National Textile Policy (2009). A Framework for the Textile Sub-sector Transformation,
Competitiveness and Prosperity. Ministry of Tourism, Trade and Industry. October,
2009.
Patil, P. G., Mr. R. M. Gurjar, Dr. A. J. Shaikh, Dr. R. H. Balasubramanya, Dr. K. M.
Paralikar, and Dr. P. V. Varadarajan (2007). Cotton Plant Stalk – An Alternate Raw
material to Board Industry. Central Institute for Research on Cotton Technology,
Adenwala Road, Matunga, Mumbai, 400019, India.
RATES (2003). Regional Agricultural Trade Expansion Support Program. Cotton-Textile-
Apparel Value Chain Report for Uganda. The RATES Centre, Nairobi, Kenya.
Uganda Bureau of Statistics. (2016). 2016 Statistical Abstract. Kampala: Government of
Uganda.

Cotton and its By-Products Sector in Uganda
30
9. Appendices
Map of cotton-producing areas in Uganda 9.1.
Source: Cotton Development Organization, Uganda

Cotton and its By-Products Sector in Uganda
31
Map of location of ginneries in Uganda 9.2.
Source: Cotton Development Organization, Uganda