CO$T OF GOVERNMENT DA Y 2008REPORT - Amazon S3 · That means in the last five years alone, ......
24
CO$T OF GOVERNMENT DAY ® 2008 REPORT Americans for Tax Reform Foundation • 1920 L Street, N.W., Suite 200, Washington, DC 20036 • (202) 785-0266 • F: (202) 785-0261 Center for Fiscal Accountability
Transcript of CO$T OF GOVERNMENT DA Y 2008REPORT - Amazon S3 · That means in the last five years alone, ......

CO$T OFGOVERNMENTDAY®2008 REPORTAmericans for Tax Reform Foundation
• 1920 L Street, N.W., Suite 200, Washington, DC 20036 • (202) 785-0266 • F: (202) 785-0261Center for Fiscal Accountability


1
Overview of Results 2
Cost of Government Day: Components ...................................................................................... 3
The Government Spending Burden ............................................................................................ 4
Federal Spending ................................................................................................................ 4
Special Focus: Spending and the Federal Budget Deficit.................................................. 5
The Economic Stimulus Package in Context .................................................................... 6
State and Local Spending.................................................................................................... 8
State Tax Increases.............................................................................................................. 8
Special Focus: Phase Out State Income Taxes .................................................................. 10
The Burden of Regulation .......................................................................................................... 11
Cost of Government Day By State .............................................................................................. 12
Interstate Migration .................................................................................................................... 14
America’s Entitlement Crisis ...................................................................................................... 17
Towards an Earlier Cost of Government Day ............................................................................ 21
TTAABBLLEE OOFF CONTENTS
Authored by Peter Ferrara

2008
6/11
6/16
6/21
6/26
7/1
7/6
7/11
7/16
7/21
7/26
1977
1979
1981
1983
1985
1987
1989
1991
1993
1995
1997
1999
2001
2003
2005
2007
CO
$T O
F G
OV
ER
NM
EN
T D
AY
®2008 REPORT
2
DefinitionCost of Government Day (COGD) is the date of the calendar year on which the averageAmerican worker has earned enough gross income to pay off his or her share of spendingand regulatory burdens imposed by government on the federal, state and local levels..
Cost of Government Day 2008Cost of Government Day for 2008 is July 16. Working people must toil on average 197days out of the year just to meet all costs imposed by government. In other words, thecost of government consumes 53.9 percent of national income.
Cost of Government: TrendsCost of Government Day falls four days later in 2008 than last year’s revised date ofJuly 12. In 2008, the average American will have to work an additional 17 days out ofthe year to pay off his or her cost of government compared to 2000, when the COGDwas June 29.
In fact, since 1977, COGD has fallen later than July 16 in only four of those 32 years -in 1982 and 1983, and in 1992 and 1993. The driving factor for this development is thefact that all components of the cost of government – federal spending, state and localspending, and regulation – are now increasing faster than national income.
This increase in the cost of government stands in sharp contrast to at least two periodsin the past thirty years: COGD fell sharply from a high of July 20 in 1992 to June 29 in1999 and 2000. In addition, COGD declined from a record high of July 23 in 1982 toJuly 3 in 1989. Both of these declines resulted from a combination of restraining thegrowth of federal spending while the economy was booming and rapidly increasingnational income.
OVERVIEW OOFF RREESSUULLTTSS
CCoosstt ooff GGoovveerrnnmmeenntt DDaayy 11997777 –– 2200008822000088:: JJuullyy 1166tthh

3
The average American worker will have to labor 83.7 days just to pay for federal spending, which isnow consuming 22.9 percent of national income. This compares to last year when the average Americanworker had to labor 82.6 days to pay for federalspending. This shows that federal spending is stillgrowing faster than national income, and much fasterthan it should be growing.
Dangers lurk at the federal level in the form of newentitlement programs that some want to adopt, evenin the face of future exploding costs for currententitlement programs, as discussed further below.
Contributing even more to rapidly rising governmentburdens right now is soaring state and localgovernment spending. The average American workermust labor 50.5 days this year, approaching twomonths, just to pay for state and local government
spending. That compares to 48.9 days just last year, and 44.3 days in 2003. That means in the last fiveyears alone, state and local spending has grown byalmost 12 percent relative to national income.
The average American worker must labor 62.6 days this year just to cover the costs of governmentregulation. This compares to 61.7 days for last year, reflecting accelerating growth in regulatory costs. While those costs had been stable at 16.9percent of national income for the previous four years, this year regulation is estimated to cost 17.2 percent of national income.
The big danger in the regulatory arena is that thesecosts are threatening to explode as well. As discussedbelow, global warming regulation, particularly any ofthe cap and trade bills pending in Congress, would add another trillion dollars to regulatory costs.
CCOOSSTT OOFF GGOOVVEERRNNMMEENNTT DDAAYY:: COMPONENTS
22000088 CCoosstt ooff GGoovveerrnnmmeenntt DDaayy CCoommppoonneennttss
84 days worked for
federal spending
50 days worked for
state and localspending
42 days worked
for federal regulation
21 days worked
for state/localregulation

89.29
87.69
84.72
81.83
79.5678.51
80.86
83.28
84.9184.26
85.72
83.9782.6
83.7
72.00
74.00
76.00
78.00
80.00
82.00
84.00
86.00
88.00
90.00
92.00
19951996
19971998
19992000
20012002
20032004
20052006
20072008
DDaayyss WWoorrkkeedd ffoorr FFeeddeerraall SSppeennddiinngg
CO
$T O
F G
OV
ER
NM
EN
T D
AY
®2008 REPORT
4
Federal SpendingFederal spending continues to be the single largestcomponent of the total cost of government, and themain driving force leading to the substantial increase in the cost of government over the last eight years.In 2008, the average American will have to work 83.7 days just to pay for the cost of federal spending,which will consume 22.9 percent of national incomethis year. This is a jump of over five days compared to2000, due to the growth in federal spending relative tonational income alone. Federal spending relative to theeconomy has increased 11.4 percent since 2000.
In contrast, despite the national defense buildup thatresulted in the collapse of the Soviet Union, PresidentReagan still led a reduction in federal spending from1982 to 1989 of close to 10 percent relative to theeconomy. Former House Speaker Newt Gingrichspearheaded spending restraint that led to a reductionin federal spending relative to the economy of 12.4percent from 1994 to 2000.
This sharp increase in federal spending burdens overthe last eight years is compounded by the continuingefforts of those who want to increase federal spendingeven faster. The new Democrat Congressionalmajorities tried to add to President Bush’s proposed2008 budget sharp increases in domestic discretionaryspending that amounted to only $22 billion in the firstyear, but would have ballooned to almost half a trilliondollars over the 10 years. The bloated $300 billionfarm bill passed by Congress over President Bush’s
veto is another example of Congress’s growingpropensity to increase federal spending.
But this year’s spending increase is just a warm up forthose who want to add new entitlement programs, evenwhile our current entitlement programs portend a tsunamiof future federal spending that will swamp the fundamentalsof our economic system without basic reforms.
President Bush proposed an increase of 20 percent overthe next five years for the State Children’s HealthInsurance program (SCHIP). Senate Democrats wantedto double SCHIP spending from $25 billion to $50billion, and House Democrats wanted to even triple it to$75 billion. While President Bush vetoed the SCHIP billpassed by Democrat majorities, and spending was held atthe level originally requested by the President, this debateis unlikely to go away.
One of the biggest dangers to fiscal restraint comes in the form of a push for the biggest new entitlement of all,national health insurance. Enacting a system of socializedmedicine alone could increase total federal spending byclose to $1 trillion per year, about one-third of the entirefederal budget.
This added burden would be on top of the alreadyunmanageable future costs for current entitlementprograms. That long term problem, and free marketsolutions for it, is discussed in a Special Focus sectionlater in this report.
TTHHEE GGOOVVEERRNNMMEENNTT SPENDING BURDEN

149
-50
-209-247
-95
18 19
128
-378-413
-318 -302
-160
236
-158
-500
-400
-300
-200
-100
0
100
200
300
2000 2001 2002 2003 2004 2005 2006 2007
Federal Budget Deficit Fiscal YearActual vs. Spending at National Income
Nat. Income
Actual
Second year of surplus
FFeeddeerraall BBuuddggeett WWoouulldd bbee iinn SSuurrpplluuss iiff SSppeennddiinngg wwaass iinn LLiinnee wwiitthh IInnccoommee GGrroowwtthh
5
Special Focus: Spending and the Federal Budget DeficitThe federal deficit is a completely uninteresting numberwhich is the difference between two meaningful andimportant numbers – the total level of federal spendingand the total level of federal taxes.
The size of government is determined not by the deficitbut by the level of spending and taxes. The deficit is also not a major driver of economic performance, up or down. Taxes, and the total burden of governmentspending, are truly major factors affecting the economy,as they determine the incentives for saving, investment,business, entrepreneurship, and work.
Nevertheless, it is noteworthy that despite rapidlygrowing federal spending, the federal deficit haddeclined to $162 billion, or just 1.2 percent of GDP, by 2007. This was down from a high of $412.7 billion,or 3.6 percent of GDP, just 3 years earlier, in 2004.
This decline was due to the rapid increase in federalrevenues resulting from economic growth, which hadbeen stimulated by the Bush tax cuts, particularly thereductions in marginal tax rates on capital income which were part of the Jobs and Growth Tax ReliefReconciliation Act (JGTRRA) adopted in 2003. Hadfederal spending been held to the rate of nationalincome growth since 2000, the deficit would have beeneliminated entirely by 2006.
The remaining deficit in 2007 was due entirely to thegrowth of federal spending in excess of national incomegrowth in prior years.
However, President Bush and Congress joined in passinga so-called economic stimulus package in early 2008.Because of that stimulus package, the CongressionalBudget Office (CBO) now projects the deficit for 2008to balloon to $357 billion.

CO
$T O
F G
OV
ER
NM
EN
T D
AY
®2008 REPORT
6
That stimulus package was touted as involving a taxcut or tax rebates. But in reality, it involved primarilyone-time cash grants intended to stimulate consumerspending demand based on old-fashioned Keynesiananalysis. Lacking reductions in tax rates or any otherpermanent change in the incentives for saving,investment, entrepreneurship or work, the stimuluspackage will not have any permanent or long termeffect on economic growth.
In fact, the stimulus package may not have anysignificant short term effect either. That is because thefederal government simply borrowed the money forthe cash grants through a higher deficit. Borrowingover $100 billion dollars from the economy to giveback the same amount in cash grants does not evenhave any net impact in increasing overall demand. Thisflawed logic was the reason why Keynesian economicsbecame discredited and abandoned in favor of taxcutting supply side economics in the 1980s.
A true stimulus package would have focused on areaswhere the tax system is hurting economic growth andrelieved those excessive burdens. One example iscorporate taxation. The federal corporate income taxrate is set at 35 percent. Adding in state income taxesleaves American corporations shouldering an averagecorporate tax rate of 40 percent. By contrast, the average
corporate tax rate in the European Union was reducedfrom 38 percent in 1996 to 24 percent in 2007.Consequently, America finds itself at a competitivedisadvantage not only with these countries, but withthe emerging giants of India and China. Thecorporations bearing this tax burden are the onesexpected to provide working people with jobs, betterincomes, and long term prosperity. That is not goingto happen with corporate tax rates among the highestin the industrialized world.
In addition, business expenses are deductible for theincome tax in the year they are incurred, except for theexpenses of capital investment. These may bededucted generally only over several years underdepreciation schedules specified by the IRS. Thisdiscriminates against and discourages investment inthe U.S. Capital investment expenses should bedeductible in the year they are incurred, just like allother business expenses.
Moreover, the capital gains tax imposes a second layerof taxation on capital income, in addition to theincome tax. A capital gain represents an increase in theexpected future income to a capital asset. That incomewill be taxed when it is earned. To tax the gain as wellamounts to effectively taxing the income to the capitalasset twice. That is why the capital gains tax should be
The Economic Stimulus Package in Context
7
abolished, a policy already adopted by some of ourmajor international competitors. At least, the capitalgains tax rate could be further reduced from thepresent 15 percent to 10 percent.
Another highly desirable change would be to reducethe top individual tax rate from 35 percent to 25percent to match the top corporate tax rate. Manysmall businesses and partnerships operate underindividual tax rates and their rate should be no higherthan the corporate rate.
Rather than wasting a $200 billion increase in thedeficit on ineffective Keynesian cash rebates, a trueeconomic stimulus package would have included atleast some if not all of these components. Such apackage would produce a long-term economic boomsimilar to the booms of the 1980s and the mid- to late1990s. Capital would flow into the United States onceagain from all over the world, relieving any creditcrunch. Demand for the dollar to invest in the U.S.would soar, reversing the dollar’s decline and givingthe Federal Reserve Bank more leeway for anaccommodative monetary policy.
Short of comprehensive tax reform, such as the 17percent optional flat tax advanced by Steve Forbesand the alternative systems proposed by CongressmanPaul Ryan (R-Wis.) and Sen. John McCain (R-Ariz.),
incremental tax reform based on the above proposalsrepresents a highly desirable agenda for reform.
The booming economy produced by this taxpayer agendawould provide a solid foundation for balancing thefederal budget in the short run, for those who consider itimportant. If federal spending was merely limited to growno more than the growth in national income, or thatgrowth minus 1 percent, the current federal budgetdeficit would be eliminated within a few years.
This combination of tax cuts coupled with spendingrestraint was precisely the formula used to eliminatethe long-standing federal deficits in the 1990s, turningthem into large surpluses instead. Despite the record-setting tax increase of 1993, when the new RepublicanCongressional majorities came into office in 1995,President Clinton’s budget still projected annual $200billion budget deficits indefinitely into the future. The Congressional majorities adopted tax cuts oncapital investment accepted by President Clinton,which resulted in booming economic growth. Theyalso limited federal spending increases to 3.9 percent for 1996, 2.6 percent for 1997, 1.5 percent for 1998,and 3 percent for 1999. With the new revenues frombooming economic growth, this is what turned the$200 billion annual deficits into $200 billion annualsurpluses. Employing this strategy again would be an effective way to eliminate federal deficits.

44.2243.50
42.62 42.38 42.4343.04
44.84 45.1844.34 44.43
45.0444.52
48.9
50.50
38
40
42
44
46
48
50
52
1995 1996 1997 1998 1999 2000 2001 2002 2003 2004 2005 2006 2007 2008
CO
$T O
F G
OV
ER
NM
EN
T D
AY
®2008 REPORT
8
State and Local SpendingIn 2008, the average American will work 50.5 days to pay for state and local spending. That is up from48.9 days just last year, and 44.3 days in 2003.Consequently, in just the last five years state and local spending has increased by almost 12 percentrelative to national income.
Since a low of 42.4 days for state and local spending in 1999, states have increased their spending by 19.1 percent relative to national income. This runawayexplosion in state and local spending is the mainreason COGD increased by four days over last year. Following the election of more governors andlegislators advocating higher spending in 2006, stateand local spending has increased by 13.5 percentrelative to the economy.
State Tax IncreasesGiven that most states increased taxes to continuespending during the economic slowdown, ATRF has compiled a list of state tax increases by state from FY 2002 to FY 2008. This list is based on data fromthe National Governor’s Association, with twoadjustments. First, we compounded the tax increasesto reflect hikes adopted since 2002 which have to bepaid in successive years. Second, we adjusted eachstate’s tax increases by population to produce a bettercomparison across states.
The index shows that New Jersey continues tooverwhelmingly lead all states in terms of taxincreases. The Garden State government increasedtaxes on each resident by $2,601 since FY 2002, for a total tax increase of over $22 billion. On a per capitabasis, residents in Connecticut, Nevada, Rhode Islandand New York also suffered per capita tax increasesof over $1,000 over this period.
Six states, led by Idaho and Florida, reduced taxesfrom FY 2002 through FY 2008. The others areHawaii, Arizona, Iowa, and Louisiana.
SSttaattee aanndd LLooccaall SSppeennddiinngg SSooaarrssDDaayyss WWoorrkkeedd ttoo PPaayy ffoorr SSttaattee//LLooccaall SSppeennddiinngg 11999955--22000088

9
State Total $ Amount Per CapitaNew Jersey 16,670,900,000.00 1,910.80
Connecticut 4,607,600,000.00 1,314.65
Nevada 2,661,200,000.00 1,066.39
Ohio 10,867,800,000.00 946.84
New York 17,684,900,000.00 916.02
Rhode Island 972,700,000.00 911.10
Alaska 553,500,000.00 826.05
Indiana 5,136,400,000.00 813.56
Tennessee 4,874,600,000.00 807.21
Delaware 673,900,000.00 789.59
Illinois 8,545,000,000.00 665.91
Minnesota 3,358,700,000.00 650.02
Oregon 2,203,200,000.00 595.34
Michigan 5,680,400,000.00 562.66
North Carolina 4,982,900,000.00 562.63
Vermont 350,300,000.00 561.46
Kansas 1,417,500,000.00 512.83
Massachusetts 3,124,600,000.00 485.40
New Hampshire 519,500,000.00 395.09
Virginia 2,699,800,000.00 353.24
Maine 418,300,000.00 316.52
Maryland 1,504,900,000.00 267.98
New Mexico 388,500,000.00 198.76
Nebraska 316,500,000.00 178.98
North Dakota 106,800,000.00 167.96
State Total $ Amount Per CapitaWisconsin 930,700,000.00 167.50
Oklahoma 493,200,000.00 137.80
Washington 878,200,000.00 137.31
South Dakota 92,800,000.00 118.68
Pennsylvania 1,453,200,000.00 116.81
Arkansas 269,800,000.00 95.98
Montana 90,600,000.00 95.91
Alabama 431,500,000.00 93.82
South Carolina 376,100,000.00 87.04
Kentucky 308,600,000.00 73.37
Colorado 325,000,000.00 68.37
Iowa 161,700,000.00 54.22
Utah 117,400,000.00 46.04
West Virginia 76,200,000.00 41.90
California 1,344,700,000.00 36.88
Georgia 322,500,000.00 34.44
Missouri 114,200,000.00 19.55
Texas 124,100,000.00 5.28
Mississippi 10,000,000.00 3.44
Arizona -1,600,000.00 -0.26
Louisiana -108,100,000.00 -25.21
Wyoming -51,600,000.00 -100.19
Florida -3,301,000,000.00 -182.48
Idaho -322,900,000.00 -220.19
Hawaii -479,900,000.00 -373.32
STATE TAX INCREASES COMPOUNDEDPPEERR CCAAPPIITTAA FFYY 22000022--FFYY22000088

CO
$T O
F G
OV
ER
NM
EN
T D
AY
®2008 REPORT
10
Special Focus: Phase Out State Income TaxesNine states prosper without any state income tax at all.These include the big states of Texas and Florida, aswell as booming Tennessee, and Washington, Alaska,Nevada, New Hampshire, South Dakota, andWyoming. Economic studies show these states enjoyhigher economic growth, and more rapidly growingwages and family incomes.
The other 41 states should follow their lead and phaseout their state income taxes as well. While replacingthese taxes with no other tax would be preferable,political realities will not allow for such a move. Short of that, part of the “lost” revenue could bemade up by increasing state sales taxes by a couple of percentage points, ideally coupled with taxpayerprotections preventing the tax shift from turning intoan overall tax increase in the long run. The rest could bemade up by restraining the growth of state spending.
One workable option would be to reduce state incometaxes by the percentage that could be financed byincreasing state sales taxes by 2.5 percentage points.State spending could be limited to grow no more thanwhat could be financed by state revenue growth of no more than the increase in state income minus 1 percentage point. Alternatively, the limit could be the rate of growth of state population plus inflation.When revenue grows by more than this limit, theexcess would be used to reduce state income taxesfurther, until the state’s income taxes can be phasedout completely. This could be accomplished in eachstate in less than a decade. The spending restraintcould be continued after that point to reduce statesales taxes.
The reduction and eventual elimination of incometaxes would cause state economies to boom, whilereducing the burden of excessive government growth.As discussed in the Interstate Migration section below,taxpayers are “voting with their feet” – and migratingover time into the states with no income taxes fromthe rest of the country, taking their productivity andthe income they generate each year with them, whichproduces more in revenues for these no-income-taxstates.

11
The average American will have to work 62.6 days in2008 to pay for the costs of government regulation.This is up from a revised 61.7 days in 2007. Whilethose costs had been stable at 16.9 percent of nationalincome for the previous four years, this year regulationis estimated to cost 17.2 percent of national income.
Among the most costly new regulations issued sincethe last COGD report is the fine particle implementationrule imposed by the Environmental Protection Agency(EPA), which the agency itself estimates will add anadditional $6.7 billion per year to regulatory costs. The Department of Homeland Security has issuedanti-terrorism standards for chemical facilities, which it estimates will cost $1.4 billion per year. The Departmentof Transportation has issued new regulations onelectronic stability control systems for automobiles,which will cost an additional $1 billion per year.Transportation has also issued new rules regardingvehicle side-impact collisions costing, again by theirown estimates, about $764 million. These agencyestimates have generally been well below actual costsimposed by their new regulations.
The above estimate of total regulatory costs includesonly the cost of complying with regulations. Thisincludes the cost of material resources and laborneeded to carry out compliance. For example, if a
regulation requires new pollution control equipmentfor power plants, compliance costs include the costsof manufacturing, installing, operating and maintainingthe equipment.
Not counted are the negative economic effects ofregulatory requirements. These hidden costs slow the economy, as they introduce inefficiencies anddistortions, and reduce the economic reward left overfor productive activity. Regulations may prevent new firms from entering the market, or stop existingones from expanding. They may even force someexisting firms out altogether. The end result is lessoverall output, fewer jobs, lower wages and lowereconomic growth.
These economic costs may be as large as the directcompliance costs of regulation. Economists atWashington University at St. Louis, leaders in thestudy of regulation, estimated these costs to be over$1.5 trillion per year.
These costs are threatening to explode due to costly and unnecessary global warming regulation. Proposedcap and trade legislation would require companies tobuy costly federal permits to use oil, gas, coal and otherhydrocarbon fuels in producing goods and services forthe American people. This would layer close to a trillion
TTHHEE BURDEN OOFF RREEGGUULLAATTIIOONN 2008
13.0%
14.0%
15.0%
16.0%
17.0%
18.0%
19.0%
1977
1979
1981
1983
1985
1987
1989
1991
1993
1995
1997
1999
2001
2003
2005
2007
TToottaall RReegguullaattoorryy BBuurrddeenn 11997777 ttoo 22000088TToottaall RReegguullaattoorryy CCoossttss aass aa PPeerrcceennttaaggee ooff NNaattiioonnaall IInnccoommee

dollars a year in unnecessary costs on the Americaneconomy, just to start. The price of gasoline wouldincrease further, and the cost of electricity would beginto soar as well. The cost of food, and especially meat,would rise due to higher costs for fertilizer, farm fuel,truck hauling for produce, and other factors. Theproduction of oil and gas would be further restricted,increasing their prices even more.
This would result in additional costs due to reducedeconomic growth. Manufacturing would be especiallyhard hit, as U.S. firms would suffer a cripplingdisability in international competition due to highenergy costs. The resulting loss of high payingmanufacturing jobs would climb to two million, andpossibly more.
These costs would be imposed even though there isstill no scientific consensus on the nature, origins, or
there has been no warming for at least 10 years, and extent of the global climate change we may beexperiencing. Indeed, some point to studies showingeven the U.N. has recently projected there will be nowarming for at least another 10 years as well. In fact,the global temperature data has shown a slight coolingtrend over the last 5 years which may well continue1.
Nor is the scientific community united in a best possiblecourse of action, even among those supporters of theman-made theory of global warming. Even someadvocates of the most restrictive and far-reaching globalwarming regulation, the cap and trade bill, admit that itwould have no significant effect on global warming,even if it is occurring.
These factors magnify the imprudence of imposingfurther regulatory burdens on the economy througharbitrary controls of CO2 production.
12
1 Researchers belonging to the U.N. Intergovernmental Panel on Climate Change, or IPCC, wrote in Nature (May 1) that “lobal surface temperature may not increase overthe next decade, as natural climate variations… temporarily offset the projected anthropogenic warming.” Referenced in: Steven Milloy, Junk Science: The Great GlobalWarming Race, FoxNews.com, Thursday, May 01, 2008. www.foxnews.com/story/0,2933,353844,00.html
COST OF GOVERNMENT DAY BY STATE
Across is the Cost of Government Day for each statebased on the varying government burdens suffered in each state. Federal spending burdens varybecause relatively higher burdens are borne by stateswith relatively higher incomes. Of course, state andlocal tax and spending burdens vary by state as well.
The highest state Cost of Government Day is onceagain in Connecticut, with the average worker toiling all the way until the end of the month, July 31,to pay the costs of government at all levels. Secondplace now belongs to New Jersey, with COGD nowfalling on July 30. New York is right behind on July 28. These three mismanaged states have
sacrificed economic growth and personal liberty at the expense of the public employee unions, withlittle consideration given to taxpayers.
California follows up in fourth worst place, with aCOGD of July 23. Dramatically worsening fiscalconditions in this state will lead it to soon challengethe top three for worst state for taxpayers.
Next come Washington, Massachusetts, Marylandand Minnesota, where liberal politicians have felt noserious constraints on raiding the taxpayers forendless funds to curry favor with aligned specialinterest groups.

13
2008 Cost of Government Day
Rank in
2008
United States 197 July 16Alaska 172 June 21 1Mississippi 181 June 30 2Montana 182 July 1 3West Virginia 182 July 1 4Alabama 183 July 2 5Kentucky 184 July 3 6Tennessee 185 July 4 7Oklahoma 185 July 4 8New Mexico 186 July 5 9South Dakota 186 July 5 10Texas 186 July 5 11North Dakota 186 July 5 12Louisiana 187 July 6 13Delaware 188 July 7 14Missouri 188 July 7 15New Hampshire 189 July 8 16Iowa 190 July 9 17South Carolina 190 July 9 18Oregon 190 July 9 19Michigan 190 July 9 20Arkansas 191 July 10 21Indiana 191 July 10 22Ohio 191 July 10 23North Carolina 191 July 10 24Kansas 192 July 11 25Nebraska 193 July 12 26Vermont 193 July 12 27Georgia 193 July 12 28Maine 194 July 13 29Wyoming 194 July 13 30Arizona 194 July 13 31Idaho 194 July 13 32Pennsylvania 195 July 14 33Utah 195 July 14 34Illinois 197 July 16 35Colorado 197 July 16 36Wisconsin 198 July 17 37Rhode Island 198 July 17 38Virginia 199 July 18 39Nevada 200 July 19 40Hawaii 200 July 19 41Florida 200 July 19 42Minnesota 201 July 20 43Maryland 202 July 21 44Massachusetts 202 July 21 45Washington 203 July 22 46California 204 July 23 47District of Columbia 207 July 26 -New York 209 July 28 48New Jersey 211 July 30 49Connecticut 212 July 31 50
State# Of Days Worked
For Government
CO
$T O
F G
OV
ER
NM
EN
T D
AY
®2008 REPORT
14
Several empirical studies have documented the surgeof taxpayers moving from high tax to low tax statesover the past 15 years. Indeed, these studies showthat taxes are the single largest factor in interstatemigration, rather than such factors as weather,employment, family relocation, etc.
Our analysis here takes these previous studies one stepfurther. Using IRS data, we calculate not only thenumber of taxpayers migrating, but also the income ofthese migrants. Our findings confirm previous studiesthat taxpayers are leaving states with higher taxes, andalso show that they are migrating from states withhigher unfunded pension and healthcare liabilities
Taxes matter and the states raising taxes are losingpopulation. The 9 states with no income tax gainedover 300,000 residents from the other 41 states in2004 alone. These residents took with them anadditional $10.6 billion of adjusted gross incomeaccording to IRS data.
In 2005, these states gained 348,404 new residentsfrom the other 41 states, bringing with them $12.9billion in additional income. In 2006, these statesgained 410,542 new residents from the other states,bringing with them $13.8 billion in new income.Consequently, over the last three years for which dataare available, the states with no income tax gained wellover 1 million residents (1,082,525) from the other 41states, bringing with them $37.3 billion in new incomeover that period.
Moreover, from 1996 through 2006, the 10 states withthe highest tax burden lost 2.4 million residents to theother states. These residents took with them to those
states during that period a staggering $70 billion($69.51) in income.
During the same period, 1996 through 2006, the ten states with the lowest tax burden enjoyed an in-migration of 1.4 million residents from the otherstates. From 2004 to 2006 alone, 305,594 residentsmoved to these low tax states. Due to that inflow of residents, these 10 lowest tax states enjoyed acumulative real income gain of $30.5 billion from 1996 to 2006.
Retirees are also moving to seek lower tax burdens.Apart from Alaska, which has a unique fiscal situation,the overwhelming trend is resident growth in the 9 states without income taxes. This includes not onlysunny southern states, but also New Hampshire,which gained over 72,000 residents from 1996 to2006, and Washington State, which gained over150,000 residents during the same period.
At the same time, states with large unfunded liabilitiesfor public employee health care and pension programsare losing population. Workers ages 30 to 40 justentering their prime earning years are in particularfleeing the future higher taxes that will be needed topay these unfunded liabilities.
The migration of residents from high to low tax states is the biggest issue facing state governments inover ten years. Without significant fiscal restraint aswell as reform in public employee pension and healthcare retirement programs, states with heavy tax andentitlement burdens will continue to see residentsleave for lower tax states, further draining state treasuries.
IINNTTEERRSSTTAATTEE MMIIGGRRAATTIIOONN

15
0
50,000
100,000
150,000
200,000
250,000
300,000
350,000
400,000
450,000
1996 1997 1998 1999 2000 2001 2002 2003 2004 2005 2006
TToottaall RReessiiddeenntt GGaaiinnss ooff SSttaatteess wwiitthh NNoo IInnccoommee TTaaxx
-1.5
-1.0
%
-0.5%
0.0 %
%0.5 %
1.0 %
1.5 %
2.0 %
3.0 %
3.5 %
Source: S&P, IRS, American Shareholders Assoc.
Unfunded Pension States Already Losing Population
Per Capita Unfunded Pension Liabilities
2.5 %
%
%
%
100
100 2000 3000 40000
UUnnffuunnddeedd PPeennssiioonnss YYiieellddss PPooppuullaattiioonn OOuutt--MMiiggrraattiioonn
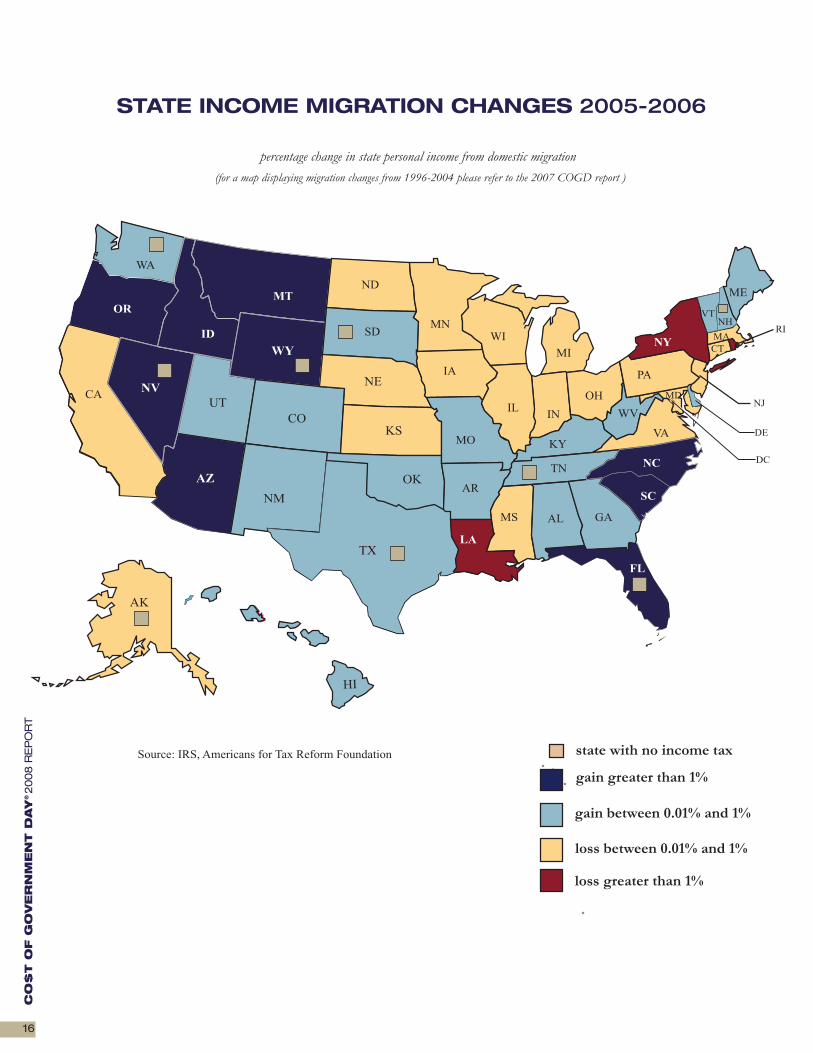
percentage change in state personal income from domestic migration
Source: IRS, Americans for Tax Reform Foundation
gain greater than 1%
gain between 0.01% and 1%
loss between 0.01% and 1%
loss greater than 1%
STATE INCOME MIGRATION CHANGES 2005-2006
(for a map displaying migration changes from 1996-2004 please refer to the 2007 COGD report )
WA
OR
OK
KSMO
UT
ID
NDMT
NE
SD
WY
CO
NM
TX
ARAZ
NVCA
AK
LA
IA
MNWI
IN
KY
TN
MS AL GA
NC
SC
FL
OH
MI
PA
WV
VA
NY
ME
VTNH
MA
RI
CT
NJ
DE
DC
MD
HI
IL
state with no income tax
16
CO
$T O
F G
OV
ER
NM
EN
T D
AY
®2008 REPORT

17
Federal spending has hovered around 20 percent ofGDP for over 50 years now, ever since it settled downafter World War II. Despite all the battles over taxesand spending, the federal share of our economy hasbeen fairly stable all of this time.
However, this relative stability will change quitedramatically without fundamental reform of ournation’s entitlement programs. The latest long termprojections of the Congressional Budget Officeestimate that federal spending will soar to close to 40 percent of GDP over the next 30 years or so,
primarily due to exploding costs for Social Security,Medicaid, and Medicare. Factoring in costs for stateand local government, the explosion of entitlementprograms will bring total government spending inAmerica to well over 50 percent.
If anything even close to this happens, the fundamentalnature of the U.S. economy and government will havechanged. We will have traded in our capitalist freemarket economy, the source of America’s historicprosperity, for Swedish socialism. The advocates oflimited government will have been completely routed.
AAMMEERRIICCAA’’SS EENNTTIITTLLEEMMEENNTT CCRRIISSIISS

CO
$T O
F G
OV
ER
NM
EN
T D
AY
®2008 REPORT
18
The Fallacy of the “Smart Surrender” Strategy This looming disaster has rattled even some conservativesin Washington. Some of them want to negotiate a granddeal between conservatives and liberals, Republicans andDemocrats, with huge tax increases in return for largeentitlement benefit cuts. But if federal spending is at 20percent of GDP now and rising to 40 percent, where willsuch a deal leave it in the future?
Cutting such a deal would no doubt leave it somewherein the middle. However, even an increase to 30 to 35percent would still have disastrous consequences for theAmerican taxpayer. The “smart surrender” strategistswould offer to free market advocates of limitedgovernment a huge, unprecedented tax increase, hikingfederal taxes by somewhere near 75 percent relative to GDP, and in return, Americans would see a huge,unprecedented increase in federal spending, alsosomewhere near 75 percent relative GDP.
This is not inspired leadership. It is pedestrian thinkingleading only to surrender and defeat. Taxpayer and freemarket advocates need to oppose any movement in this direction.
This entire approach fundamentally misconceives thetrue nature of the problem. The problem is not the longterm deficits, with the top priority being a deal to balancethe long term budget. A deficit of 5 percent of GDPwith federal spending at 20 percent is far preferable toa balanced budget with federal spending at 40 percentof GDP.
The real problem is the total level of governmentspending. Reform needs to focus on reducing federalspending as a percent of GDP. Tax increases do not helpto solve the problem. They just feed more federalspending, so they only compound the problem.
On the other hand, this looming economic and fiscalcatastrophe is never going to be avoided by simply tryingto cut entitlement benefits. The gap is just too big. Thepolitical system will never allow for enough cuts to makemuch of a difference.
The Solution: Thinking Outside the BoxPolitically successful entitlement reform requiresreformers to think outside the box of currententitlement programs. Instead of focusing on packagesof tax increases and benefit cuts, reformers need tofocus on restructuring and modernizing theseprograms from the bottom up. The public is still goingto insist on maintaining social safety nets that protecteveryone. But through fundamental, structuralreforms, we can provide new entitlement frameworksthat actually maintain the social safety net and, indeed,actually achieve the social goals of these programs far better than the current, outdated, 19th centuryentitlement structures. The key is to bring in muchgreater roles for highly productive modern capital andlabor markets to serve the goals of these programs.
At the same time, these reforms would leave theprograms costing far less in terms of governmentspending. In fact, far more can be achieved inreducing Big Government and government spendingthrough these positive structural reforms than throughbenefit cuts. This approach provides the prospect ofactually making entitlement reform appealing tovoters, and, indeed, even popular.
Replace the Payroll Tax with Personal Accounts.One key concept for positive, structural entitlementreform is personal accounts for Social Security, whereworkers would be free to choose to substitute savingsand investment accounts for at least part of the currentsystem. These accounts involve expanding the overallSocial Security framework to bring in a central role for modern capital markets in serving the goals of the program.
Personal accounts are especially powerful in reducinggovernment spending because they don’t just trim thegrowth of such spending. They would shift huge chunksof it from the public to the private sector, dramaticallyreducing federal spending over the long run.
These accounts could start at any size, and then could beexpanded over time until workers could choose tosubstitute the accounts for all of their Social Security

19
retirement benefits. The accounts could be expandedfurther, eventually substituting private life insurancefor Social Security survivor benefits, and privatedisability insurance for Social Security disabilitybenefits. Ultimately, personal accounts could beexpanded to cover the payroll taxes for Medicare, withthe saved funds financing annual annuity benefits thatwould be used to purchase private health insurance inretirement. Such accounts would reduce federalspending by close to 10 percent of GDP, as theyreplace this spending with market financed benefits.Such spending reductions would involve an enormous,unprecedented, historic achievement.
In the process, the payroll tax would ultimately bephased out completely, and replaced with an engine ofpersonal family wealth in the personal accounts.Workers would get much better benefits through theseaccounts because market investment returns are somuch higher than what the non-invested, purelyredistributive, Social Security system can even promise,let alone what it can pay. Workers across the boardwould accumulate several hundred thousand dollars inreal terms by the time they retire, directly owned by eachworker, which could be left to the family at death.Average income families could expect to accumulateclose to a million dollars and more in the accounts. Thiswould do far more to reduce inequality than anythingelse, yet do so in a way that reinforces rather thanundermines the economy. Indeed, done right, suchreform would produce an historic breakthrough in thepersonal prosperity of working people.
This is a dramatic, long term vision for reform for thetaxpayer movement and free market advocates to worktowards over time.
A bill introduced in the last Congress by Rep. Paul Ryan(R-Wis.) and Senator John Sununu (R-N.H.) serves as acomprehensive model of how to structure suchaccounts, with substantial input from the Social SecurityAdministration itself and from experienced Wall Streetfund administrators on how to make the conceptworkable. That bill also maintained the current socialsafety net in full, by including a federal guarantee that if
any retiree’s account cannot pay at least what SocialSecurity would under current law, the federalgovernment would pay the difference. This is feasiblebecause capital market returns are so much higher thaneven what Social Security promises, let alone what it canpay. As a result, it is extremely unlikely that the fullyinvested personal accounts would not be able to pay atleast what Social Security promises, especially whenworkers are investing through a structured frameworkwhere they are choosing among highly diversified,professionally managed, investment funds approved andregulated by the government for safety and soundness.These features follow exactly the model personalaccount reform adopted in the South American nationof Chile over 25 years ago, which has workedspectacularly well.
Recent history confirmed the popularity of suchpersonal account reforms as many candidates wonelections campaigning on such accounts from 1998through 2004, including President Bush. Indeed,voluminous polling conducted over the summer of2007 by Newt Gingrich’s organization AmericanSolutions found that two-thirds of Americans stillsupport a personal account option for Social Security.This is the most popular reform alternative for SocialSecurity by far.
President Bush’s failure to enact reform should not beheld as evidence of contrary public opinion. Despite hispolicy goals, President Bush allowed every ill-advised,unpopular idea to remain on the table as well, such ascutting the basic benefit formula, increasing taxes,delaying the retirement age, etc. This buried the positive,popular features of the personal accounts, discouragedthe grassroots, and lost the appeal to the general publicnecessary to succeed in enacting the reform. Futureleaders should and will take away the palatability offundamental Social Security reform as initially advancedby President Bush, without falling into the same trapsagain when the opportunity arises to push for legislation.
Block Grant Welfare to the States. A second keyconcept for positive, structural entitlement reform isblock grants back to the states for the remaining
CO
$T O
F G
OV
ER
NM
EN
T D
AY
®2008 REPORT
20
federal welfare programs. Legislation enacted in 1996block granted the old Aid to Families with DependentChildren (AFDC) program back to the states. Theshare of federal spending on this program was returnedto each state in a block grant to be used in a newprogram designed by the state based on mandatorywork for the able bodied. The key is that the blockgrant is finite, not matching, so it does not vary withthe amount the state spends. If the state spends more,it must pay for the extra costs itself. If the statespends less, it can keep the savings.
The reform was shockingly successful, with the oldAFDC rolls reduced by close to 60 percent nationwide,and close to 80 percent in states that pushed workmost aggressively. Requiring able bodied recipients towork for their benefits eliminates the old welfare workdisincentives. But probably even more important arethe reversed incentives for state administrators.Previously, the federal government matched increasedstate spending, so each new welfare dependant signedup brought more federal funds to the state. But withthe state now paying all added costs, the focus haschanged to getting recipients out to work.
These reforms bring in modern labor markets to take over more of the role of providing for the poor,through wages earned in real private sector jobs. This again sharply reduces government spending over the long run.
These same reforms should now be extended to theother federal welfare programs, particularly thebudget-busting Medicaid program. Even if the reformallowed each state to keep all of its savings fromgreater flexibility, positive incentives, and reducedrolls, and federal spending on the block grants wasjust not increased, block granting Medicaid alonewould save the federal government a trillion dollarsover the first ten years. This would help greatly infinancing the transition to personal accounts. If federal
spending growth on the block grants was limited togrow no faster after that than the rate of growth ofGDP, then Medicaid would no longer contribute toincreasing federal spending as a percent of GDP.
Large personal accounts would contribute to reducingMedicaid spending over the long run, by providing asource of funding for nursing home care insurance forolder retirees. If families reach retirement age with halfa million to a million dollars in their accounts, theycould use some of that money to buy such insuranceto protect the rest of the family nest egg. Personalaccounts and block grants for Medicaid consequentlyare quite complementary reforms.
Such block grant reforms should also be expanded to Food Stamps, federal housing assistance programs,Supplemental Security Income (SSI), and other,smaller federal welfare programs as well. The newstate programs created with these block grant fundscan be focused on getting beneficiaries into real,private sector jobs, market health insurance, andultimately even home ownership. The result would bea much better overall safety net system for the poor,and ultimately a transformation of the current “welfaresystem” into a “Prosperity System”. This wouldprovide a new, historic opportunity to dramaticallycurtail poverty, and again greatly expand the prosperityof working people.
Shifting all these welfare programs back to the stateswould produce enormous savings in federal spending.Indeed, it would probably reduce state spendingsharply over time, as the current welfare populationmoves into work and up the ladder to the middle class.
Such welfare reform has long been popular, which is why it passed in 1996 despite opposition from manyliberals and President Clinton. Now that it has beenproven a huge success, it should be even more popular.

21
The fact that Cost of Government Day has moved to July 16, which is the fifth latestthis day has been in the last 32 years, is a troublesome development, and, if leftunanswered, the growing fiscal challenges would move the date even later into the year.
On the other hand, with the enormous spending savings from the above entitlementreforms, federal spending on future interest expenditures incurred to finance projectedexploding deficits on our current course would be dramatically reduced as well. A finalcomponent would be to limit remaining federal expenditures to grow no faster than therate of GDP, which is essentially what we have done over the last 50 years. A cap onthe growth of federal discretionary spending would help to achieve this goal.
The end result of all of the above reforms would be that total federal spending wouldbe reduced well below the current, long term 20 percent of GDP, rather than doubled.This is a detailed, comprehensive strategy for achieving smaller, limited government,which would ultimately lead to an earlier Cost of Government Day.
Peter Ferrara is Director of Entitlement and Budget Policy for the Institute for Policy Innovation andGeneral Counsel of the American Civil Rights Union.
TTOOWWAARRDDSS AANN EARLIER COST OFGOVERNMENT DAY

Americans for Tax Reform Foundation | Center for Fiscal Accountability • 1920 L Street, N.W., Suite 200, Washington, DC 20036 • (202) 785-0266 • F: (202) 785-0261