Costs of production Outline 1.The economic concept of cost and profit 2.Fixed and sunk cost 3.Profit...
30
Costs of production Outline 1. The economic concept of cost and profit 2. Fixed and sunk cost 3. Profit maximization with limited capacity 4. The cost of production 5. Long run cost 6. Economies of scale 7. Economies of scope 8. The learning curve 9. Cost analysis and optimal
-
date post
22-Dec-2015 -
Category
Documents
-
view
224 -
download
3
Transcript of Costs of production Outline 1.The economic concept of cost and profit 2.Fixed and sunk cost 3.Profit...
Costs of productionOutline
1. The economic concept of cost and profit
2. Fixed and sunk cost
3. Profit maximization with limited capacity
4. The cost of production
5. Long run cost
6. Economies of scale
7. Economies of scope
8. The learning curve
9. Cost analysis and optimal decisions
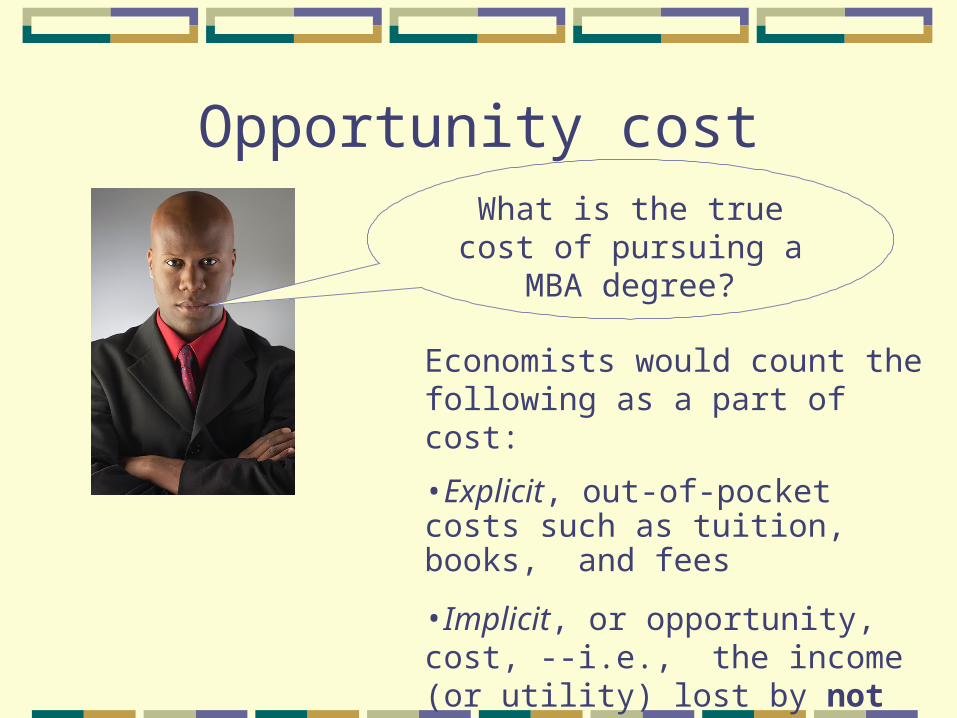
Opportunity cost
Economists would count the following as a part of cost:
•Explicit, out-of-pocket costs such as tuition, books, and fees
•Implicit, or opportunity, cost, --i.e., the income (or utility) lost by not pursuing your next best alternative, such as a fulltime job.
What is the true cost of pursuing a MBA degree?
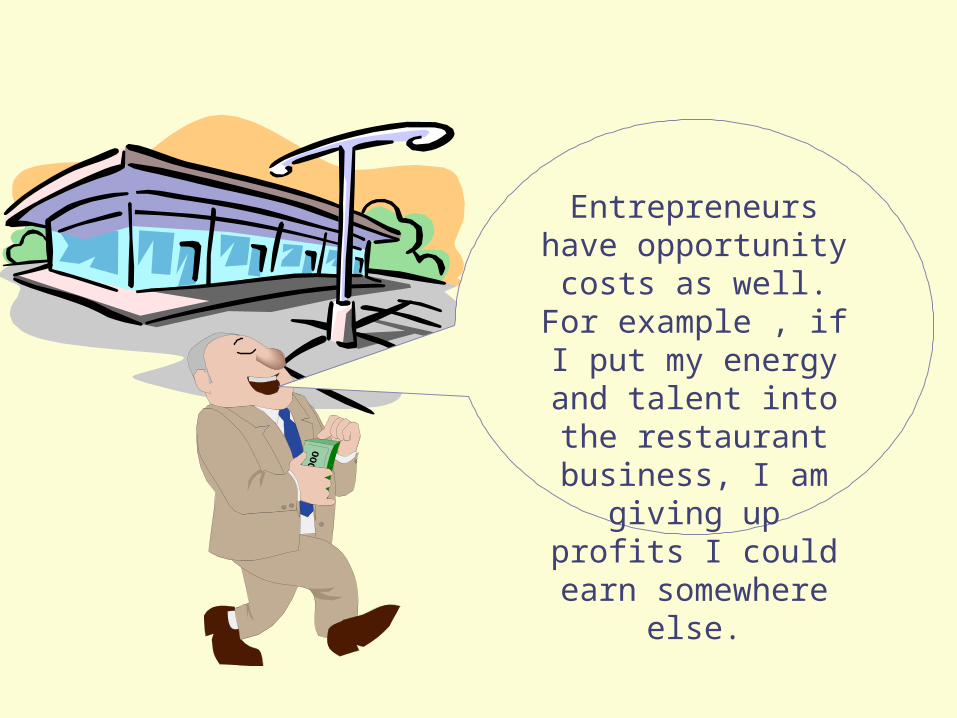
Entrepreneurs have opportunity costs as
well. For example , if I put my energy and talent
into the restaurant business, I am giving up
profits I could earn somewhere else.

Economists treat a normal profit as an implicit cost
—that is, the cost of attracting
entrepreneurship.
Normal profit A normal profit is the minimum profit sufficient to compensate entrepreneurs for profits lost by not pursuing their next best business opportunity

Accounting Profit
We accountants would subtract explicit, or
accounting cost, from revenues to compute
profit.
Accounting = Revenues – Explicit (Accounting) Cost

Economic Profit
Economists would subtract economic cost (including a
normal profit) from revenues to compute an
economic profit
Economic = Revenues – (Explicit + Implicit Cost)

Fixed and Sunk Costs•Fixed costs (FC) are elements of cost that do not vary with the level of output.
Examples: Interest payments on bonded indebtedness, fire insurance premiums, salaries and benefits of managerial staff.
•Sunk costs are costs already incurred and hence non-recoverable.
Examples: Research & development costs, advertising costs, cost of specialized equipment.

-maximization with limited capacity: Ordering a best seller
Consider a bookseller with a limited amount of shelf space. How
many copies of a best seller should be
ordered?
Suppose the bookseller’s estimated (inverse) demand equation is given by:
P = 24 – Q,
where P is dollars and Q is quantity in hundreds of copies per month.
The cost to the bookseller is $12 per copy.

3 questions
1. How many copies of the bestseller should the merchant order, and what price should she charge, assuming there is unlimited shelf space to stock the bestseller?
2. Now suppose shelf space is limited, so that carrying the bestseller means “crowding out” other books? Assuming the average profit on books already shelved is $4, what is the optimal price and quantity of the bestseller?
3. What if actual demand is less than estimated demand, say: P = 18 – 2Q. The publisher is obligated to refund returned copies for $6 each. How many copies should be returned (if any), and how many should be sold and at what price?

Sales Forgone FinalPrice Revenue Cost Profit Net Profit
(a) QS = 600 $18 $10,800 $7,200 $0 $3,600
(b) QS = 400 20 8,000 4,800 1,600 1,600
[QS = 600] 18 10,800 7,200 2,400 1,200
[c] QS = 200 14 2,800 4,800 800 -1,600
Qr = 200 6 1,200 0
[QS = 400] 10 4,000 4,800 1,600 -2,400
[Qr = 0] 6 0 0
[QS = 0] 0 4,800 0 -2,400
[Qr = 400] 6 2,400 0
An Optimal Book Order

The key to 2nd problem is in understanding that the
$4 in profit lost for stocking each unit of the bestseller is an implicit
cost
Hence marginal cost is given by:
MC = $12 + $4 = $16
Problem 2

Problem 3
Thus marginal cost is given by:
MC = $4 + $6 = $10
To solve problem 3 you need to recognize 2 things: (1)
Since the books have already been ordered, the $12 price
is a sunk cost; and (2) the $6 return charge is an implicit
cost of stocking the bestseller

Annual Output Total Cost Fixed Cost Variable Cost(Thousands of Repairs) ($000s) ($000s) (000s)
0 270.0 270 0.05 427.5 270 157.510 600.0 270 330.015 787.5 270 517.520 990.0 270 720.025 1207.5 270 937.530 1440.0 270 1170.035 1687.5 270 1417.540 1950.0 270 1680.045 2227.5 270 1957.550 2520.0 270 2250.055 2827.5 270 2557.560 3150.0 270 2880.0
Firm’s Costs in the Short Run

Figure 7.1
3,000
0 60O utput (Thousands of Units)
Tota l Cost (Thousands of Dollars)
555045403530252015105
2,000
1,000
Cost function
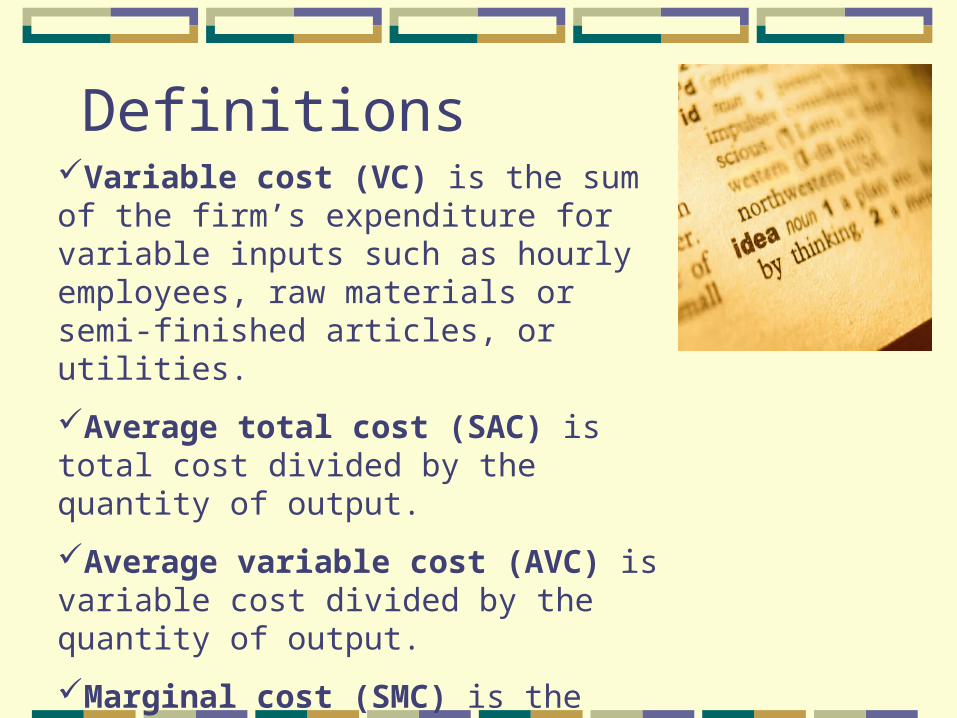
DefinitionsVariable cost (VC) is the sum of the firm’s expenditure for variable inputs such as hourly employees, raw materials or semi-finished articles, or utilities.
Average total cost (SAC) is total cost divided by the quantity of output.
Average variable cost (AVC) is variable cost divided by the quantity of output.
Marginal cost (SMC) is the addition to total cost attributable to the last unit produced
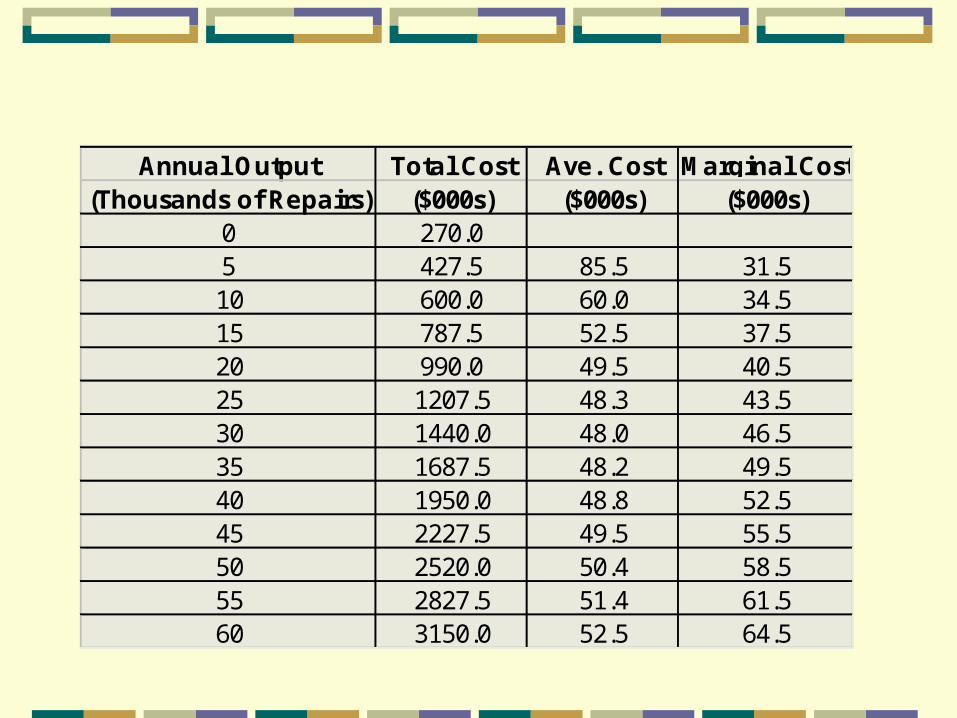
Annual Output Total Cost Ave. Cost Marginal Cost(Thousands of Repairs) ($000s) ($000s) ($000s)
0 270.05 427.5 85.5 31.510 600.0 60.0 34.515 787.5 52.5 37.520 990.0 49.5 40.525 1207.5 48.3 43.530 1440.0 48.0 46.535 1687.5 48.2 49.540 1950.0 48.8 52.545 2227.5 49.5 55.550 2520.0 50.4 58.555 2827.5 51.4 61.560 3150.0 52.5 64.5
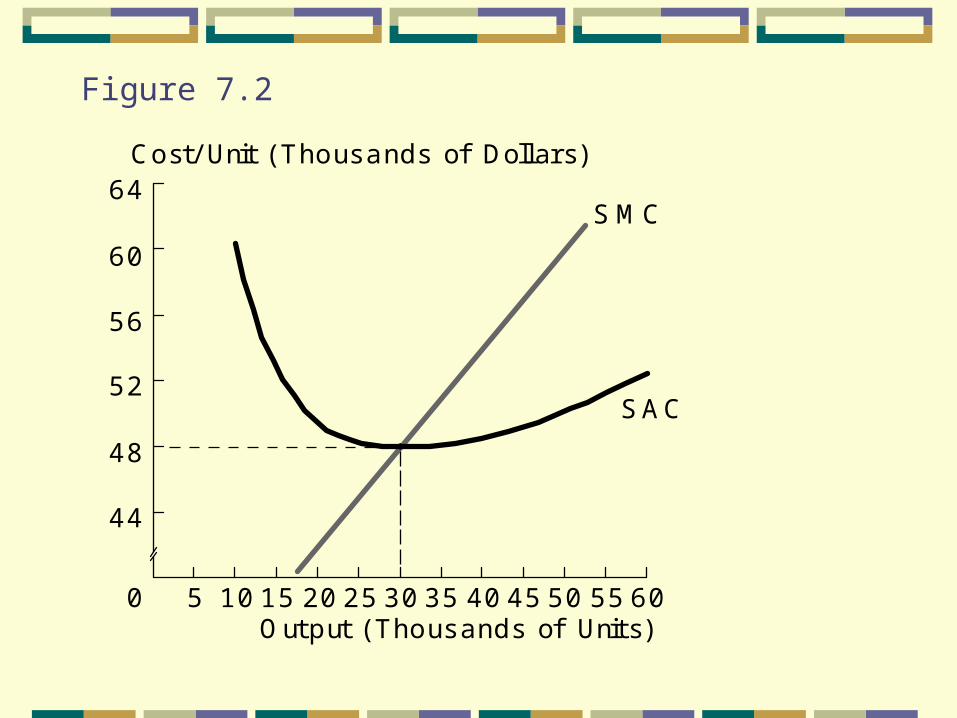
Figure 7.2
64
0 60O utput (Thousands of Units)
Cost/Unit (Thousands o f Do lla rs)
44
48
52
56
555045403530252015105
SM C
SAC
60

Relationship between Average and Marginal
When average cost is falling, marginal cost lies everywhere below average cost.
When average cost is rising, marginal cost lies everywhere above average cost.
When average cost is at its minimum, marginal cost cost is equal to average cost.
If your most recent (marginal) grades are higher than your GPA at the start of the term, your GPA will
rise

What explains rising (short-run) marginal cost?
If labor is the only variable input then marginal cost can be expressed by:
L
L
MP
PSMC [7.1]
Recall that the marginal product of labor will
begin to fall at some point due to the law of
diminishing returns.

0.0
50.0
100.0
150.0
200.0
250.0
300.0
1 11 21 31 41 51
Output (Q)
Fixe
d C
ost P
er U
nit
Behavior of Average Fixed Cost
As output increases, fixed cost can be spread more thinly

Production costs is the long run
•In the long run there are no fixed inputs; hence all costs are “variable.”
•The long run average cost curve shows the minimum average cost achievable at each level of output in the long run—that is, when all inputs are variable.

Constant Returns to Scale
$5
0O utput (Thousands o f Units )
Long -R un A ve rage C ost
4
21614410872
S A C 1
(9 ,000 -square -foo t p lant)
-S A C 2
(18 ,000-squarefoo t p lant) (
S A C 3
27 ,000-squa re -foo t p lant)
S M C 1 S M C 2 S M C 3
LA C = LM C

The U-Shaped Long Run Average Cost Function
Output
Long-Run Average Cost
SAC1
SMC2
Qmin
SMC1 SMC3
SAC2 SAC3
LMC
LMC
LAC
Increasing returns Decreasing returns
Notice on the previous slide that up to a scale of QMIN,
the firm experiences decreasing (long run) unit cost. Economies of scale are exhausted at the point

Minimum Efficient Scale (QMES)
QMES is the minimum scale of operation at which long unit production costs can be
minimized.

LAC
Demand
QMES is large relative to he “size of the market.”
Q
Cost
per
unit
0 1000 2000
To produce on an efficient scale, you must supply 50% of the product demanded at a price equal to minimum unit cost

How large do you have to be to minimize unit costs?1
Not very large (as a percent of U.S. consumption) : Bricks, flour milling, machine tools, cement, glass containers, cigarettes, shoes, bread baking.
Fairly large (as a percent of U.S. consumption): Synthetic fibers, passenger cars, household refrigerators and freezers, commercial aircraft.
Very large (as a percent of U.S. consumption): Turbine generators, diesel engines, electric motors, mainframe computers.
1F.M. Scherer and D. Ross. Industrial Market Structure and Performance, 3rd edition, 1990, pp. 115-116.

Figure7.5a
Output
Long-Run Average Cost
Qmin(a)

Figure 7.5b
Output
Long-Run Average Cost
Qmin(b)

Figure 7.5c
Output
Long-Run Average Cost
(c)
Local telephone service, electricity distribution, and cable TV distribution are well represented by this cost function.