Costs in the Norwegian Payment System 2007 Olaf Gresvik and Harald Haare Norges Bank 14.11.2008 1.
14
Costs in the Norwegian Payment System 2007 Olaf Gresvik and Harald Haare Norges Bank 14.11.2008 1
-
Upload
rosalyn-strickland -
Category
Documents
-
view
218 -
download
1
Transcript of Costs in the Norwegian Payment System 2007 Olaf Gresvik and Harald Haare Norges Bank 14.11.2008 1.

Costs in the Norwegian Payment System 2007
Olaf Gresvik and Harald Haare
Norges Bank
14.11.20081
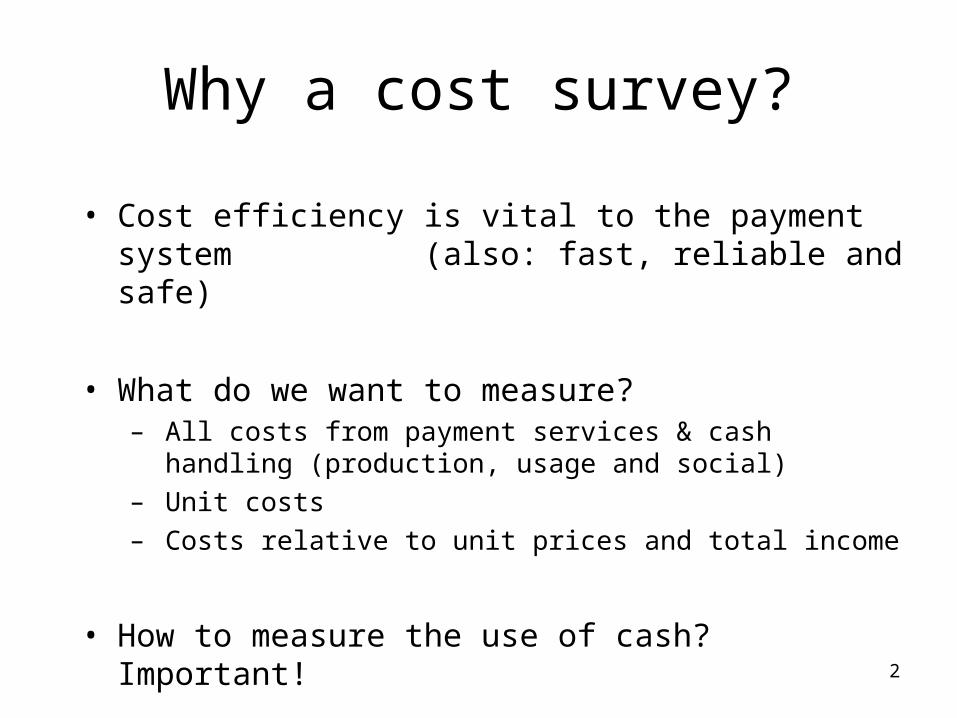
Why a cost survey?
• Cost efficiency is vital to the payment system (also: fast, reliable and safe)
• What do we want to measure?– All costs from payment services & cash handling (production,
usage and social)– Unit costs– Costs relative to unit prices and total income
• How to measure the use of cash? Important!
• Development over time (bank surveys) 2
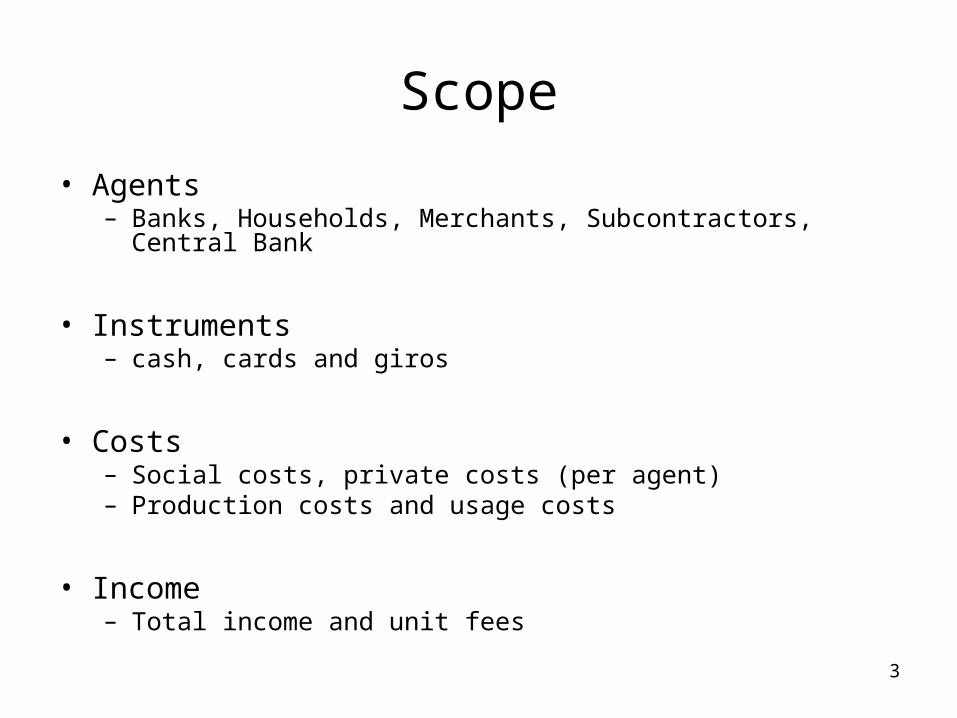
Scope
• Agents – Banks, Households, Merchants, Subcontractors, Central Bank
• Instruments– cash, cards and giros
• Costs– Social costs, private costs (per agent)– Production costs and usage costs
• Income– Total income and unit fees
3

Data sources
• Three surveys: – Banks, Households, Merchants
• Public information: – Payment statistics– Demographics– Financial accounts– National Accounts
• Other surveys – Norway: 1988, 1994, 2001
– Belgium, Netherlands, Sweden etc4
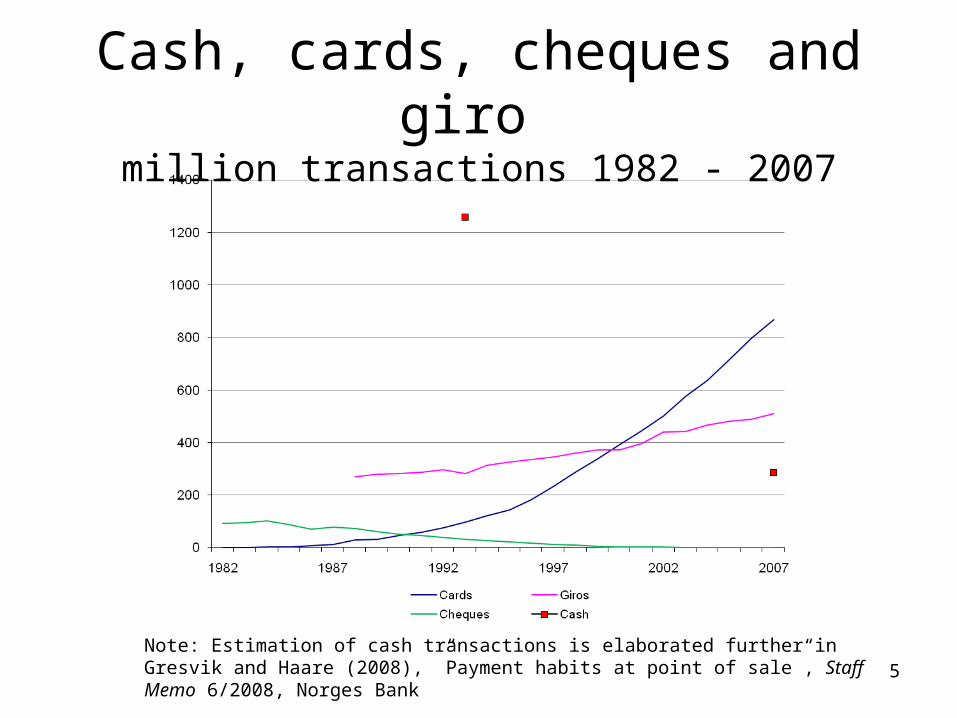
Cash, cards, cheques and giro million transactions 1982 - 2007
Note: Estimation of cash transactions is elaborated further in Gresvik and Haare (2008), ”Payment habits at point of sale”, Staff Memo 6/2008, Norges Bank 5

Payment central / hubs / service
providers
Payment central / hubs / service
providers
Payer Bank / issuer
Payee
Costs not covered
Costs covered
Cards
Cash
Bill payments (giro etc)
Point of sale, withdrawals and deposits
Not point of sale
Cost Cost Cost CostCost
Central Bank
International, Interbank, Cheque, e-money,
Households
Publ. sector
POS businesses
Public sector
Non-POS businesses
POS and non-POS
Businesses
What does the Cost analysis cover?
Bank / Issuer
Central Bank
Bank / AcquirerBank /
Acquirer
6

Bank / issuer
Bank / acquirerBank /
acquirerPayer Payee
Payment habits (phone survey: yesterday’s payments)
Activity Based Costing (full cost)
Cards
Cash
Bill payments (giro etc)
Point of sale, withdrawals and deposits
Not point of sale
Cost Cost Cost CostCost
Central Bank
Households
Publ. sector
POS businesses
Publ. sector
Non-POS businesses
POS and non-POS
Businesses
Which method?
Full-cost questionnaire and time studies
Also: information from financial statements and from statistical information on salaries etc
Payment central / hubs / service
providers
Payment central / hubs / service
providers
Bank / issuer
7

PayerMerchants / Point of Sale
Payers bank Payees bank
Subcontractors
Norges Bank
Other payment receivers
0.13
2.37
4.95
n.a.
1.53
2.91
2.00
2.30
n.a.
n.a.
n.a.
2.44
0.010.03
0.005
Social costs, private costs and fees• Method:
– Bergman, Guibourg and Segendorf (2007)
– Social cost– Private cost– Net private cost– Own production cost
• Social Costs = 0.48% of GDP
• Seigniorage: – eliminated in social cost
calculation
Bold arrows: Own production cost:
10.97 billion NOK (= social cost)
Regular arrows: fees and other costs:
7.68 billion NOK 8

Social costs: agents
NOK billions
Banks 4.95 ( 45.1%)
Norges Bank (The Central Bank) 0.13 ( 1.2%)
Households (Payers) 2.00 ( 18.2%)
Merchants and others (Payees) 1.53 ( 14.0%)
Subcontractors 2.37 ( 21.6%)
Sum 10.97 (100.0%)
9
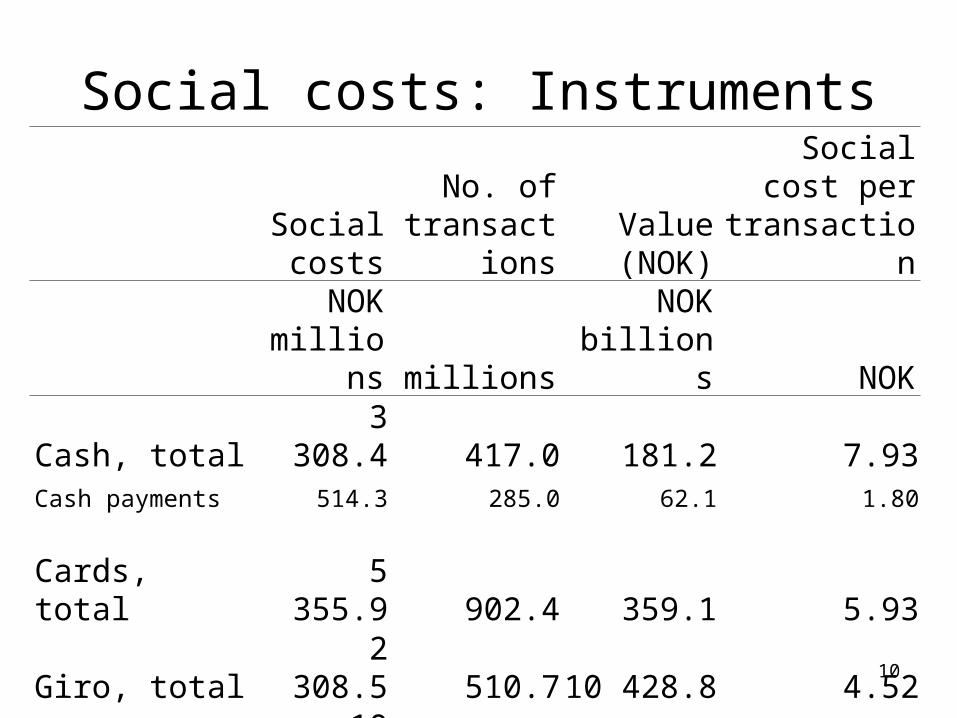
Social costs: Instruments
Social costs
No. of transactions
Value (NOK)
Social cost per transaction
NOK
millions millionsNOK
billions NOK
Cash, total 3 308.4 417.0 181.2 7.93Cash payments 514.3 285.0 62.1 1.80
Cards, total 5 355.9 902.4 359.1 5.93
Giro, total 2 308.5 510.7 10 428.8 4.52
Sum society 10 972.9 1 830.1 10 969.1 6.00
10

Private unit cost: banks(NOK) 2001 2007
Internet banking 8.00 2.00
Direct debits 5.00 2.50
Mail giro 7.50 7.00
Cheque 22.50 -
Card payments (issuer) 2.50 1.50
Card payments (aquirer) 1.00
Card payments (total) 4.00
Own bank’s ATM 8.50 7.00
Other bank’s ATM 7.50 8.5011
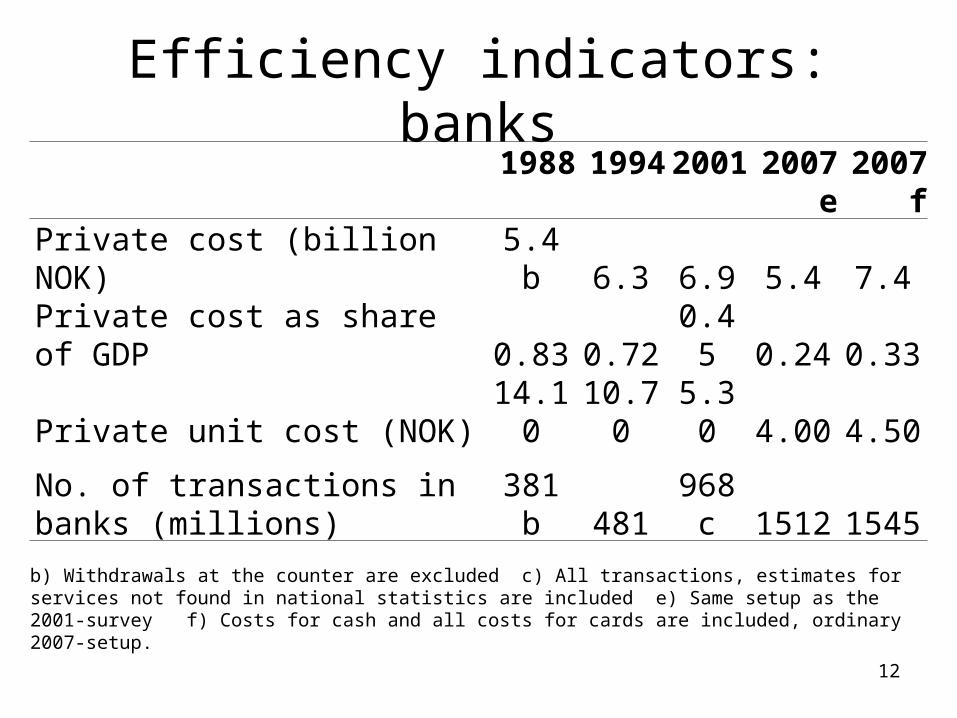
Efficiency indicators: banks 1988 1994 20012007 e 2007 f
Private cost (billion NOK) 5.4 b 6.3 6.9 5.4 7.4
Private cost as share of GDP 0.83 0.72 0.45 0.24 0.33
Private unit cost (NOK) 14.10 10.70 5.30 4.00 4.50
No. of transactions in banks (millions) 381 b 481 968 c 1512 1545
b) Withdrawals at the counter are excluded c) All transactions, estimates for services not found in national statistics are included e) Same setup as the 2001-survey f) Costs for cash and all costs for cards are included, ordinary 2007-setup.
12

Cost recovery: banks
13

Closing
• Social costs: NOK 10.97 billion, 0.48 % of GDP– Banks and subcontractors carry most of the cost
• Banks’ cost coverage increases, but not a profit– Banks efficiency has improved
• Unit costs reduced for the most important services
• Cash use low, but cash handling costs are considerable
• Analysis is sensitive to choice of method
• Staff Memo on costs: May 2009– Details on methods and results
14