Costs Estimation of Water Pollution in Agriculture ...
12
International Journal of Business and Society, Vol. 18 S3, 2017, 425-436 COSTS ESTIMATION OF WATER POLLUTION IN AGRICULTURE, FISHERIES, LIVESTOCK AND BIRDS Attiea Marie Al Falah University Sameer Albarghouthi Al Falah University ABSTRACT This study proposes a set of simplified quantitative models to estimate the cost of water pollution in agriculture, fisheries, livestock and birds, which causes numerous damages on human resources. Inductive reasoning is used while developing and applying the models on a hypothetical case to demonstrate the feasibility and practicability of the proposed models. By testing the validity and applicability of the proposed models, a professional accountant may recognize the cost of pollution tangibly in the financial statements of polluted companies. This will improve the quality and transparency of companies’ financial reporting. Keywords: Water Pollution Costs; Agriculture; Fisheries; Livestock; Birds; Quality and Transparency of Financial Reporting. 1. INTRODUCTION Many countries around the world have made great strides in establishing green accounting and compelling enterprises to show environmental information for interested parties (Tu and Huang, 2015). As a result several models were proposed during the last two centuries to measure the cost of air and water pollution in descriptive way (Al Barghouthi and Marie, 2016). On other hand, by reviewing various sectors in developing and developed countries we found the companies’ financial statements do not show environmental information in quantitative form. (Bayou & James, 1992; Bebbington, et al, 1994; Muller, Mendelsohn and Nordhaus, 2011; Jayanthi, 2015). This was our motivation to think about a practical incentive for companies to show such important environmental information in its financial statements. Based on that, our research question is: How can different companies stimulate disclosure of environmental information in their financial statements? The researchers believe that the answer of research question lies in the ability to proposed simple quantitative models for estimating and measuring the pollution effects on the elements of living wealth, on one hand, and reallocate it to its sources of emissions on other hand. To achieve our objective, we proposed in a previous research paper simple quantitative models for estimating and measuring the pollution effects on human resources (Al Barghouthi and Marie, 2016), Corresponding author: Accounting professor in Al-Falah University, Dubai, UAE. Email: [email protected]; Tel: +971- 04-23380621
Transcript of Costs Estimation of Water Pollution in Agriculture ...

International Journal of Business and Society, Vol. 18 S3, 2017, 425-436
COSTS ESTIMATION OF WATER POLLUTION IN AGRICULTURE, FISHERIES, LIVESTOCK AND BIRDS
Attiea Marie Al Falah University
Sameer Albarghouthi
Al Falah University
ABSTRACT
This study proposes a set of simplified quantitative models to estimate the cost of water pollution in agriculture,
fisheries, livestock and birds, which causes numerous damages on human resources. Inductive reasoning is used
while developing and applying the models on a hypothetical case to demonstrate the feasibility and practicability
of the proposed models. By testing the validity and applicability of the proposed models, a professional
accountant may recognize the cost of pollution tangibly in the financial statements of polluted companies. This
will improve the quality and transparency of companies’ financial reporting.
Keywords: Water Pollution Costs; Agriculture; Fisheries; Livestock; Birds; Quality and Transparency of
Financial Reporting.
1. INTRODUCTION
Many countries around the world have made great strides in establishing green accounting and compelling enterprises to show environmental information for interested parties (Tu and Huang, 2015). As a result several models were proposed during the last two centuries to measure the cost of air and water pollution in descriptive way (Al Barghouthi and Marie, 2016). On other hand, by reviewing various sectors in developing and developed countries we found the companies’ financial statements do not show environmental information in quantitative form. (Bayou & James, 1992; Bebbington, et al, 1994; Muller, Mendelsohn and Nordhaus, 2011; Jayanthi, 2015). This was our motivation to think about a practical incentive for companies to show such important environmental information in its financial statements. Based on that, our research question is: How can different companies stimulate disclosure of environmental information in their financial statements? The researchers believe that the answer of research question lies in the ability to proposed simple quantitative models for estimating and measuring the pollution effects on the elements of living wealth, on one hand, and reallocate it to its sources of emissions on other hand. To achieve our objective, we proposed in a previous research paper simple quantitative models for estimating and measuring the pollution effects on human resources (Al Barghouthi and Marie, 2016),
Corresponding author: Accounting professor in Al-Falah University, Dubai, UAE. Email: [email protected]; Tel: +971-04-23380621

426 Costs Estimation of Water Pollution in Agriculture, Fisheries, Livestock and Birds
this paper will focus on introduce simple set of quantitative models for estimating and measuring the pollution effects on agriculture, fisheries, livestock and birds, and the allocation of resulting costs to sources of pollution will be postpone to future research. The study findings will help companies to recognize water pollution's cost effects on its financial statements; this will improve the quality and transparency of companies’ financial reporting. The findings will also help Stakeholders control and force the companies’ pollution emission to reduce it to the globally accepted limits. The remainder of this paper is organized as follows: Section 2 is dedicated to discuss the earlier studies. Section 3 tackles the cost estimation of water pollution in agriculture, fisheries, livestock and
birds. - Section 3.1 focuses on estimation of productivity lost in agriculture crops induced by
pollution.
- Section 3.2 examines the estimation of productivity lost in fisheries induced by pollution.
- Section 3.3 will focus on estimation of pollution cost in livestock and birds.
a. Section 3.3.1 discusses the cost estimation of pollution diseases in livestock and birds.
b. Section 3.3.2 discusses cost estimation of deaths in livestock and birds induced by
pollution.
c. Section 3.3.3 cost estimation of productivity lost in livestock and birds induced by
pollution is considered.
Section 4 includes study conclusions, limitation, and recommendations of future studies.
2. LITERATURE REVIEW
Without agriculture the world would suffer from famines as it is a necessary means of human survival as well as fisheries, livestock, and birds. For thousands of years, traditional agriculture was a harmless practice that did not damage or deplete the land it was performed on. However, the harmful modern farming and agricultural operations have gradually led to agricultural pollution. These harmful operations and the modern day by-products of agriculture have managed to cause degradation of not only the eco-system, but also the land and environment. Pesticides and fertilizers, soil erosion and sedimentation, polluted water, livestock, weeds, pests among others are some of the primary causes of agricultural pollution.
There is a huge amount of major environmental issues that the world is facing today, and factory farming is one of the major causes of pollution (Schaffner, et al., 2011). A scientific research carried out on factory farming’s methods found that the increase in animal production in confinement in warehouse-like building before killing them, and mass-producing cows and chickens meat along with dairy and eggs causes an unacceptable level of risk to public health and damage to the environment (Aftab, 2017). Yet, several governments endorse this unsustainable industry, in spite of its significant social and ecological costs, to supply for the growing worldwide “meat” market which is predicted to double in 33 years (Moreira and Bravo-Ureta, 2010; Parris, 2011).

427 Attiea Marie and Sameer Albarghouthi
Several studies use hedonic analysis to assess the impacts of reduced water clarity on home values in Maine; they found water clarity was a significant variable impacting home prices, with lower clarity resulting in lower home prices (Michael et al. 2000; Poor et al. 2001 and Gibbs et al. 2002). Walsh et al. (2011) assessed the impacts of multiple pollutant concentrations on home values within 1,000 meters of lakes in Orange County, Florida. They estimated the implicit price associated with a 17% change in concentrations of total nitrogen, total phosphorus, chlorophyll, and trophic state index (a composite of the three other nutrient pollutants). The authors note that the impacts were much higher for waterfront homes, with the impacts diminishing with distance to the beach. Huang et al. (2010) estimated the lagged effects of hypoxia on commercial harvests of brown shrimp in these water bodies. The authors used bio-economic modelling, assuming that the environmental effects associated with a hypoxia event accumulate over a 60-day period. They found that between 1999 and 2005, the brown shrimp harvest declined by 13.1% due to hypoxia in the Neuse River. Key & Sneeringer (2014), mentioned the potential effects of climate change on the productivity of US dairies. Pan, et al. (2016), they said farmers have been using animal excrement as a crop fertilizer for over millennia, however; factory farms generate far more waste than the soil can take in. To our best knowledge, extrapolation good number of earlier studies reveals that they did not offer quantitative models to estimate the cost of water pollution’s harmful effects on agriculture, fisheries, animals and birds. To illustrate the problem more clearly, let us start with sources causes’ water pollution that can be divided into two categories: the pollutants that belong to a single source such as wastes released from factories into the water, and the pollutants released from multiple sources. 1 In general, the causes of water pollution are summarized as follow: (Dasgupta et al., 2001; Pascoe, 2007; Weiss, et al.,2007; Sneeringer, 2009; Hoagland, et al., 2009; Morrison et al., 2010; Wheeler, 2013; Engel, 2016): 1. Industrial waste: Many industries do not follow responsible waste disposal methods and simply
release the waste into fresh water which would then flow out into rivers, canals and sea. 2. Mining activities: Mining has serious environmental impact and causes water pollution as it
generates metal waste and sulphides from the rocks which can be very harmful for the water. 3. Marine dumping: The improper disposal of paper, aluminum, rubber, glass, plastic and food in
the sea does not only cause water pollution but also threatens marine life and wildlife. 4. Accidental oil leakage: Oil spill can be a major form of pollution if a large amount of oil gets
released into sea. Hence oil spill poses a significant threat to local marine life and wildlife like fish, birds.
5. Burning of fossil fuels: when fossil fuels such as coal, oil and natural gas get burnt, substantial amount of fly ash is produced. The particles of the fly ash contain toxic chemicals that can result in acid rain harmful to agriculture, marine life and wildlife.
1 Water pollutants also include both organic and inorganic factors. Organic factors include volatile organic compounds, fuels, waste from trees, plants etc. Inorganic factors include ammonia, chemical waste from factories, discarded cosmetics etc. The water that travels
via fields is usually polluted with all forms of waste inclusive of fertilizers that it swept along the way. This infected water makes its
way to our water bodies and sometimes to the seas endangering the fish, livestock and humans.

428 Costs Estimation of Water Pollution in Agriculture, Fisheries, Livestock and Birds
6. Chemical fertilizers and pesticides: for years farmers have used chemical fertilizers and pesticides to protect their crops from pests and bacteria. However, these chemicals are harmful not only on plants, but also on livestock and birds.
7. Leakage from sewage lines: damaged pipes in sewage lines lead to leakage of untreated waste, which escapes into groundwater, resulting in damage to agriculture, marine life and wildlife.
8. Global warming: global warming is a result of gradual heating of Earth's surface, oceans and atmosphere due to greenhouse effect. This increase in water temperature results in death of aquatic animals and marine species which eventually leads to water pollution.
From the above we conclude that there are several sources of pollution each of which imposes serious environmental hazards that affect plants, livestock, birds, fish and humans. This necessitates cooperation and coordination between all the concerned actors authorities and stakeholders to find quick and effective solutions for these pressing environmental issues. Among these actors governments and the various sources of pollution emissions in addition to the pivotal role of accountants in the simplification of accounting procedures and methods of calculation and accounting for pollution, which leading to ease the application of implementing rules of policies, laws and reflected transparently of reports and financial statements in companies as an integral part of their operations.
3. COST ESTIMATION OF WATER POLLUTION IN AGRICULTURE, FISHERIES,
LIVESTOCK AND BIRDS
In addition to its impact on humans, water pollution also causes material damages in agriculture, fisheries, livestock, and birds among others. In our previous paper (Al Barghouthi & Marie, 2016) we have differentiated between pollution cost control from economic perspective and accounting perspective. We also introduced a set of simple models to estimate the cost of water pollution’s direct effects on human resources, such as; additional cost of medical treatment and income loss among others. This paper addressed one of the previous paper’s shortcomings; cost estimation of water pollution’s indirect effects on humans, which includes agriculture, fisheries, livestock and birds. 3.1. Cost Estimation of Productivity Lost in Agriculture Crops
Sustainable agriculture is one of the major challenges we face today. Sustainability entails more than just securing a sustained food supply, but also acknowledging the effects of agricultural practices on the environment, socio-economics and human health when national development plans are designed. As discussed above, water pollution affects the productivity of planting areas which in turn affects various traditional crops such as wheat, rice and corn, as well as several types of fruit like apples, plums, peaches and apricots. The accountant's role is to formulate a simple model to be used in estimating the losses in crops’ productivity induced by water pollutants. This proposed simple model is:
))()()(()(1
1 ii
m
iii SPPROAGTCE
(1)

429 Attiea Marie and Sameer Albarghouthi
Where, AGi = Cultivated areas of polluted crop of type i, measured in acres. m = Crops types affected by water pollution (1,2…...m). PROi = Change in crop’s productivity of type i at polluted and clean areas Pi = Probability of productivity loss is due to pollution
= [1- {(crop productivity at a polluted area) ÷ (crop productivity at a clean area)}]2 Si = Market selling price per ton of crop (i). To illustrate the applicability of model 1, assume there are six polluted types of crops that are planted on two areas; A.01, A.02. A.01 is planted with wheat (WH), rice (RI), corn (CO). A.02 is planted with apples (AP), plum (PL), and peaches (PE). Where cultivated areas measured by acres is referred to as (Ki). Acres productivity for each type of crop (m) at relatively clean areas is referred to as (PROc) while at polluted areas as (PROp), and the selling market price per ton for each type of crop is (Pi) Based on the above parameters, table (1) represents the estimation of productivity losses in agricultural crops induced by pollution.
Table 1: Cost Estimation of productivity lost in agricultural crops [Model (1)]
Planted
Areas
Type of
crop
Ki
(acres)
PROc
(Ton)
PROp
(Ton)
PRO
(Ton) Pi
Si
($/Ton)
E(TC1)
($)
A.01 WH 4,000,000 18.00 10.00 8.00 0.444 1,200 17,049,600,000
RI 3,500,000 22.00 15.00 7.00 0.318 1,400 10,907,400,000
CO 5,000,000 15.00 11.00 4.00 0.267 900 4,806,000,000
Subtotal 32,763,000,000
A.02 AP 250,000 40.00 25.00 15.00 0.375 2,000 2,812,500,000
PL 150,000 12.00 7.00 5.00 0.467 1,800 630,450,000
PE 200,000 14.00 8.00 6.00 0.429 2,100 1,081,080,000
Subtotal 4,524,030,000
Total $7,287,030,000
3.2. Cost Estimation of Productivity Lost in Fisheries
Since Fish are assumed to be a biological and natural renewable resource and one of the most valuable sources of food for humans, it protecting fish stocks and the marine environment from resource depletion and water pollution is now a major issue. Thus, a common fisheries policy (CFP) for overseeing the fisheries in the water was introduced by the European Union. This policy which was implemented on January, 1st of 2014 intends to encourage environmental, economic and social sustainable uses of common resources including aquaculture production. Its initial goals include: Increasing productivity; Sustainable exploitation of resources; Protection of the environment; and Safeguards for a high level of human health protection. Despite the threat the described pollutants pose, these goals has proven to be rather difficult to achieve in reality. The quality and productivity of fish is also affected by: Heavy metals in water and fish tissues: Pollution of the aquatic environment by inorganic
chemicals has been recognized as one of the major serious threats to the health and survival of
2 For example, if wheat productivity per acre at a polluted area is 10 ton and its productivity at clean area is 18 ton, then the probability
of productivity lost is due to pollution (pi) = 1- 10/18 = 0.444
430 Costs Estimation of Water Pollution in Agriculture, Fisheries, Livestock and Birds
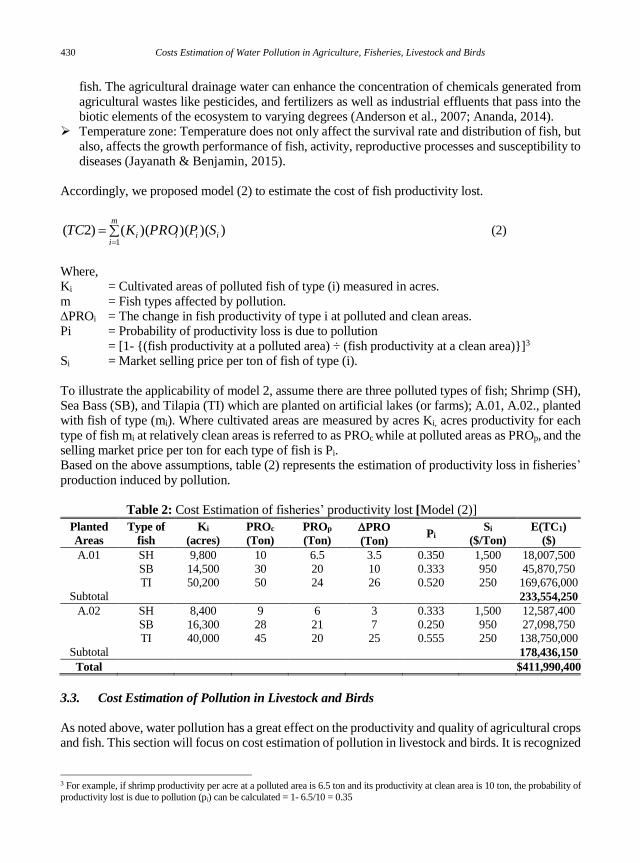
fish. The agricultural drainage water can enhance the concentration of chemicals generated from agricultural wastes like pesticides, and fertilizers as well as industrial effluents that pass into the biotic elements of the ecosystem to varying degrees (Anderson et al., 2007; Ananda, 2014).
Temperature zone: Temperature does not only affect the survival rate and distribution of fish, but also, affects the growth performance of fish, activity, reproductive processes and susceptibility to diseases (Jayanath & Benjamin, 2015).
Accordingly, we proposed model (2) to estimate the cost of fish productivity lost.
m
iiiii SPPROKTC
1
))()()(()2( (2)
Where, Ki = Cultivated areas of polluted fish of type (i) measured in acres. m = Fish types affected by pollution. PROi = The change in fish productivity of type i at polluted and clean areas. Pi = Probability of productivity loss is due to pollution
= [1- {(fish productivity at a polluted area) ÷ (fish productivity at a clean area)}]3 Si = Market selling price per ton of fish of type (i). To illustrate the applicability of model 2, assume there are three polluted types of fish; Shrimp (SH), Sea Bass (SB), and Tilapia (TI) which are planted on artificial lakes (or farms); A.01, A.02., planted with fish of type (mi). Where cultivated areas are measured by acres Ki, acres productivity for each type of fish mi at relatively clean areas is referred to as PROc while at polluted areas as PROp, and the selling market price per ton for each type of fish is Pi. Based on the above assumptions, table (2) represents the estimation of productivity loss in fisheries’ production induced by pollution.
Table 2: Cost Estimation of fisheries’ productivity lost [Model (2)]
Planted
Areas
Type of
fish
Ki
(acres)
PROc
(Ton)
PROp
(Ton)
PRO
(Ton) Pi
Si
($/Ton)
E(TC1)
($)
A.01 SH 9,800 10 6.5 3.5 0.350 1,500 18,007,500
SB 14,500 30 20 10 0.333 950 45,870,750
TI 50,200 50 24 26 0.520 250 169,676,000
Subtotal 233,554,250
A.02 SH 8,400 9 6 3 0.333 1,500 12,587,400
SB 16,300 28 21 7 0.250 950 27,098,750
TI 40,000 45 20 25 0.555 250 138,750,000
Subtotal 178,436,150
Total $411,990,400
3.3. Cost Estimation of Pollution in Livestock and Birds
As noted above, water pollution has a great effect on the productivity and quality of agricultural crops and fish. This section will focus on cost estimation of pollution in livestock and birds. It is recognized
3 For example, if shrimp productivity per acre at a polluted area is 6.5 ton and its productivity at clean area is 10 ton, the probability of
productivity lost is due to pollution (pi) can be calculated = 1- 6.5/10 = 0.35

431 Attiea Marie and Sameer Albarghouthi
that pollution affects livestock and birds by increasing the extent of herds affected by diseases and deaths, in addition to reducing its productivity. 3.3.1. Cost Estimation of Pollution Diseases in Livestock and Birds Costs estimation of diseases in livestock and birds require counting affected cases classified by diseases, probability of infection due to pollution, and average cost of treatment within herd (i) with a specific disease (d). Model 3 described the relationship between these parameters as follows:
D
d
G
iidiii PPTQTCE
1 13 ))()()(()( (3)
Where, D = Number of diseases affecting livestock and birds. G = Kind of livestock and birds herd affected by diseases. Qi = Number of livestock and birds affected within the herd (i) by a specific disease (d). Ti = Average cost of treatment within herd (i) by a specific disease (d). Pid = Probability of infection due to pollution
= [1- {(number of affected livestock and birds at a relatively clean area) ÷ (number of affected livestock and birds at a polluted area)}]4
To illustrate the applicability of model 3, assume there are five kinds of livestock and five kinds of birds affected by pollution: Camels (CA), Buffalo (BU), Cow (CO), Lambs (LA), and Goats (GO), Ostriches (OS), Turkey (TU), Rabbits (RA), Ducks (DU), and Chicken (CH) respectively. Assume
Table 3: Cost Estimation of Diseases in Livestock and Birds [Model 3]
Diseases
“D”
Livestock/Birds
“G”
Qi
(Quantity of herd)
Ti
($) Pid
E (TC3)
($)
Flu
Subtotal
CA
BU
CO
LA
GO
OS
TU
RA
DU
CH
400,000
700,000
1,100,000
3,000,000
2,000,000
600,000
900,000
750,000
1,000,000
5,000,000
20
15
10
8
5
4
3
1
1
1
0.80
0.60
0.90
0.70
0.75
0.50
0.65
0.75
0.55
0.90
6,400,000
6,300,000
9,900,000
16,800,000
7,500,000
1,200,000
1,755,000
562,500
550,000
4,500,000
55,467,500
Smallpox
Subtotal
OS
TU
RA
DU
CH
800,000
700,000
700,000
400,000
2,000,000
10
8
5
3
2
0.80
0.60
0.40
0.20
0.85
6,400,000
3,360,000
1,400,000
240,000
3,400,000
14,800,000
Total $135,317,500
4 For example, if we have 70 camels affected at a relatively clean area and 100 camels affected at a relatively polluted area, then the
probability of diseases was due to pollution (pi) = 1- 70/100 = 0.3

432 Costs Estimation of Water Pollution in Agriculture, Fisheries, Livestock and Birds
that pollution is causing poisoning, flu, and smallpox to livestock and birds. Based on these assumptions and the model’s parameters, table 3 explains the applicability mechanism of model 3. 3.3.2. Cost Estimation of Deaths in Livestock and Birds Estimating such costs requires counting the amount of dead livestock and birds (Qi), the expected market price per unit of each herd (Si), and probability of death due to pollution (Pi). The probability of death can be estimated as follows:
{1- {(death cases in clean areas (Qic)) ÷ (death cases in polluted areas (Qip))}5
Based on the above parameters, the suggested model for estimating costs of livestock and birds due to death is:
G
iiii SPQTCE
14 ))()(()( (4)
To illustrate the applicability of model 4, assume that pollution is causing death of three types of livestock; Cows (CO), Lambs (LA), and Goats (GO), and five types of birds; Ostriches (OS), Turkey (TU), Rabbits (RA), Ducks (DU), and Chicken (CH).
Based on the model’s parameters and assumptions, table 4 represents the applicability mechanism of model 4.
Table 4: Cost Estimation of deaths in Livestock and Birds [Model (4)]
Code # Gi Livestock /Birds QI
(Quantity of herd) Pi
SI
($)
E(TC4)
($)
G.01: Livestock
Subtotal
CO
LA
GO
145,500
268,700
155,800
0.33
0.54
0.50
650
180
120
31,209,750
26,117,640
9,348,000
66,675,390
G.02: Birds
Subtotal
OS
TU
RA
DU
CH
420,400
505,600
312,500
710,200
985,800
0.62
0.58
0.81
0.89
0.98
90
60
15
12
6
23,458,320
17,594,880
3,796,875
7,584,936
5,796,504
58,231,515
Total $124,906,905
3.3.3. Cost Estimation of Productivity Lost in Livestock and Birds Productivity reduction in dairy and meat is one of the major effects of pollution as it reduces the economic value of livestock and birds. Estimating the costs of such productivity reduction requires counting the quantity of livestock and birds affected by pollution (Qi), the expected market price per ton of dairy and meat for each herd (Si), productivity of dairy and meat for each herd in clean areas
5 For example, if we have 67 Cows died at a relatively clean area and 100 Cows died at a relatively polluted area, then the probability
of diseases was due to pollution (pi) = 1- 67/100 = 0.33

433 Attiea Marie and Sameer Albarghouthi
(PROC) compared to polluted areas (PROP), and the probability that the pollution is the main reason of productivity reduction in livestock and birds (Pi). The probabilities are estimated for each herd (Gi) as follows:
{1- {(productivity in polluted areas (PROP), ÷ (productivity in clean areas (PROC))}6
Based on the above parameters, the suggested model for estimating costs of productivity lost in livestock and birds due to pollution is as follows:
G
iiiii SPPROQTCE
15 ))()()(()( (5)
Where, G = Type of herd (i,1…G). Qi = Quantity of herd i, affected by pollution (i =1, 2…..., G) PROi = Reduction in herd’s productivity measured in ton. Pi = Probability of reduction in herd’s productivity due to the pollution Si = Market selling price per ton of productivity.
Table 5: Cost Estimation of Productivity Lost in Livestock and Birds [Model (5)]
Productivity
Livestock
/Birds
Gi
Qi
(Quantity of
herd)
Pro.c
(Ton/ piece
of herd)
Pro.p
(Ton/ piece
of herd)
Pro.
(Ton/ piece
of herd)
Pi Si
($/Ton)
E (TC8)
$
Dairy
Subtotal
CA
BU
CO
150,500
80,400
420,600
4.000
8.000
10.000
3.000
5.000
6.000
1.000
3.000
4.000
0.250
0.375
0.400
6,000
5,000
4,800
225,750,000
1,577,250,000
3,230,208,000
5,033,208,000
Meat
Subtotal
CO
LA
GO
50,800
00,000
300,000
0.400
0.120
0.050
0.200
0.075
0.030
0.200
0.045
0.020
0.500
0.375
0.400
10,000
9,000
8,500
650,800,000
121,500,000
20,400,000
792,700,000
Subtotal
OS
TU
CH
410,700
80,200
2,850,000
0.100
0.010
0.003
0.060
0.008
0.002
0.004
0.002
0.001
0.400
0.200
0.333
15,000
7,000
2,000
9,856,800
2,744,560
1,898,100
14,499,460
Total 5,840,407,460
4. CONCLUSIONS, LIMITATION, AND RECOMMENDATIONS
4.1. Conclusions
The study discusses various reasons of water pollution and its harmful effects on crops, fruits, fisheries, livestock, and birds. To our best knowledge, extrapolation good number of earlier studies reveals that they did not offer quantitative models to estimate the cost of water pollution’s harmful effects on agriculture, fisheries, animals and birds. The study has proposed a set of simple quantitative
6 For example, if total dairy productivity of a Camel in polluted and clean areas are 3 tons and 4 tons respectively, then the probability
of reduction in dairy productivity due to the pollution (pi) = 1- 3/4 = 0.25

434 Costs Estimation of Water Pollution in Agriculture, Fisheries, Livestock and Birds
models to accounting for these harmful effects. Due to lack of primary and secondary data availability, the applicability mechanism of the proposed models was tested based on assumed mathematical and theoretical data. Accordingly our findings cannot be generalized in real-life unless the proposed models are tested based on actual data. The availability of sufficient physical data to test the validity of the application of the presumed models, the results can be relied upon as a basis for formulating policies and plans to reduce pollution emission and encourage companies to explicitly disclose it in its financial reports. This will help all the concerned authorities and stakeholders to find quick and effective solutions for water pollution problems. 4.2. Limitations
Shortcomings in our study include the following points: The proposed models in our study cannot be circulated unless its validation and applicability are
tested using realistic data. Our study was limited to estimating the cost of pollution damage in agriculture, livestock and
fisheries and birds. The study did not address allocation of estimated costs of water pollution on its causative sources.
4.3. Recommendations
Accordingly, the study draws researchers’ attention to address the shortcomings points in our study leading to continued improvements in water cost estimation models and their allocation to sources of pollution emissions
REFERENCES
Aftab, A., Hanley, N., & Baiocchi, G. (2017). Transferability of Policies to Control Agricultural
Nonpoint Pollution in Relatively Similar Catchments. Ecological Economics, 134, 11-21. DOI: 10.1016/j.ecolecon.2016.11.004
Al Barghouthi, S., & Marie, A. (2016). Estimation of the Cost of the Direct Damage on Human Resources Caused by Water Pollution. Electronic Journal of Applied Statistical Analysis, 9(3), 502-519.
Ananda, J. (2014). Institutional Reforms to Enhance Urban Water Infrastructure with Climate Change Uncertainty. Economic Papers: A Journal of Applied Economics Policy, 33(2), 123–136.
Anderson, B., Romani, J., Phillips, H., Wentzel, M., & Tlabela, K. (2007). Exploring Environmental Perceptions, Behaviors and Awareness: Water and Water Pollution in South Africa. Population & Environment, 28(3), 133-161.
Bayou, M. E., & James, B. (1992). Costing for Manufacturing Wastes. Journal of Cost Management, 6(2), 53-62.
Bebbington, J., Gray, R., Thomson, I., & Walters, D. (1994). Accounting, Attitudes and Environmentally - Sensitive Accounting. Accounting and Business Research, 24(94), 109-120.
Dasgupta, S., Wheeler, D., Huq, M., & Zhang, C. (2001). Water pollution abatement by Chinese industry: cost estimates and policy implications. Applied Economics, 33(4), 547-557.

435 Attiea Marie and Sameer Albarghouthi
Engel, S., & Muller, A., (2016). Payments for environmental services to promote climate-smart agriculture? Potential and challenges. Agricultural Economics, 47(S1), 173-184. DOI: 10.1111/agec.12307
Gibbs, J. P., Halstead, J. M., Boyle, K. J., & Huang, J-C. (2002). An Hedonic Analysis of the Effects of Lake Water Clarity on New Hampshire Lakefront Properties. Agricultural and Resource Economics Review, 31(1), 39–46.
Hoagland, P., Jin, D., Polansky, L. Y., Kirkpatrick, B., Kirkpatrick, G., Fleming, L. E., Reich, A., Watkins, S. M., Ullmann, S. G., & Backer, L. C. (2009). The Costs of Respiratory Illnesses Arising from Florida Gulf Coast Karenia brevis Blooms. Environmental Health Perspectives, 117(8), 1239-1243.
Huang, L., Smith, M. D., & Craig, J. K. (2010). Quantifying the Economic Effects of Hypoxia on a Fishery for Brown Shrimp Farfantepenaeus aztecus. Marine and Coastal Fisheries, Dynamics, Management, and Ecosystem Science, 2(1), 232–248.
Jayanath, A., & Benjamin, H. (2015). Measuring environmentally sensitive productivity growth: An application to the urban water sector. Ecological Economics, 116, 211–219.
Jayanthi, R. (2015). Green Accounting: A Study about Its Importance and Concept. International Journal of Research in Commerce & Management, 6(11), 76-80.
Key, N., & Sneeringer, S. (2014). Potential effects of climate change on the Productivity of US dairies. American Journal of Agricultural Economics, 96(4), 1136-1156.
Michael, H. J., Boyle, K. J., & Bouchard, R. (2000). Does the Measurement of Environmental Quality Affect Implicit Prices Estimated from Hedonic Models? Land Economics, 76(2), 283-298.
Moreira, V. H., & Bravo-Ureta, B. E. (2010). Technical Efficiency and Meta technology Ratios for Dairy Farms in Three Southern Cone Countries: A Stochastic Meta-Frontier Model. Journal of Productivity Analysis, 33(1), 33–45.
Morrison Paul, C. J., Feithoven, R. G., & de O Torres, M. (2010). Productive performance in fisheries: modeling, measurement, and management. Journal of Agricultural & Resource Economic, 54(3), 343-360.
Muller, N. Z., Mendelsohn, R., & Nordhaus, W. (2011). Environmental accounting for pollution in the United States Economy. American Economic Review, 101(5), 85-97.
Pan, D., Zhou, G., Zhang, N., & Zhang, L. (2016). Farmers' preferences for livestock pollution control policy in China: a choice experiment method. Journal of Cleaner Production, 131, 572-582. DOI: 10.1016/j.jclepro.2016.04.133.
Parris, K. (2011). Impact of agriculture on water pollution in OECD Countries: recent trends and future prospects. International Journal of Water Resources Development, 27(1), 33-52. DOI: 10.1080/07900627.2010.531898
Pascoe, S. (2007). Estimation of cost function in a data poor environment: the case of capacity estimation in fisheries. Applied Economics, 39(20), 2643-2654.
Poor, P. J., Boyle, K. J., Taylor, L. O., & Bouchard, R. (2001). Objective versus Subjective Measures of Water Clarity in Hedonic Property Value Models. Land Economics, 77(4), 482-492.
Schaffner, M., Bader, H-P., & Scheidegger, R. (2011). Modeling non-point source pollution from rice farming in the Thachin River Basin. Environment, Development & Sustainability, 13(2), 403-422.
Sneeringer, S. (2009). Does Animal Feeding Operation Pollution Hurt Public Health? A National Longitudinal Study of Health Externalities Identified by Geographic Shifts in Livestock Production. American Journal of Agricultural Economics, 91(1), 124-137.
Tu, J-C., & Huang, H-S. (2015). Analysis on the relationship between green accounting and green design for enterprises. Sustainability, 7(5), 6264-6277.

436 Costs Estimation of Water Pollution in Agriculture, Fisheries, Livestock and Birds
Walsh, P. J., Milon, J. W., & Scrogin, D. O. (2011). The Property-Price Effects of Abating Nutrient Pollutants in Urban Housing Markets. In H. Thurston (Eds.), Economic Incentives for Stormwater Control (pp. 127-145). Boca Raton, Florida: CRC Press.
Weiss, P. T., Gulliver, J. S., & Erickson, A. J. (2007). Cost and Pollution Removal of Storm-Water Treatment Practices. Journal of Water Resources Planning and Management, 133(3), 218-219.
Wheeler, T. B. (2013). Fish kills, toxic algae plague Northwest Creek in Stevensville. The Baltimore Sun. Retrieved from http://articles.baltimoresun.com/2013-08-26/features/bs-grtoxic-algae-shore-20130825_1_blue-green-algae-microcystis-fish-kills