Costs and effectiveness of domestic offset schemes · Economic Affairs), Martijn Verdonk (PBL),...
85
Costs and effectiveness of domestic offset schemes Final report
Transcript of Costs and effectiveness of domestic offset schemes · Economic Affairs), Martijn Verdonk (PBL),...

Costs and effectiveness of domestic offset schemes
Final report
ECOFYS Netherlands B.V. | Kanaalweg 15G | 3526 KL Utrecht| T +31 (0)30 662-3300 | F +31 (0)30 662-3301 | E [email protected] | I www.ecofys.com
Chamber of Commerce 30161191
Costs and effectiveness of domestic offset schemes Final report
By: Bram Borkent, Siobhan O’Keeffe, Maarten Neelis and Alyssa Gilbert
Date: 20 September 2012
Project number: MARNL12277
© Ecofys 2012 by order of: Ministry of Infrastructure and Environment

ECOFYS Netherlands B.V. | Kanaalweg 15G | 3526 KL Utrecht| T +31 (0)30 662-3300 | F +31 (0)30 662-3301 | E [email protected] | I www.ecofys.com
Chamber of Commerce 30161191
Foreword
Utrecht, 20 September 2012
The Ministry of Infrastructure and Environment has appointed Ecofys to carry out a study on the
potential effectiveness of a domestic offsetting scheme within the Netherlands to reduce emissions in
the sectors of the economy in the Netherlands that are not covered by the EU Emission Trading
system (EU ETS).
The study is motivated by the resolution Van der Werf agreed by the House of Representatives in
December 2011. The motion acknowledges that the ETS Directive (Article 24a) provides a possibility
for non-ETS sectors to receive emission credits. Such an increased incentive for domestic emission
reductions could provide opportunities for the Dutch market, according to the resolution. Considering
that emissions trading should be implemented with great care in order to realise the anticipated
impact and to prevent disruption of the system, the government is requested to study possible
conditions for assigning credits to non-ETS sectors, taking into account costs and benefits, the
expected impact on the present climate policy for non-ETS companies and the expected effect on
CO2-emission reductions and CO2-prices.
A domestic offsetting scheme can take several different forms depending on design choices made by
policy makers. The design choices influence the overall effectiveness of the scheme, and therefore
the potential overall contribution of the mechanism to the national emissions reduction targets.
Considering that a domestic offsetting scheme allowing ETS-credits to be assigned to non-ETS sectors
is only one of the possible design options, this report examines to what extent different domestic
offsetting systems could be an attractive climate instrument in the Dutch context. It tries to answer
the central question whether domestic offsetting could contribute in a meaningful way to emission
reductions in the non-ETS sectors in the Netherlands, and if so, which design options are most likely
to do so.
We thank everyone that contributed to this report, especially the responsible contact persons at the
Ministry of Infrastructure and Environment: Gudi Alkemade and Eva Thompson. In addition we thank
people that joined the discussions in the advisory board: Maurits Blanson-Henkemans (Ministry of
Economic Affairs), Martijn Verdonk (PBL), Klaas-Jan Koops (Ministry of Infrastructure and
Environment), Dennis Holtrop (Ministry of Infrastructure and Environment) and David van der Woude
(Ministry of the Interior and Kingdom Relations). Also we thank our colleagues from Ecofys that
contributed in a valuable way: Kornelis Blok, Carsten Warnecke, Heleen Groenenberg and Ruben
Louw.

ECOFYS Netherlands B.V. | Kanaalweg 15G | 3526 KL Utrecht| T +31 (0)30 662-3300 | F +31 (0)30 662-3301 | E [email protected] | I www.ecofys.com
Chamber of Commerce 30161191
Executive summary
Motivation and research question
The Ministry of Infrastructure and Environment has assigned Ecofys to carry out a study on the costs,
benefits and effectiveness of a domestic offsetting scheme within the Netherlands to reduce
greenhouse gas (GHG) emissions in the sectors of the economy in the Netherlands not covered by
the EU Emission Trading system (EU ETS). These sectors not included in the EU ETS are referred to
as ‗non-ETS‘ sectors.
The study is motivated by the resolution Van der Werf agreed by the House of Representatives in
December 2011. The resolution acknowledges that the ETS Directive (Article 24a) provides a
possibility for non-ETS sectors to receive emission credits. Considering that a domestic offsetting
scheme allowing ETS-credits to be assigned to non-ETS sectors is only one of the possible design
options, this report examines to what extent different domestic offsetting systems could be an
attractive climate instrument in the Dutch context.
Cost-effective reduction potential available for domestic offsetting is small
How much greenhouse gas reduction potential is available in the non-ETS sectors in the Netherlands
which can potentially be tapped cost-effectively by a domestic offsetting scheme? The analysis is
based on potentials and costs from different measures as determined by ECN/PBL in their latest
Optiedocument 2020, with respect to a reference scenario of adopted policies in place by 2010.
We start from the principle that only emission reductions in the non-ETS sectors (filter 1) are eligible
for a domestic offsetting scheme. Also the reductions should not be more expensive than € 30/tCO2
(filter 2), should be realizable by private sector parties (filter 3), and should be additional to those
that already take place under existing policies (filter 4). Using these filters, 20 options remain
available with a total technical cost-effective reduction potential of 4.6 MtCO2. This potential does not
change significantly when other CO2 price assumptions are applied up to a level of € 45/tCO2. It is
interesting to note that most options identified have negative costs meaning that most likely, rather
than costs, other barriers exist to realize these measures.
A large share of the technical cost-effective reduction potential will not be harvested due to barriers
related to transactions costs and (im)possibilities related to establishing baselines and monitoring
methodologies on project level, which are essential to ensure that only real additional reductions are
credited under the scheme. We estimate that the maximum emission reduction potential due to these
practical implementation barriers boils down to a range of 0.5 – 1.0 MtCO2, which is smaller than 1%
of current non-ETS emissions.
Central research question
What are the costs, benefits as well as the effectiveness of different domestic offsetting systems?
ECOFYS Netherlands B.V. | Kanaalweg 15G | 3526 KL Utrecht| T +31 (0)30 662-3300 | F +31 (0)30 662-3301 | E [email protected] | I www.ecofys.com
Chamber of Commerce 30161191
Experiences in other EU countries confirm that the volume of reductions achieved by domestic
offsetting schemes is often limited, especially taking into account that most significant point sources
of emissions (e.g. N2O point sources) are already included in the EU ETS after 2012 and as such not
available for a future domestic offsetting scheme in the Netherlands.
Three design options of domestic offsetting
Nevertheless, if a domestic offsetting scheme is pursued, which design option could potentially realize
emission reductions in a cost-effective manner? Three design options are studied:
1. Article 24a: Under an Article 24a approach the domestic offset programme would serve as a
mechanism to provide more flexibility for EU ETS participants, while simultaneously
incentivising emissions reductions in non-ETS sectors. This approach is dependent on an
agreement at the European level that this Article should be used, and relies on further
legislation to be implemented. In this mechanism private investors pay for the emission
reductions generated in non-ETS entities and credits or allowances (eligible for use within the
EU ETS) are issued at the expense of an equivalent amount of AEAs (national non-ETS
emission allowances). Administration costs for the government are estimated to be at least
€ 250,000 annually.
2. Government buyer option: Two variants exist:
a) The government would commit to pay for the reductions generated by a domestic offset
scheme, and subsequently, the government then sells an amount of AEAs equivalent to
the reductions realised by the project, in order to recoup the money paid to the project
developer.
b) The reverse of option a): the government would first sell an amount of AEAs, and then
use the capital generated to fund domestic emission reductions. In these options, the
government would have to undertake design of the processes and methodologies needed
for screening and verifying the reductions realised. This makes this option a very costly
one, with estimated administration costs of € 1 - 1.5 million/yr. Also the government is
dependent on AEA demand, which is expected to be low.
3. Voluntary market option: In this approach, the government would accept the
implementation of projects using a voluntary carbon credit standard (e.g. Gold Standard,
VCS). Project developers may be incentivised to undertake projects in exchange for
internationally recognised credits. For all VERs generated the government would need to
cancel an AEA, in order to avoid double counting, as required by most standards. The
voluntary market option has the advantage that the Netherlands can implement it
independently of other countries‘ considerations. Furthermore it responds to the wish
observed by some stakeholders to offset emissions via the voluntary market with domestic
rather than international projects. Also, the voluntary market is relatively well-established
and stable, although large scale application of voluntary projects in Annex I countries could
influence the demand and supply balance on this market. The exact demand for domestic
projects in the voluntary market is something that needs more detailed research. The last
and from climate-perspective the most important advantage is that the voluntary market
design option accomplishes a global net mitigation effect, in contrast to the other options.

ECOFYS Netherlands B.V. | Kanaalweg 15G | 3526 KL Utrecht| T +31 (0)30 662-3300 | F +31 (0)30 662-3301 | E [email protected] | I www.ecofys.com
Chamber of Commerce 30161191
Administration costs for the government are estimated to be in the order of € 250,000 –
300,000 annually.
From a pro-con analysis on the three design options, we conclude that the government buyer option
is not recommended due to the high up-front costs and the dependence on AEA demand from other
Member States, which is forecasted to be low.
From the two remaining options the voluntary market option has more advantages than the Article
24a option. The administrative costs to the government are in the same order of magnitude for both
options. Although large scale application of voluntary projects in Annex I countries could influence the
demand and supply balance on this market, the exact demand for domestic projects in the voluntary
market is something that needs more detailed research.
Domestic offsetting does not directly contribute to reaching the 2020 CO2 target, but could
contribute to long term climate commitments
All three domestic offsetting schemes studied will, based on the assumptions, not directly contribute
to reaching the Dutch non-ETS emission reduction targets in the short term (e.g. during the crediting
period of projects). This is because the resulting credits are either used for compliance in the ETS
market (Art. 24a option) or are sold in the voluntary market (voluntary market option) under the
cancellation of an equivalent amount of assigned units to the Netherlands, which is essential to avoid
double-counting of emission reductions. In the government buyer option, the Netherlands sells the
surplus of assigned units to other countries. Hence, all options do not help the Netherlands in
reaching its short term non-ETS target. Opportunities to ensure a positive contribution to the Dutch
non-ETS targets in the short term exist, but are not discussed in this study.
Beyond the crediting period of the projects (typically no longer than 10 years), domestic offsetting
could however contribute to the long term (2030 or 2050) commitments of the Netherlands and could
incentivise innovation and the involvement of the private sector in domestic emission reductions.
In this context it is interesting to note that, according to the latest analyses from ECN/PBL, the non-
ETS target for 2020 is currently within range. However, existing and intended policies are not
sufficient to reach the conditional pledge of 40% emission reduction in the Netherlands in 2030
compared to 1990. However, before concluding that for this reason, domestic offsetting is an
attractive policy option to consider, domestic offsetting should at least be compared to other possible
policy instruments to tap the available non-ETS emission reductions potential, an analysis beyond the
scope of the present study.
Conclusion
The realistic emission reduction potential which could be tapped by domestic offsetting in the
Netherlands is smaller than 1% of current non-ETS emissions. All three domestic offsetting
schemes studied will, based on the assumptions, not directly contribute to reaching the Dutch
non-ETS emission reduction targets in the short term, while it could in the long term (>10 year).
Whether it is a suitable policy instrument for realizing emission reductions in the long term (2030
and beyond) is a question we recommend to be further studied in comparison with other policy
instruments and in relation to the barriers that prevent existing cost-effective reduction
potentials from being realised.

ECOFYS Netherlands B.V. | Kanaalweg 15G | 3526 KL Utrecht| T +31 (0)30 662-3300 | F +31 (0)30 662-3301 | E [email protected] | I www.ecofys.com
Chamber of Commerce 30161191
Background
What is domestic offsetting?
Domestic offsetting, in its strictest sense, is the purchase of emissions reduction credits generated in
one sector by an entity from another sector within the same country. However current discussion of
domestic offsetting in the EU has adopted a slightly broader definition. In this context the term
domestic offsetting can also be used to describe credits generated by emissions reduction projects in
sectors not included in the EU ETS, that can then be sold anywhere in the EU, amongst other to ETS
companies.
Without Kyoto successor no legal framework for Joint Implementation
In order to fully assess the potential impact a domestic offsetting scheme could have in the
Netherlands it is important to understand the existing policy landscape. During the last UN climate
change conference in Durban in November and December 2011 a draft decision was proposed that a
number of Parties (excluding Russia, Japan and Canada) will commit to a 2nd Commitment Period
(CP), running from 2013 to 2017 or 2020. The 17th Conference of the Parties, however, failed to
officially adopt the proposed decision and forwarded decisions, in particular on country-specific
reduction targets, to the next Conference of the Parties in Doha, late 2012. Therefore, at the moment
of writing this report, it is unclear whether CP1 will be succeeded by a second commitment period
with legally-binding targets (CP2).
Without a 2nd commitment period under the Kyoto Protocol there will no longer be a legal framework
for the trading mechanism of national allowances under Kyoto (AAUs). Other countries outside the EU
may also set up national or bilateral schemes to reduce emissions, but the globally recognised, UN-
approved AAUs, will cease to exist. This may have knock-on implications for other mechanisms. Most
notably, it puts the future of the Joint Implementation (JI) framework in a highly uncertain situation.
This is because JI credits and AAUs are linked to each other, and in the absence of AAUs it is highly
uncertain whether new JI credits will be able to be issued.
Non-ETS allowances (AEAs) are relevant for domestic offsetting
From 2013 onwards, the European Commission will allocate Member States with a new type of
allowance known as an Annual Emission Allocation (or AEA), in line with national caps on non-ETS
emissions. The total amount of AEAs distributed among all Member States is equivalent to the total
European cap on non-ETS emissions, as specified in the Effort Sharing Decision, and this will exist
either with or without the existence of underlying AAUs. The AEA allowances can be traded between
governments (over-the-counter) depending on which countries have a surplus amount of AEAs, and
which countries have a shortage. Similarity between AAUs and AEAs can sometimes lead to confusion
in distinguishing their specific roles and remits. The key difference is that AAUs relate to a cap on a
country‘s total national emissions, while AEAs relate to a cap on an EU Member State‘s non-ETS
emissions only.
ECOFYS Netherlands B.V. | Kanaalweg 15G | 3526 KL Utrecht| T +31 (0)30 662-3300 | F +31 (0)30 662-3301 | E [email protected] | I www.ecofys.com
Chamber of Commerce 30161191
Voluntary markets
A separate market, called the voluntary market, is comprised of credits that cannot be used for
compliance with targets or obligations, but for philanthropic or marketing purposes. The two most
widely known voluntary standards are the Gold Standard and the Verified Carbon Standard (VCS).
Both of these standards allow projects to take place in Annex 1 countries, although the Gold Standard
requires that an amount of AAUs equivalent to those generated by a project is cancelled. Note that
the Gold Standard administers both CDM projects and voluntary market projects. Only voluntary Gold
Standard projects may take place in Annex 1 countries (CDM Gold Standard is not eligible). The
Dutch government only allows the Gold Standard and CDM-equivalent projects for offsetting its own
emissions, setting a good practice example for the voluntary market.
The voluntary market can be considered as a well-established and relatively stable market.
Experiences of other countries
Several other countries have already established domestic offsetting schemes. In Europe, domestic
offsetting is implemented via a JI-like mechanism. The JI framework is not the only way to create
domestic offset credits, but many governments have chosen to do so as it constitutes a robust,
established framework that the government can use rather than carry the cost of implementing a
new framework.
From the observed offsetting schemes the following lessons can be drawn:
1. There is experience of a wide variety of project types.
2. Domestic JI projects have delivered reductions, but the scope for future domestic JI projects is
uncertain.
3. Non-JI project volumes are low.
4. Transaction costs can be a real barrier to implementation.
5. Emissions reductions within agriculture are challenging due to the lack of eligible project
methodologies, the cost of developing such methodologies, and the high marginal abatement
costs within the sector.

ECOFYS Netherlands B.V. | Kanaalweg 15G | 3526 KL Utrecht| T +31 (0)30 662-3300 | F +31 (0)30 662-3301 | E [email protected] | I www.ecofys.com
Chamber of Commerce 30161191
Samenvatting
Aanleiding en onderzoeksvraag
Het Ministerie van Infrastructuur en Milieu heeft Ecofys opdracht gegeven om een onderzoek uit te
voeren naar de kosten, baten en effectiviteit van een ‗domestic offset‘ systeem in Nederland om
daarmee een reductie te realiseren van broeikasgasemissies in ‗niet-ETS‘ sectoren, dat wil zeggen:
sectoren in Nederland die niet gedekt worden door het Europese systeem van emissiehandel (het EU-
ETS).
Deze studie is gemotiveerd door de motie Van der Werf, die in december 2011 werd aangenomen
door de Tweede Kamer der Staten Generaal. De motie erkent dat de ETS Verordening (in artikel 24a)
een mogelijkheid biedt aan niet-ETS sectoren om emissierechten te verwerven. Ervan uitgaande dat
een domestic offset systeem waarbij emissierechten uit het EU-ETS toegewezen worden aan niet-ETS
sectoren slechts één van de mogelijke ontwerpen is, onderzoekt dit rapport in welke mate
verschillende domestic offset systemen een aantrekkelijk klimaatbeleidsinstrument zouden zijn voor
Nederland.
Het kosteneffectieve reductiepotentieel beschikbaar voor domestic offsetting is klein
Hoeveel broeikasgasemissiereductiepotentieel is beschikbaar in Nederlandse niet-ETS sectoren, welke
op rendabele wijze aangeboord worden door een domestic offset systeem? De analyse is gebaseerd
op berekeningen van potentiëlen en kosten van verschillende maatregelen, zoals bepaald door
ECN/PBL in het laatste Optiedocument 2020 met betrekking tot een referentiescenario van bestaand
beleid in 2010.
We gaan uit van het principe dat alleen emissiereducties in de niet-ETS sectoren (filter 1) in
aanmerking komen voor een domestic offset systeem. Ook zouden de emissiereducties niet duurder
moeten zijn dan € 30/tCO2 (filter 2), moeten ze realiseerbaar zijn door private partijen (filter 3) en
dienen ze een aanvulling te zijn op maatregelen die reeds plaatsvinden onder het huidige beleid
(filter 4). Met behulp van deze filters blijven 20 opties beschikbaar met een totaal technisch
kosteneffectief reductiepotentieel van 4,6 miljoen tCO2. Dit potentieel verandert niet significant
wanneer andere CO2-prijzen tot een niveau van € 45/tCO2 verondersteld worden. Het is opmerkelijk
dat het gros van de geïdentificeerde opties negatieve kosten hebben, wat betekent dat
hoogstwaarschijnlijk niet de financiële kosten, maar andere oorzaken de realisatie van deze
maatregelen belemmeren.
Centrale onderzoeksvraag
Wat zijn de kosten, baten en effecten van verschillende zogenoemde ‗domestic offset‘ systemen?

ECOFYS Netherlands B.V. | Kanaalweg 15G | 3526 KL Utrecht| T +31 (0)30 662-3300 | F +31 (0)30 662-3301 | E [email protected] | I www.ecofys.com
Chamber of Commerce 30161191
Een groot deel van het technisch kostenreductiepotentieel zal niet worden gerealiseerd vanwege
barrières die worden opgeworpen door transactiekosten en door de (on)mogelijkheden op het gebied
van het vaststellen van baselines en meetmethoden op projectniveau. Deze zijn essentieel om te
garanderen dat alleen echte extra reducties begunstigd worden met emissierechten. Wij schatten in
dat door deze praktische uitvoeringsbelemmeringen het maximale emissiereductiepotentieel
ongeveer 0,5 tot 1,0 MtCO2 is; dit is minder dan 1% van de hoeveelheid emissies in de niet-ETS
sectoren. Ervaringen in andere EU-landen bevestigen dat het volume van de reducties gerealiseerd
door domestic offset regelingen vaak beperkt is, vooral gezien het feit dat de belangrijkste
puntbronnen van emissies (bijvoorbeeld N2O puntbronnen) zijn opgenomen in het EU-ETS na 2012
en als zodanig niet meer beschikbaar zijn voor een toekomstig domestic offset systeem in Nederland.
Drie mogelijke ontwerpen van domestic offsetting
Indien een domestic offset regeling zou worden nagestreefd, welk ontwerp zou dan op een
kosteneffectieve manier emissiereducties bewerkstelligen? Wij hebben drie ontwerpopties
bestudeerd:
1. Artikel 24a: Op grond van een aanpak volgens artikel 24a zou een domestic offset regeling
een mechanisme zijn om meer flexibiliteit te bieden aan EU-ETS deelnemers, terwijl
tegelijkertijd emissiereducties in niet-ETS sectoren gestimuleerd zouden worden. Deze
aanpak is afhankelijk van een akkoord op Europees niveau over het verder uitwerken van dit
artikel en zou leunen op verdere (nog te ontwikkelen) uitvoeringsmaatregelen. In dit
mechanisme betalen particuliere investeerders voor de emissiereducties die gerealiseerd
worden in niet-ETS entiteiten en emissierechten (die in aanmerking komen voor gebruik
binnen het EU-ETS) worden uitgegeven ten koste van een equivalente hoeveelheid AEA‘s
(nationale niet-ETS emissietoelage van de overheid). Administratiekosten voor de overheid
worden geschat op jaarlijks ten minste € 250.000.
2. Overheid-als-koper optie: Er bestaan twee varianten:
a) de overheid verplicht zichzelf om te betalen voor de emissiereducties die gerealiseerd
worden door de domestic offset regeling en vervolgens verkoopt de overheid een
evenredige hoeveelheid AEA‘s (gelijk aan de reducties gerealiseerd door het project) om
zodoende het geld terug te verdienen dat is betaald aan de projectontwikkelaar.
b) Het omgekeerde van optie a): de overheid verkoopt eerst een hoeveelheid AEA‘s en
gebruikt vervolgens dit geld om binnenlandse emissiereducties te financieren. In deze
optie zou de overheid verantwoordelijk zijn voor het ontwerp van processen en methoden
die nodig zijn voor het screenen en controleren van de gerealiseerde reducties. Dit maakt
deze optie een zeer kostbare, met geschatte administratiekosten van € 1 tot 1,5
miljoen/jaar. Daarnaast is de overheid in deze optie afhankelijk van vraag naar AEA‘s,
terwijl uit recente analyses blijkt dat er bijna geen vraag zal zijn omdat EU-lidstaten tot
2020 geen AEA‘s tekort komen.
3. Vrijwillige markt optie: In deze benadering zou de overheid de uitvoering van projecten
stimuleren door een standaard uit de vrijwillige markt (bijvoorbeeld Gold Standard, VCS) te
accepteren. Projectontwikkelaars kunnen worden gestimuleerd om projecten uit te voeren in
ruil voor internationaal erkende rechten van de vrijwillige markt. Voor alle gegenereerde
VER‘s zou de overheid, om dubbeltellingen te vermijden, een AEA moeten annuleren zoals

ECOFYS Netherlands B.V. | Kanaalweg 15G | 3526 KL Utrecht| T +31 (0)30 662-3300 | F +31 (0)30 662-3301 | E [email protected] | I www.ecofys.com
Chamber of Commerce 30161191
vereist door de meeste normen. De vrijwillige markt optie heeft als voordeel dat Nederland
het onafhankelijk van andere landen kan uitvoeren. Verder speelt deze optie in op de wens
van sommige stakeholders om emissies via de vrijwillige markt met binnenlandse in plaats
van internationale projecten te compenseren. Daarnaast is de vrijwillige markt een relatief
stabiele markt, hoewel grootschalige toepassing van vrijwillige projecten in annex I landen de
vraag- en aanbodbalans op deze markt kan beïnvloeden. De exacte vraag naar binnenlandse
projecten in de vrijwillige markt heeft meer gedetailleerd onderzoek nodig. Het laatste en
vanuit klimaatperspectief belangrijkste voordeel is dat de vrijwillige markt optie een globaal
netto mitigatie effect bewerkstelligt, in tegenstelling tot de andere opties.
Administratiekosten voor de overheid zijn naar schatting in de orde van € 250.000 - 300.000
per jaar.
Als we de voor- en nadelen op een rij zetten, kunnen we concluderen dat de overheid-als-koper optie
niet aanbevolen is, vanwege de hoge initiële kosten en de afhankelijkheid van de vraag naar AEAs die
waarschijnlijk laag zal zijn.
Van de twee resterende opties biedt de vrijwillige markt optie meer voordelen dan de artikel 24a-
optie. De administratieve kosten voor de overheid zijn in dezelfde orde van grootte voor beide opties.
Hoewel grootschalige toepassing van vrijwillige projecten in annex I landen invloed kan hebben op de
vraag- en aanbodbalans op deze markt, is de precieze vraag naar binnenlandse projecten in de
vrijwillige markt iets dat nader onderzoek nodig heeft.
Domestic offsetting draagt niet direct bij aan het bereiken van de CO2-doelstelling voor
2020, maar zou kunnen bijdragen aan lange termijn klimaatverplichtingen
De drie beschreven domestic offsetting opties zullen, op basis van de veronderstellingen, niet direct
bijdragen aan het bereiken van de Nederlandse niet-ETS emissiereductie doelstellingen op de korte
termijn (specifiek: tijdens de kredietperiode van projecten). Dit komt omdat de resulterende
emissierechten ofwel worden gebruikt in de ETS-markt (art. 24a optie), ofwel worden verkocht in de
vrijwillige markt (vrijwillige markt optie) onder de annulering van een equivalente hoeveelheid AEA‘s
van de Nederlandse overheid. Dit laatste is van essentieel belang om dubbeltelling van
emissiereducties te voorkomen. In de overheid-als-koper optie verkoopt Nederland het overschot aan
AEA‘s aan andere landen. Kortom, geen van de opties zullen Nederland helpen in het bereiken van de
korte termijn doelstelling op het gebied van niet-ETS emissies. Er bestaan weliswaar mogelijkheden
om een positieve bijdrage aan de Nederlandse korte termijn niet-ETS doelstellingen te garanderen,
maar deze worden niet behandeld in deze studie.
Na de kredietperiode van de projecten (meestal niet langer dan 10 jaar) kan domestic offsetting
echter een positieve bijdrage leveren aan het behalen van de lange termijn (2030 of 2050)
klimaatdoelstellingen van Nederland. Daarnaast kan het innovatie en de betrokkenheid van de
particuliere sector stimuleren op het gebied van binnenlandse emissiereducties.
In deze context is het interessant om op te merken dat, volgens de meest recente analyses van
ECN/PBL, de niet-ETS doelstelling voor 2020 op dit moment binnen bereik is. Echter, het bestaande

ECOFYS Netherlands B.V. | Kanaalweg 15G | 3526 KL Utrecht| T +31 (0)30 662-3300 | F +31 (0)30 662-3301 | E [email protected] | I www.ecofys.com
Chamber of Commerce 30161191
en beoogde beleid zijn niet voldoende om de voorwaardelijke belofte van 40% emissiereductie in
Nederland in 2030 ten opzichte van 1990 te bereiken. Alvorens te concluderen dat om deze reden
domestic offsetting een aantrekkelijk beleidsoptie zou zijn, zou dit beleidsinstrument op zijn minst
moeten worden vergeleken met andere mogelijke beleidsinstrumenten om het beschikbare
emissiereductie potentieel in de niet-ETS sectoren te realiseren; een analyse die buiten het bestek
van de huidige studie ligt.
Achtergrond
Wat is domestic offsetting?
Domestic offsetting, in de meest strikte zin, is de aankoop van emissiereductie kredieten, die zijn
verworven binnen een bepaalde sector, door een instantie uit een andere sector binnen hetzelfde
land. De huidige discussie over domestic offsetting in de EU heeft geleid tot een iets bredere definitie:
in deze context kan de term domestic offsetting refereren aan het genereren van
emissiereductiekredieten in sectoren die niet onder het EU-ETS vallen, die vervolgens overal in de EU
kunnen worden verkocht, onder andere aan ETS bedrijven.
Zonder Kyoto opvolging geen wettelijk kader voor Joint Implementation
Om de potentiële impact van een domestic offset regeling ten volle te kunnen beoordelen voor
Nederland is het belangrijk om het bestaande beleidslandschap te begrijpen. Tijdens de laatste VN-
conferentie over klimaatverandering in Durban (november en december 2011) werd in een ontwerp-
besluit voorgesteld dat een aantal partijen (met uitzondering van Rusland, Japan en Canada) zich zal
inzetten voor een tweede verbintenisperiode (commitment period, CP), lopende van 2013 tot 2017 of
tot 2020. Het lukte de VN-klimaatconferentie echter niet om het voorgenomen besluit officieel vast te
stellen en daardoor werden de beslissingen doorgeschoven, met name op het gebied van nationale
reductiedoelstellingen, naar de volgende VN-klimaatconferentie in Doha, eind 2012. Daarom is het,
op het moment van schrijven van dit rapport, onduidelijk of CP1 zal worden opgevolgd door een
tweede verbintenisperiode met juridisch bindende doelstellingen (CP2).
Zonder een tweede verbintenisperiode in het kader van het Kyoto-protocol is er niet langer een
wettelijk kader voor het verhandelen van nationale emissierechten (AAU‘s) in het kader van Kyoto.
Conclusie
Het realistisch emissiereductiepotentieel dat kan worden aangeboord voor domestic offsetting in
Nederland is kleiner dan 1% van de huidige niet-ETS emissies. Alle drie onderzochte domestic
offset varianten dragen, op basis van de gebruikte veronderstellingen, niet direct bij aan het
bereiken van de niet-ETS klimaatdoelstellingen van Nederland op de korte termijn; op de lange
termijn (>10 jaar) zou de regeling wel kunnen bijdragen. Of domestic offsetting een geschikt
beleidsinstrument is om emissiereducties op de lange termijn (2030 en verder) te realiseren, is
een vraag die we aanbevelen verder te onderzoeken. Daarbij zouden andere beleidsinstrumenten
en de barrières die verhinderen dat het bestaande kosteneffectieve reductiepotentieel wordt
gerealiseerd, meegenomen moeten worden.

ECOFYS Netherlands B.V. | Kanaalweg 15G | 3526 KL Utrecht| T +31 (0)30 662-3300 | F +31 (0)30 662-3301 | E [email protected] | I www.ecofys.com
Chamber of Commerce 30161191
Andere landen buiten de EU zouden ook nationale of bilaterale regelingen om de uitstoot te
verminderen kunnen opzetten, maar de wereldwijd erkende AAU‘s zullen ophouden te bestaan. Dit
kan vergaande gevolgen hebben voor andere mechanismen. Het meest opvallende is wel dat de
toekomst van het Joint Implementation (JI) kader in een zeer onzeker daglicht komt te staan. Dit
komt omdat JI-rechten en AAU‘s met elkaar verbonden zijn en in afwezigheid van AAU‘s is het zeer
onzeker of nieuwe JI-rechten kunnen worden afgegeven.
Niet-ETS emissieruimte (AEA’s) is relevant voor domestic offsetting
Vanaf 2013 zal de Europese Commissie aan lidstaten een nieuw type jaarlijkse emissieruimte
toewijzen, bekend als ‗Annual Emission Allocation‘ (of AEA), in overeenstemming met de nationale
emissieplafonds op niet-ETS emissies. De totale hoeveelheid AEA‘s verdeeld over alle lidstaten is
gelijk aan het totale Europese plafond voor niet-ETS emissies, zoals gespecificeerd in de Effort
Sharing Decision. De toewijzing van AEA‘s zal plaatsvinden met of zonder de aanwezigheid van
onderliggende AAU's. De AEA emissierechten kunnen worden verhandeld tussen overheden (‗over-
the-counter‘), afhankelijk van welke landen een overschot of een tekort aan AEA‘s hebben.
Overeenkomsten tussen AAU's en AEA‘s kunnen soms tot verwarring leiden in het onderscheiden van
hun specifieke functies en bevoegdheden. Het belangrijkste verschil is dat AAU's betrekking hebben
op het totale een emissieplafond van een land, terwijl AEA‘s alleen betrekking hebben op een plafond
op het niet-ETS deel van een EU-lidstaat.
Vrijwillige markten
Een afzonderlijke markt, genaamd de vrijwillige markt, bestaat uit emissierechten die niet kunnen
worden gebruikt voor naleving van doelstellingen of verplichtingen, maar voor filantropische of
marketing doeleinden. De twee meest bekende vrijwillige standaarden zijn de Gold Standard en de
Verified Carbon Standard (VCS). Beide standaarden staan projecten toe in Annex 1-landen, hoewel
de Gold Standard vereist dat een aantal AAU‘s - gelijk aan de reducties die worden gerealiseerd in
een project - worden geannuleerd door de overheid. Wij merken op dat de Gold Standard zowel CDM-
projecten als vrijwillige markt projecten beheert. Alleen vrijwillige Gold Standard-projecten kunnen
plaatsvinden in Annex 1-landen (CDM Gold Standard komt niet in aanmerking). De Nederlandse
overheid staat alleen de Gold Standard-en CDM-equivalente projecten toe voor de compensatie van
de eigen uitstoot, waarmee zij een goed voorbeeld aan de markt geeft.
De vrijwillige markt kan worden beschouwd als een gevestigde en relatief stabiele markt.
Ervaringen van andere landen
Verschillende andere landen hebben reeds domestic offset regelingen. In Europa wordt domestic
offsetting geïmplementeerd via een JI-achtig mechanisme. Het JI-kader is niet de enige manier om
domestic offset rechten te creëren, maar veel regeringen hebben ervoor gekozen om dit te doen
omdat het een robuust, gevestigd kader is dat de overheid kan gebruiken, waarbij kosten worden
bespaard die gepaard zouden gaan bij de ontwikkeling en implementatie van een nieuw kader.
Van de waargenomen domestic offset regelingen kunnen de volgende lessen worden getrokken:
1. Er is ervaring met allerlei soorten projecten.
ECOFYS Netherlands B.V. | Kanaalweg 15G | 3526 KL Utrecht| T +31 (0)30 662-3300 | F +31 (0)30 662-3301 | E [email protected] | I www.ecofys.com
Chamber of Commerce 30161191
2. Binnenlandse JI-projecten hebben echte reducties opgeleverd, maar de mogelijkheden voor
toekomstige binnenlandse JI-projecten is onzeker.
3. Niet-JI projectvolumes zijn laag.
4. Transactiekosten kunnen een echte barrière voor de uitvoering zijn.
5. Emissiereducties binnen de landbouw zijn lastig, wat te wijten is aan het gebrek aan
methodieken die in aanmerking komen voor domestic offsetting, de kosten van de
ontwikkeling van deze methoden en de hoge marginale reductiekosten binnen de sector.
ECOFYS Netherlands B.V. | Kanaalweg 15G | 3526 KL Utrecht| T +31 (0)30 662-3300 | F +31 (0)30 662-3301 | E [email protected] | I www.ecofys.com
Chamber of Commerce 30161191
Table of contents
1 Introduction 1
2 Carbon markets in the post-2012 period 3
2.1 The global carbon market context 3
2.2 The situation in Europe 8
2.3 The default post-2012 situation at national level 11
2.4 What defines domestic offsetting? 14
3 Domestic offsetting in other countries 16
3.1 Valuable insights from domestic offsetting in other countries 19
3.1.1 Specific observations 19
3.2 Lessons learned from offset schemes in other countries 21
4 Greenhouse gas reduction potentials in non-ETS sectors 24
4.1 Emissions in the non-ETS sectors 24
4.2 Data sources 25
4.3 Available non-ETS reduction potential 26
5 Design options for domestic offsetting in the Netherlands 31
5.1 Introduction 31
5.2 Three possible DO design options for the Netherlands 31
5.2.1 Domestic offsetting via Article 24a of the revised Emissions Trading Directive 32
5.2.2 Government purchase options 34
5.2.3 Adoption of a voluntary framework 38
6 Domestic offsetting as a policy option for the Netherlands 41
6.1 Introduction 41
6.2 Real potential for domestic offsetting in the Netherlands is small 41
6.3 Net costs for government vary by scheme 48
6.4 Discussion of pros and cons 50
7 Conclusion 54
Appendix 1: MAC curves and corresponding tables 56
Appendix 2: Technical questions and answers 65
Glossary 67

1
1 Introduction
The Ministry of Infrastructure and Environment has assigned Ecofys to carry out a study on the
potential effectiveness of a domestic offsetting scheme within the Netherlands to reduce greenhouse
gas (GHG) emissions in the sectors of the economy in the Netherlands not covered by the EU
Emission Trading system (EU ETS). These sectors not included in the EU ETS are referred to as ‗non-
ETS‘ sectors.
Domestic offsetting, in its strictest sense, is the purchase of emissions reduction credits generated in
one sector by an entity from another sector within the same country. However current discussion of
domestic offsetting in the EU has adopted a slightly broader definition. In this context the term
domestic offsetting can also be used to describe credits generated by emissions reduction projects in
sectors not included in the EU ETS, that can then be sold anywhere in the EU.
A DO scheme might be set up in order to provide finance for emissions reductions in a particular
project host sector, or to allow for obligated parties to meet their targets through investing in sectors
where emissions reductions may be cheaper to realize than in their own. Another driver could be the
use of domestic offsetting as a cost effective alternative to measures such as subsidies or grants.
Domestic offsetting can also act as a search function to find ‗low hanging‘ abatement opportunities
that have not yet been exploited. While domestic offsetting generally occurs at a national level,
similar mechanisms are also used at the international level for countries and companies with Kyoto
obligations. In these international mechanisms, the credits generated by a project in one country are
sold to an entity located in another country. Apart from differences in scope, domestic offset and
international offset schemes operate on very similar principles, and the more established
international mechanisms can offer some useful frameworks for guidance in the establishment of new
domestic offset schemes.
Furthermore, several countries, both in the EU and outside, have already implemented domestic
offset schemes. As these countries show, and as we will demonstrate in this report, a domestic
offsetting scheme can take several different forms depending on design choices made by policy
makers. For example, domestic offset schemes can be driven by investment by private entities or by
the government. Equally, domestic offset can be restricted to a national level (buyers and sellers are
all located within the same country), or more widely at an intra-European level, via Article 24a of the
revised EU ETS Directive. This last possibility was the main driver to assign this study. In December
2011, the resolution Van der Werf was agreed by the House of Representatives. The resolution
acknowledges that the ETS Directive (Article 24a) provides a possibility for non-ETS sectors to
receive emission credits. Such an increased incentive for domestic emission reductions could provide
opportunities for the Dutch market, according to the resolution.

2
Considering that emissions trading should be implemented with great care in order to realise the
anticipated impact and to prevent disruption of the system, the government is requested to study
possible conditions for assigning credits to non-ETS sectors, taking into account costs and benefits,
the expected impact on the present climate policy for non-ETS companies and the expected effect on
CO2-emission reductions and CO2-prices.
This report seeks to answer the central question of whether domestic offsetting could be an attractive
climate policy instrument for the Netherlands in contributing to emission reductions in the non-ETS
sectors, and if so, which design options would be most attractive? We seek to begin to answer these
questions by first sketching in Chapter 2 the context of the international carbon markets in the post
2012 period. In this Chapter, we also present a definition of domestic offsetting. In Chapter 3, we
zoom in on other countries‘ experiences with domestic offsetting to draw lessons for the Dutch
situation. In Chapter 4, we present the main principles to which the available reduction potential in
the non-ETS in the Netherlands should be subjected (no double-counting, additionality, etc.) based
on the ECN option document 2020. In Chapter 5 we define three different design options for a
domestic offsetting scheme. In Chapter 6, we try to combine the evidence built up in the previous
chapters to analyse and discuss the pros and cons of a domestic offsetting scheme in the
Netherlands. In the final chapter 7 we draw a conclusion to the question of whether domestic
offsetting could be an attractive measure to contribute to emissions reductions in Dutch non-ETS
sectors.
Before publication this report has been discussed during a limited stakeholder consultation, in which a
selection of relevant stakeholders was invited to ask technical questions about the study. A summary
of the technical questions and responses are included in Appendix 2. The selected stakeholders
involved were: VNO-NCW, the Dutch Green Building Council, Essent, Energy Valley, LTO Noord and
NZO.
We would like to stress that this report is written in a concise manner targeted for a non-specialised
but informed audience.

3
2 Carbon markets in the post-2012 period
What are the possible options for carbon credit based mechanisms beyond 2012?
2.1 The global carbon market context
In order to fully assess the potential impact a domestic offsetting scheme could have in the
Netherlands it is important to understand the existing policy landscape. This context will set out the
stage for the design options of domestic offsetting and will therefore be relevant when assessing the
impact of the different options.
Climate change is a global problem, and an international framework has been established to mitigate
anthropogenic causes of climate change. The UN Framework Convention for Climate Change is an
international environmental treaty signed in 1992 and entered into force in 1994. With 195 countries
that ratified the Convention, it has near-universal membership. The aim of the Convention is to
stabilise greenhouse gas emissions in the atmosphere at levels that will prevent ―dangerous
anthropogenic interference with the climate system‖.
In order to operationalize this objective, the legally binding Kyoto Protocol was adopted in 1997. The
Protocol set out legally-binding greenhouse gas reduction targets, or caps, to 37 industrialised
countries and the European Community, based on the principles of the Convention. The Protocol set
out reporting and verification procedures and a compliance system for its first commitment period,
which has run from 2008-2012. The Protocol also introduced a number of market-based mechanisms
to help capped countries meet these targets:
International Emissions Trading: Capped countries are provided with allowances
equivalent to their cap on emissions. If they emit less than the cap they can sell their surplus
allowances. If they emit more than the cap they must buy allowances from countries which
have a surplus. The allowances allocated to capped countries are called Assigned Amount
Units, or AAUs.
Joint Implementation (JI): Under this mechanism capped countries also have the option to
invest in emissions reduction projects in another capped country, where reductions may be
cheaper, and count these reductions towards their own target. Emissions reductions from
these projects are awarded carbon credits, equivalent to each 1 ton of CO2e reduced. Credits
generated under this mechanism are known as Emission Reduction Units (ERUs). These
credits can be counted towards Kyoto targets.

4
Clean Development Mechanism (CDM): Similar to JI, except that projects are hosted in
countries without a Kyoto cap. Credits generated under this mechanism are called Certified
Emission Reductions (CERs).
Units used in International Emissions Trading are known as allowances, while the units used in CDM
or JI are known as credits. The difference between allowances and credits is that allowances are
distributed a priori to participants within an emissions trading scheme and represent a right to emit a
quantity of emissions. Credits are generated ex post following activity to reduce emissions below a
project baseline and represent a reduction in emissions. For example, countries are allocated
allowances at the beginning of the Kyoto Protocol Commitment Period, and may subsequently trade
these depending on whether they have a shortage or surplus relative to their emissions. Under the
CDM and JI mechanisms, carbon credits are assigned to project developers equivalent to the
reductions they achieve via their projects. At the beginning of the project a baseline is established for
business as usual emissions. Reductions achieved by the project will be measured against this
baseline. The project-based mechanisms such as CDM and JI are therefore also known as baseline
and credit schemes.
Carbon credits can also be used as offsets, as they are bought to compensate, or ‗offset‘, emissions
made by the buyer. For example, a travel agency in the Netherlands may buy offsets generated from
a CDM project in India in order to compensate the emissions made by the travel agency over the
course of its daily operations.
The targets established under the Kyoto Protocol came into effect in 2008 and are due to expire at
the end of 2012. This period 2008 – 2012 is known as the 1st Commitment Period (CP1). During the
last UN climate change conference in Durban in November and December 2011 a draft decision was
proposed that a number of Parties (excluding Russia, Japan and Canada) will commit to a 2nd
Commitment Period, running from 2013 to 2017 or 20201. The 17th Conference of the Parties,
however, failed to officially adopt the proposed decision2 and forwarded decisions, in particular on
country-specific reduction targets, to the next Conference of the Parties in Doha, late 2012.
Therefore, at the moment of writing this report, it is unclear whether CP1 will be succeeded by a
second commitment period with legally-binding targets (CP2). Both possible scenarios will be further
illustrated and discussed.
1 http://unfccc.int/files/meetings/durban_nov_2011/decisions/application/pdf/awgkp_outcome.pdf (accessed 12 July 2012). 2 For an overview of decisions adopted by COP17, see: http://unfccc.int/resource/docs/2011/cop17/eng/09a01.pdf.

5
Figure 1: The global UNFCCC climate policy landscape, post-2012, assuming a 2nd Kyoto Protocol Commitment
Period is agreed. Arrows indicate the possible flow of credits into different systems
Global Emissions
AAU trade
Joint Implementation (EU & non-EU)
Voluntary Market (VERs)
Clean Development Mechanism
Countries with
uncapped emissions
Non-EU ETS sectors
3rd trading period
EUA trade
Between ETS-installations
EU ETS sectors
Countries with capped emissions
(2nd CP Kyoto Protocol)
EU emissions
AEA trade
Between MSs
6
Figure 1 demonstrates what the global policy landscape would look like should an agreement on a
second Kyoto commitment period be reached. In short, the situation would work along the same lines
as the current commitment period (CP1). The diagram shows that countries with capped emissions
are assigned AAUs, which they can trade between themselves depending on whether they have a
shortage or surplus of allowances. Within the EU, the total EU cap on emissions is then split into two
smaller ‗sub-caps‘; one for sectors included in the EU Emissions Trading Scheme (EU ETS) and one
for all other sectors (known as non-ETS sectors). Allowances tied to emissions in sectors covered by
the EU ETS are known as EU Allowances (EUAs). Allowances tied to emissions in non-ETS sectors are
known as Annual Emissions Allocations (AEAs). The arrows in the diagram represent the possible use
of CDM or JI credits for compliance with Kyoto, EU ETS or non-ETS reduction targets. For example,
CERs can be used for compliance by participants in the EU ETS, and by governments to meet
emissions reduction targets established for their non-ETS emissions, as well as to meet their overall
Kyoto emissions reduction targets.
All allowances or credits that originate in capped countries i.e. ERUs, AEAs or EUAs are, under the
Kyoto Protocol, linked or ‗backed‘ by AAUs. When any of these units are transferred, retired or
cancelled, a corresponding AAU undergoes the same fate in order to avoid double counting.
The concepts of AEA and EUA trade will be further explained in paragraph 2.2.

7
Figure 2 shows what the global policy landscape could look like if no consensus on a 2nd Kyoto
commitment period can be reached. The EU has committed to reducing emissions beyond 2012,
regardless of the outcome of UNFCCC negotiations, and therefore a cap on EU ETS and non-ETS
emissions will remain to at least 2020.
Without a 2nd commitment period under the Kyoto Protocol there will no longer be a legal framework
for the AAU trading mechanism. Other countries outside the EU may also set up national or bilateral
schemes to reduce emissions, but the globally recognised UN-approved AAUs will cease to exist. This
may have knock-on implications for other mechanisms.
Most notably, it puts the future of the JI framework in a highly uncertain situation. This is because JI
credits and AAUs are linked to each other, and in the absence of AAUs it is highly uncertain whether
new JI credits will be able to be issued3. CDM credits are not linked to AAUs, and so the mechanism
3 The JI Supervisory Committee proposed two interim solutions on 22 September 2011: ―1) use AAUs from the first commitment
period for the issuance of JI credits for reductions under Track 2 after 2012, 2) adopt modalities to continue issuance of JI credits
Figure 2: The global UNFCCC climate policy landscape, post-2012, assuming no 2nd global, legally binding agreement
(like Kyoto) is reached. The future of the JI mechanism is highly uncertain and therefore represented with dotted lines
Global Emissions
Joint Implementation (EU & non-EU)
Voluntary Market (VERs)
Clean Development Mechanism
Non-EU ETS sectors
3rd trading period
EUA trade
Between ETS-installations
EU ETS sectors
EU emissions
AEA trade
Between MSs

8
will continue regardless of discussions around a Kyoto CP2. The EU commitment to the EU ETS and
the eligibility of CERs within the EU-ETS ensures that demand for CERs will continue until at least
2020. These units all contribute to compliance with international emissions reduction targets.
Voluntary markets
A separate market called the voluntary market also exists. This market is comprised of credits that
cannot be used for compliance with targets or obligations, but for philanthropic or marketing
purposes. For example, a company that wants to brand itself as ‗carbon neutral‘ can buy voluntary
credits (known as Verified Emissions Reductions, or VERs), to offset the company‘s emissions. As
these credits are not used for compliance, voluntary market accrediting standards are characterised
by a greater degree of innovation and a broader range of eligible project types. VERs generally sell at
a slight discount to compliance credits as they do not require the same level of robustness in
monitoring, reporting and verification practices seen in compliance standards. The two most widely
known voluntary standards are the Gold Standard and the Verified Carbon Standard (VCS). Both of
these standards allow projects to take place in Annex 1 countries, although the Gold Standard
requires that an amount of AAUs equivalent to those generated by a project is cancelled. Note that
the Gold Standard administers both CDM projects and voluntary market projects. Only voluntary Gold
Standard projects may take place in Annex 1 countries – CDM Gold Standard is not eligible4. The
voluntary market can be considered as a well-established and relatively stable market. In 2010 131
MtCO2e were traded on the global voluntary market, with a value of USD$424 million. The benchmark
voluntary market standards discussed in this report have been in operation for several years. The
VCS was established in 2005, while the Gold Standard was established by WWF in 2003. Throughout
this period voluntary market prices have been stable in comparison to compliance market prices5.
2.2 The situation in Europe
The EU27 has committed itself to an overall reduction of 20% in 2020 compared to 1990 levels,
although each country has an individual target. Some countries must reduce emissions, while others
have agreed to limit emissions growth. All of these targets combined average out at the EU overall
target of -20%.
The total cap on emissions within Europe has been split into two smaller ‗sub-caps‘, for ETS and non-
ETS emissions. These caps will continue regardless of whether a second Kyoto Protocol is agreed.
and deduct these from future emission targets adopted by countries.‖ Taken from:
http://www.jiactiongroup.com/NewsArchives.htm (accessed 12 July 2012). There is currently no confirmation whether this
proposal is approved and what the ―adoption of modalities‖ in practice will mean. 4 http://v-c-s.org/sites/v-c-s.org/files/VCS%20Policy%20Brief,%20Double%20Counting.pdf (accessed August 31, 2012);
http://www.cdmgoldstandard.org/wp-content/uploads/2012/06/GSv2.2_Requirements.pdf (see Ch.2, section IIIb.3) (accessed
August 31, 2012) 5 State of the Voluntary Carbon Markets 2011, Ecosystem Marketplace.
http://www.ecosystemmarketplace.com/pages/dynamic/resources.library.page.php?page_id=8351§ion=our_publications&eod
=1

9
EU Emissions Trading Scheme
Since 2005 there is a cap on emissions from the power sector and heavy industry, via the EU
Emissions Trading Scheme (EU ETS). Within the EU ETS participating installations are allocated
emissions allowances (called EUAs) each equivalent to 1 tonne of CO2. At the end of each year
installations must surrender allowances equivalent to their overall emissions for that year. If a
company is allocated more allowances than it needs, or has reduced emissions so that it has a
surplus, these extra allowances can be sold to companies that have a shortage of allowances. EUAs
can be traded between installations in the same country, or in different EU Member States. The
scheme is overseen by the European Commission, with support from Member State governments.
Although the predominant unit within the EU ETS is the EUA, credits from the CDM or JI can also be
bought by participants and used to count towards their targets. However, there is a limit on the
number of credits that can be used within the system. This limit varies from MS to MS, but on
average equates to approximately 11% of an installation‘s total emissions.
EU emissions targets for non-ETS sectors
Sectors not included in the EU ETS (e.g. agriculture, transport, waste) are capped under the Kyoto CP
1 at the national level via the AAU distribution over Member States. From 2013 onwards, the
European Commission will allocate Member States with a new type of allowance known as an Annual
Emission Allocation (or AEA), in line with national caps on non-ETS emissions. The total amount of
AEAs distributed among all Member States is equivalent to the total cap on non-ETS emissions, as
Figure 3: EU27 target for 2020 is split between an ETS target and a target for non-ETS sectors which is Member
State specific

10
Non-EU ETS sectors
3rd trading period
EU ETS sectors
EUA tradeAEA trade
Surplus
AEAs
MS Y
MS X
Surplus
Instal-
lation
Y
Instal-
lation
X
EU emissions
Figure 4: EU carbon market landscape post-2012 (assuming no further action by Member States and no successor to
Kyoto Protocol after 2012)
specified in the Effort Sharing Decision6, and this will exist either with or without the existence of
underlying AAUs. The AEA allowances can be traded between governments (over-the-counter)
depending on which countries have a surplus amount of AEAs, and which countries have a shortage.
Countries will be required to surrender an equivalent number of AEAs to match their emissions in
these sectors7. As an additional flexibility measure governments may also purchase CERs to help
them meet their target, from the CDM mechanism described above.
The two schemes (EU ETS and non-ETS) are separate and distinct from one another, and allowances
from one scheme cannot be used for compliance in the other. EUA and AEA trades are explained in
further detail in Figure 4 below.
6Decision No 406/2009/EC of the European Parliament and of the Council of 23 April 2009 on the effort of Member States to
reduce their greenhouse gas emissions to meet the Community‘s greenhouse gas emission reduction commitments up to 2020
http://eur-lex.europa.eu/LexUriServ/LexUriServ.do?uri=CELEX:32009D0406:EN:NOT 7 The practical details of the compliance step are not publicly known yet, e.g. whether it will be annual or not, whether it will entail
real surrendering of AEAs to a public body or cancelling of AEAs on the national registry, etc.

11
Similarity between AAUs and AEAs can sometimes lead to confusion in distinguishing their specific
roles and remits. The key difference is that AAUs relate to a cap on a country‘s total national
emissions, while AEAs relate to a cap on an EU Member State‘s non-ETS emissions only. Other
similarities and differences between AAUs and AEAs are listed below.
Similarities and differences between AEA and AAU related obligations
The post-2012 obligations for the Netherlands related to the emissions in the non-ETS sectors are in
principle similar to the pre-2012 Kyoto obligations:
An overall target on emissions has to be met in a certain target year.
The target has to be met with internationally tradable units (AAUs under Kyoto, AEAs under
the EC).
Both allowance types (AEAs and AAUs) can be traded at the governmental level.
To comply with the targets the amount of assigned allowances can be supplemented by an
amount of CERs and ERUs.
There are also some differences related to its features:
AAUs are tradable among all ‗Annex 1‘ countries (the 37 countries whose emissions are
capped under the Kyoto Protocol), while AEAs are only tradable between EU Member States.
Under Kyoto the cap was static, while the non-ETS emissions target for the Netherlands is
decreasing each year;.
There are some specific limitations to AEA trades between government in relation to timing
and quantity.
2.3 The default post-2012 situation at national level
While Figure 4 shows the situation at the EU level, Figure 5 and Figure 6 dive down into what occurs
at the national level.

12
Emissions
National level
ETS
Non-
ETSEmissions Compliance
National non-ETS level
AEA
budget
Emissions Compliance
EU-ETS installation level
Surplus, tradeable
Surplus, tradeable
EUA
budget
The bar on the left shows the composition of emissions within an EU Member State. Emissions are
generated either by sectors included in the EU ETS (blue section) or sectors not included (green
section). Currently, allowances connected to emission reductions achieved in either the blue or green
sections are not interchangeable. In other words, allowances from non-ETS sectors cannot be used
for compliance in the EU ETS or vice versa.
Within the EU ETS, installations are provided with allowances equivalent to the free allocation rules at
EU level. Installations can trade these allowances based on who has a surplus or deficit of allowances.
In Figure 5 above the allocation of allowances for both ETS sectors and non-ETS sectors are
represented by the ‗Compliance‘ columns on the right hand side. In the EU-ETS installation example
given above, in the bottom right of the figure, the installation has more allowances than it needs. It
can therefore sell this surplus into the market, and benefit financially.
The same situation is occurring at the national non-ETS level, shown in the bar chart in the top right
of the Figure. National emission reduction projects in the non-ETS sectors can be used to achieve
compliance with the cap on national non-ETS emissions. The more reduction activities undertaken,
the lower national non-ETS emissions will be. Such activity can help to reduce a shortfall in AEAs, or
can even generate a surplus of AEAs that can be traded internationally by governments throughout
Europe.
Figure 5: The situation at Member State level, showing a surplus in allowances
13
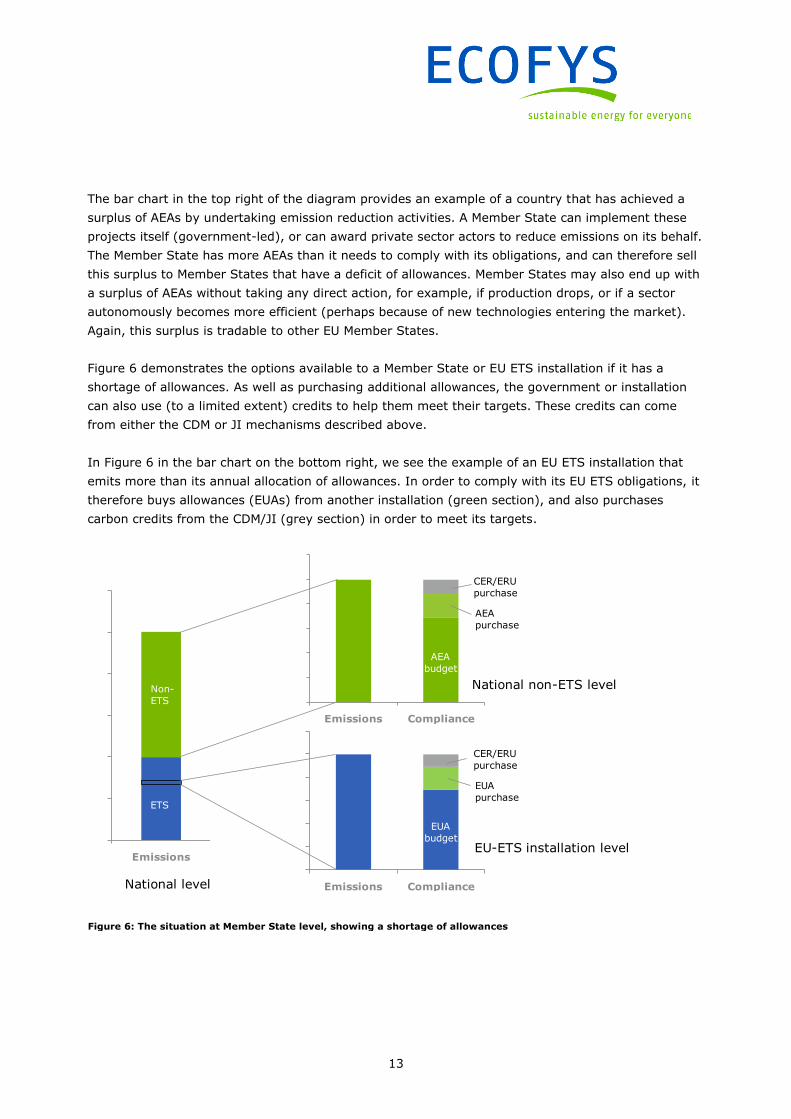
The bar chart in the top right of the diagram provides an example of a country that has achieved a
surplus of AEAs by undertaking emission reduction activities. A Member State can implement these
projects itself (government-led), or can award private sector actors to reduce emissions on its behalf.
The Member State has more AEAs than it needs to comply with its obligations, and can therefore sell
this surplus to Member States that have a deficit of allowances. Member States may also end up with
a surplus of AEAs without taking any direct action, for example, if production drops, or if a sector
autonomously becomes more efficient (perhaps because of new technologies entering the market).
Again, this surplus is tradable to other EU Member States.
Figure 6 demonstrates the options available to a Member State or EU ETS installation if it has a
shortage of allowances. As well as purchasing additional allowances, the government or installation
can also use (to a limited extent) credits to help them meet their targets. These credits can come
from either the CDM or JI mechanisms described above.
In Figure 6 in the bar chart on the bottom right, we see the example of an EU ETS installation that
emits more than its annual allocation of allowances. In order to comply with its EU ETS obligations, it
therefore buys allowances (EUAs) from another installation (green section), and also purchases
carbon credits from the CDM/JI (grey section) in order to meet its targets.
Figure 6: The situation at Member State level, showing a shortage of allowances
Emissions
National level
ETS
Non-
ETS
Emissions Compliance
National non-ETS level
Emissions Compliance
EU-ETS installation level
EUA
purchase
CER/ERU
purchase
AEA
purchase
CER/ERU
purchase
AEA
budget
EUA
budget

14
Within the non-ETS sectors, seen in the top right of the Figure, a government can also purchase AEA
allowances from EU countries with a surplus, or can also purchase external UN credits (CERs or ERUs)
to meet its compliance obligations8. Note that ERUs are included in the diagram, even though it is
assumed that the JI mechanism will cease to exist (see paragraph 2.1), as existing ERUs in the
marketplace will still be able to be used for compliance in the EU ETS.
2.4 What defines domestic offsetting?
With such a complex policy landscape the role and function of domestic offsetting can be obscured.
The definition of domestic offsetting can be highly nuanced, and dependent on policy decisions at
different levels of governance.
In its strictest sense domestic offsetting is the purchase of emissions reductions from one sector by
another industry sector within the same country or by the government in the same country. Buyers
may use these credits to meet national emissions reduction obligations placed on them by their
government or the government can buy these credits to meet the national obligations. Domestic
offsetting is therefore different from the CDM and JI mechanisms described above where the investor
and host of the project are located in different countries.
Domestic offsetting is also used to describe schemes that are more international in scope, not
sticking as strictly to the definition given above. At its most broad, domestic offsetting can be
described as the generation of emissions reduction credits in sectors not covered by an emissions
trading scheme, that can be purchased to offset emissions by other entities, within the host country
or not.
Article 24a of the EU-ETS Directive implies a domestic offsetting scheme where domestic offset
credits are eligible throughout all of the EU, and for compliance with both non-ETS and ETS targets.
However, it does not specify whether the mechanism that generates these domestic offset credits
would be national, or centralised for the entire EU.
The remainder of this report provides some examples of existing domestic offset schemes that fall
within both the strict and broad definitions above. The report explores the advantages and
disadvantages of a range of approaches.
In the next chapter, we explore existing domestic offsetting systems in Europe and elsewhere around
the world. In Europe, domestic offsetting is implemented via a JI-like mechanism. Domestic
reductions generated using a JI-like mechanism are not strict JI, as that requires a bilateral
arrangement between two countries: the host country and the buyer country.
8 In regards to the non-ETS cap on emissions Member States are allowed to use CDM or JI credits equivalent to 3% of that
Member State‘s emissions in 2005. As in the EU ETS, CDM credits generated on or after 1stJanuary 2013 must come from Least
Developed Countries, and should abide with the restrictions in eligible project types set out in the revised EU Emissions Trading
Directive http://eur-lex.europa.eu/LexUriServ/LexUriServ.do?uri=OJ:L:2009:140:0063:0087:en:PDF

15
However, a process known as domestic JI has developed where projects are essentially developed
unilaterally by the host country. Using this approach, a country will act as a buyer country for the
purposes of meeting the bureaucratic requirements, but will ultimately not buy the credits generated
by the project. Instead, the host country keeps these credits to count them against their emissions
inventory, therein creating a net reduction of emissions.
The JI framework is not the only way to create domestic offset credits, but many governments have
chosen to do so as it constitutes a robust, established framework that the government can use rather
than carry the cost of implementing a new framework. Some countries, such as Denmark, have
adopted the features of this framework without actually implementing it. This allows governments to
adjust the framework to fit national priorities, such as targeting particular sectors or reducing costs.
16
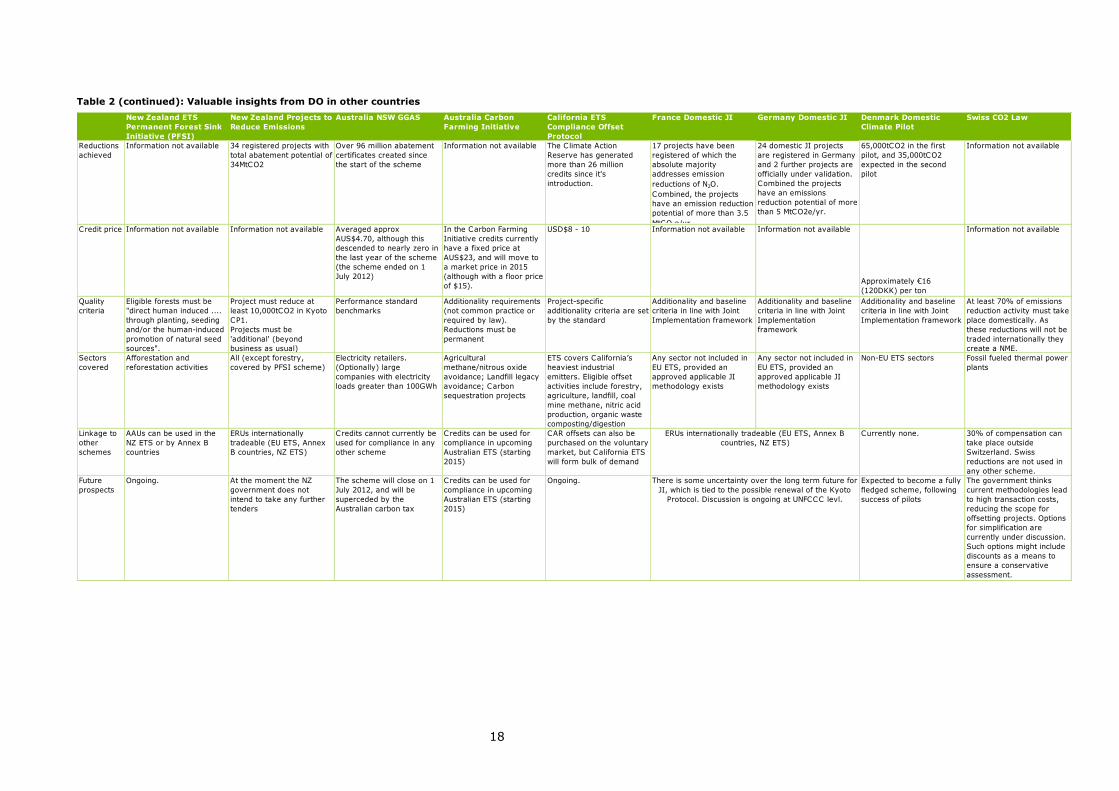
3 Domestic offsetting in other countries
What are the lessons learned in designing and implementing domestic offsetting in other countries?
Several other countries have already established domestic offsetting schemes, and exploration of the
experiences of these countries can provide some valuable insights into what factors are key to a
successful domestic offsetting scheme.
Table 1 below provides an overview of existing domestic offset schemes around the world. The table
provides a comparison of the different objectives and structure of these schemes. The structure of a
domestic offset scheme can be designed to fit different national contexts and policy priorities. The
table provides a description of the main criteria that need to be considered when designing a
domestic offset scheme. These criteria include scope, integration into existing climate
structures/legislation, the environmental integrity of the scheme and its interaction with other
(international) market-based climate mechanisms.
General and country-specific lessons learned can be found below the table.

17
Table 1: Valuable insights from DO in other countries New Zealand ETS
Permanent Forest Sink
Initiative (PFSI)
New Zealand Projects to
Reduce Emissions
Australia NSW GGAS Australia Carbon
Farming Initiative
California ETS
Compliance Offset
Protocol
France Domestic JI Germany Domestic JI Denmark Domestic
Climate Pilot
Swiss CO2 Law
Objective
s
Create a financial incentive
for private owners to
preserve NZ forest by
compensating for carbon
sequestered
Incentivise domestic
emissions reductions
To reduce GHG emissions
associated with the
production and use of
electricity; and to develop
and encourage activities to
offset the production of
GHG emissions.
Incentivise reductions in
the Australian agricultural
and forestry sector
Provide price flexibility to
participants in the
California cap & trade
scheme
Incentivise domestic
emissions reductions
Incentivise domestic
emissions reductions
To help boost domestic
climate initiatives reducing
Denmark‘s non-ETS
footprint
To reduce emissions from
the use of fossil fuels
(heating and motor fuels),
and to increase the use of
renewable energy
Type of
scheme
Project-based scheme
where forest owners sign
legally binding covenant to
not deforest in order to
receive carbon income
Tendered baseline and
credit project approach
Mandatory baseline and
credit scheme for NSW
electricity producers.
Voluntary offset scheme Regional ETS with domestic
offset eligibility
Domestic (unilateral) JI
framework
Domestic (unilateral) JI
framework
Based on JI framework Mandatory offsetting
scheme. Fossil-fuelled
plants generating power or
heat pay to compensate
100% of their CO2
emissions. 70% from
national projects and 30%
from international projects.
Start date 2007 2003 2003 2011 ETS to start in 2013, but
offsets can be used in the
voluntary market since
2001
2007 2002 2011 (pilot phase) 2000
Legislatio
n / use of
existing
structures
Covered under Part IIIB of
the Forests Act 2006.
Overseen by Ministry of
Agriculture and Forestry
Administered by NZ
Ministry of Environment
Legal basis: amendments to
the Electricity Supply Act
1995 (the Act) and the
Electricity Supply (General)
Regulation 2001 (the
Regulation).
Overseen by Independent
Pricing and Regulatory
Tribunal
Overseen by
Government's Clean
Energy Regulator.
Covered by Carbon
Farming Initiative Act 2011
Credits generated under
existing US voluntary
standard Climate Action
Reserve.
Offset Protocol included in
subarticle 13 of the cap &
trade regulation.
System implemented
through Caisse des Dépots,
which issued several
tenders to buy ERUs at an
agreed price.
The German Emission
Trading Authority (DEHSt)
is responsible for the
actual approval and
administration for projects.
Administered by Danish
Energy Agency.
Scheme uses Track 1 JI
infrastructure with some
adaptations.
Emission reductions are
calculated using CDM small
scale methodologies. The
methodologies are adapted
and standardised by the
authorities based on
project experiences made,
e.g. with regards to
emission factors.
Name of
credit
AAU (Assigned Amount
Unit)
AAU (Assigned Amount
Unit) / ERU (Emissions
Reduction Unit)
NGAC (NSW GHG
Abatement Certificate)
(ACCUs) Australian
Carbon Credit Units
CRTs (Climate Reserve
Tonnes)
ERUs ERUs No credits
issued.Developer receives
the financial equivalent for
ERU credits from
government.
Domestic certificates are
issued for domestic
reductions. These are not
convertible to Kyoto
certificates. JI or CDM
credits can also be used
(for the 30% )
Who
pays?
Forest owners pay to
establish/maintain forest
Project developers, who
recoup investment in the
market.
Project developers. Transaction costs covered
by developers.
The government has
launched AUS$13 million
fund to help developers
create successful project
methodologies.
Project developers, who
recoup investment in the
market.
Project developers, who
recoup investment in the
Kyoto market.
Project developers, who
recoup investment in the
Kyoto market.
Government has
committed DKK 8 million to
buy emissions reductions
created in the 1st pilot
(equivalent to
65,000tCO2).
Transaction costs covered
by developer.
Scheme participants who
invest in reduction projects
18
Table 2 (continued): Valuable insights from DO in other countries New Zealand ETS
Permanent Forest Sink
Initiative (PFSI)
New Zealand Projects to
Reduce Emissions
Australia NSW GGAS Australia Carbon
Farming Initiative
California ETS
Compliance Offset
Protocol
France Domestic JI Germany Domestic JI Denmark Domestic
Climate Pilot
Swiss CO2 Law
Reductions
achieved
Information not available 34 registered projects with
total abatement potential of
34MtCO2
Over 96 million abatement
certificates created since
the start of the scheme
Information not available The Climate Action
Reserve has generated
more than 26 million
credits since it's
introduction.
17 projects have been
registered of which the
absolute majority
addresses emission
reductions of N2O.
Combined, the projects
have an emission reduction
potential of more than 3.5
MtCO2e/yr.
24 domestic JI projects
are registered in Germany
and 2 further projects are
officially under validation.
Combined the projects
have an emissions
reduction potential of more
than 5 MtCO2e/yr.
65,000tCO2 in the first
pilot, and 35,000tCO2
expected in the second
pilot
Information not available
Credit price Information not available Information not available Averaged approx
AUS$4.70, although this
descended to nearly zero in
the last year of the scheme
(the scheme ended on 1
July 2012)
In the Carbon Farming
Initiative credits currently
have a fixed price at
AUS$23, and will move to
a market price in 2015
(although with a floor price
of $15).
USD$8 - 10 Information not available Information not available
Approximately €16
(120DKK) per ton
Information not available
Quality
criteria
Eligible forests must be
"direct human induced ....
through planting, seeding
and/or the human-induced
promotion of natural seed
sources".
Project must reduce at
least 10,000tCO2 in Kyoto
CP1.
Projects must be
'additional' (beyond
business as usual)
Performance standard
benchmarks
Additionality requirements
(not common practice or
required by law).
Reductions must be
permanent
Project-specific
additionality criteria are set
by the standard
Additionality and baseline
criteria in line with Joint
Implementation framework
Additionality and baseline
criteria in line with Joint
Implementation
framework
Additionality and baseline
criteria in line with Joint
Implementation framework
At least 70% of emissions
reduction activity must take
place domestically. As
these reductions will not be
traded internationally they
create a NME.
Sectors
covered
Afforestation and
reforestation activities
All (except forestry,
covered by PFSI scheme)
Electricity retailers.
(Optionally) large
companies with electricity
loads greater than 100GWh
Agricultural
methane/nitrous oxide
avoidance; Landfill legacy
avoidance; Carbon
sequestration projects
ETS covers California‘s
heaviest industrial
emitters. Eligible offset
activities include forestry,
agriculture, landfill, coal
mine methane, nitric acid
production, organic waste
composting/digestion
Any sector not included in
EU ETS, provided an
approved applicable JI
methodology exists
Any sector not included in
EU ETS, provided an
approved applicable JI
methodology exists
Non-EU ETS sectors Fossil fueled thermal power
plants
Linkage to
other
schemes
AAUs can be used in the
NZ ETS or by Annex B
countries
ERUs internationally
tradeable (EU ETS, Annex
B countries, NZ ETS)
Credits cannot currently be
used for compliance in any
other scheme
Credits can be used for
compliance in upcoming
Australian ETS (starting
2015)
CAR offsets can also be
purchased on the voluntary
market, but California ETS
will form bulk of demand
Currently none. 30% of compensation can
take place outside
Switzerland. Swiss
reductions are not used in
any other scheme.
Future
prospects
Ongoing. At the moment the NZ
government does not
intend to take any further
tenders
The scheme will close on 1
July 2012, and will be
superceded by the
Australian carbon tax
Credits can be used for
compliance in upcoming
Australian ETS (starting
2015)
Ongoing. Expected to become a fully
fledged scheme, following
success of pilots
The government thinks
current methodologies lead
to high transaction costs,
reducing the scope for
offsetting projects. Options
for simplification are
currently under discussion.
Such options might include
discounts as a means to
ensure a conservative
assessment.
ERUs internationally tradeable (EU ETS, Annex B
countries, NZ ETS)
There is some uncertainty over the long term future for
JI, which is tied to the possible renewal of the Kyoto
Protocol. Discussion is ongoing at UNFCCC levl.
19
3.1 Valuable insights from domestic offsetting in other countries
3.1.1 Specific observations
Some valuable insight can be gained from specific scheme experiences. Although the experiences of
other EU countries are arguably most interesting, the lessons learned in other countries are also
useful as these countries also share similar levels of economic development.
New Zealand
NZ PRE and PFSI schemes have enabled government administrators to familiarize themselves
with carbon market instruments while reducing domestic emissions.
Administrators were able to establish processes for linkage between domestic activities and
international carbon markets.
It can be assumed that due to the small population size linkage to international carbon
markets is important for a small country like New Zealand to ensure liquidity and demand for
credits. This is likely the reason that awarded credits through the PRE or PFSI can be
exchanged for internationally recognised credits.
Experiences helped to feed in to New Zealand economy-wide Emissions Trading Scheme (NZ
ETS).
Australia
Carbon Farming Initiative designed to incentivize reductions and research into new
agricultural abatement technologies, which could lead to potential exportable intellectual
property.
Scheme acknowledges the difficulty in establishing robust project methodologies for the
sector, and funding is provided to overcome this obstacle.
Concrete lessons learned still to be determined, as scheme still not fully established.
Denmark
The Danish Domestic Climate Programme has undertaken two pilots. The second pilot is
ongoing, and the Danish Environment Agency is in the process of evaluating and selecting the
successful project.
This scheme constitutes a ‗government buyer‘ scheme, as all reductions are purchased to
count against the national GHG inventory9.
One of the aims of the pilot was also to simplify documentation requirements that increase
transaction costs. Accordingly, The Danish Energy Agency has developed PDD templates that
are streamlined to help project developers to keep administration costs to a minimum. Project
verification done by Danish Centre for Environment & Energy, who also maintain Danish
9 For an explanation of differences between the government buyer approach and subsidies, please see the ‗general lessons learnt‘.
The government buyer approach is further detailed in Chapter 5.
20
national GHG inventory. This way data on emission reductions from the projects can easily be
aligned with inventory data.
Chosen project in 1st pilot was treatment of wastewater sludge using Oxidizing Hydrolytic
Destruction. This was chosen as this is the first time this technology has been implemented in
Denmark, and may encourage further implementation outside of the program.
A June 2012 presentation10 by the Danish Environment Agency details Denmark‘s experiences
of the scheme, and provides some lessons learnt. Barriers to successful engagement with the
scheme included lack of capacity, low carbon awareness, risk adverse local politicians. The
second tender round focused on projects at the municipal level, and the scale of potential
reductions was found to be relatively low.
Ideas to address these barriers include an increased scale of reductions through a
programmatic approach, and the provision of support via a coordinating entity to provide
more reliable data (for use in project analysis and monitoring) and to promote awareness.
France
Methodologies used in French domestic JI projects must be approved by the government.
Problems encountered included:
o Lengthy approval procedures;
o Need for invisible partner country (JI requires two parties);
o Expensive verification fees.
These problems were addressed in part by modifying Track 1 JI process via new national
laws11. This law allows the use of methodologies approved by the French government and not
necessarily by the JI administrative body. This allows the government greater control over the
rate of evaluation of proposed new methodologies.
Germany
Germany is a pioneer of Programme of Activities (PoA) JI projects, having done more than
any other country.
Beside three coal-mine-methane projects, 8 N2O reduction projects and one project reducing
PFC emissions, mainly small scale energy efficiency projects are using the ―Programme of
Activities‖ (PoA) approach are registered.
California
California ETS administrators have designed Compliance Offset Protocol to provide some price
flexibility to participants in the California ETS.
Currently, legislation states that should offset credits be discovered to come from project
subsequently found to be non-additional, the buyers of the credits will be liable to compensate
10 http://www.ens.dk/da-
DK/KlimaOgCO2/NationaleKlimaprojekter/workshop/Documents/Danish%20Energy%20Agency%20%28Bo%20Riisgaard%20Peder
sen%29.pdf 11 http://www.developpement-durable.gouv.fr/IMG/pdf/joe_20070307_0056_0061-2.pdf

21
for the false reductions. This has led to significant protests among potential project
developers (could impact demand) and buyers, and is currently a point of dispute.
Concrete lessons learned will be determined once the ETS has been established, but the
scheme benefits from using an offset standard (CCAR, the California Climate Action Reserve)
with well-established processes and protocols to enable delivery of robust projects.
Switzerland
Initially a voluntary approach was taken, but this did not meet the required levels of effort,
and mandatory measures were introduced instead.
The Federal Office for Environment considers that the methodologies currently used lead to
high transaction costs, reducing the scope for offsetting projects. Therefore options for
simplification are currently under discussion.
Ireland, Finland and Czech Republic
Ireland and Finland have both undertaken scoping studies to assess the potential for domestic offsetting.
Both studies looked at the different options for implementing a domestic offset scheme,
looking at barriers and opportunities, and different possible design structures.
Ireland‘s motivation is to develop a tool to help to reduce Ireland‘s non-ETS emissions, as the
country is currently on track to fall short of its EU non-ETS reduction target.
Currently no domestic offsetting scheme has been established in either Ireland or Finland.
The Czech Republic has implemented a number of domestic JI projects. The Czech Republic has
developed 58 domestic JI projects. However, only one of these is an N2O project, and all others have
been small-scale ―bundled‖ activities in landfill gas and biomass energy sectors.
3.2 Lessons learned from offset schemes in other countries
From these observations we can draw a number of lessons about the potential to implement a
domestic offsetting programme, and can identify some key success factors that can ensure cost
effective, net non-ETS emissions reductions.
1. There is experience of a wide variety of project types.
Schemes have pursued abatement opportunities relating to biomass, waste treatment and
anaerobic digestion. Different schemes have targeted different project opportunities. For
example, the 2nd Danish pilot has targeted municipal projects while the Czech Republic has
focused almost entirely on smaller-scale bundled projects in the landfill gas and biomass
sectors.
Focus areas for Domestic Offset schemes should bear in mind the future eligibility of
gases and/or sectors into the EU ETS (e.g. following the example of N2O projects no
longer being eligible).

22
In order to prioritize activity in particular sectors there are incentive measures that can
be taken. For example, only credits from certain sectors could be eligible for international
trade (e.g. forestry in the NZ ETS), or only one sector may be eligible to host projects
(e.g. agriculture in the Australian CFI).
2. Domestic JI projects have delivered reductions, but the scope for future domestic JI projects is uncertain.
Annex 1 participants in the Kyoto Protocol currently have the option to use an
established framework to guide emissions reductions (JI). The countries that began
project-based domestic offsetting the earliest are the countries that have made the link
to this mechanism (France, Germany, New Zealand, although in the case of New Zealand
JI processes are not used, but credits can be issued as ERUs). Countries that initiated
domestic offset activity at a later date have used different approaches. All countries that
have adopted domestic JI have seen real quantifiable emissions reductions.
However, with no agreement at the UNFCCC level about its future, the fate of the JI
mechanism, and its domestic JI counterparts, remains uncertain.
Furthermore any possible expansion in the scope of the EU ETS would limit abatement
potential via a domestic offset approach.
3. Non-JI project volumes are low.
Generally the project types undertaken in existing schemes are those with low reduction
volumes, such as anaerobic digestion projects, or those in the waste sector. One exception to
this trend is projects in the N2O sector. Both France and Germany have undertaken
substantial activity within this sector via their domestic JI programmes.
The ambition for the volumes of reductions potentially achieved via a domestic offset
scheme should be realistic (see also Chapter 4).
It must be born in mind that N2O projects will no longer be a possibility as they will be
captured in Phase 3 of the EU ETS. Therefore domestic offsetting will only be a possibility
for smaller scale projects, and the workload and costs for implementing such projects
may impose serious barriers that should be addressed.
4. Transaction costs can be a real barrier to implementation.
This barrier has been identified in the Swiss, Danish and French schemes.
The Danish, German and Swiss schemes have worked or are working to streamline the
project development process in order to reduce transaction costs. From this we can
deduce that transaction costs are reducing the feasible abatement potential of a
domestic offset scheme.
For the Danish and Swiss schemes it is not yet possible to assess the effect of these
streamlined approaches. The Danish scheme is still in a pilot phase, and the Swiss
simplification of methodology is still under discussion.
For other schemes, the German adoption of a programmatic approach helps to reduce
transaction costs by reducing the amount of verification that must take place, via a

23
sampling approach rather than verification of all individual emissions sources. It also
streamlines the process of establishing an emissions baseline.
It is important to note that a programmatic approach is not about reducing costs to
developers, but about allowing potential emissions reductions to reach a threshold where
the project activity would be viable.
This approach could also be applied within the Netherlands, depending on the future of
the mechanism. Some existing voluntary offset standards such as the Verified Carbon
Standard (VCS) also allow programmatic approaches, and the Netherlands could
therefore use one of these existing approaches to avoid the time and cost of developing
its own programmatic mechanism.
5. Emissions reductions within agriculture are challenging due to the lack of eligible
project methodologies, the cost of developing such methodologies, and the high marginal abatement costs within the sector.
In the experiences of the Australian CFI scheme and the New Zealand ETS, the main
obstacle was establishing acceptable methodologies with accurate and consistent
measurement and verification of emissions reductions achieved. Project based
agricultural emissions reductions are therefore an expensive option, not only because of
the high marginal abatement cost of some of the measures implemented, but also
because of the need to research and develop monitoring solutions.
It can be expected that this challenge will also exist in the Netherlands. However, some
limited project types seem interesting for further analysis for their potential under a
domestic offset scheme, due to the existence of eligible baseline and project
methodologies and relatively low abatement costs compared to other project types within
the sector(e.g. soil type or manure management systems). It might be interesting to
draw from lessons learned from Australia and New Zealand on overcoming the
monitoring obstacles inherent in these project types.
New Zealand postponed inclusion of agriculture into its ETS until 2015, which suggests
that the development of suitable new methodologies to drive activity in this sector is
expected to take several years.
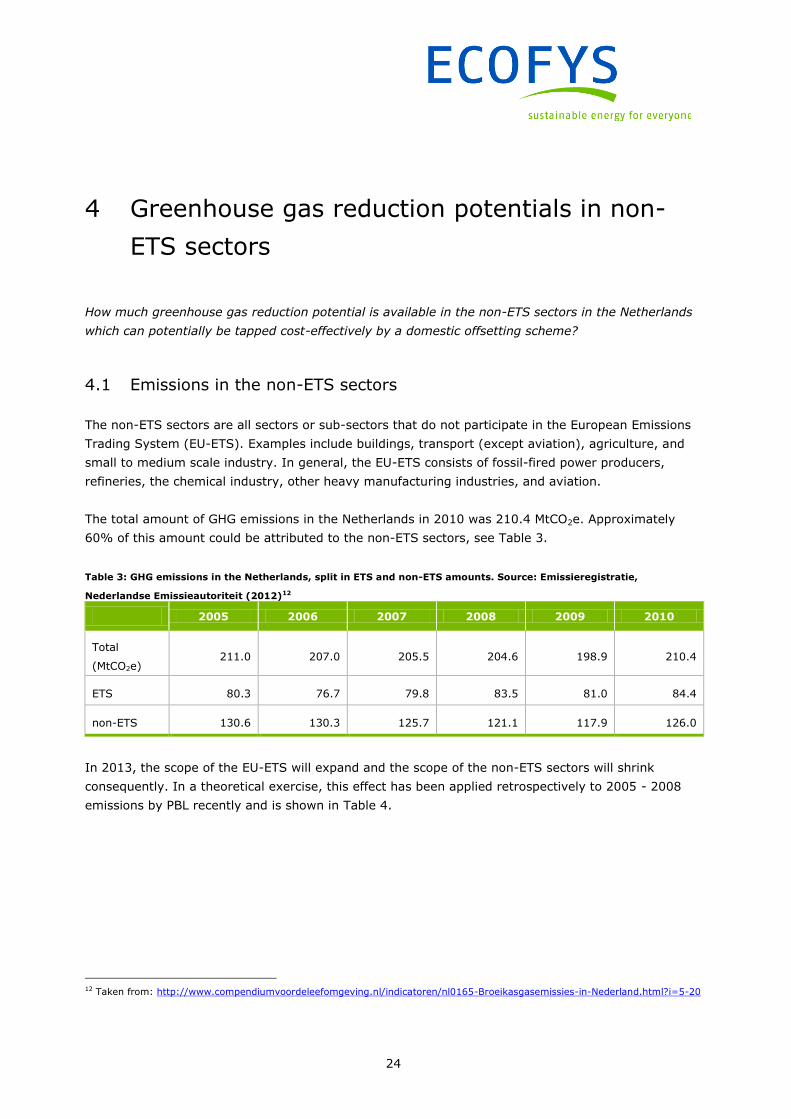
24
4 Greenhouse gas reduction potentials in non-
ETS sectors
How much greenhouse gas reduction potential is available in the non-ETS sectors in the Netherlands
which can potentially be tapped cost-effectively by a domestic offsetting scheme?
4.1 Emissions in the non-ETS sectors
The non-ETS sectors are all sectors or sub-sectors that do not participate in the European Emissions
Trading System (EU-ETS). Examples include buildings, transport (except aviation), agriculture, and
small to medium scale industry. In general, the EU-ETS consists of fossil-fired power producers,
refineries, the chemical industry, other heavy manufacturing industries, and aviation.
The total amount of GHG emissions in the Netherlands in 2010 was 210.4 MtCO2e. Approximately
60% of this amount could be attributed to the non-ETS sectors, see Table 3.
Table 3: GHG emissions in the Netherlands, split in ETS and non-ETS amounts. Source: Emissieregistratie,
Nederlandse Emissieautoriteit (2012)12
2005 2006 2007 2008 2009 2010
Total
(MtCO2e) 211.0 207.0 205.5 204.6 198.9 210.4
ETS 80.3 76.7 79.8 83.5 81.0 84.4
non-ETS 130.6 130.3 125.7 121.1 117.9 126.0
In 2013, the scope of the EU-ETS will expand and the scope of the non-ETS sectors will shrink
consequently. In a theoretical exercise, this effect has been applied retrospectively to 2005 - 2008
emissions by PBL recently and is shown in Table 4.
12 Taken from: http://www.compendiumvoordeleefomgeving.nl/indicatoren/nl0165-Broeikasgasemissies-in-Nederland.html?i=5-20
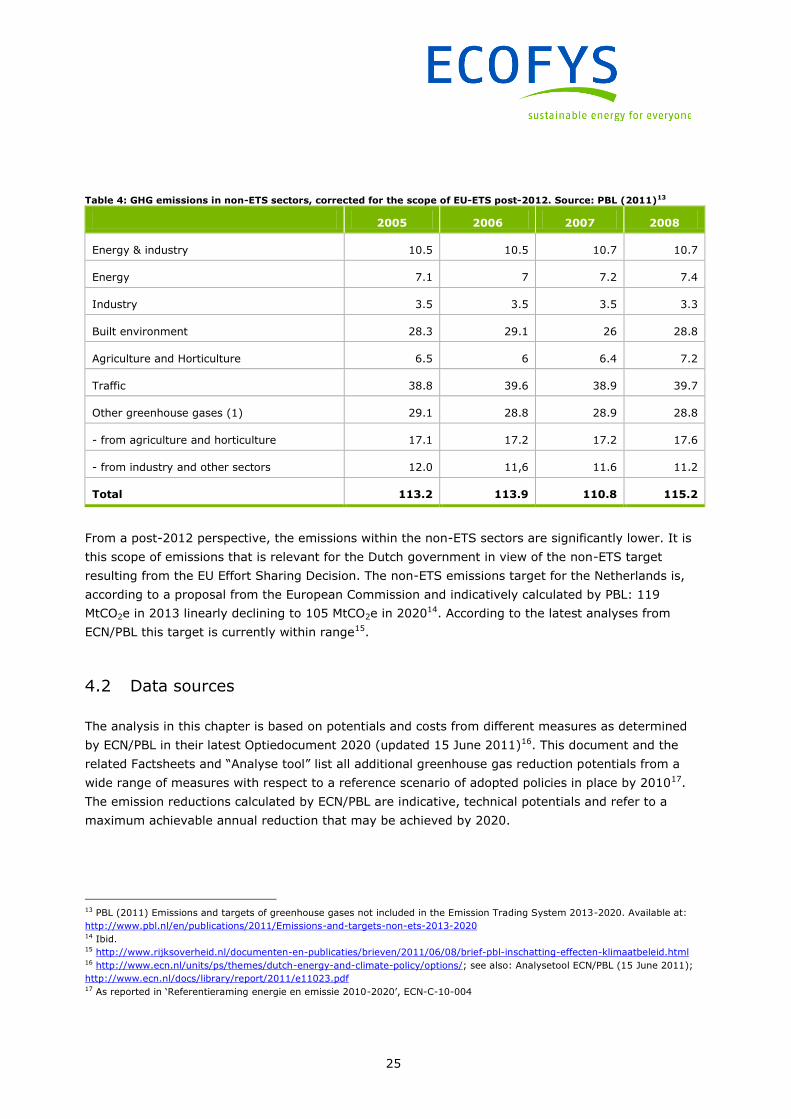
25
Table 4: GHG emissions in non-ETS sectors, corrected for the scope of EU-ETS post-2012. Source: PBL (2011)13
2005 2006 2007 2008
Energy & industry 10.5 10.5 10.7 10.7
Energy 7.1 7 7.2 7.4
Industry 3.5 3.5 3.5 3.3
Built environment 28.3 29.1 26 28.8
Agriculture and Horticulture 6.5 6 6.4 7.2
Traffic 38.8 39.6 38.9 39.7
Other greenhouse gases (1) 29.1 28.8 28.9 28.8
- from agriculture and horticulture 17.1 17.2 17.2 17.6
- from industry and other sectors 12.0 11,6 11.6 11.2
Total 113.2 113.9 110.8 115.2
From a post-2012 perspective, the emissions within the non-ETS sectors are significantly lower. It is
this scope of emissions that is relevant for the Dutch government in view of the non-ETS target
resulting from the EU Effort Sharing Decision. The non-ETS emissions target for the Netherlands is,
according to a proposal from the European Commission and indicatively calculated by PBL: 119
MtCO2e in 2013 linearly declining to 105 MtCO2e in 202014. According to the latest analyses from
ECN/PBL this target is currently within range15.
4.2 Data sources
The analysis in this chapter is based on potentials and costs from different measures as determined
by ECN/PBL in their latest Optiedocument 2020 (updated 15 June 2011)16. This document and the
related Factsheets and ―Analyse tool‖ list all additional greenhouse gas reduction potentials from a
wide range of measures with respect to a reference scenario of adopted policies in place by 201017.
The emission reductions calculated by ECN/PBL are indicative, technical potentials and refer to a
maximum achievable annual reduction that may be achieved by 2020.
13 PBL (2011) Emissions and targets of greenhouse gases not included in the Emission Trading System 2013-2020. Available at:
http://www.pbl.nl/en/publications/2011/Emissions-and-targets-non-ets-2013-2020 14 Ibid. 15 http://www.rijksoverheid.nl/documenten-en-publicaties/brieven/2011/06/08/brief-pbl-inschatting-effecten-klimaatbeleid.html 16 http://www.ecn.nl/units/ps/themes/dutch-energy-and-climate-policy/options/; see also: Analysetool ECN/PBL (15 June 2011);
http://www.ecn.nl/docs/library/report/2011/e11023.pdf 17 As reported in ‗Referentieraming energie en emissie 2010-2020‘, ECN-C-10-004

26
Overlapping potential of reduction measures has been corrected by ECN/PBL. For instance, the
reduction potential that can be realised by more efficient heating equipment will be lower when a
building has been insulated thermally first. Therefore, it is assumed that the most economically
attractive measures are implemented first. In addition, some measures may have different levels of
implementation and therefore different variants are sometimes taken into account. For example, the
application of thermal insulation in the existing building stock can refer to improved wall, floor or roof
insulation, which usually has different reduction potentials and economic pay back times. Also the
thickness of the applied insulation has impact on both potentials and pay back times. By defining
different variants these differences can be taken into account to some extent.
Note that in practice the reduction potential and cost effectiveness of projects could differ from the
technical measures defined by ECN/PBL. A project could for instance include a combination of cheap
and expensive options, making the reduction potential larger, but decreasing the overall profitability.
We think these differences on project level will not change the order of magnitude of the available
reductions potential identified in this study.
4.3 Available non-ETS reduction potential
We have determined the cost-effective reduction potential available in the non-ETS sectors by
applying several filters to the list provided by ECN/PBL, see Figure 7 for a schematic representation.
In the multicriteria analysis (Chapter 6) the potential after filter 4 is taken as a starting point,
followed by a more precise impact assessment aligned with the characteristics of the domestic
offsetting design of interest.
Figure 7: Filters applied to the available GHG reduction potential in The Netherlands. Each filter decreases the
available reduction potential
1. In non-ETS sectors only
2. Below 30 € / tCO2
1. In non-ETS sectors only
2. Below 30 € / tCO2
3. Not ―government-
only‖
4. Additional
Available GHG reduction potential
Cost-effective
potential available for
domestic offsetting

27
Filter 1: Options in non-ETS sectors only
First, only options that apply to non-ETS sectors have been selected in order to safeguard the
principle of ―no double-counting‖. Projects related to renewable electricity generation are for example
filtered out: fossil-fired electricity production is covered by the EU-ETS and renewable production of
electricity may therefore result in less ETS emissions.
In the source data the relevant sector and the ETS/non-ETS status was indicated for each reduction
option, making the filter straightforward to apply. Three options for industry (biomass-fired boilers,
bio-oil-fired CHPs, and digestion of bio based waste streams in the food industry) are relevant for
both ETS and non-ETS industries. The non-ETS part of these specific options were considered
significantly smaller than the ETS-part of the potentials, therefore these options, accounting for a
potential of 2.9 MtCO2, have been excluded from the analysis.
After this first filter a list with 62 options was available, with a total technical reduction potential of
around 24 MtCO2e18. Some options appear in the list several times, but with different (additional)
levels of implementation.
Filter 2: Maximum cost-effectiveness of € 30/tCO2
The second filter is the cost-effectiveness of the reduction measures.
In this analysis a maximum CO2-price stimulus of € 30/tCO2 is assumed19. This means that all
reduction measures with a cost-effectiveness beyond € 30/tCO2 are considered as too expensive to be
incentivised by a CO2-price alone. Nevertheless, domestic offsetting could make ―expensive‖ options
(from a CO2 point of view) more attractive as well. Because other factors play a role as well in
sustainable decision making (energy prices, fuel strategies, sense of ―urgency‖, marketing, etc) it
cannot be excluded that part of this expensive potential may also be used for domestic offsetting20
but this has not been taken into account in this analysis.
Because domestic offsetting is a market-based mechanism, the cost-effectiveness from the end-users
(and not the social or national) perspective is relevant. In most options, the end-users cost-
effectiveness is much lower than the national cost-effectiveness. This can be explained by the
relatively large part of energy taxes applicable to fuels in the non-ETS sectors, which make energy
savings financially more attractive compared to the national perspective. For example, fuel savings in
road transport lead to reduced expenses (fuel costs and taxes) for end users, while on the national
level we will experience a loss of tax income.
18 This number corresponds roughly to the ~24 MtCO2e technical potential for the non-ETS sectors indicated in Fig 3.4 of
‗Actualisatie Optiedocument 2010‘ (ECN-E—1-023). 19 The maximum level chosen here fits with price developments over the past years and price forecasts up to 2020: the current
CO2-price in the EU-ETS fluctuates between € 6-8/tCO2e (June 2012). The maximum price over the last three years has not
exceeded € 20/tCO2e The current CO2-price forecast for 2013-2020 predicts a price not larger than € 20/tCO2e (i.e. without
intervention from the European Commission). See also Observation 2 for a sensitivity check of the maximum CO2-price. 20 In Germany, we are aware of domestic reduction projects which are not profitable, but which are carried out for marketing
purposes.
28
After this filter, a list with 35 options remains available, with a total reduction potential of 12.2
MtCO2e.
Filter 3: No options that are “government-only”
Several options are in the list that can be implemented by a government only, e.g. lowering the
maximum speed limit on highways, applying a kerosene excise duty, or setting a price-per-kilometre
for cars and vans. The reduction potentials of these options can never be reached by a private
investor, because it is the government only that has the legal power to put these specific policies in
place. Therefore these options have to be taken out. Interestingly, all ―government-only‖ options
appear in the transport sector and have relatively large reduction potentials.
After this filter is applied, 26 options remain available, with a total reduction potential of 7.2 MtCO2e.
Filter 4: Options must be additional
All calculated reduction potentials are additional with respect to a reference scenario used by
ECN/PBL, i.e. the adopted policies in place by 2010. Since 2010, few climate policies were
implemented in the Netherlands, e.g. SDE and SDE+, but it was out of the scope of the current
analysis to perform an additionality assessment against current policies21.
A basic check against planned policies22 shows that two planned policy measures potentially overlap
with the options available for domestic offsetting, i.e. CO2 standards for vans and CO2-standards for
trucks. This could reduce the available potential by a maximum amount of 0.65 MtCO2. In order not
to move the reference scenario, this impact has not been taken into account in the current analysis.
An exception to this rule is six agricultural options which mainly apply to the glass-roofed horticultural
sector. In this subsector a sectoral emissions trading system has been set up and it is clear that
emission reductions within this subsector cannot be considered additional. The excluded options are:
Small scale CHP, bio-oil fired CHP, and CO2 supply to the glass-roofed horticulture.
After applying this filter, 20 options remain available (see Table 5), with a total reduction potential of
4.6 MtCO2e.
21 Other recent policy measures that may lead an increase of emissions (and hence a larger reduction potential), like the increase
of the maximum speed limit on highways, have not been taken into account as well. 22 As notified in ―Effectinschatting voorgenomen beleid. Notitie IenM, 6 april 2011, aangepast 27 mei 2011‖.
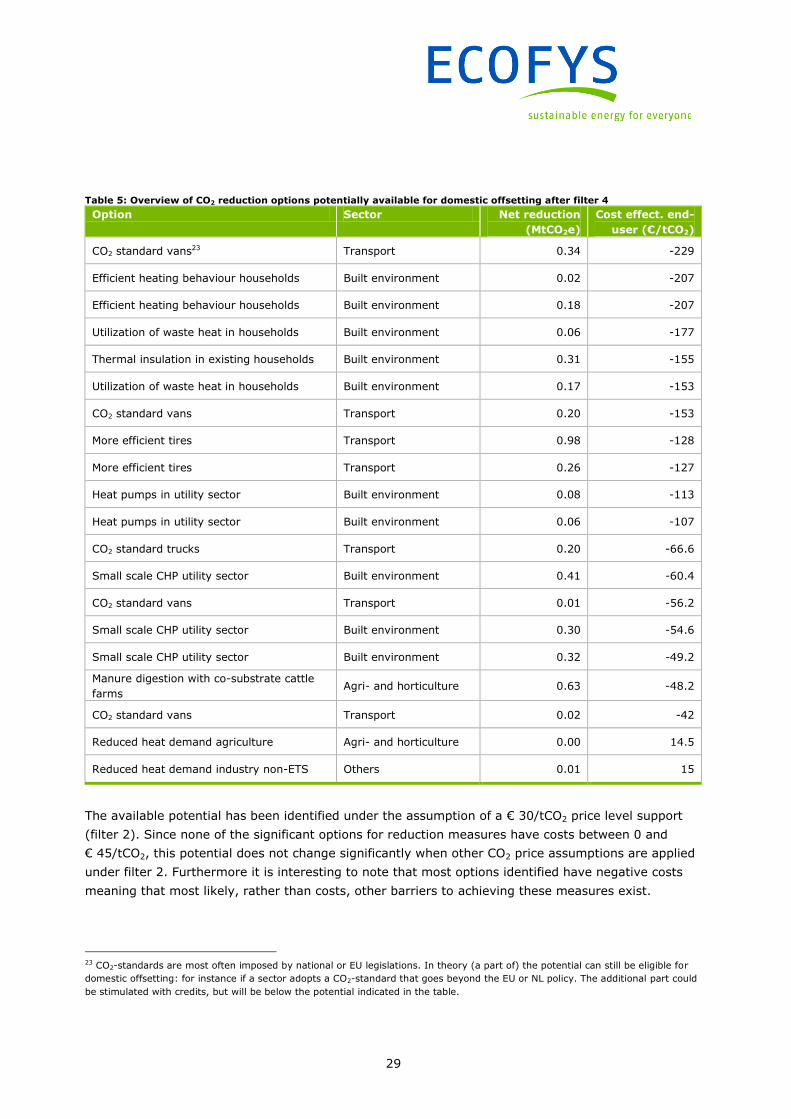
29
Table 5: Overview of CO2 reduction options potentially available for domestic offsetting after filter 4
Option Sector Net reduction
(MtCO2e)
Cost effect. end-
user (€/tCO2)
CO2 standard vans23 Transport 0.34 -229
Efficient heating behaviour households Built environment 0.02 -207
Efficient heating behaviour households Built environment 0.18 -207
Utilization of waste heat in households Built environment 0.06 -177
Thermal insulation in existing households Built environment 0.31 -155
Utilization of waste heat in households Built environment 0.17 -153
CO2 standard vans Transport 0.20 -153
More efficient tires Transport 0.98 -128
More efficient tires Transport 0.26 -127
Heat pumps in utility sector Built environment 0.08 -113
Heat pumps in utility sector Built environment 0.06 -107
CO2 standard trucks Transport 0.20 -66.6
Small scale CHP utility sector Built environment 0.41 -60.4
CO2 standard vans Transport 0.01 -56.2
Small scale CHP utility sector Built environment 0.30 -54.6
Small scale CHP utility sector Built environment 0.32 -49.2
Manure digestion with co-substrate cattle
farms Agri- and horticulture 0.63 -48.2
CO2 standard vans Transport 0.02 -42
Reduced heat demand agriculture Agri- and horticulture 0.00 14.5
Reduced heat demand industry non-ETS Others 0.01 15
The available potential has been identified under the assumption of a € 30/tCO2 price level support
(filter 2). Since none of the significant options for reduction measures have costs between 0 and
€ 45/tCO2, this potential does not change significantly when other CO2 price assumptions are applied
under filter 2. Furthermore it is interesting to note that most options identified have negative costs
meaning that most likely, rather than costs, other barriers to achieving these measures exist.
23 CO2-standards are most often imposed by national or EU legislations. In theory (a part of) the potential can still be eligible for
domestic offsetting: for instance if a sector adopts a CO2-standard that goes beyond the EU or NL policy. The additional part could
be stimulated with credits, but will be below the potential indicated in the table.

30
In Chapter 6, 4.6 MtCO2. reduction potential that potentially could be targeted under a domestic
offsetting scheme is taken as a starting point to derive a realistic potential for domestic offsetting in
the Netherlands, taking into account issues such as transaction costs, practical barriers, benefits and
specific issues related to some of the design options defined in the next chapter.

31
5 Design options for domestic offsetting in the
Netherlands
Which design option could potentially lead to a reduction potential in a cost-effective manner?
5.1 Introduction
There are a number of options in terms of the potential design of a domestic offset scheme. Choices
on different elements of scheme design can influence the overall cost effectiveness and ambition of
the scheme. Identification of the most suitable scheme design will depend on the outcome of ongoing
developments at both the UNFCCC and EC level. For example, continuation of the JI would open up a
further option to use the domestic JI framework in a similar way to neighbouring countries France and
Germany. Therefore further attention to developments at the international and EU level are important
in order to ensure that opportunities to consider other design options are not missed.
5.2 Three possible DO design options for the Netherlands
This section explores three different possible design options for a Dutch domestic offset scheme in
detail, and examines their suitability, advantages and disadvantages. Multiple design variations exist,
but we have selected these three from a long list of options, using a number of key criteria. The long
list of options included:
1. EU ETS linkage and use of Article 24a.
2. Government purchase of domestic credits.
3. AEA trades with upfront investments in the Netherlands.
4. AEA trades with subsequent investment in the Netherlands.
5. Use of voluntary offset standards.
6. Joint Implementation for domestic projects in the Netherlands.
7. Non-ETS cap and trade scheme in combination with a sectoral crediting scheme.
These options were assessed against the criteria of overall complexity and sustainability. For example,
due to the uncertain future of the JI mechanism, this option (nr. 6) was excluded. The relative
complexity of the non-ETS cap and trade scheme in combination with a sectoral crediting scheme (nr.
7) has been reason to exclude this option as well. From the remaining options, option 2 – 4 can be
considered as variants of one generic option. This results in a shortlist of the three most likely design
variations. These three options are selected as those that could offer potential for the Dutch context
and cover the key relevant issues related to the subject, taking into account the specific sectors and
reduction options that would be most likely to be targeted under a domestic offset scheme.

32
In all options below, prevention of double counting is maintained by cancellation of an equivalent
amount of AEAs compared to the amount of credits generated. We assume here that the emission
reductions achieved are taken into account (i.e. become visible) in the national monitoring of non-ETS
emissions, otherwise the government would face a financial risk. In practice, in many cases presently
the monitoring is realised top down, instead of bottom-up. In case this causes the risk mentioned
above, there will be additional costs involved in the necessary adjustment of the monitoring protocols.
5.2.1 Domestic offsetting via Article 24a of the revised Emissions Trading Directive
Under an Article 24a approach the domestic offset programme would serve as a mechanism to
provide flexibility for EU ETS participants, while simultaneously incentivising emissions reductions in
non-ETS sectors.
As Figure 8 shows below, the purpose of Article 24a is to allow EU ETS participants to finance
emissions reductions in non-ETS sectors, and then use the ensuing credits for compliance with the EU
ETS. Although details on the implementation of this option are not available, it is very clear from the
Effort Sharing Decision (Article 10b) that an equivalent amount of AEAs need to be cancelled in order
to avoid double counting of emission reductions. Hence, this design option – if implemented - will not
contribute to reaching the non-ETS target of the host country in the short term.
As this mechanism is financed by private investors, there would be minimal transaction costs for the
government.
Article 24a of the revised Emissions Trading Directive (Decision No 2009/29/EC)
“―[Implementing] measures for issuing allowances or credits in respect of projects
administered by Member States that reduce greenhouse gas emissions not covered by the
Community scheme may be adopted.”
Article 24a of the revised EU ETS Directive mandates the Commission to adopt implementing
legislation which would allow Member States to issue credits or allowances from projects that
reduce emissions in sectors outside the scope of the EU ETS.
The issues surrounding the Article include uncertainties on the interpretation of the text, the
design options of the mechanism, the exact role of the EU Commission and for Member States,
and the relationship with the Joint Implementation flexible mechanism of the Kyoto Protocol.

33
Step 1
Step 2
Figure 8: Article 24a approach
Emissions
National level
ETS
Non-
ETS
Emissions Compliance
AEA
budget
Finance for domestic projects
by (EU ETS) market
Emissions
National level
ETS
Non-
ETS
Emissions Compliance
AEA
budget
DOC
Reductions generate EUAs or
―Domestic Offset Credits‖
which can be used in EU-ETSEUA
Government cancels AEAs

34
This approach is dependent on an agreement at the European level that this Article should be used,
and relies on further legislation to be implemented. Furthermore, there would need to be agreement
between EU member states on the modalities of its application. The option has the following
characteristics:
It could offer a clear route to developing projects in the absence of a Kyoto and JI structure
that is embedded in European legislation.
It is a direct link to an established source of demand i.e. the EU Emissions trading scheme.
It has the potential to use existing agreed methodologies for projects and processes
developed under existing standards. Where methodologies do not yet exist for project types
identified in Chapter 4, new methodologies can be developed, so that all abatement potential
can potentially be exploited.
It allows for the EU ETS to access lower cost reductions outside their sectors, potentially
reducing costs to Dutch industry of meeting EU ETS targets [given the negative costs of the
main measures identified].
It requires further implementation legislation from the European Commission. There is no
certainty on the time frame that would be needed for this to occur, and would require political
will from a number of different parties.
It offers less possibility for control over the design of this option, as this may be structured at
EC level. Interests of other countries could therefore dominate. Should the Commission
implement this option in the future, the scope of eligible project activities could determine the
level of benefit for the Dutch government. Inclusion of some project activities could lead to a
large supply of relatively cheap domestic credits in the market (e.g. from less efficient non-
ETS industries in Eastern Europe), leading to low demand for credits from the Netherlands. A
more restricted scope to exclude these project types could help to focus abatement on
activities with an abatement cost similar to that of abatement options within the Netherlands,
ensuring competitiveness.
It results in non-ETS emission reduction to move from contributing to the national non-ETS
target to contributing to the European ETS target. [Assuming the cheaper reduction options
would be used to bring under the ETS, the remaining reductions necessary under the non-ETS
would potentially be the most expensive ones.]
5.2.2 Government purchase options
A scheme where the government commits to ‗buy‘ (pay for) the emissions reductions generated could
be established. A purely government option would require the government to accept a cost for the
emissions reductions generated. However, this can be alleviated by combining a government buyer
approach with a trade of AEAs equivalent to the reductions generated making it a real offsetting
mechanism (i.e. used by other countries to fulfil their obligations). This could be implemented using
two different formats:

35
Option A: Government purchase scheme with subsequent AEA trades
Under this option, the government would commit to pay for the reductions generated by a domestic
offset scheme. Figure 9 below demonstrates the two main steps involved in this approach.
Step 1
Step 2
Figure 9: Government buyer approach with subsequent AEA trades
Emissions
National level
ETS
Non-
ETS
Emissions Compliance
AEA
budget
Finance for domestic projects
by government
Emissions
National level
ETS
Non-
ETS
Emissions Compliance
AEA
budget
AEAs
Other
MS
Government sells surplus AEAs

36
In step 1, the government submits a tender calling for proposed domestic emissions reduction
projects. The government can then screen proposals and select projects it finds acceptable. These
projects are then implemented, and the project developers are paid a fixed amount per ton by the
government for the emissions reductions they generate.
In step 2, the government then sells an amount of AEAs equivalent to the reductions realised by the
project, in order to recoup the money paid to the project developer.
The characteristics of this option are the following:
The government is able to recoup the cost of purchasing the credits generated by approved
projects, but is exposed to a risk of low or no demand for AEAs, which could occur in the
event of a recession, for example, where emissions drop because of lower production. This
would mean that the government is not able to recoup the cost of reductions generated.
The government can control the number of projects selected, and can design a scheme that is
suited to national priorities (e.g. approving activities only in specific sectors etc).
This option makes uses of the instrument of AEA trade. It is not yet clear at which price AEAs
can be traded. There is a risk that AEAs, once they are traded, are valued below the price for
which the government had financed the emissions reductions24 .
The government needs to finance achieved emission reductions upfront. This will require the
availability of cash budget to do so.
The government would have to undertake design of the processes and methodologies needed
for screening and verifying the reductions realised. This burden can partly be mitigated by
adapting existing processes (e.g. from JI), but the government would still need to approve
verifiers etc.
The effectiveness to reduce emissions of this design option is dependent on the uptake of
projects by project developers. In other words: the scheme does not provide certainty on the
amount of emissions reductions that will be achieved. Previous experiences in the Netherlands
from the ―CO2-reductie-plan‖25 underpin this risk. In the CO2-reductieplan the government
reserved a significant budget to tender CO2 emission reduction projects, but a limited amount
of projects were initiated, using only a limited amount of the budget.
24 If the AEA price is valued equal to the price the government has paid for emissions reductions, additional costs related to
inflation correction and interest are encountered. 25 Tweede Kamer, vergaderjaar 2002 – 2003, 25 026, nr. 13. Available at: http://cdn.ikregeer.nl/pdf/kst-25026-13.pdf.

37
Option B: Upfront AEA trades and subsequent domestic emissions reduction purchase
This option essentially reverses the steps in the previous option, in that the government would first
sell an amount of AEAs, and then use the capital generated to fund domestic emission reductions.
Step 1
Step 2
Figure 10: Upfront AEA trades and subsequent domestic emissions reduction purchase
Emissions
National level
ETS
Non-
ETS
Emissions Compliance
AEA
budget
AEAs
Other
MS
Government sells AEAs upfront
Emissions
National level
ETS
Non-
ETS
Emissions Compliance
AEA
budget
Finance for domestic projects
by government

38
The characteristics of this option are:
There is no upfront outlay for the government, and therefore no financial risk in implementing
the scheme. However, there is a risk that AEA revenues may become disconnected from
domestic emissions reduction projects (e.g. due to a lack of interest in the scheme), which
would then damage work towards meeting (future) ESD targets.
The government can control the number of projects selected, and can design a scheme that is
suited to national priorities (e.g. approving activities only in specific sectors etc.).
The government would have to undertake design of the processes and methodologies needed
for screening and verifying the reductions realised. This burden can partly be mitigated by
adapting existing processes (e.g. from JI), but the government would still need to approve
verifiers etc.
The effectiveness to reduce emissions of this design option is dependent on the uptake of
projects by project developers. In other words: the scheme does not provide certainty on the
amount of emissions reductions that will be achieved. Previous experiences from the ―CO2-
reductie-plan‖26 underpin this risk. In the CO2-reductieplan the government reserved a
significant budget to tender CO2 emission reduction projects, but a limited amount of projects
were initiated, using only a limited amount of the budget.
5.2.3 Adoption of a voluntary framework
This option would open up domestic emissions reduction activity to the established voluntary credit
market. In this approach, the government would accept the implementation of projects using a
voluntary carbon credit standard (e.g. Gold Standard, VCS). Using this approach, project developers
may be incentivised to undertake projects in exchange for internationally recognised credits. For all
VERs generated the government would need to cancel an AEA, in order to avoid double counting, as
required by most standards. Note therefore that the government should not seek to purchase the
VERs generated by domestic projects, as this would lead to a double cost – the value of the cancelled
AEA, and the value of the VER credit.
26 Tweede Kamer, vergaderjaar 2002–2003, 25 026, nr. 13. Available at: http://cdn.ikregeer.nl/pdf/kst-25026-13.pdf.

39
Figure 11 illustrates how this approach would work. Firstly, a project developer undertakes an
emissions reduction project, using the voluntary standard framework approved by the government for
the purposes of the domestic offset programme.
When the voluntary standard issues the credits (known as Verified Emissions Reductions, or VERs),
then the government cancels an equivalent amount of AEAs, in order to avoid double counting of
emissions reductions. The VERs are then free to be sold by the project developer to private investors.
Figure 11: Adoption of a voluntary framework
Emissions
National level
ETS
Non-
ETS
Emissions Compliance
AEA
budget
Finance for domestic projects
by market (project developers)
Emissions Compliance
Project
developers
Uncapped
private
sector
€
• Government cancels AEAs
• Market receives voluntary credits
which can be further sold on
Emissions
National level
ETS
Non-
ETS
AEA
budget

40
The characteristics of this option are the following:
The effectiveness to reduce emissions of this design option is dependent on the uptake of
projects by project developers. There is no guarantee of uptake by project developers,
especially if international VER prices are low, as they currently are. In other words: the
scheme does not provide certainty on the amount of emissions reductions that will be
achieved.
Via the established international voluntary credit market, there is a clear more or less
guaranteed demand for the credits generated. In the voluntary market, prices are currently
converging with other carbon prices e.g. EUAs and CERs. Many structures and standards
already exist that could immediately be used by the private sector in establishing projects,
reducing the burden on policy-makers in setting up the scheme and allowing the scheme to
be designed in a more cost-effective way.
There is no dependency on upfront financing by the government.
In the case of international sale of the VERs generated an equivalent number of AEAs would
need to be cancelled to avoid double counting.
The government only allows the Gold Standard and CDM-equivalent projects for offsetting its
own emissions27, setting a good practice example for the voluntary market. This restricts the
abatement potential within the scheme. The Gold Standard in particular has restrictions on
eligible project types, and large scale implementation of voluntary projects in capped
countries such as the Netherlands is a novelty that would need further discussions with
voluntary standards such as the Gold Standard. We recommend that in these discussions the
Netherlands maintains its current position on the level of credibility and environmental
integrity of voluntary credits they accept.
27 CDM credits are typically developed and bought for compliance in the EU ETS, or by governments to assist compliance with
Kyoto targets. However, they may also be bought by voluntary buyers who trust in the robustness of the CDM standard.

41
6 Domestic offsetting as a policy option for the
Netherlands
6.1 Introduction
In Chapter 3, we identified a cost-effective, technical reduction potential of 4.6 MtCO2 in the non-ETS
sectors in the Netherlands that could potentially be targeted via domestic offsetting in the
Netherlands. In Chapter 4, we discussed three possible design options for a domestic offsetting
scheme. In this Chapter, we assess in more detail the reduction potential that can in practice be
targeted via a domestic offsetting scheme by looking at transaction costs, other barriers and issues
specific to some of the design options. We also assess the public costs involved in setting up a
domestic offsetting scheme in the Netherlands. We finish with a number of other relevant criteria to
take into account before concluding whether a domestic offset scheme could contribute in a
meaningful way to emission reductions in the non-ETS sector in the Netherlands and if so, which of
the design options identified is most likely to do so.
6.2 Real potential for domestic offsetting in the Netherlands is small
In Chapter 3, we identified a cost-effective, technical reduction potential of 4.6 MtCO2 in the non-ETS
sectors in the Netherlands that could potentially be targeted via a domestic offsetting scheme.
Although the CO2 price signal coming from a domestic offsetting scheme should provide an incentive
to make all of the options identified economically more attractive, the overall realistic potential that
can be tapped by domestic offsetting is much smaller than this estimate because:
1. Transaction costs for the project developer make some options less attractive.
2. Barriers and practical implementation issues prevent the options from being applied.
3. Restrictions related to the specific design options identified in the previous chapter.
1 Transaction costs
Transaction costs are defined as costs to project developers to participate in the market. This includes
feasibility studies, administrative documents, monitoring plans etc. High transaction costs restrict
overall abatement potential, as project developers will only undertake activities in which they will be
able to justify the expense of undertaking the project.
An important indicator of transactions costs is the project size: when a reduction measure typically
has small project sizes, (e.g. efficient heating behaviour of households) transactions costs are
relatively high and can become a substantial hurdle for private investors. When project sizes are large
(e.g. deep geothermal heat supply), transaction costs are relatively low.
42
Other factors that influence the transaction costs include the complexity of the project, the stringency
of the additionality requirement, and fees required by the regulatory body.
Explicit numbers on transaction costs are difficult to find in the literature. UNEP28 gave indicative
numbers for CDM project activities in their guidebook to financing CDM projects. We assume that the
transaction costs are applicable to Domestic Offsetting projects as well since similar procedures and
methodologies are expected to be used. From the given ranges we took the upper level into account
to compensate for changes and price increases since the date of publication. Typical prices for the
validation and the paperwork prior to the registration come to:
Approx. 200 k€ for large scale projects with required methodology;
Approx. 125 k€ for large scale projects with methodology already available;
Approx. 75 k€ for small scale projects29 with required methodology;
Approx. 35 k€ for small scale projects with methodology already available.
Further costs for periodical verifications are required which are in the range of 12 to 20 k€. In
addition to these inherent costs, internal costs that have not been invoiced as well as costs for
monitoring equipment and activities have to be covered. With these additional costs the total
transaction cost level can easily be twice the amount mentioned above or even more if projects have
a very high complexity. Along this line it can be concluded that a certain minimum size of an offset
project is required in terms of expected annual certificates to cover the transaction costs and to reach
at least a balanced cost benefit ratio for the participation in the project-based mechanism.
In the context of existing project based mechanisms (JI, CDM, Voluntary projects), the issue of
project size in relation to transaction costs has been an issue of concern. Two concepts, that of
bundling and programme of activities have been developed to transform small projects into larger
projects in order to reduce the relative transactions costs.
Bundling of emissions reduction projects groups individual small-scale projects together in a single
project document, rather than one for each project. A collective baseline is set, and projects are
registered and verified as if they were one project. All projects have to be included and detailed at the
start of the project process. No projects can be added at a later date. If one project fails it can cause
significant complications as it impacts the collective baseline.
A Programme of Activity also allows several small-scale projects to be grouped together using
streamlined documentation. In a PoA approach a developer submits a POADD, a design document
detailing the type of programme to be undertaken. Then individual documents are added for each
specific project of this nature within the programme. Verification is done on a sampling basis rather
than by each individual project. Projects can also be added to the programme at any time.
28 UNEP (2007): Guidebook to Financing CDM Projects. EcoSecurities. Available online at
http://www.cd4cdm.org/Publications/FinanceCDMprojectsGuidebook.pdf, checked on 4/04/2012. 29 Small scale is defined as a maximum output of 60 GWh/year for an energy efficiency improvement project, or an emission
reduction of less than or equal to 60 ktCO2e/year.

43
Both bundling approaches and PoA approaches exist in the CDM, JI, the Gold Standard and other
voluntary standards such as the VCS.
Considering the different design options presented in Chapter 4, the government buyer scheme could
be developed30 such that the approaches described above would also be eligible. The Article 24a
scheme is not yet defined, but it can be assumed that an approach developed under such a scheme
would be comparable to the CDM and JI procedures allowing for bundling and PoA type of approaches
as well. As a result, we conclude that all the design options proposed in Chapter 4 impose more or
less equal transaction costs to project developers.
2 Other barriers and practical implementation issues
It is striking that many of the options given in Table 6 (see Chapter 3) already have substantial
negative costs, but have not been implemented. This observation suggests that there are other
barriers that play a role here. Although the CO2 income from domestic offsetting systems makes all
these options even more economically attractive, it is at least questionable whether this incentive is
sufficient to overcome these apparent existing barriers. Typical barriers include issues such as the
lack of capital available, ownership issues such as the landlord/tenant issue and lack of knowledge
about the abatement options available to the entities that could implement the option. It is beyond
the scope of this study to assess these barriers in detail at the level of individual abatement options,
but we do recommend to assess more in detail whether a domestic offsetting scheme is likely to
overcome these barriers and if yes, whether domestic offsetting is the most appropriate policy option
to overcome these barriers, before deciding on the set-up of a domestic offsetting scheme in the
Netherlands.
The reduction potential that is available for a possible DO mechanism has also not yet been assessed
against barriers related to baseline setting and monitoring. For some measures in the transport and
built environment sector, these are well-known and significant obstacles. As well as being linked to
increased transaction costs (as described above), these practical barriers can make it near impossible
to see projects through to completion. These barriers make it, for example, highly unlikely that the
three transport options included so far (standards for trucks and vans and more efficient tyres) will be
realised via domestic offsetting, since the actual emission reductions achieved are influenced by many
factors related to individual driving behaviour. To our knowledge, there is also no existing baseline
and monitoring methodology that adequately deals with this issue (see also in the discussion on the
specific design options below). Another issue related to monitoring is that of consistency/compatibility
with the national emission monitoring methodology. Most emission reductions can only be monitored
bottom-up. If for the same emission source, a top-down methodology is used in the national emission
monitoring, the reductions might not be visible in the national monitoring methodology.
30 Take as an example the Danish scheme, wherein the government designs its own requirements. This can streamline processes
seen under existing standards, and reduce overall transaction costs. However, as any simplification of procedures must be
balanced with a need to ensure quality assurance of emissions reductions generated, overall savings on transaction costs are likely
to be limited.

44
AEAs would then be cancelled or sold for reductions that can not even be traced in the national
monitoring and this would thus involve the need to change the national monitoring methodology
which does come with costs.
Last but not least, the issue of additionality to existing and planned policies is not always easy to
determine taking into account the rather dense policy environment in the Netherlands with negotiated
agreements, green deals etc. For some of the options now in the list (e.g. the transport options),
further policy is foreseen at the European and national level, leaving the question of whether such
options should be open to a domestic offsetting scheme in the period just before implementation.
Given the typical crediting period of projects under a domestic offsetting scheme, this is an issue that
will continue to pop-up, adding to the complexity of the domestic offsetting scheme.
3. Restrictions related to the specific design options
In addition to the more general issues described above, each of the design options, as set out in
Chapter 4, has a different amount of flexibility in their design to allow access to the potential available
in the policy options described in the long list of potential in Chapter 3.
Under the Article 24a option, the EU ETS legislation stipulates that projects:
Should not lead to double counting of emission reductions;
Do not impede the undertaking of other policy measures;
Cannot be opted into the ETS via Article 24.
Although crediting via Article 24a will always be designed such that no real double counting will occur
(i.e. the total cap will not be changed), in our view it is unlikely that options that have a direct link to
EU ETS emissions will be allowed under Art. 24a. The following options have a clear interaction with
ETS emissions, and therefore are unlikely to be a possibility under this design option:
Waste heat use in households, assuming the waste heat will come from ETS installations;
Small scale CHP option, influencing the electricity production under the ETS;
The heat pump option, as above.
All of these options could thus also have an effect, albeit very small if only implemented in the
Netherlands, on the CO2 price in the ETS. This could increase in scale though if implemented EU-wide,
which is more likely with this design option. All considered, we regard it highly unlikely that these
options would be allowed under an Article 24a based design.
For the government buyer options, the scope of eligible measures could be structured to ensure
that identified cost effective potential can be accessed. Taking into account the barriers related to
monitoring the transport options explained above, this means that the government buyer scheme
could, in theory, encompass all the measures identified in Chapter 3 except the transport options.

45
A possible restriction may arise from European state aid rules, which may prevent the government
from targeting certain sectors or measures through a financial instrument like domestic offsetting.
This should be carefully assessed from a legal point of view.
In the voluntary market approach, the standards recognised by the Dutch government are the
CDM, the Gold Standard, or equivalent ones. However, the CDM cannot be used to develop projects in
Annex 1 countries. Therefore, all projects developed under the voluntary market approach would have
to be developed using the Gold Standard, generating Verified Emissions Reductions (VERs).
Within the Gold Standard, there are some restrictions on eligible project types. The Gold Standard
only allows projects to reduce carbon dioxide, methane or nitrous oxide. Furthermore, permitted
project types are restricted to three categories:
Renewable Energy Supply – defined as the generation and delivery of energy services (e.g.
mechanical work, electricity, heat) from non-fossil and non-depletable energy sources.
End-use Energy Efficiency Improvement - defined as the reduction in the amount of energy
required for delivering or producing non-energy physical goods or services. Project activities
must implement measures to reduce energy requirements as compared to the baseline
without affecting the level and quality of the services provided (service equivalence).
Waste Handling and Disposal - refers to all waste handling activities that deliver an energy
service (e.g. LFG with some of the recovered methane used for electricity generation) or a
usable product with sustainable development benefits (e.g. composting).
Of the abatement potential identified in Chapter 3, projects involving CO2 standards in the transport
sector are not eligible for the Gold Standard. It is useful to see what eligible methodologies already
exist that cover the remaining measures identified. The Gold Standard accepts all CDM methodologies
that fit its scope and has also approved some other Gold Standard-specific methodologies.

46
Table 6: Existing methodologies for available reduction options in NL under a voluntary market approach
Option (from Chapter 3) Existing methodology?
Efficient heating behaviour
households
Gold Standard:
Technologies and practices to displace decentralised thermal energy
consumption
Heat pumps in utility sector
CDM: ACM0012 Consolidated baseline methodology for GHG emission reductions from waste energy recovery projects;
AMS-III.Q.: Waste Energy Recovery (gas/heat/pressure) Projects
Manure digestion with co-substrate
cattle farms
CDM:
ACM0010 Consolidated baseline methodology for GHG emission
reductions from manure management systems
Small-scale CHP utility sector CDM:
AMS-I.C. Thermal energy production with or without electricity
Thermal insulation in existing
households
CDM: AMS-II.E. Energy efficiency and fuel switching measures for buildings; AMS-II.A. Supply side energy efficiency improvements –
transmission and distribution (for district heating systems)
Utilisation of waste heat in
households
CDM:
AMS-III.Q. waste energy recovery (gas/heat/pressure) projects;
AM0058 Introduction of a new primary district heating system
Reduced heat demand agriculture
CDM: AMS-II.F. Energy efficiency and fuel switching
measures for agricultural facilities and activities
Reduced heat demand non-ETS
CDM: AM0049 Methodology for gas based energy generation
in an industrial facility;
AMS-II.B.: Supply side energy efficiency improvements – generation
CDM methodologies in Table 6 that begin with ‗AMS-…‘ are small-scale methodologies and can only be
applied to projects that meet the following characteristics:
Renewable energy projects of less than 15 MW capacity;
Energy efficiency improvement projects of less than 15 GWh/year;
Other projects of less than 15 ktCO2e emissions.
Under the CDM, whose methodologies are accepted by the Gold Standard, there is no restriction
proscribing the development of methodologies to cover the remaining options. However, this would
entail some cost (to the entity that prepares and submits the proposed methodology to the CDM
Board), and the Executive Board has the right to reject methodologies that do not meet its
requirements. The transport sector in particular currently does not have many approved
methodologies, due to challenges in establishing acceptable monitoring practices.
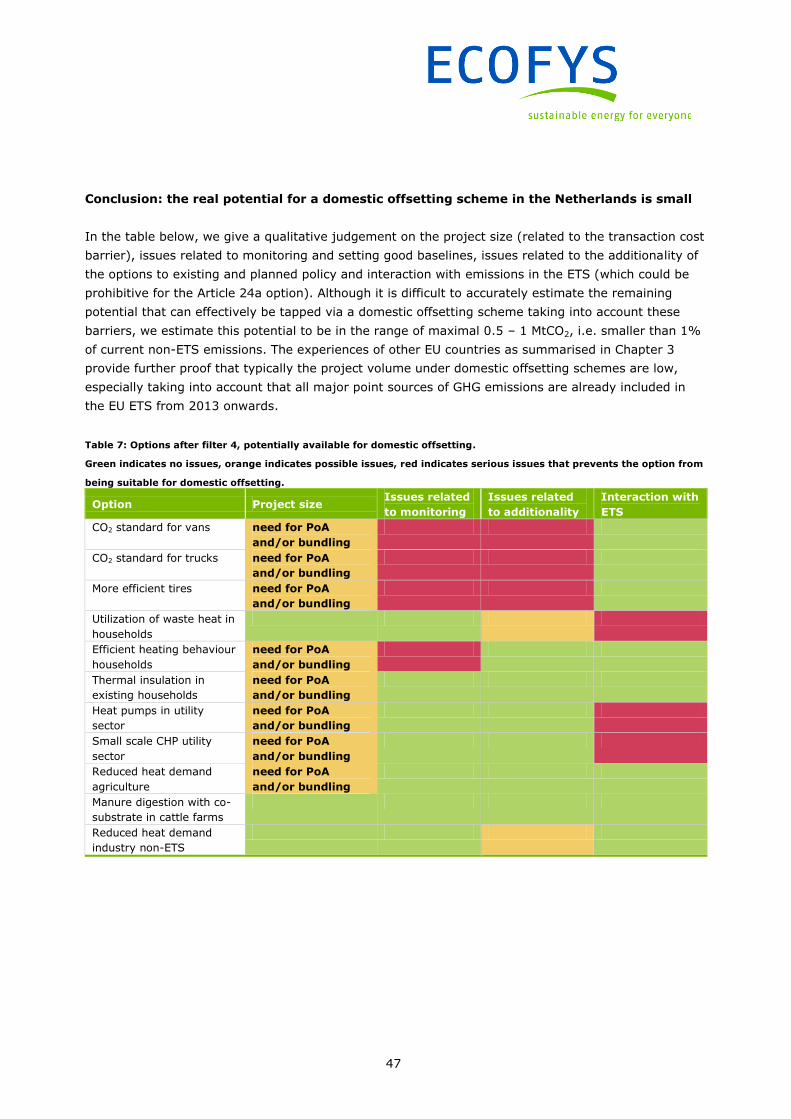
47
Conclusion: the real potential for a domestic offsetting scheme in the Netherlands is small
In the table below, we give a qualitative judgement on the project size (related to the transaction cost
barrier), issues related to monitoring and setting good baselines, issues related to the additionality of
the options to existing and planned policy and interaction with emissions in the ETS (which could be
prohibitive for the Article 24a option). Although it is difficult to accurately estimate the remaining
potential that can effectively be tapped via a domestic offsetting scheme taking into account these
barriers, we estimate this potential to be in the range of maximal 0.5 – 1 MtCO2, i.e. smaller than 1%
of current non-ETS emissions. The experiences of other EU countries as summarised in Chapter 3
provide further proof that typically the project volume under domestic offsetting schemes are low,
especially taking into account that all major point sources of GHG emissions are already included in
the EU ETS from 2013 onwards.
Table 7: Options after filter 4, potentially available for domestic offsetting.
Green indicates no issues, orange indicates possible issues, red indicates serious issues that prevents the option from
being suitable for domestic offsetting.
Option Project size Issues related
to monitoring
Issues related
to additionality
Interaction with
ETS
CO2 standard for vans need for PoA
and/or bundling
CO2 standard for trucks need for PoA
and/or bundling
More efficient tires need for PoA
and/or bundling
Utilization of waste heat in
households
Efficient heating behaviour
households
need for PoA
and/or bundling
Thermal insulation in
existing households
need for PoA
and/or bundling
Heat pumps in utility
sector
need for PoA
and/or bundling
Small scale CHP utility
sector
need for PoA
and/or bundling
Reduced heat demand
agriculture
need for PoA
and/or bundling
Manure digestion with co-
substrate in cattle farms
Reduced heat demand
industry non-ETS

48
6.3 Net costs for government vary by scheme
This section examines the expense of introducing a domestic scheme for the government. Costs to
government can be incurred through the purchase of credits, or through the cost of establishing and
maintaining a scheme. This analysis indicates how the different design options lead to different costs
for the government.
Purchase of credits – direct costs
In the Article 24a approach the government would not incur a net purchasing cost as it would not
buy the credits generated. The credits would instead be purchased for compliance in the EU ETS by
EU ETS participants.
Under the government buyer approach the cost of the purchase of the reductions generated is
offset through the sale of AEAs. In the variant where AEAs are sold ex ante, the amount of reductions
that the government can purchase is clearly defined and the government can tailor activity towards
this budget. However, under the variant of this option where domestic reductions are implemented
before AEAs are sold, then there is a risk that the government may not recoup all of the cost of
measures implemented if the value per credit awarded to project developers is not matched to the
price of AEAs.
In the voluntary market approach the government would not incur a net direct purchasing cost as
the credits would be sold to international voluntary market investors with only AEA cancellation for
the reductions realised.
The different design options result in trade of allowances or credits on three different carbon markets.
The government buyer approach results in the Netherlands selling the surplus AEAs to other
countries. In the voluntary market approach, the resulting credits are sold on the voluntary market
and in the Article 24a option, finally the credits enter the ETS market. Whereas the voluntary and ETS
markets are well established and good price predictions are available, this is not the case for the
trade in AEAs. This makes the development of a government buyer scheme at this moment in time
the most uncertain and risky in terms of estimated income or costs.
Administration costs
As well as purchasing costs the government also has to consider administration costs. Administration
costs could cover the cost of manpower (e.g. functionaries, lawyers and technical experts) to develop
the processes, procedures and framework of the scheme, as well as the cost of manpower and
resources to validate and market the scheme, record activity and performance, and issue credits.

49
Although development of Article 24a modalities will take place at the European level, thereby
removing these costs for the Dutch government, the government would still likely face responsibility
(and therefore cost) to oversee activity within its borders. This cost could be similar to that of
maintaining the Designated Focal Point for the Netherlands for CDM/JI projects, or similar to the costs
estimated for the voluntary market approach as described below.
However, it is possible that the Netherlands would be required to design and implement several
national procedures itself, which would increase costs. As an EU initiative, the burden to transfer the
legislative requirements into Dutch law are likely to be stringent, requiring more thorough
consideration and adding cost to the estimate for the voluntary approach. We can therefore estimate
the cost of this approach at somewhere between 1 and 4 times the cost of the voluntary market
approach depending on the variables mentioned above.
Under the government buyer approaches the government would face the largest net cost for the
development and administration of the scheme. This would include development, or at least selection,
of approved methodologies, requirements and procedures, as well as implementing the tender
approach and screening of proposed projects. This would require input from a much wider range of
experts and legislators, and could increase costs by up to 10 times the amount under the voluntary
market approach. The government could outsource validation and verification responsibilities, but
would also have to screen and accredit independent verifiers that could undertake this work.
However, this cost could be covered by requiring potential verifiers to pay an application fee as part
of the accreditation process.
Under the voluntary market approach the government would incur very little net administration
cost related to the introduction, development and regulation of the scheme, as this would be done by
the overseers of the approved voluntary standard(s), e.g. the Gold Standard or CDM. Potential costs
could include:
1-2 full-time staff to approve projects to take place within the Netherlands, record activity and
performance, and issue credits. This implies an estimated cost of € 150,000 per year.
Optional technical experts: to assess the additionality of certain project and the robustness of
individual methodologies. This implies an estimated additional cost of € 50,000 – 100,000.
Note that screening of individual methodologies could be perceived as a criticism of the
standards overall and therefore could be politically sensitive.
Project developers would pay independent entities to validate and verify projects, and assume all
other transaction costs.
An approximate comparison of costs to the government is provided below.

50
Table 8: Estimated range of administrative costs for government
Option Estimated range of administration costs
Government buyer € 1-1.5 million/yr
Voluntary market € 250,000 - 300,000/yr
Article 24a € 250,000 – 1 million/yr
The administration costs for the government could be lowered by requiring project developers to pay
a fee for each administered project. In the ideal situation that 1 MtCO2 emission reductions would be
realised per year, a € 0.25/tCO2 fee could compensate the governmental costs fully or to a very large
extent, while this would cost project developers only a fraction of the CO2 credit price they would
receive31. Nevertheless, if the market realizes a much smaller amount of reductions, the government
cannot compensate its administrative costs. This will certainly be the case in the first years of the
scheme.
Future costs
The government may also want to consider how implementing a domestic offset scheme may affect
costs to government in the future. Under the voluntary market approach, the easier to implement
options could be taken up by the private sector. Although this is desirable in the short term, in the
longer-term such an approach may leave the government to implement the remaining, most costly
and difficult to achieve, options.
6.4 Discussion of pros and cons
Domestic offsetting as a means to reach short and long term non-ETS commitments?
Introducing a domestic offsetting scheme in the Netherlands will not directly contribute to reaching
the Dutch non-ETS emission reduction targets in the short term, based on the assumption that the
Netherlands will trade or cancel an amount of AEAs that is equivalent to the reductions achieved. In
the government buyer option the AEA surplus is sold to other countries. In the other two options AEAs
need to be cancelled in order to create voluntary domestic credits, which are sold on the voluntary
market, or domestic credits or allowances that are either used for compliance in the ETS. In these two
options cancellation of AEAs is essential to avoid double counting of the emission reductions.
Opportunities to ensure a positive contribution to the Dutch non-ETS targets in the short term exist,
but are not discussed in this study.
31 A fee will increase transaction costs for project developers, eating up typically 1–5% of the direct financial benefits. To what
extent this would negatively impact the amount of cost-effective projects, needs further study.

51
Such options include setting stringent baselines or applying a discount factor to the reductions
generated so that the credits generated with the project (and thus not counting towards reaching the
target via the reasoning given above) are smaller than the actual emission reductions realised. Such
provisions could also be seen as a conservative safety valve, helping to ensure that only credits are
issued that are truly realised and additional to the baseline.
Even without such provisions however, and thus in the situation that during the crediting period the
projects do not contribute to reaching the non-ETS targets, at least some of the projects will
contribute to future commitments in the non-ETS sector by creating reductions well beyond the
crediting period. Typical crediting periods for project based mechanisms do not exceed ten years and
domestic offsetting could therefore definitely contribute to longer term (2030 and/or 2050)
commitments for the Netherlands. In this context, it is important to note that existing and intended
policies are not sufficient to reach the conditional pledge of 40% emission reduction in the
Netherlands in 2030 compared to 1990. However, before concluding that for this reason, domestic
offsetting is an attractive policy option to consider, domestic offsetting should at least be compared to
other possible policy instruments to tap the available non-ETS emission reductions potential, an
analysis beyond the scope of the present study. Such an analysis should ideally also shed further light
on the exact barriers that prevent some of the cost-effective options identified from being
implemented and the likelihood that domestic offsetting is likely to overcome these apparently non-
financial barriers in comparison to other possible instruments.
Domestic offsetting as a means to involve the private sector?
A domestic offsetting scheme could incentivise the involvement of the private sector in domestic
emission reductions (and potentially re-direct investments that are now made abroad), which could,
in turn, stimulate innovation, create jobs, create exportable skills and technologies. Innovation in its
turn could lead to an increase of emission reduction possibilities32.
Secondly, domestic offsetting could also function as a search mechanism to private sector players to
find niches of emission reductions that may have been overlooked so far.
Thirdly, it stimulates further engagement of the private sector in the wider climate change agenda.
Project examples in Germany show that companies are using domestic offsetting as a marketing
instrument: domestic reduction projects far below private profitability thresholds are accepted in
return of the claim that the company has locally invested in fighting climate change.
All this being true, it is clear from the analysis in this report that these advantages only relate to a
relatively small emission reduction potential. It remains questionable whether a domestic offsetting
scheme would trigger the private sector to such an extent that apparent barriers towards the
realisation of the various reduction options would be overcome, regardless of the exact design
characteristics of such a scheme. To shed further light on this issue, we would recommend to further
study these existing barriers in more detail, in connection with an overarching study that compares
the cost-effectiveness of different policy options with each other.
32 See also p.9 of ―Kosten en baten van CO2-emissiereductie maatregelen‖, ECN/SEO (2012). Available at:
http://www.ecn.nl/docs/library/report/2012/e12008.pdf.

52
Advantages and disadvantages of the three design options studied
To further understand the specific merits and drawbacks of domestic offsetting, it is important to
consider the various design options in more detail. A domestic offset scheme, developed domestically
as a government buyer approach is best suited to be designed in line with specific goals, e.g. to
target specific sectors or mitigation options. Targeting such specific sectors would be more difficult in
the Article 24a and voluntary market option, because the first is established at European level making
it at least uncertain whether a country can set certain priorities by only allowing certain project types.
For the voluntary market option, prioritizing certain sectors might be possible to some extent but only
within the limits of the requirements of the voluntary carbon standard used. Drawback of the
government buyer approach is however, that setting up such a scheme domestically comes with high
up-front costs, because all modalities and procedures need to be developed first (see previous
section). So, the freedom to tailor the scheme to specific needs comes with significant costs.
Another pitfall of the government buyer option is that it is dependent on the not yet existing AEA
trade. In this option the government is advised to finance the scheme by trading AEAs that are
superfluous thanks to (additional) emissions reductions generated by the scheme. However, most
Member States will most likely have sufficient Emission Units (EUAs, AEAs and possible other units
from flexible mechanisms) to cover their emission targets. This would imply that future demand for
AEAs is low while supply could be significant, causing AEA prices to decline. This will be further
elaborated in the EEA‘s trends and projection report 2012 on Greenhouse gas emissions in the EU
(publication: October 2012).
The voluntary market option has the advantage that the Netherlands can implement it more easily
and independently of other countries‘ considerations. Also, the voluntary market is relatively well-
established and stable (see Chapter 2)33. Furthermore it responds to the wish observed by some
stakeholders to offset emissions via the voluntary market with domestic rather than international
projects. Finally, and from a climate-perspective perhaps the most important advantage is that the
voluntary market design option accomplishes a global net mitigation effect. This is because voluntary
carbon offsets are not used in any capped compliance market (so in theory should not lead to an
increase of emissions) while the cancellation of AEAs, which is in our view essential for the credibility
of this design option, de facto decreases the overall emissions cap of the Netherlands. Despite these
advantages, it is important to realise that in the voluntary market option, a prerequisite is that the
type of projects allowed pass the test of additionality, according to the conditions set by the
government. The reason for this is that AEAs represent a financial value, and cancellation of AEAs is
therefore a delicate issue that can only be done if the government is convinced that real emissions
reductions have taken place, which become visible in the national GHG inventory. Another condition is
that up-front investment be discussed with the relevant voluntary standards, as well as the possibility
to have voluntary projects in capped countries under the subsequent cancellation of AEAs.
33 Although large scale application of voluntary projects in Annex I countries could influence the demand and supply balance on this
market, the exact demand for domestic projects in the voluntary market is something that needs more detailed research.

53
The Article 24a option also offers the certainty of an existing market, the ETS market. It provides
ETS installations with possibilities to comply with their ETS targets by reducing emissions in non-ETS
sectors, which might be more cost-effective than reducing emissions within the EU-ETS (depending on
the costs of the reduction options). Whether the price of EUAs will be influenced by domestic
offsetting projects depends on whether the current possibilities to comply with non-EUA allowances
(i.e. by using CDM/JI credits) are widened or not.
This option has the disadvantage that reduction measures that have a clear interaction with the EU-
ETS (e.g. heat pumps, small-scale CHPs) will most likely be excluded from the scheme, in order to
prevent market distortion.
This option also has the weakness that the framework needs to be established by the European
Commission which may take years (or may even never take place) and is a process with multiple EU
stakeholders of which NL is a relatively small one. This could be seen as an advantage, as some
administration costs would pass to the European Commission rather than the Dutch government, but
it also reduces the autonomy of the Dutch government to manage the scope and modalities of the
scheme. It also means that buyers within the EU might be more likely to purchase reductions from
projects in parts of Europe with cheaper non-ETS abatement options than those found in the
Netherlands. This offers the risk that the Netherlands has to carry administration costs, while
emission reductions take place elsewhere. Based on the relatively low potential available in the
Netherlands, it is questionable whether actively pursuing the Article 24a option in Europe is a logical
choice for the Netherlands at this moment.

54
7 Conclusion
The central research question in this study is whether domestic offsetting could be a cost-effective
policy instrument to achieve emission reductions in the non-ETS sectors in the Netherlands and if so,
which domestic offsetting design options are most likely to do so. We start from the principle that
only emission reductions which are additional to those that already take place under existing policies
for the non-ETS sector should be eligible for a domestic offsetting scheme. Also the reductions should
be realisable by private sector parties. Using these filters, we estimate the maximum emission
reduction potential that can be achieved with a domestic offsetting scheme in the Netherlands to be in
the range of 0.5 – 1.0 MtCO2. This estimate also takes into account barriers related to transactions
costs. Furthermore it takes into account the possibility and costs of establishing baselines and
monitoring methodologies on project level, essential to ensure that only real additional reductions are
credited under the scheme. Experiences in other countries confirm that the volume of reductions
achieved by domestic offsetting schemes is often limited, especially taking into account that most
significant point sources of emissions (e.g. N2O point sources) are already included in the EU ETS and
as such are not available for a future domestic offsetting scheme in the Netherlands. A more accurate
estimate of the reduction potential in the relevant sectors for a domestic offsetting scheme would
require a more detailed analysis of the existing financial and non-financial barriers that exist for the
reduction options identified in this study and the likelihood that the financial incentive of a domestic
offsetting scheme would overcome these barriers.
Tapping the potential via a domestic offsetting scheme will, based on the assumptions, not directly
contribute in the short term to reaching the non-ETS targets of the Netherlands in any of the design
options assessed in this study. This is because in all options the resulting credits are used for
compliance in the ETS market (Art. 24a option), are sold to other countries (government buyer
option) or are sold in the voluntary market (voluntary market option) under the cancellation of an
equivalent amount of assigned units to the Netherlands, which is essential to avoid double-counting of
the emission reductions. Opportunities to ensure a positive contribution to the Dutch non-ETS targets
in the short term exist, but are not discussed in this study.
Beyond the crediting period of the projects (typically no longer than 10 years), domestic offsetting
could however contribute to the long term (2030 or 2050) commitments of the Netherlands and could
incentivise innovation and the involvement of the private sector in domestic emission reductions.
Harvesting the limited reduction potential via domestic offsetting comes with significant up-front and
continuous administrative costs for the government to run the scheme. We estimate these costs to be
between € 250,000 and € 1,500,000 annually depending on the exact characteristics of the scheme
and depending on the level to which existing modalities and procedures from existing project based
mechanisms (CDM, JI, and voluntary market) are used. These costs are related to starting up and
managing the scheme and to ensuring that only additional projects take place under it with monitored
reductions that are reflected in national monitoring methodologies.

55
We did not compare domestic offsetting with other possible policy instruments to target emission
reductions in the non-ETS sectors in view of longer term commitments; we recommend this to be a
subject of further study.
Pros and cons of the three design options studied have been discussed extensively in Chapter 6.4.
From this analysis we conclude that the government buyer option is not recommended due to the
high up-front costs and the dependence on the not yet existing trade in AEAs.
From the two remaining options the voluntary market option has more advantages than the
Article 24a option. The administrative costs to the government are in the same order of magnitude for
both options. Although large scale application of voluntary projects in Annex I countries could
influence the demand and supply balance on this market, the exact demand for domestic projects in
the voluntary market is something that needs more detailed research.
In conclusion, the realistic emission reduction potential which could be tapped by domestic offsetting
in the Netherlands is smaller than 1% of current non-ETS emissions. Regardless of the design choice,
a domestic offsetting scheme does in principle not directly contribute to reaching the non-ETS targets
of the Netherlands in the short term. Whether it is a suitable policy instrument in the longer term
(2030 and beyond) is a question we recommend to be further studied in comparison with other policy
options and in relation to the barriers that prevent existing cost-effective reduction potentials from
being realised.
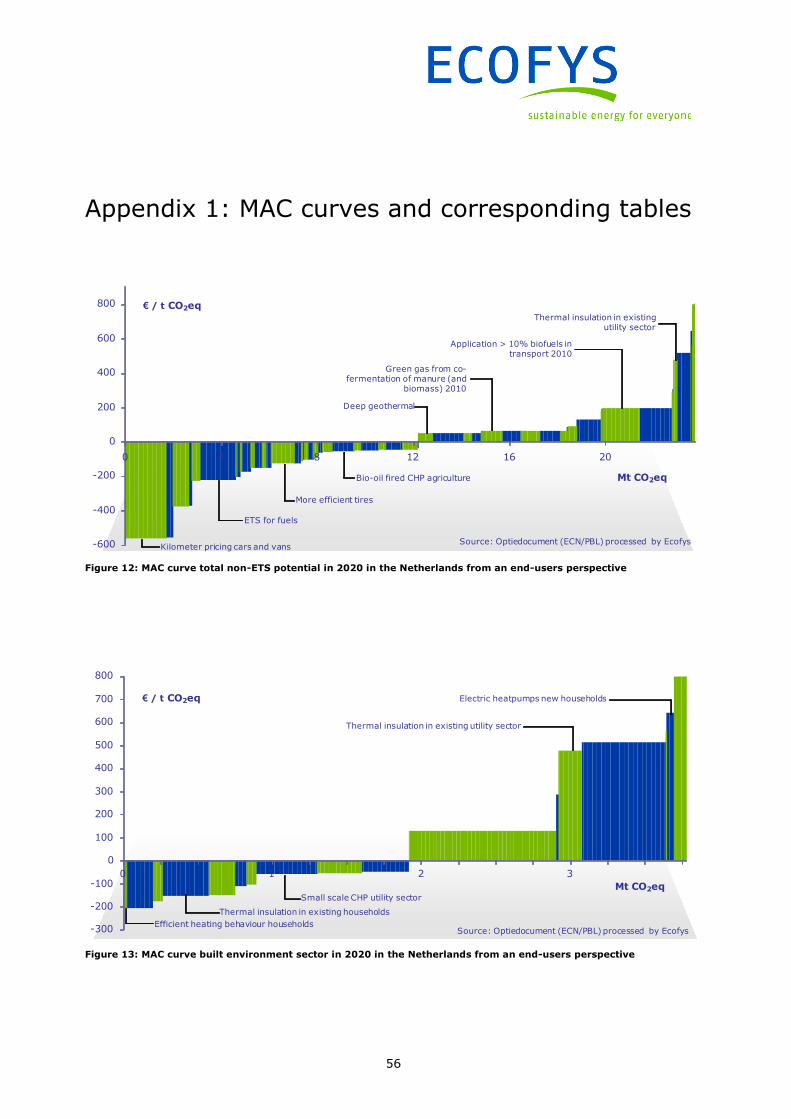
56
Appendix 1: MAC curves and corresponding tables
-600
-400
-200
0
200
400
600
800
0 4 8 12 16 20
Mt CO2eq
€ / t CO2eq
Kilometer pricing cars and vans
ETS for fuels
More efficient tires
Application > 10% biofuels in transport 2010
Bio-oil fired CHP agriculture
Source: Optiedocument (ECN/PBL) processed by Ecofys
Thermal insulation in existing utility sector
Green gas from co-fermentation of manure (and
biomass) 2010
Deep geothermal
Figure 12: MAC curve total non-ETS potential in 2020 in the Netherlands from an end-users perspective
-300
-200
-100
0
100
200
300
400
500
600
700
800
0 1 2 3
Mt CO2eq
€ / t CO2eq
Efficient heating behaviour households
Small scale CHP utility sector
Electric heatpumps new households
Thermal insulation in existing households
Thermal insulation in existing utility sector
Source: Optiedocument (ECN/PBL) processed by Ecofys
Figure 13: MAC curve built environment sector in 2020 in the Netherlands from an end-users perspective

57
-600
-500
-400
-300
-200
-100
0
100
200
300
400
0 1 2 3 4 5 6 7 8 9 10 11
Mt CO2eq
€ / t CO2eq
Lower speed limit highways
Kilometer pricing cars and vans
ETS for fuels
Application > 10% biofuels in transport
Source: Optiedocument (ECN/PBL) processed by Ecofys
More efficient tires
Figure 14: MAC curve transport sector in 2020 in the Netherlands from an end-users perspective
-150
-100
-50
0
50
100
150
200
0 1 2 3 4 5 6
Mt CO2eq
€ / t CO2eq
Bio-oil fired CHP
CO2 supply to glass-roofed horticulture
Manure digestion with co-substrate cattle
Adapting feed Rumen Fermentation
Deep geothermal
Source: Optiedocument (ECN/PBL) processed by Ecofys
Figure 15: MAC curve agri- and horticultural sector in 2020 in the Netherlands from an end-users perspective

58
-50
-25
0
25
50
75
100
125
150
0 1 2
Mt CO2eq
€ / t CO2eq
Green gas from co-fermentation of manure (and biomass)
Efficient heating industry non-ETS
Source: Optiedocument (ECN/PBL) processed by Ecofys
Figure 16: MAC curve “others” sector in 2020 in the Netherlands from an end-users perspective
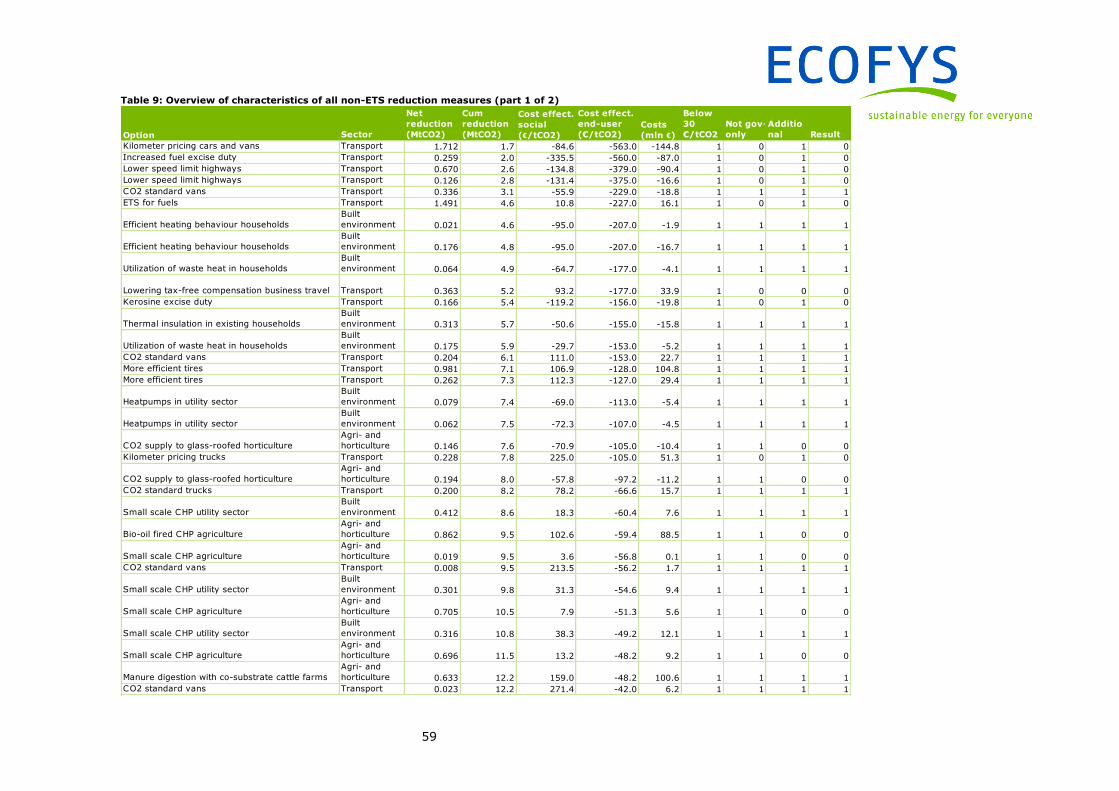
59
Table 9: Overview of characteristics of all non-ETS reduction measures (part 1 of 2)
Option Sector
Net
reduction
(MtCO2)
Cum
reduction
(MtCO2)
Cost effect.
social
(€/tCO2)
Cost effect.
end-user
(€/tCO2)Costs
(mln €)
Below
30
€/tCO2
Not gov-
only
Additio
nal Result
Kilometer pricing cars and vans Transport 1.712 1.7 -84.6 -563.0 -144.8 1 0 1 0
Increased fuel excise duty Transport 0.259 2.0 -335.5 -560.0 -87.0 1 0 1 0
Lower speed limit highways Transport 0.670 2.6 -134.8 -379.0 -90.4 1 0 1 0
Lower speed limit highways Transport 0.126 2.8 -131.4 -375.0 -16.6 1 0 1 0
CO2 standard vans Transport 0.336 3.1 -55.9 -229.0 -18.8 1 1 1 1
ETS for fuels Transport 1.491 4.6 10.8 -227.0 16.1 1 0 1 0
Efficient heating behaviour households
Built
environment 0.021 4.6 -95.0 -207.0 -1.9 1 1 1 1
Efficient heating behaviour households
Built
environment 0.176 4.8 -95.0 -207.0 -16.7 1 1 1 1
Utilization of waste heat in households
Built
environment 0.064 4.9 -64.7 -177.0 -4.1 1 1 1 1
Lowering tax-free compensation business travel Transport 0.363 5.2 93.2 -177.0 33.9 1 0 0 0
Kerosine excise duty Transport 0.166 5.4 -119.2 -156.0 -19.8 1 0 1 0
Thermal insulation in existing households
Built
environment 0.313 5.7 -50.6 -155.0 -15.8 1 1 1 1
Utilization of waste heat in households
Built
environment 0.175 5.9 -29.7 -153.0 -5.2 1 1 1 1
CO2 standard vans Transport 0.204 6.1 111.0 -153.0 22.7 1 1 1 1
More efficient tires Transport 0.981 7.1 106.9 -128.0 104.8 1 1 1 1
More efficient tires Transport 0.262 7.3 112.3 -127.0 29.4 1 1 1 1
Heatpumps in utility sector
Built
environment 0.079 7.4 -69.0 -113.0 -5.4 1 1 1 1
Heatpumps in utility sector
Built
environment 0.062 7.5 -72.3 -107.0 -4.5 1 1 1 1
CO2 supply to glass-roofed horticulture
Agri- and
horticulture 0.146 7.6 -70.9 -105.0 -10.4 1 1 0 0
Kilometer pricing trucks Transport 0.228 7.8 225.0 -105.0 51.3 1 0 1 0
CO2 supply to glass-roofed horticulture
Agri- and
horticulture 0.194 8.0 -57.8 -97.2 -11.2 1 1 0 0
CO2 standard trucks Transport 0.200 8.2 78.2 -66.6 15.7 1 1 1 1
Small scale CHP utility sector
Built
environment 0.412 8.6 18.3 -60.4 7.6 1 1 1 1
Bio-oil fired CHP agriculture
Agri- and
horticulture 0.862 9.5 102.6 -59.4 88.5 1 1 0 0
Small scale CHP agriculture
Agri- and
horticulture 0.019 9.5 3.6 -56.8 0.1 1 1 0 0
CO2 standard vans Transport 0.008 9.5 213.5 -56.2 1.7 1 1 1 1
Small scale CHP utility sector
Built
environment 0.301 9.8 31.3 -54.6 9.4 1 1 1 1
Small scale CHP agriculture
Agri- and
horticulture 0.705 10.5 7.9 -51.3 5.6 1 1 0 0
Small scale CHP utility sector
Built
environment 0.316 10.8 38.3 -49.2 12.1 1 1 1 1
Small scale CHP agriculture
Agri- and
horticulture 0.696 11.5 13.2 -48.2 9.2 1 1 0 0
Manure digestion with co-substrate cattle farms
Agri- and
horticulture 0.633 12.2 159.0 -48.2 100.6 1 1 1 1
CO2 standard vans Transport 0.023 12.2 271.4 -42.0 6.2 1 1 1 1

60
Table 10: Overview of characteristics of all non-ETS reduction measures (part 2 of 2)
Option Sector
Net
reduction
(MtCO2)
Cum
reduction
(MtCO2)
Cost effect.
social
(€/tCO2)
Cost effect.
end-user
(€/tCO2)Costs
(mln €)
Below
30
€/tCO2
Not gov-
only
Additio
nal Result
Reduced heat demand agriculture
Agri- and
horticulture 0.002 12.2 132.1 14.5 0.3 1 1 1 1
Reduced heat demand industry non-ETS Others 0.005 12.2 16.4 15.0 0.1 1 1 1 1
Deep geothermal
Agri- and
horticulture 0.614 12.8 46.1 46.1 28.3 0 1 1 0
Deep geothermal
Agri- and
horticulture 1.279 14.1 44.7 47.3 57.2 0 1 1 0
CO2 standard cars Transport 0.329 14.4 270.2 48.4 88.9 0 1 1 0
Less nitrogen fertilizers
Agri- and
horticulture 0.400 14.8 50.0 50.0 20.0 0 1 1 0
Reduced heat demand agriculture
Agri- and
horticulture 0.016 14.8 177.5 52.3 2.8 0 1 1 0
Efficient heating industry non-ETS Others 0.053 14.9 56.4 59.1 3.0 0 1 1 0
Green gas from co-fermentation of manure (and
biomass) Others 0.795 15.7 207.8 59.9 165.3 0 1 1 0
Green gas from co-fermentation of manure (and
biomass) Others 0.795 16.5 207.9 59.9 165.3 0 1 1 0
Green gas from co-fermentation of manure (and
biomass) Others 0.795 17.3 207.9 59.9 165.3 0 1 1 0
CO2 standard cars Transport 0.830 18.1 272.3 60.8 225.9 0 1 1 0
Change of cattle feed
Agri- and
horticulture 0.300 18.4 63.0 63.0 18.9 0 1 1 0
Reduced heat demand agriculture
Agri- and
horticulture 0.014 18.4 247.4 83.7 3.5 0 1 1 0
Change of cattle feed
Agri- and
horticulture 0.400 18.8 85.7 85.7 34.3 0 1 1 0
Thermal insulation in existing households
Built
environment 0.991 19.8 269.7 128.0 267.2 0 n/a n/a 0
Hybrid busses Transport 0.034 19.9 278.4 175.0 9.3 0 n/a n/a 0
Biomass-fired boilers
Agri- and
horticulture 0.042 19.9 116.1 188.0 4.9 0 n/a n/a 0
Application > 10% biofuels in transport Transport 1.536 21.4 168.2 195.0 258.3 0 n/a n/a 0
Application > 10% biofuels in transport Transport 1.359 22.8 168.2 195.0 228.6 0 n/a n/a 0
Heatpumps in utility buildings
Built
environment 0.018 22.8 188.4 285.0 3.4 0 n/a n/a 0
Hybrid busses Transport 0.049 22.9 457.5 304.0 22.4 0 n/a n/a 0
Thermal insulation in utility buildings
Built
environment 0.154 23.0 350.8 476.0 54.1 0 n/a n/a 0
Thermal insulation in utility buildings
Built
environment 0.565 23.6 383.5 513.0 216.8 0 n/a n/a 0
Heatpumps in utility buildings
Built
environment 0.006 23.6 617.0 561.0 3.8 0 n/a n/a 0
Heatpumps in new buildings
Built
environment 0.049 23.6 504.9 641.0 24.8 0 n/a n/a 0
Heatpumps in new buildings
Built
environment 0.086 23.7 632.1 796.0 54.0 0 n/a n/a 0
Additional SCR stationary gas engines,
Agri- and
horticulture 0.014 23.7 800.2 800.2 11.4 0 n/a n/a 0
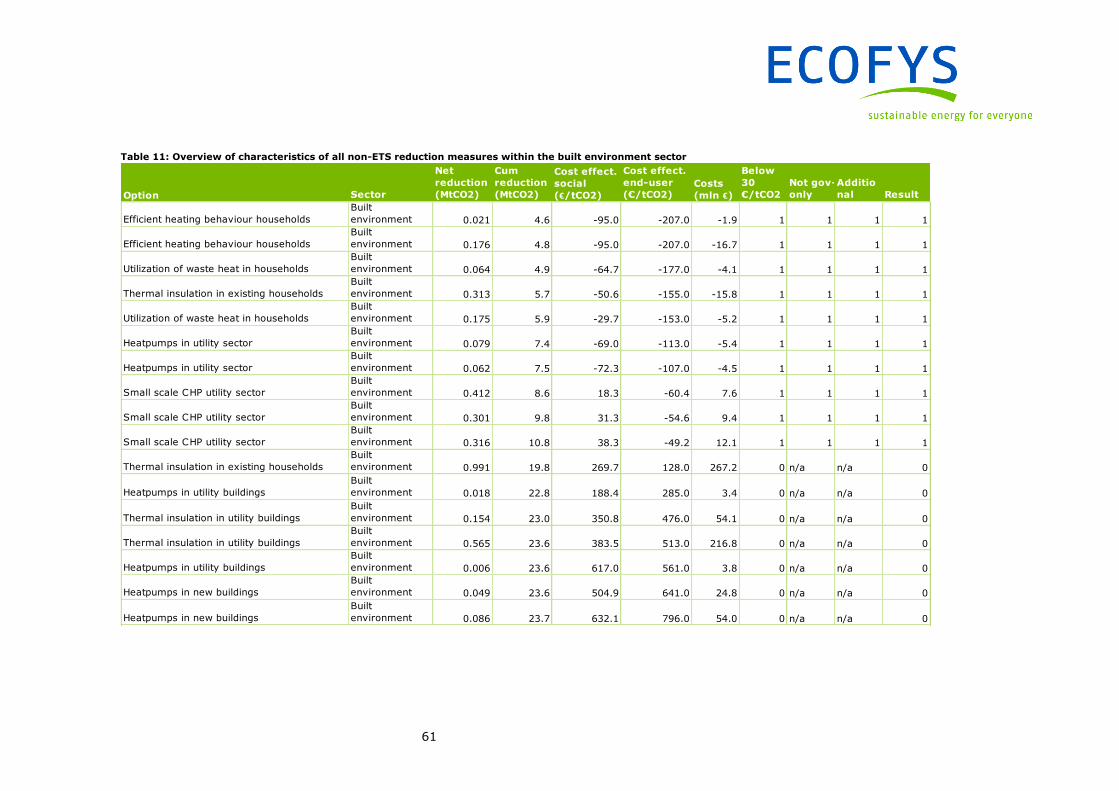
61
Table 11: Overview of characteristics of all non-ETS reduction measures within the built environment sector
Option Sector
Net
reduction
(MtCO2)
Cum
reduction
(MtCO2)
Cost effect.
social
(€/tCO2)
Cost effect.
end-user
(€/tCO2)Costs
(mln €)
Below
30
€/tCO2
Not gov-
only
Additio
nal Result
Efficient heating behaviour households
Built
environment 0.021 4.6 -95.0 -207.0 -1.9 1 1 1 1
Efficient heating behaviour households
Built
environment 0.176 4.8 -95.0 -207.0 -16.7 1 1 1 1
Utilization of waste heat in households
Built
environment 0.064 4.9 -64.7 -177.0 -4.1 1 1 1 1
Thermal insulation in existing households
Built
environment 0.313 5.7 -50.6 -155.0 -15.8 1 1 1 1
Utilization of waste heat in households
Built
environment 0.175 5.9 -29.7 -153.0 -5.2 1 1 1 1
Heatpumps in utility sector
Built
environment 0.079 7.4 -69.0 -113.0 -5.4 1 1 1 1
Heatpumps in utility sector
Built
environment 0.062 7.5 -72.3 -107.0 -4.5 1 1 1 1
Small scale CHP utility sector
Built
environment 0.412 8.6 18.3 -60.4 7.6 1 1 1 1
Small scale CHP utility sector
Built
environment 0.301 9.8 31.3 -54.6 9.4 1 1 1 1
Small scale CHP utility sector
Built
environment 0.316 10.8 38.3 -49.2 12.1 1 1 1 1
Thermal insulation in existing households
Built
environment 0.991 19.8 269.7 128.0 267.2 0 n/a n/a 0
Heatpumps in utility buildings
Built
environment 0.018 22.8 188.4 285.0 3.4 0 n/a n/a 0
Thermal insulation in utility buildings
Built
environment 0.154 23.0 350.8 476.0 54.1 0 n/a n/a 0
Thermal insulation in utility buildings
Built
environment 0.565 23.6 383.5 513.0 216.8 0 n/a n/a 0
Heatpumps in utility buildings
Built
environment 0.006 23.6 617.0 561.0 3.8 0 n/a n/a 0
Heatpumps in new buildings
Built
environment 0.049 23.6 504.9 641.0 24.8 0 n/a n/a 0
Heatpumps in new buildings
Built
environment 0.086 23.7 632.1 796.0 54.0 0 n/a n/a 0
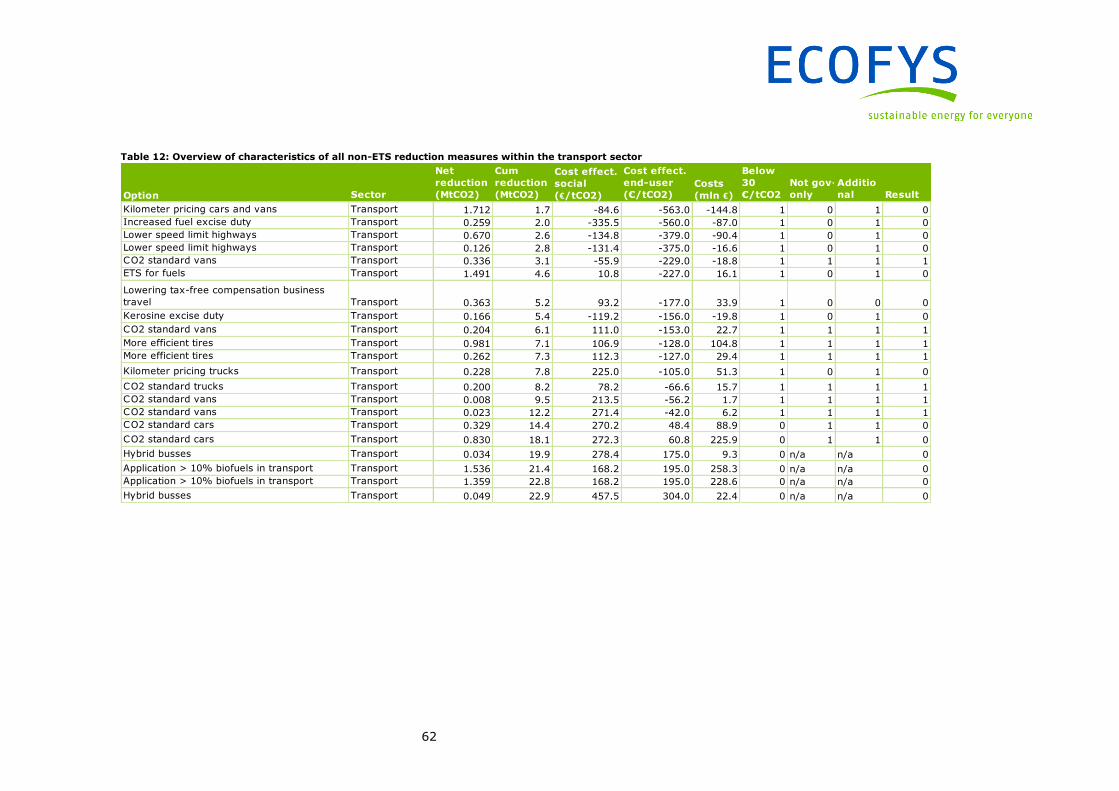
62
Table 12: Overview of characteristics of all non-ETS reduction measures within the transport sector
Option Sector
Net
reduction
(MtCO2)
Cum
reduction
(MtCO2)
Cost effect.
social
(€/tCO2)
Cost effect.
end-user
(€/tCO2)Costs
(mln €)
Below
30
€/tCO2
Not gov-
only
Additio
nal Result
Kilometer pricing cars and vans Transport 1.712 1.7 -84.6 -563.0 -144.8 1 0 1 0
Increased fuel excise duty Transport 0.259 2.0 -335.5 -560.0 -87.0 1 0 1 0
Lower speed limit highways Transport 0.670 2.6 -134.8 -379.0 -90.4 1 0 1 0
Lower speed limit highways Transport 0.126 2.8 -131.4 -375.0 -16.6 1 0 1 0
CO2 standard vans Transport 0.336 3.1 -55.9 -229.0 -18.8 1 1 1 1
ETS for fuels Transport 1.491 4.6 10.8 -227.0 16.1 1 0 1 0
Lowering tax-free compensation business
travel Transport 0.363 5.2 93.2 -177.0 33.9 1 0 0 0
Kerosine excise duty Transport 0.166 5.4 -119.2 -156.0 -19.8 1 0 1 0
CO2 standard vans Transport 0.204 6.1 111.0 -153.0 22.7 1 1 1 1
More efficient tires Transport 0.981 7.1 106.9 -128.0 104.8 1 1 1 1
More efficient tires Transport 0.262 7.3 112.3 -127.0 29.4 1 1 1 1
Kilometer pricing trucks Transport 0.228 7.8 225.0 -105.0 51.3 1 0 1 0
CO2 standard trucks Transport 0.200 8.2 78.2 -66.6 15.7 1 1 1 1
CO2 standard vans Transport 0.008 9.5 213.5 -56.2 1.7 1 1 1 1
CO2 standard vans Transport 0.023 12.2 271.4 -42.0 6.2 1 1 1 1
CO2 standard cars Transport 0.329 14.4 270.2 48.4 88.9 0 1 1 0
CO2 standard cars Transport 0.830 18.1 272.3 60.8 225.9 0 1 1 0
Hybrid busses Transport 0.034 19.9 278.4 175.0 9.3 0 n/a n/a 0
Application > 10% biofuels in transport Transport 1.536 21.4 168.2 195.0 258.3 0 n/a n/a 0
Application > 10% biofuels in transport Transport 1.359 22.8 168.2 195.0 228.6 0 n/a n/a 0
Hybrid busses Transport 0.049 22.9 457.5 304.0 22.4 0 n/a n/a 0

63
Table 13: Overview of characteristics of all non-ETS reduction measures within the agri- and horticultural sector
Option Sector
Net
reduction
(MtCO2)
Cum
reduction
(MtCO2)
Cost effect.
social
(€/tCO2)
Cost effect.
end-user
(€/tCO2)Costs
(mln €)
Below
30
€/tCO2
Not gov-
only
Additio
nal Result
CO2 supply to glass-roofed horticulture
Agri- and
horticulture 0.146 7.6 -70.9 -105.0 -10.4 1 1 0 0
CO2 supply to glass-roofed horticulture
Agri- and
horticulture 0.194 8.0 -57.8 -97.2 -11.2 1 1 0 0
Bio-oil fired CHP agriculture
Agri- and
horticulture 0.862 9.5 102.6 -59.4 88.5 1 1 0 0
Small scale CHP agriculture
Agri- and
horticulture 0.019 9.5 3.6 -56.8 0.1 1 1 0 0
Small scale CHP agriculture
Agri- and
horticulture 0.705 10.5 7.9 -51.3 5.6 1 1 0 0
Small scale CHP agriculture
Agri- and
horticulture 0.696 11.5 13.2 -48.2 9.2 1 1 0 0
Manure digestion with co-substrate cattle
farms
Agri- and
horticulture 0.633 12.2 159.0 -48.2 100.6 1 1 1 1
Reduced heat demand agriculture
Agri- and
horticulture 0.002 12.2 132.1 14.5 0.3 1 1 1 1
Deep geothermal
Agri- and
horticulture 0.614 12.8 46.1 46.1 28.3 0 1 1 0
Deep geothermal
Agri- and
horticulture 1.279 14.1 44.7 47.3 57.2 0 1 1 0
Less nitrogen fertilizers
Agri- and
horticulture 0.400 14.8 50.0 50.0 20.0 0 1 1 0
Reduced heat demand agriculture
Agri- and
horticulture 0.016 14.8 177.5 52.3 2.8 0 1 1 0
Change of cattle feed
Agri- and
horticulture 0.300 18.4 63.0 63.0 18.9 0 1 1 0
Reduced heat demand agriculture
Agri- and
horticulture 0.014 18.4 247.4 83.7 3.5 0 1 1 0
Change of cattle feed
Agri- and
horticulture 0.400 18.8 85.7 85.7 34.3 0 1 1 0
Biomass-fired boilers
Agri- and
horticulture 0.042 19.9 116.1 188.0 4.9 0 n/a n/a 0
Additional SCR stationary gas engines,
Agri- and
horticulture 0.014 23.7 800.2 800.2 11.4 0 n/a n/a 0

64
Table 14: Overview of characteristics of all non-ETS reduction measures within the “others” sector
Option Sector
Net
reduction
(MtCO2)
Cum
reduction
(MtCO2)
Cost effect.
social
(€/tCO2)
Cost effect.
end-user
(€/tCO2)Costs
(mln €)
Below
30
€/tCO2
Not gov-
only
Additio
nal Result
Reduced heat demand industry non-ETS Others 0.005 12.208 16.4 15 0.089 1 1 1 1
Efficient heating industry non-ETS Others 0.053 14.899 56.36 59.1 2.981 0 1 1 0
Green gas from co-fermentation of manure
(and biomass) Others 0.795 15.695 207.84 59.9 165.295 0 1 1 0
Green gas from co-fermentation of manure
(and biomass) Others 0.795 16.490 207.93 59.9 165.263 0 1 1 0
Green gas from co-fermentation of manure
(and biomass) Others 0.795 17.284 207.93 59.9 165.263 0 1 1 0

65
Appendix 2: Technical questions and answers
During a limited stakeholder consultation, the following technical questions have been raised by
stakeholders and answered by Ecofys (in Dutch).
Commentaren en reactieCommentaar Categorie Reactie Ecofys Voorgestelde actie
Het rapport wijst terecht op de beperking dat DO-projecten de Nederlandse
overheid niet dichter brengen bij het halen van het doel volgens de Effort
Sharing Decision (d.w.z. de emissiereductie van een DO project komt naar
voren in de NL emissieinventarisatie, maar dit gaat gepaard met overdracht
van corresponderende AEAs naar de lidstaat waar de DO-credits naar toe
gaan. Hierdoor komt NL per saldo niet dichter bij de Effort Sharing-
doelstelling). Het rapport wijst er echter ook op dat waar de credit-
overdracht slechts geldt voor de DO-projectduur, de emissiereductie van
DO-projectinvestering duurzaam is en na afloop van de credit-tijd van het
project volledig naar NL toevloeit. Dit had wel krachtiger mogen worden
aangezet.
Baten De lange termijn voordelen van DO staan in het rapport duidelijk benoemd, maar zijn niet
conclusie en samenvatting opgenomen.
We zullen nagaan hoe de (lange
termijn) voordelen van DO in
het rapport duidelijker naar
voren kunnen komen.
In het recente ECN/SEO-rapport "kosten en baten van CO2-
reductiemaatregelen" staat het onderstaande, [...] zou ook niet in het
Ecofys-rapport moeten worden opgenomen dat DO's bijdragen aan deze
vrijheidsgraden en de creativiteit/innovatie bevorderen? Het voordeel van
een marktgebaseerd systeem is immers dat de markt kansen ziet en
nieuwe oplossingen bedenkt
Baten Dit staat in het rapport. Zie p.50: "A domestic offsetting scheme could incentivise the
involvement of the private sector in domestic emission reductions (and potentially re-direct
investments that are now made abroad), which could, in turn, stimulate innovation, create
jobs, create exportable skills and technologies."
Referentie naar ECN / SEO
rapport opnemen in rapport.
Er is gezegd dat DO niet nodig is voor de NL 20% CO2-doelstelling. Dat is
een beperkte benadering. DO leidt wel tot lagere emissietrends,
energiebesparing en strengere doelen.
Baten De secundaire voordelen van DO op het gebied van innovatie etc worden in het rapport
benoemd (p50). DO kan weliswaar in NL leiden tot minder emissies, maar draagt in principe
niet bij aan de overheidsdoelstellingen op de korte termijn, omdat de overheid de
doelstellingen moet aanscherpen door AEAs in te leveren. In 2 van de 3 onderzochte DO-
opties leidt DO globaal ook niet tot minder uitstoot op korte termijn (reducties in NL mogen
elders tot meer emissies leiden). Wij onderschrijven dat op langere termijn (>10jr) DO een
bijdrage zou kunnen leveren aan lagere emissietrends, maar het is onduidelijk hoe groot
deze bijdrage zou zijn. Uit ons onderzoek blijkt wel dat de bijdrage tot 2020 relatief gering
is, gezien het lage potentieel.
DO kan ook tot energiebesparing leiden. Er zijn onvoldoende gegevens beschilkbaar om dit
neveneffect in het kader van dit onderzoek te kwantificeren.
Geen
Er is bij ETS-bedrijven juist groeiende interesse om NL CO2-credits te
kopen, i.p.v uit buitenland
Baten Wij zijn bekend met voorbeelden uit Duitsland en horen graag enkele voorbeelden in NL. Wij
zijn benieuwd of alleen ETS-bedrijven deze interesse hebben, of ook niet-ETS bedrijven.
Rapport indien mogelijk
aanvullen met voorbeelden van
Nederlandse vraag naar NL
rechten.
Wat ik mis is innovatie. De reden waarom je DO wilt is dat je met bestaand
beleid een deel van de emissiereductieopties moeilijk kunt bereiken en dat
je de markt het werk wilt laten doen (zie voorbeeld van Frankrijk: we doen
wat we kunnen en gebruiken DO voor moeilijke sectoren). Het rapport gaat
eigenlijk niet op die redenen in. Dit zou verder moeten worden ontwikkeld
en dito gedetailleerd en past heel goed in de ontwikkeling van een
financieringsstrategie om energie innovaties echt te stuwen.
Baten In het rapport gaan we uitgebreid in op dit punt, zie par. 6.4 (discussion of pros and cons). Geen
Er wordt aangegeven dat de overheidskosten per jaar 250.000 kunnen zijn:
is er ook gekeken om de certificaat-uitgifte budgetneutraal te doen
(projectpartijen bepalen dan leges)
Kosten Deze varianten zijn niet apart onderzocht. Door leges kunnen de kosten voor de overheid
omlaag maar nemen de transactiekosten voor marktpartijen toe, waardoor een deel van de
financiele prikkel van dit beleidsinstrument verdampt. Het is in het kader van dit onderzoek
niet te bepalen welke impact dit zal hebben op de behaalde reducties.
In rapport deze variant
benoemen met pro (minder
kosten) en con (minder
potentieel).
Transactiekosten en administratie-kosten kunnen lager zijn dan aangeven,
d.m.v. programma'e en bundeling en de administratie die als aanwezig is
bijv. via Energielabel en BREEAM
Kosten Transactiekosten kunnen inderdaad lager worden door programma's, dit staat in het rapport
(p41). Of de administratiekosten daardoor per saldo afnemen is nog maar de vraag.
Geen
Ook de ESCO-aanpak is een geschikte, kostenbesparende aanpak in de
bouwsector.
Kosten De ESCO methode is volgens ons nog niet toegepast in domestic offsetting projecten. Of de
ESCO-methodiek voor het bepalen van baseline en emissiereducties compatibel is met de
strenge voorwaarden die de Nederlandse overheid hieraan stelt, valt te betwijfelen en zou
nader onderzocht moeten worden. Het is daarnaast de vraag of ESCO's het uitgangspunt van
additionaliteit geweld aandoen (vanwege financiele die ESCO's bieden). Kortom, of dit een
geschikte aanpak is is zeer de vraag.
Geen
Klopt het dat slechts één bron is gebruikt: het PBL-optiedocument? Methodiek Ja. Het is van belang dat de reductiepotentielen op nationaal niveau en op consistente wijze
zijn berekend. Het ECN / PBL optiedocument is de enige bron die dit doet.
Geen
Er is nu top-down gekeken naar bekende opties, die zijn afgepeld tot het
uiteindelijk potentieel. Is er daarnaast ook bottom-up geinventariseerd of
er andere opties denkbaar zijn? Is er bijvoorbeeld gesproken met spelers
in kansrijke sectoren?
Methodiek Mochten er andere opties denkbaar zijn, dan is het van belang dat deze met dezelfde
aannames (energiescenarios, referentieperiode, etc) worden meegenomen als de
potentielen uit het Optiedocument. Deze werkzaamheden (inventarisatie, berekeningen)
lagen buiten het bereik van deze studie.
Geen
De grens van 30 Euro per ton is niet essentieel: CO2 waarde creatie is een
onderdeel van de hele financiering, maar wel een waardevolle externe
kasstroom.
Methodiek Wij hebben in het onderzoek gekeken naar de opties boven de 30 eur / ton, om de hiernaast
genoemde reden. Wat opvalt is dat tussen de 30 en 45 E / ton geen extra besparingsopties
beschikbaar zijn. Vanaf deze grens zit je met opties die ruim 4 keer de huidige CO2 prijs
kosten en dus voor 75 % onredabel zijn (vanuit CO2 oogpunt).
Geen
Het rapport is beperkend door uit te gaan van een geschatte toekomstige
CO2 marktprijs van 30 euro en te veronderstellen dat alleen die projecten
interessant zijn die volgens ECN's marginale kostencurves per ton CO2-
reductie goedkoper zijn dan 30 euro. In eerdere studies (Energy Valley en
VROM) toonden we echter berekeningen van projecten waarbij de CO2-
reductiewaarde weliswaar niet de gehele, maar wel een groot deel van de
onrendabele top van projecten afdekten. Wat je nog te kort kwam voor een
rendabel project kon dan worden aangevuld met bestaande
stimuleringsmaatregelen. Hierdoor had je minder druk op bestaande potjes
en/of kon je bestaande potjes breder inzetten. Die mogelijke combinatie
van politieke instrumenten wordt door het rapport niet belicht. Met andere
woorden: hoe ziet het plaatje eruit bij duurdere opties waarbij je de CO2-
markt eerst de onrendabele top laat opeten, aangevuld waar nodig door
bestaande maatregelen. Dit aspect moet zeker verder worden onderzocht
en gedetailleerd. We zien hier nadrukkelijke kansen.
Methodiek Wij hebben in het onderzoek gekeken naar de opties boven de 30 eur / ton, om de hiernaast
genoemde reden. Wat opvalt is dat tussen de 30 en 45 E / ton geen extra besparingsopties
beschikbaar zijn. Vanaf de 45 E / ton grens zit je met opties die ruim vier keer de huidige
CO2 prijs kosten en dus slechts voor 75 % onredabel zijn (vanuit CO2 oogpunt).
Bij combinatie met andere beleidsinstrumenten komt het additionaliteitsbeginsel mogelijk in
het geding.
Geen

66
Commentaren en reactieCommentaar Categorie Reactie Ecofys Voorgestelde actie
Waarom komt het potentieel voor 'reduced heat demand industry non-ETS'
(p.28) zo extreem laag uit? zit daar niet meer potentieel in dan 10.000 ton?
Potentieel Het totale potentieel van deze maatregel is groter, maar valt duurder uit dan 30 EUR / tCO2
en is daarom niet meegenomen. Zie de overzichtstabel met besparingsopties in de bijlage
van het rapport.
Geen
Wordt MJA3 gezien als beleid dat 'niet doorkruist' mag worden? Potentieel Met MJA3 (voor zover bekend in oktober 2009) is rekening gehouden in de berekening van
de reductiepotentiëlen door ECN / PBL. MJA3 wordt (mede) gebruikt om te voldoen aan de
verplichting voor bedrijven om energiebesparingsmaatregelen met een terugverdientijd van
5 jaar of minder (rendabele maatregelen) te nemen. In de raming gaat PBL/ECN ervan uit
dat de MJA3 ertoe bijdraagt dat rendabele maatregelen eerder worden genomen en daaraan
is effect aan de energie-efficiëntieverbetering toegekend.
In ieder DO systeem als in het rapport beschreven is het, gezien de wettelijke verplichting
tot het treffen van rendabele maatregelen, onaannemelijk dat rendabele maatregelen (de
maatregelen die in MJA3 worden getroffen zijn grotendeels rendabele maatregelen)
additioneel zijn.
Ecofys heeft dit punt nader
onderzocht met als uitkomst het
hiernaast geschrevene.
p.26: kan toegelicht worden hoe de verhouding ETS/non-ETS is in de 2,9
Mton die buiten beschouwing werd gelaten?
Potentieel Er zijn drie opties weggefilterd: bio-olie WKK (1.2 Mton) wordt al gauw toegepast in grotere
installaties die onder het ETS vallen. Biowarmte uit industriele reststromen (0,4 Mton) is
naar inschatting voor 2/3 relevant voor ETS, 1/3 niet-ETS. Biomassa ketels voor industrie
(1,3 Mton) kan in beide voorkomen. Over deze laatste optie valt te twisten, maar zeker is
dat hij in het volgende filter over kosteneffectiviteit alsnog weg zou vallen.
Geen
Builddesk komt tot een jaarlijkse CO2-reductie via ESCOs van 1 Mton in
kantoren, winkels en bedrijfspanden: is dat meegenomen?
Potentieel Vermoedelijk neemt BuildDesk ook de indirecte emissiereducties mee ten gevolge van
zuiniger verlichting; deze zijn in dit rapport niet meegenomen ivm het voorkomen van
dubbeltelling met het ETS. Het kosteneffectieve besparingspotentieel in de utiliteitsbouw
wordt door ECN / PBL op 1.2 MtCO2 geschat. Dat lijkt in dezelfde orde van grootte uit te
komen als BuildDesk.
Geen
Gebruik restwarmte uit ETS, kan wel meegenomen worden bij nieuwbouw;
dat voorkomt nieuwe ETS-emissie, bij vervangen gas voor warmte
Potentieel Het gebruik van industriele restwarmte in huishoudens is meegenomen in de opties van ECN
/ PBL.
Geen
Gebruik restwarmte uit niet ETS bij voorkomen warmte door gas bij
bestaande bouw kan wel meegenomen worden
Potentieel Het gebruik van industriele restwarmte in huishoudens is meegenomen in de opties van ECN
/ PBL.
Geen
Gebruik van externe koeling (water) bij nieuwbouw kan meegenomen
worden
Potentieel Het gebruik van externe (duurzame) koeling verlaagt het elektriciteitsgebruik, wat niet voor
DO in aanmerking kan komen (vanwege directe interactie met het ETS).
Geen
Gebruik van eigen small scale WKK, bio-WKK en energie-neutrale
nieuwbouw kan wel meegenomen worden
Potentieel WKK is een lastige optie vanwege de interactie met het ETS (via de elektriciteit). De
genoemde WKK opties zijn waarschijnlijk niet meegenomen vanwege de relatief hoge
kosten.
Geen
Bij koppeling van warmte of stroom uit mestvergisting kan de
methaanreductie worden meegenomen; die valt niet onder DE-subsidie
Potentieel Uit informatie van het ECN blijkt dat de vermeden methaanemissies meegenomen zijn in het
optiedocument.
Geen
We zien zien dat de emissiereductie van de bouw (materialen e.d.) niet zijn
meegenomen
Potentieel Wij hebben niet scherp wat hier precies bedoelt wordt. Geen
We zien ook kansen bij NL netto CO2-reductie als duurzame nieuwbouw
gecombineerd wordt met sloop van bestaande 'inefficiente' bouw: ook dat
zou een CO2-project via DO kunnen zijn
Potentieel Deze optie zal duurder zijn dan het simpelweg neerzetten van duurzame nieuwbouw ivm de
sloopkosten. Vermoedelijk staat deze optie daarom niet op de lijst. Daarnaast lijkt er bij dit
idee overlap te zijn met andere maatregelen op de lijst (zoals Thermal insulation in existing
households).
Geen
Begreep ik het goed dat groen gas niet als optie is opgenomen in de studie?
Waarschijnlijk duurder dan euro 30/ton. Kan dit worden verduidelijkt?
Potentieel Deze optie zit rond de 60 Eur / ton. De optie staat in de groslijst, zie tabel 10 in appendix
van het rapport.
Geen

67
Glossary
Allocated Amount Units (AAUs) - A tradable unit corresponding to one tonne of carbon dioxide
equivalent (1t CO2e). Countries with quantified emission-reduction targets under the Kyoto Protocol
are allocated a number of these units that correspond to the cap on emissions required to meet that
target.
Annual Emissions Allocation (AEAs) - A tradable unit corresponding to one tonne of carbon
dioxide equivalent of an EU country‘s cap on non-ETS emissions under the Effort Sharing Decision
(ESD).
Bundling - Another possible approach designed to streamline administration efforts and reduce
transaction costs. In this approach a number of projects are also grouped together under one
umbrella, but new projects cannot be added later. All projects must be included in the project
documentation at the time of approval. All projects in a bundle can be described in a single project
document and go through validation and registration as if it were one project.
Certified Emissions Reductions (CERs)- A CER is a unit issued under the CDM that is equal to one
tonne of carbon dioxide equivalent, calculated using global warming potentials defined by the Kyoto
Protocol.
Clean Development Mechanism - The CDM is an arrangement under the Kyoto Protocol that allows
industrialised countries with a greenhouse gas reduction commitment (called Annex 1 countries) to
invest in projects that reduce emissions in developing countries as an alternative to more expensive
emissions reductions in their own countries.
Emissions Reductions Units (ERUs) - This is the basic unit of Joint Implementation (JI) projects.
One ERU represents the successful emission-reduction equivalent to one tonne of carbon dioxide
equivalent (1t CO2e).
Emissions Trading Schemes (ETSs) - A flexible mechanism created by the Kyoto accords which is
intended to allow the exchange of emission rights between countries or companies to achieve their
objectives in reducing emissions of greenhouse gases.
European Allowance (EUAs) - Tradable emission credits from the EU Emissions Trading Scheme
(EU ETS). Each allowance carries the right to emit one tonne of carbon dioxide.
Joint Implementation - A programme under the Kyoto Protocol that allows industrialised countries
to meet part of their required cuts in greenhouse gas emissions by paying for projects that reduce
emissions in other industrialised countries.
Programme of Activities (POA) – An approach developed for use in the CDM and JI mechanisms to
streamline bureaucratic requirements and reduce costs. Under POA, many emissions reduction
projects owned by many different owners can be grouped together so that rather than monitor and
verify emissions reductions from all projects a sampling approach can be taken. Projects can be
added to the PoA at a later date, providing greater flexibility than a project-specific approach.

68
United Nations Framework Convention on Climate Change (UNFCCC) – the UNFCCC is an
international treaty signed by 189 countries. The treaty, to which the USA is party, considers what
can be done to reduce global warming and to cope with the inevitable increases in temperature.
Verified Emissions Reduction (VER) – A unit generated by a non-compliance emissions reduction
standard, such as the Voluntary Carbon Standard, or voluntary Gold Standard.

ECOFYS Netherlands B.V. | Kanaalweg 15G | 3526 KL Utrecht| T +31 (0)30 662-3300 | F +31 (0)30 662-3301 | E [email protected] | I www.ecofys.com

ECOFYS Netherlands B.V.
Kanaalweg 15G
3526 KL Utrecht
T: +31 (0) 30 662-3300
F: +31 (0) 30 662-3301
I: www.ecofys.com