Costing National Agriculture Investment Plans (NAIPs)
25
Costing National Agriculture Investment Plans (NAIPs) Introduction and Guide to the NAIP Costing Template for National Technical Commissions Capacity Development Project for Investment and Policy - CDPIP
Transcript of Costing National Agriculture Investment Plans (NAIPs)
Costing National Agriculture Investment Plans (NAIPs)
Introduction and Guide to the NAIP Costing Template
for National Technical Commissions
Capacity Development Project for Investment and Policy - CDPIP

Learning Objectives: • illustrate the key principles and methodology for costing NAIPs • use the suggested Costing Template to cost NAIPs
Plan of the presentation: • Key principles in NAIP costing • NAIP structure and results chain • Costing methodology • Introduction to the NAIP costing template • Step-by-step guidance on using NAIP Costing Template
Costing National Agriculture Investment Plans
Plan of the presentation and Learning Objectives

Overview – Key principles for costing NAIP
Costing of NAIPs implies identifying and calculating the overall budget needs for the Country’s agricultural sector for the period covered by NAIP life-time (usually 5 years).
Costing National Agriculture Investment Plans
The following pre-requisites apply for accurate costing of NAIPs: • Common understanding of the role of NAIP as the overall strategic Plan for the sector; • Clear definition of the structure of the NAIP and of its ‘boundaries’ (e.g. specification of sectoral expenses falling under the NAIP) • Shared understanding of the methodology for costing NAIPs
It is referred to as ‘strategic-level’ costing, to differentiate it from the project-level costing that takes place during preparation of projects and programmes.
NAIP costing is a key stage of the NAIP preparation process and usually takes place in parallel with the development of the NAIP’s Results Framework.
NAIP
Overview – Why accurate and realistic costing is critical
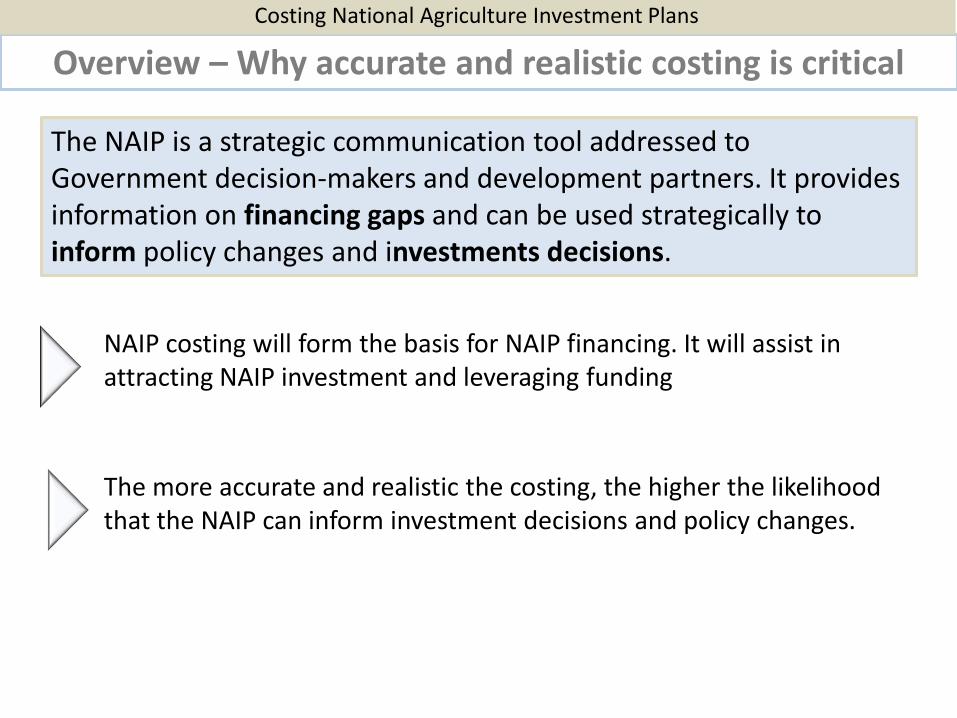
The NAIP is a strategic communication tool addressed to Government decision-makers and development partners. It provides information on financing gaps and can be used strategically to inform policy changes and investments decisions.
Costing National Agriculture Investment Plans
The more accurate and realistic the costing, the higher the likelihood that the NAIP can inform investment decisions and policy changes.
NAIP costing will form the basis for NAIP financing. It will assist in attracting NAIP investment and leveraging funding
Joint understanding on role and structure of NAIP
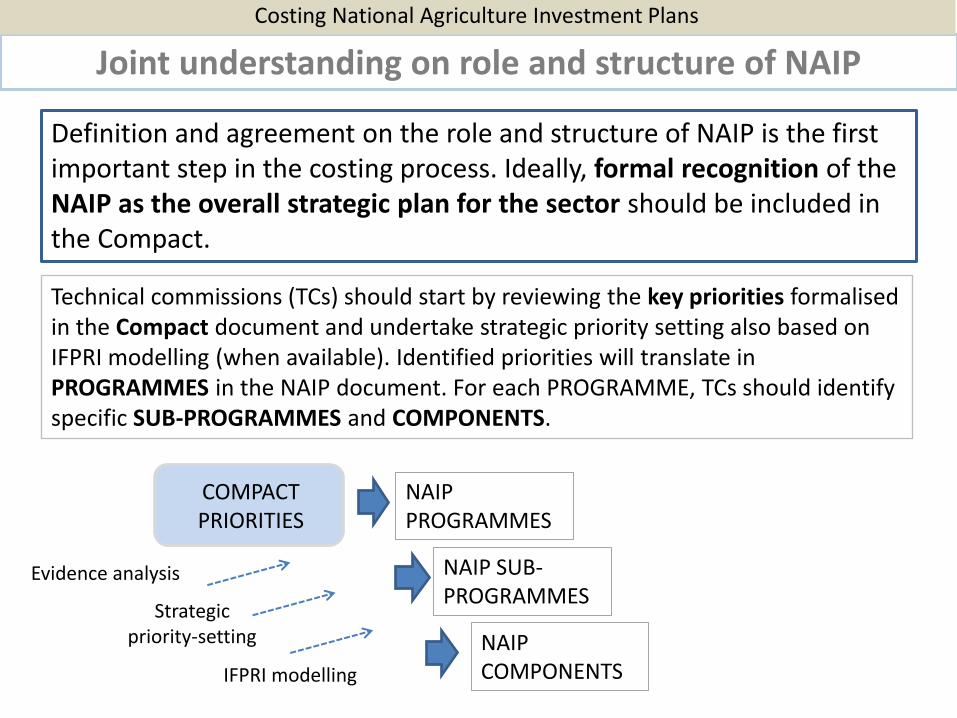
Definition and agreement on the role and structure of NAIP is the first important step in the costing process. Ideally, formal recognition of the NAIP as the overall strategic plan for the sector should be included in the Compact.
Technical commissions (TCs) should start by reviewing the key priorities formalised in the Compact document and undertake strategic priority setting also based on IFPRI modelling (when available). Identified priorities will translate in PROGRAMMES in the NAIP document. For each PROGRAMME, TCs should identify specific SUB-PROGRAMMES and COMPONENTS.
Costing National Agriculture Investment Plans
COMPACT PRIORITIES
NAIP PROGRAMMES
NAIP SUB- PROGRAMMES
NAIP COMPONENTS
Strategic priority-setting
IFPRI modelling
Evidence analysis
NAIP 1. PROGRAMME
1.1 Sub-programme 1.1.1 component
1.1.2 component
2. PROGRAMME
2.1 Sub-programme
1.1.1 component
1.1.2 component
3. PROGRAMME
3.1 Sub-programme
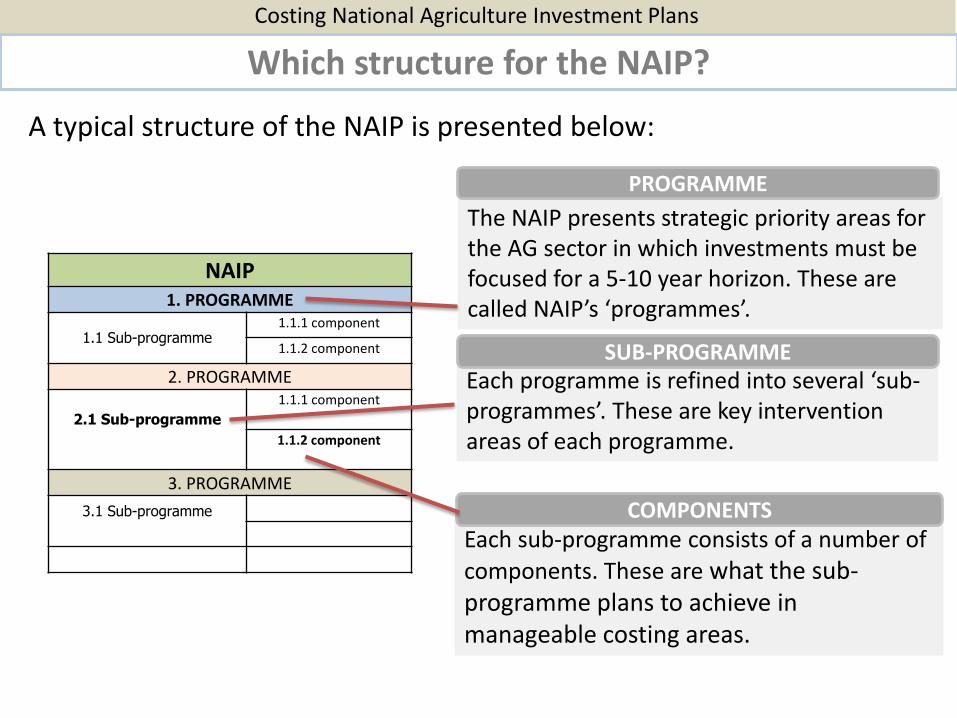
Each programme is refined into several ‘sub-programmes’. These are key intervention areas of each programme.
Each sub-programme consists of a number of
components. These are what the sub-programme plans to achieve in manageable costing areas.
The NAIP presents strategic priority areas for the AG sector in which investments must be focused for a 5-10 year horizon. These are called NAIP’s ‘programmes’.
PROGRAMME
SUB-PROGRAMME
COMPONENTS
Costing National Agriculture Investment Plans
Which structure for the NAIP?
A typical structure of the NAIP is presented below:

NAIP’s Result-Chain Logic
NAIP structure is reflected in the Costs Table according to a Results Chain logic which adopts the impact, outcome, output terminology. According to the Results Based Management (RBM) approach, expected results for each strategic programme area of the NAIP must be clearly defined.
Costing National Agriculture Investment Plans
NAIP PROGRAMMES
NAIP SUB- PROGRAMMES
NAIP COMPONENTS
Outcomes
Outputs Tangible products that programme/projects might deliver (e.g. irrigation facilities constructed, rural roads rehabilitated, land prepared, etc.)
Medium/long term changes in the development context of the country (e.g. increased agriculture production; improved access to markets, etc.)
NAIP Impacts
Long term changes in the development context of the country (e.g. Economic and social conditions of people, increased food security)
Intermediate Outcomes
ACTIVITIES

NAIP’s Result-Chain Logic
Costing National Agriculture Investment Plans
NAIP’s Result Chain logic can be organized as follows:
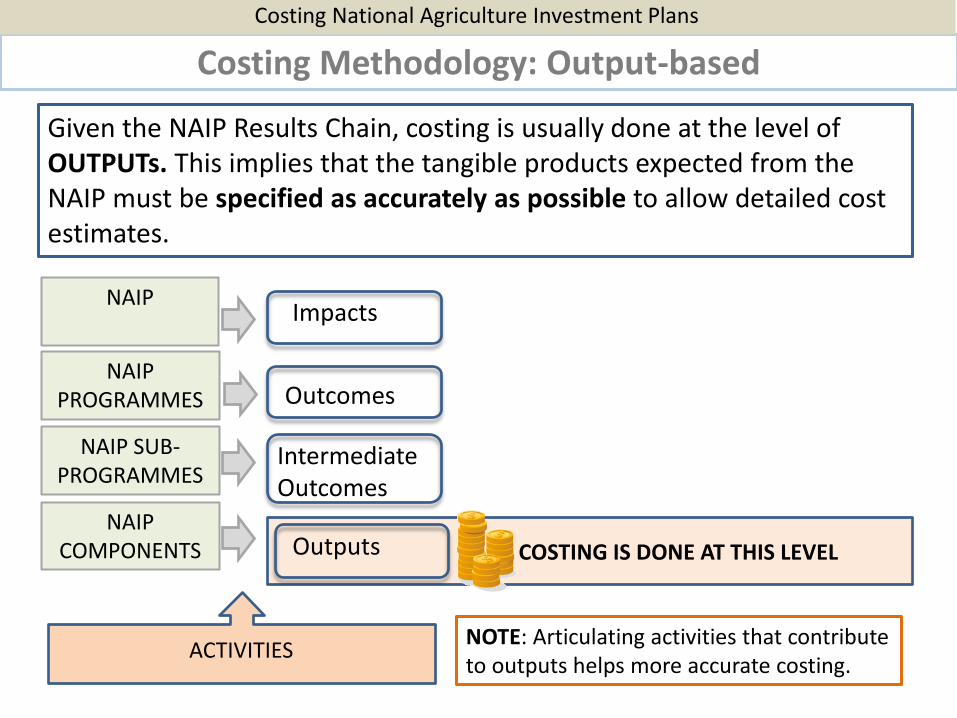
Costing Methodology: Output-based
Given the NAIP Results Chain, costing is usually done at the level of OUTPUTs. This implies that the tangible products expected from the NAIP must be specified as accurately as possible to allow detailed cost estimates.
Costing National Agriculture Investment Plans
NAIP PROGRAMMES
NAIP SUB- PROGRAMMES
NAIP COMPONENTS
Outcomes
Outputs
NAIP
Impacts
Intermediate Outcomes
COSTING IS DONE AT THIS LEVEL
ACTIVITIES NOTE: Articulating activities that contribute to outputs helps more accurate costing.

Costing Methodology: Contingencies
Costing National Agriculture Investment Plans
Contingency allowances reflect physical and price changes that can be expected to increase base costs. These may include:
• Changes in quantities
• Differences in implementation
Price contingencies • Inflation: local and foreign
• Exchange rate fluctuations
Physical contingencies
The calculation of contingencies might be required at NAIP level and will be updated and taken into account during the subsequent formulation of projects and programmes.

Costing National Agriculture Investment Plans
Introduction to the NAIP’s Costing Template
A Costing Template is introduced to help National Technical Commissions cost their NAIPs with a coherent and systematic approach.
The template (in Excel) consists of the following five Worksheets: Worksheet 1 – Definition of NAIP structure Worksheet 2 - Indicators, targets and beneficiaries Worksheet 3 – Detailed costing Worksheet 4 – Existing funds Worksheet 5 - Gap calculation
Costing National Agriculture Investment Plans
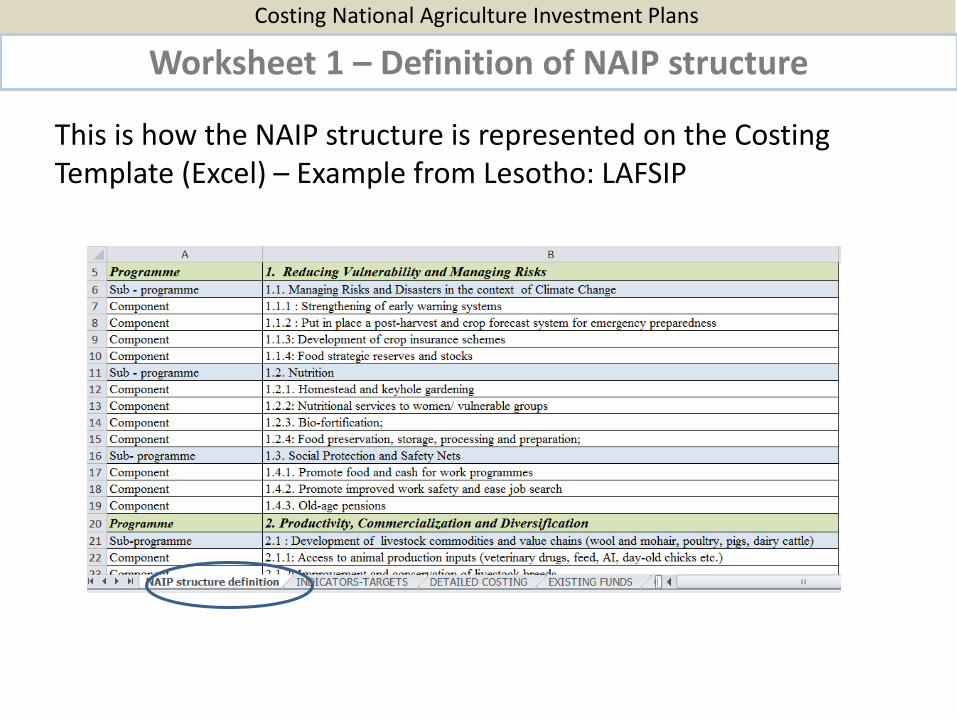
Worksheet 1 – Definition of NAIP structure
This is how the NAIP structure is represented on the Costing Template (Excel) – Example from Lesotho: LAFSIP
Costing National Agriculture Investment Plans
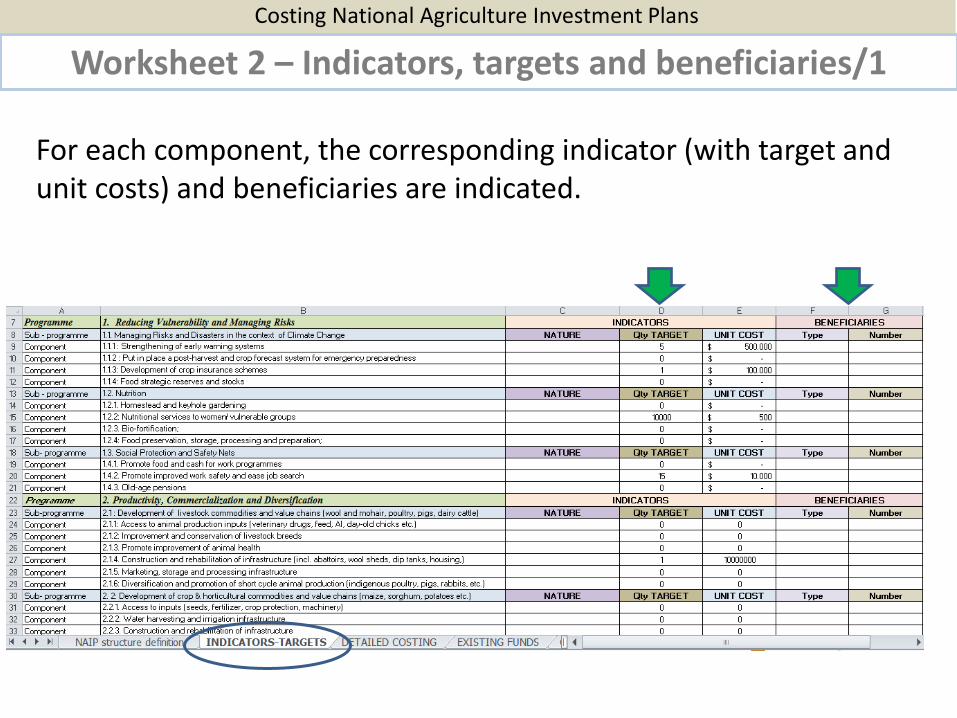
Worksheet 2 – Indicators, targets and beneficiaries/1
For each component, the corresponding indicator (with target and unit costs) and beneficiaries are indicated.
Costing National Agriculture Investment Plans
Worksheet 2 – Indicators, targets and beneficiaries/2
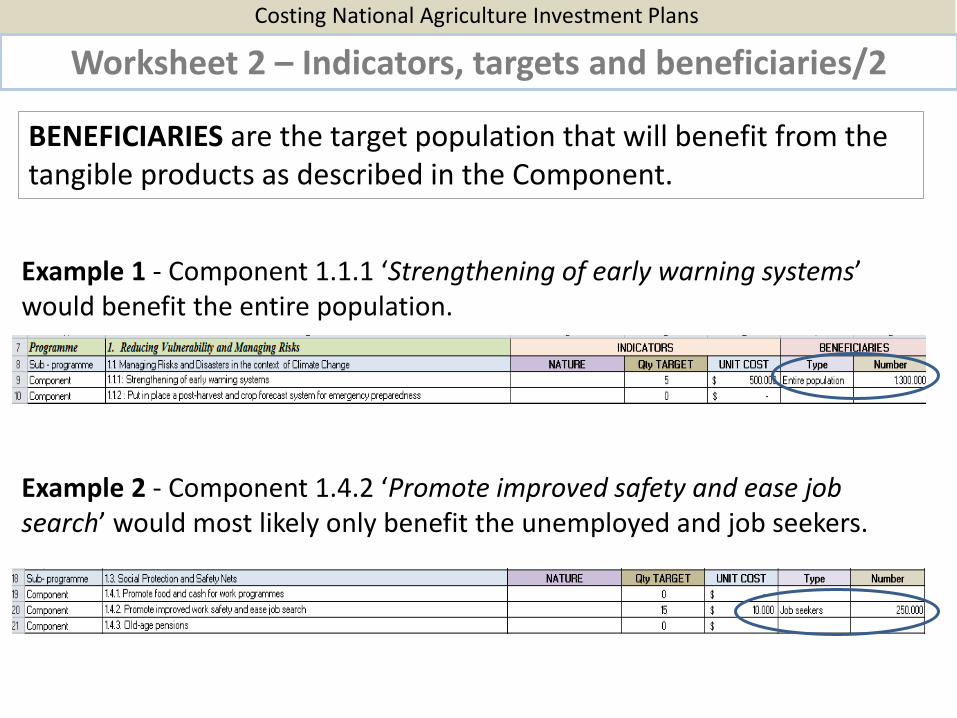
Example 1 - Component 1.1.1 ‘Strengthening of early warning systems’ would benefit the entire population.
Example 2 - Component 1.4.2 ‘Promote improved safety and ease job search’ would most likely only benefit the unemployed and job seekers.
BENEFICIARIES are the target population that will benefit from the tangible products as described in the Component.
Costing National Agriculture Investment Plans
Worksheet 2 – Indicators, targets and beneficiaries/3
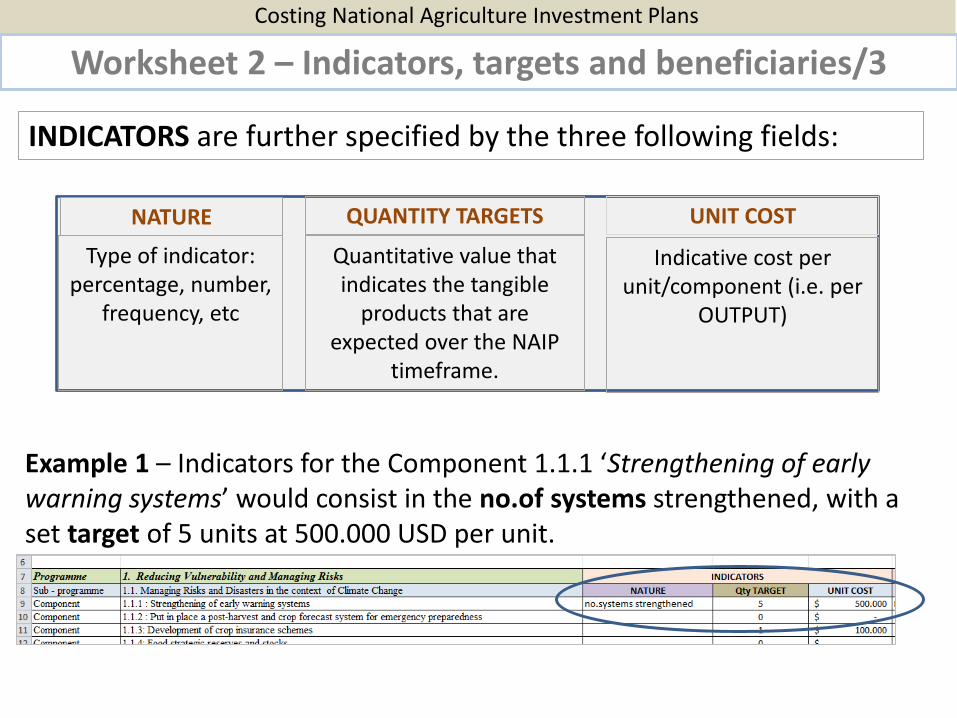
Example 1 – Indicators for the Component 1.1.1 ‘Strengthening of early warning systems’ would consist in the no.of systems strengthened, with a set target of 5 units at 500.000 USD per unit.
INDICATORS are further specified by the three following fields:
NATURE QUANTITY TARGETS UNIT COST
Type of indicator: percentage, number,
frequency, etc
Quantitative value that indicates the tangible
products that are expected over the NAIP
timeframe.
Indicative cost per unit/component (i.e. per
OUTPUT)

Costing National Agriculture Investment Plans
Worksheet 2 – Setting realistic targets and unit costs/1
Setting quantitative targets and unit costs is the very essence of NAIP costing. This is also the most challenging task in the process.
• Quantitative targets must be set to allow the required growth in the agriculture sector that is necessary to achieve the 6% development growth set forth in CAADP.
• Target-setting must be based on evidence, indicating what is realistic for the sector and the country.
• Targets can be expressed in various ways, for example in X number of Kms of road built – so cost of that component would be unit cost per km multiplied by no. of Kms. For the social grants, targets might be expressed in no. of beneficiaries, then multiplied by cost per beneficiary

Costing National Agriculture Investment Plans
Worksheet 2 – Setting realistic targets and unit costs/2
While not individually costed, a proper articulation of activities contributing to outputs might help more accurate estimates of output costs. This can be done on a separate worksheet, as appropriate.
Unit costs should be determined based on current costs (as applied in other projects/programmes) and existing benchmarks.
Specific sources of data costs might include: • Technical specialists (agronomists, roads, irrigation works, etc.) • Price lists: input suppliers, manufacturers, retailers • Government staff • Service providers
Costing National Agriculture Investment Plans
Worksheet 2 – Setting realistic targets and unit costs/3
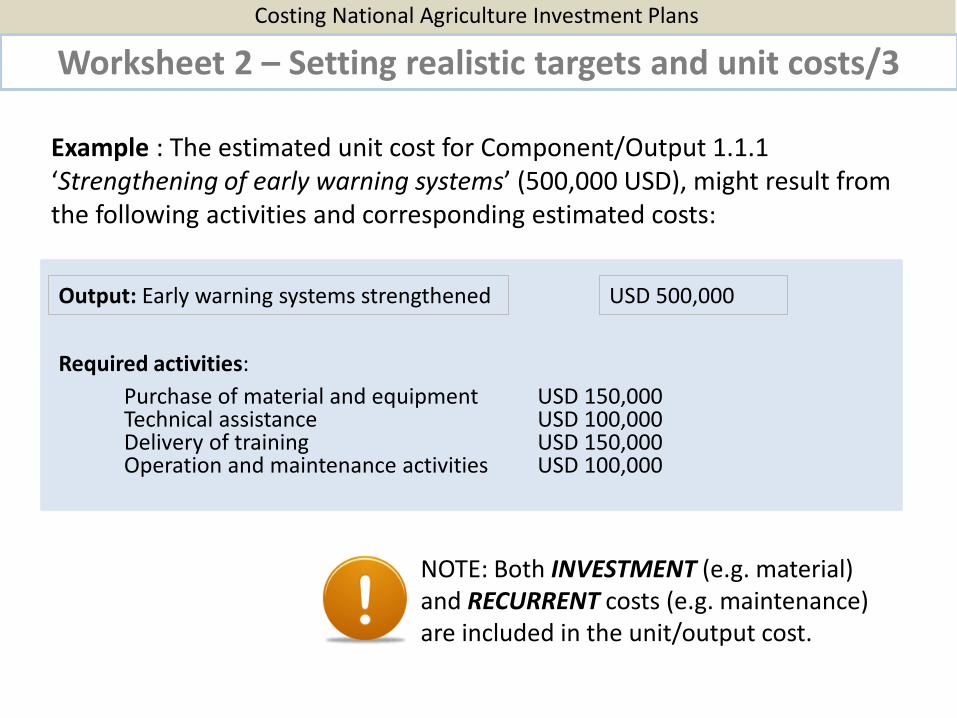
Example : The estimated unit cost for Component/Output 1.1.1 ‘Strengthening of early warning systems’ (500,000 USD), might result from the following activities and corresponding estimated costs:
Output: Early warning systems strengthened USD 500,000
Purchase of material and equipment USD 150,000 Technical assistance USD 100,000 Delivery of training USD 150,000 Operation and maintenance activities USD 100,000
Required activities:
NOTE: Both INVESTMENT (e.g. material) and RECURRENT costs (e.g. maintenance) are included in the unit/output cost.
Costing National Agriculture Investment Plans
Worksheet 3 – Detailed costing/1
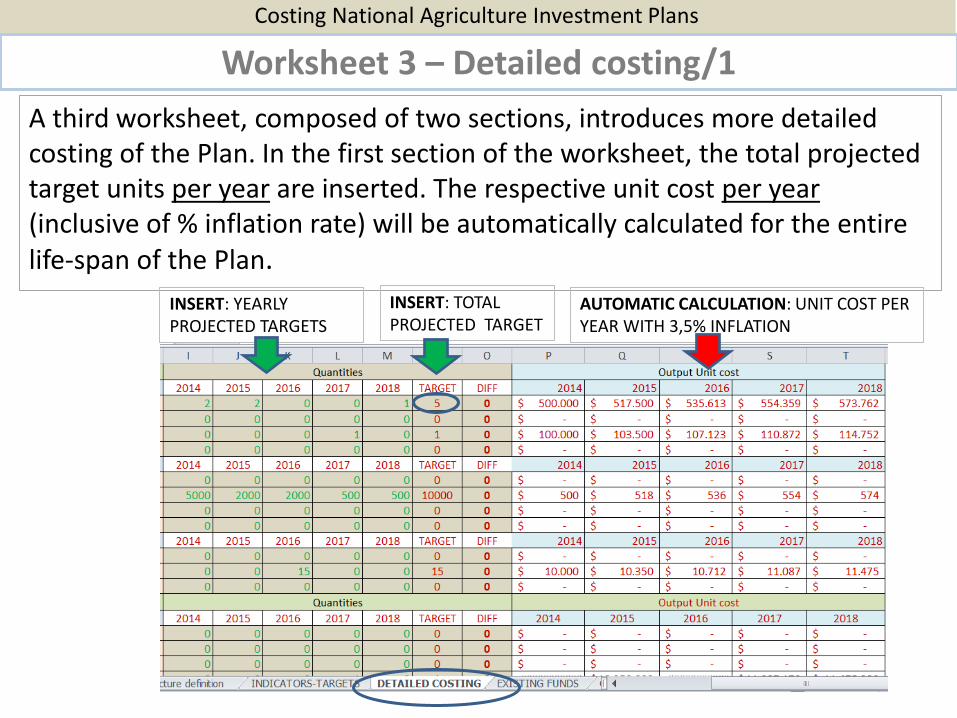
A third worksheet, composed of two sections, introduces more detailed costing of the Plan. In the first section of the worksheet, the total projected target units per year are inserted. The respective unit cost per year (inclusive of % inflation rate) will be automatically calculated for the entire life-span of the Plan.
INSERT: TOTAL PROJECTED TARGET
INSERT: YEARLY PROJECTED TARGETS
AUTOMATIC CALCULATION: UNIT COST PER YEAR WITH 3,5% INFLATION

Costing National Agriculture Investment Plans
Worksheet 3 – Detailed costing/2
In the second section of the worksheet, yearly projected targets are automatically multiplied for the respective unit cost per year inclusive of 3,5 % inflation rate. The result is the total projected cost per component, per year and cumulatively for the entire life-span of the Plan.
PROJECTED COST PER COMPONENT, PER YEAR
AUTOMATIC CALCULATION: CUMULATIVE COST PER COMPONENT AND FOR THE PLAN

Costing National Agriculture Investment Plans
Worksheet 4 – Existing funds/1
.
Once total projected costs for the Plan are calculated, the next step consists in identifying funds that exist already, in the form of ongoing and pipeline projects or programmes managed by the various sector Ministries as well as by NGOs and the private sector.
MAFS
$ Project
$ Project
Min Forestry
$ Project
$ Project
Min.Trade
$ Project
$ Project
NGOs, Private
$ Project
$ Project
$
NAIP
These funds represent the current contribution of the Government and private sector to the financing of the NAIP.
$ $
$
$
$
Costing National Agriculture Investment Plans
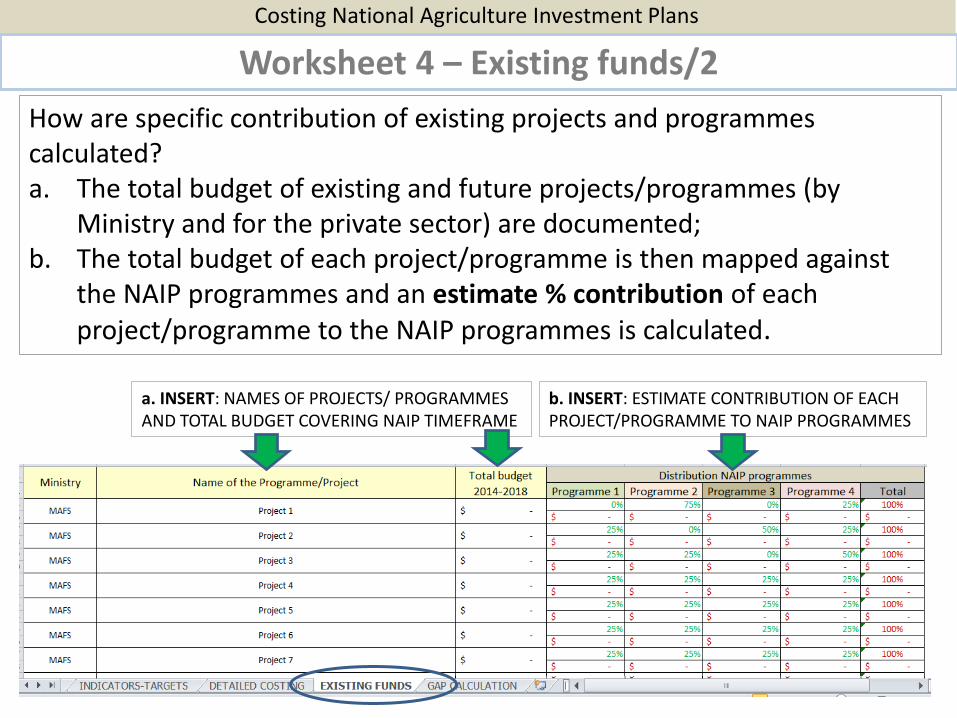
Worksheet 4 – Existing funds/2
How are specific contribution of existing projects and programmes calculated? a. The total budget of existing and future projects/programmes (by
Ministry and for the private sector) are documented; b. The total budget of each project/programme is then mapped against
the NAIP programmes and an estimate % contribution of each project/programme to the NAIP programmes is calculated.
a. INSERT: NAMES OF PROJECTS/ PROGRAMMES AND TOTAL BUDGET COVERING NAIP TIMEFRAME
b. INSERT: ESTIMATE CONTRIBUTION OF EACH PROJECT/PROGRAMME TO NAIP PROGRAMMES
Costing National Agriculture Investment Plans
Worksheet 4 – Existing funds/3
Challenges:
• It may be difficult to allocate funding to a specific NAIP programme. Also, Government spending might not be available on the basis of programmatic criteria.
• Difficulties may also arise in identifying the contribution of private sector (including commercial and small holders).
Approximate figures should be estimated in such cases. This must be done consensually and the criteria used should be made explicit.
Costing National Agriculture Investment Plans
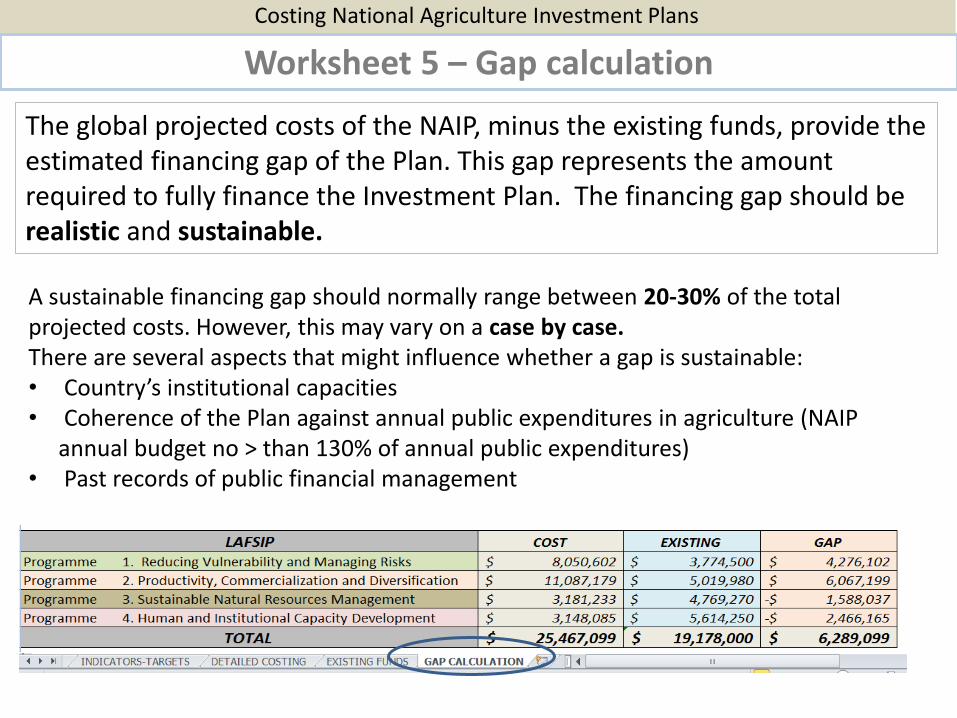
Worksheet 5 – Gap calculation
The global projected costs of the NAIP, minus the existing funds, provide the estimated financing gap of the Plan. This gap represents the amount required to fully finance the Investment Plan. The financing gap should be realistic and sustainable.
A sustainable financing gap should normally range between 20-30% of the total projected costs. However, this may vary on a case by case. There are several aspects that might influence whether a gap is sustainable: • Country’s institutional capacities • Coherence of the Plan against annual public expenditures in agriculture (NAIP
annual budget no > than 130% of annual public expenditures) • Past records of public financial management
Costing National Agriculture Investment Plans
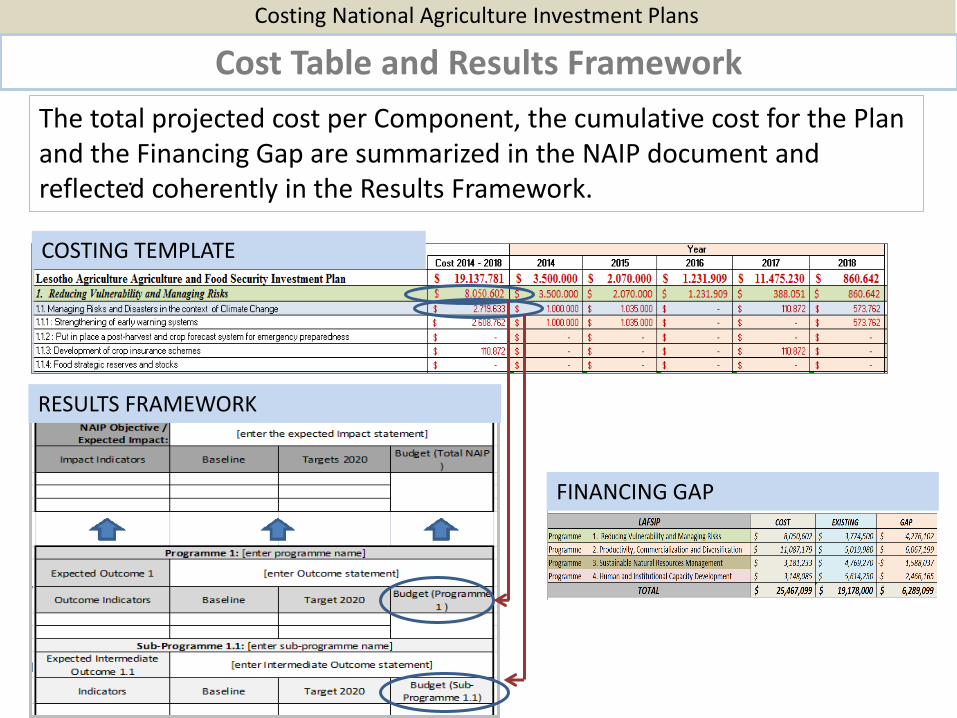
Cost Table and Results Framework
.
The total projected cost per Component, the cumulative cost for the Plan and the Financing Gap are summarized in the NAIP document and reflected coherently in the Results Framework.
COSTING TEMPLATE
RESULTS FRAMEWORK
FINANCING GAP