Cost/Benefit Analysis of NJDOT Route 18/Hoes Lane ...cost-benefit analysis. Cost-benefit analysis...
25
Rutgers Intelligent Transportation Systems Laboratory (RITS) Rutgers, The State University of New Jersey CoRE Building 7 th Floor, Busch Campus 96 Frelinghuysen Rd, Piscataway, NJ 08854 http://rits.rutgers.edu Cost/Benefit Analysis of NJDOT Route 18/Hoes Lane Improvement Project For TIGER II Grant Application August 2010
Transcript of Cost/Benefit Analysis of NJDOT Route 18/Hoes Lane ...cost-benefit analysis. Cost-benefit analysis...
Rutgers Intelligent Transportation Systems Laboratory (RITS) Rutgers, The State University of New Jersey
CoRE Building 7th Floor, Busch Campus 96 Frelinghuysen Rd, Piscataway, NJ 08854
http://rits.rutgers.edu
Cost/Benefit Analysis of NJDOT Route 18/Hoes Lane Improvement Project
For TIGER II Grant Application
August 2010

Cost/Benefit Analysis of NJDOT Route 18/Hoes Lane Improvement Project Rutgers Intelligent Transportation Systems Laboratory (RITS) 1
EXECUTIVE SUMMARY
In response to USDOT’s TIGER II Discretionary Grants notice the New Jersey
Department of Transportation (NJDOT) is submitting the Route 18/Hoes Lane
construction project for funding. Rutgers RITS Lab conducted benefit-cost analysis of
the project using the output of the North Jersey Regional Transportation Model –
Enhanced (NJRTM-E), which allows for estimation of the highway network-related costs
of travel for the no-build and build alternatives. The benefit-cost analysis was conducted
to meet the criteria put forth by USDOT, with special emphasis on the following areas:
1. State of good repair
2. Economic impacts
3. Environmental sustainability
4. Livability
5. Safety
The evaluation criteria is met by estimating the benefits of the project as the
difference between the no-build and build scenarios modeled in NJRTM-E. The model
output is processed and monetized into costs based on functions developed using New
Jersey-specific and national data. The functions estimate costs from the network based
on reductions to maintenance costs, operating costs, congestion costs, air pollution
costs, noise pollution costs, and accident costs.
The cost-benefit analysis conducted weighed the cost of the project against the
differences between the no-build and build estimates of the transportation model. Based
on value of time guidelines of USDOT and discount rates suggested by U.S. Office of
Management and Budget (USOMB) the costs and benefits are translated to present
values and compared. Based on the analysis and adjusted for sensitivity, this project is
estimated to have a benefit-cost ratio between 107.65 and 206.69, depending on the
lower and higher values of the assumptions used. From the estimates of the regional
transportation model, this project is categorized as having a positive impact to the local
area and North Jersey region.

Cost/Benefit Analysis of NJDOT Route 18/Hoes Lane Improvement Project Rutgers Intelligent Transportation Systems Laboratory (RITS) 2
INTRODUCTION
This report describes the economic evaluation framework of the transportation-
related benefits from the proposed Route 18/Hoes Lane improvement project in
Piscataway, NJ. It utilizes the most important technique of public investment evaluation,
cost-benefit analysis. Cost-benefit analysis requires the quantification and comparison
of various benefits and costs generated by a project over time. The effects from the
project are first enumerated and classified as benefits and costs. Then, each effect is
quantified and expressed in monetary terms using appropriate conversion factors (1).
Benefits arise from the savings to users and society attributed to the project. The areas
of focus are state of good repair, economic effects, livability, sustainability, and safety.
The goal of this study is to observe the benefits to the transportation system
incurred due to the proposed project, with benefits from the improvement of travel
conditions, which can be defined in multiple dimensions (access, time, safety, reliability,
etc.). Using a transportation planning model, the North Jersey Regional Travel Model –
Enhanced (NJRTM-E), scenarios of capacity improvements incurred by the proposed
improvements are run and benefits calculated by modeling the proposed changes to the
network, and comparing the model output with model output of the existing network.
The following sections describe the NJRTM-E model and the assumptions used to
model the proposed improvements. The cost-benefit evaluation process is described,
including the various types of benefits quantified from the modeling process. Finally the
data obtained for this study is presented and discussed.
METHODOLOGY A major challenge in analyzing the impacts of proposed roadway changes is the
estimation of the project’s effects on traffic patterns. Accordingly, it is necessary to
predict the modified traffic flow in order to estimate benefits. Traditional economic
analysis approaches make use of static traffic assignment to assess the impact of
capacity expansion. Although these models do not consider the time-dependent
dynamics of traffic flow and demand, they are superior to alternatives, such as traffic
Cost/Benefit Analysis of NJDOT Route 18/Hoes Lane Improvement Project Rutgers Intelligent Transportation Systems Laboratory (RITS) 3
simulation tools and spreadsheet models, due to their ability to estimate the changes in
network flow characteristics as a result of capacity improvements.
Transportation Network Model
The North Jersey Regional Transportation Model – Enhanced (NJRTM-E), currently
used by the North Jersey Transportation Planning Authority (NJTPA), is used to
estimate the changes in traffic flows that occur on both local and network levels as a
result of capacity improvements. The model is a tool that is used to help with analyzing
projects, developing the long-range plan, and determining compliance with air quality
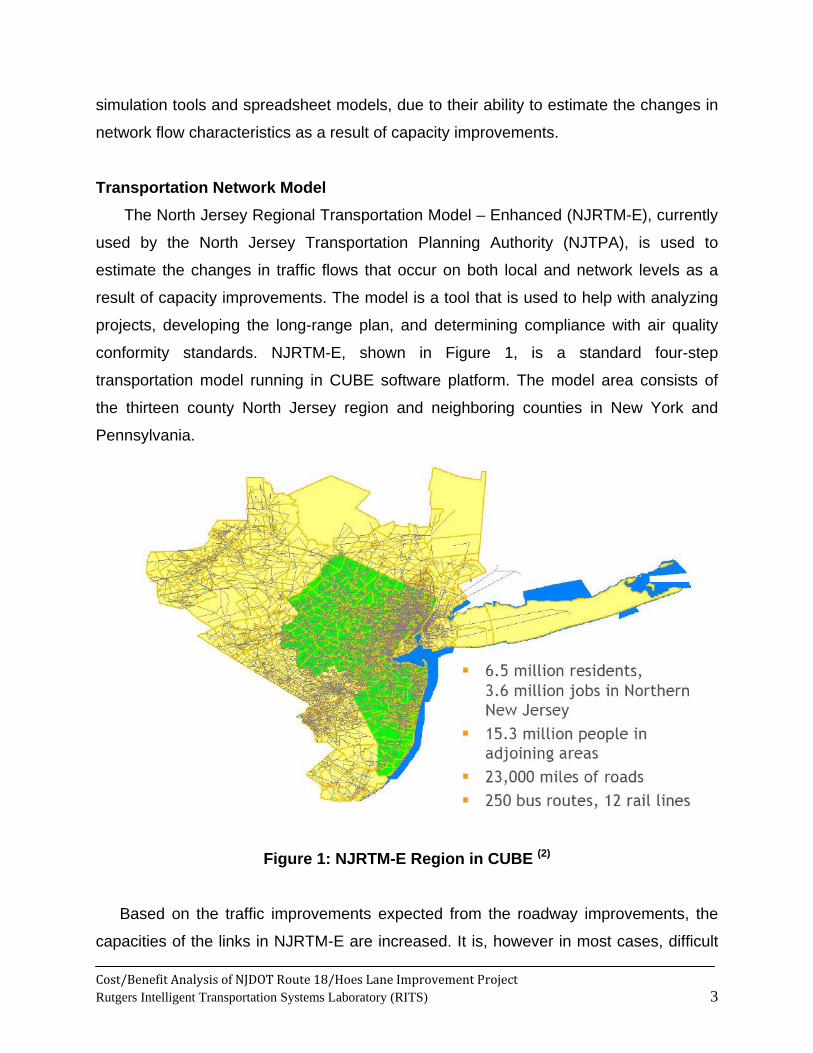
conformity standards. NJRTM-E, shown in Figure 1, is a standard four-step
transportation model running in CUBE software platform. The model area consists of
the thirteen county North Jersey region and neighboring counties in New York and
Pennsylvania.
Figure 1: NJRTM-E Region in CUBE (2)
Based on the traffic improvements expected from the roadway improvements, the
capacities of the links in NJRTM-E are increased. It is, however in most cases, difficult
Cost/Benefit Analysis of NJDOT Route 18/Hoes Lane Improvement Project Rutgers Intelligent Transportation Systems Laboratory (RITS) 4
to quantify the impact of a construction project on roadway capacity. Therefore, the
capacity improvement factor is subject to sensitivity analysis.
The NJRTM-E network is run with and without the capacity improvements, and the
network traffic flows are obtained from CUBE. Using the before and after network
results, the benefits of the project are estimated by the reductions in various cost
categories, such as congestion, vehicle operating, accident, air pollution, noise and
maintenance costs at the network level. Accordingly, the proposed methodology
combines sound economic theory with the output of a highly detailed transportation
demand model for estimating the benefits to the highway network.
The results are then processed using ASSIST-ME, a tool developed to post-process
highway assignment results from transportation planning models. ASSIST-ME is a GIS-
based Full Cost Estimation tool that can, among its other capabilities, be used to
estimate the recurring annual benefits of transportation projects. ASSIST-ME has been
developed to estimate the reductions in various costs of highway transportation using
cost reduction models specific to New Jersey. The GIS-based full cost estimation tool
enables planners to efficiently identify areas of interest and take advantage of powerful
graphical capabilities of ArcGIS.
Assumptions Used in the Analysis
As part of the TIGER Grant application, the New Jersey Department of
Transportation (NJDOT) is proposing improvements to the existing Hoes
Lane/Centennial Avenue corridor in Piscataway Township, Middlesex County, New
Jersey. The project entails extending the current northern terminus of State Route 18 by
approximately 2.5 miles to I-287 (3, 4).
In the NJRTM-E model the capacity of the links corresponding to the stretch of Hoes
lane which is modified to take into account the planned capacity improvements caused
by the removal of four traffic signals and updating eight traffic signals. It is estimated
from the capacity calculations based on the Highway Capacity Manual that the capacity
will improve by a minimum of 25% and a maximum 120%. NJTRM-E model, calibrated
for the year 2009, is used as the basis for the estimation of benefits since this is the
most recent network available. It is assumed that the cost estimates provided in the
Cost/Benefit Analysis of NJDOT Route 18/Hoes Lane Improvement Project Rutgers Intelligent Transportation Systems Laboratory (RITS) 5
document “Liberty Corridor: Section 1301 Grant Submission” (3) are all given in 2010
dollars. The analysis period is limited to approximately 25 years, after which the growth
in traffic will likely reach the improved capacity provided by the project. The benefit
analysis is performed on a network-wide basis over the analysis period. The localized
variation is traffic growth, which might be affected by various other policies such as
increased transit usage, saturation in land use, etc. have not been taken into account.
ASSIST-ME Analysis Tool Using network output files from NJRTM-E, ASSIST-ME is used to compare the two
different networks (base and modified), and estimate the impacts of network changes
(e.g., lane and/or link additions, etc.) on trip costs. Once highway assignment is
completed in NJTRM-E, four time-period specific database files are produced. Each one
of these files contains predicted values for traffic on all the links of the network. They
also include basic information about all the links carried over from the input networks.
This enables sorting and filtration based on their characteristics; for example, a sort can
be conducted for all links within a certain state or county, or for all highway links. The
calculation of link costs can be conducted in ASSIST-ME for all network links or select
links by user-defined criteria. Link costs can be calculated for two networks, before and
after network improvements, and the difference between the outputs can be taken as
the network benefits of the improvements.
The full costs of travel in New Jersey were previously studied to quantify the effects
of travel in terms of costs to users and their externalities. New Jersey-specific data was
used to estimate the costs of travel when possible and national data otherwise.
Calculating and monetizing the costs of travel is critical to conducting cost-benefit
analysis, and understanding the full local and regional effects of the project. ASSIST-
ME uses the estimated cost functions to calculate the costs of all users for all links
within the transportation network, for the base and modified cases. The benefits are
then taken as the difference between the costs for the two cases. A summary of the
equations used by ASSIST-ME can be found in Table 1 and a full description of the
costs and the development of the total cost functions is provided in the appendix.

Cost/Benefit Analysis of NJDOT Route 18/Hoes Lane Improvement Project Rutgers Intelligent Transportation Systems Laboratory (RITS) 6
Table 1 - Cost Functions Used in ASSIST-ME Cost Total Cost Function Variable Definition Data Sources
Vehicle
Operating
Copr = 7208.73 + 0.12(m/a) + 2783.3a +
0.143m
a: Vehicle age (years)
m: Vehicle miles traveled
AAA (5),
USDOT (6),
KBB (7)
Congestion ⎪⎪⎪
⎩
⎪⎪⎪
⎨
⎧
>⎟⎠⎞
⎜⎝⎛ −+⎟
⎟⎠
⎞⎜⎜⎝
⎛⎟⎠⎞
⎜⎝⎛+
≤⎟⎟⎠
⎞⎜⎜⎝
⎛⎟⎠⎞
⎜⎝⎛+
=
CQ2
VOT.1CQ.QVOT.
CQ15.01.
Vd
.Q
CQVOT.CQ15.01.
Vd
.Q
C4
o
b,a
4
o
b,a
cong
if
if
Q = Volume (veh/hr)
d = Distance (mile)
C = Capacity (veh/hr)
VOT = Value of time
($/hr)
Vo = Free flow speed
(mph)
Mun (8)
Small and Chu (9)
Accident
Category 1:
Interstate-
freeway 450420170
490750850
530760770acc
LMQ900198LMQ75114
LMQ5127C
...
...
...
..,...
...
+
+
=
Q = Volume (veh/day)
M = Path length (miles)
L = no of lanes
FHWA (10)
USDOT (11)
Category 2:
principal arterial 470630450
430690580acc
LMQ35918
LMQ5178C...
...
..,
...
+
=
Category 3:
arterial-collector-
local road
750810740
770770580acc
LMQ961799
LMQ5229C...
...
...,
...
+
=
Air
pollution
( )FQCair 2155.001094.0 +=
where; 25V10x403.5V00312.00723.0F −+−=
F = Fuel consumption at
cruising speed (gl/mile)
V = Average speed (mph)
Q = Volume (veh/hr)
EPA (12)
Noise
( )∫=
=
−=max2
1
rr
50ravgeqnoise dr
5280RDDW50L2C
where;
( )( )( )( )4.7atrF1atrF43.7102.2588.3
trtr
tr
7.6acF1acF03.5115.0174.4c
c
ctruckcar
1010.VVF
1010.VVFK
KKK
−+
−+
++
+=
+=
( ) ( ) ( ) 14.1rlog10Klog10Qlog10Leq +−+=
Q = Volume (veh/day)
r = distance to highway
K = Noise-energy emis.
Kcar = Auto emission
Ktruck = Truck emission
Fc = % of autos,
Ftr = % of trucks
Fac =% const. speed autos
Fatr=% of const. speed tr.
Vc = Auto Speed (mph)
Vtr = Truck Speed (mph)
Delucchi and
Hsu (13)

Cost/Benefit Analysis of NJDOT Route 18/Hoes Lane Improvement Project Rutgers Intelligent Transportation Systems Laboratory (RITS) 7
Maint-
enance
PLMCM
39.040.032.796=
where;
ESALNP =
ft TPQESAL ×××= 365
M: roadway length (miles)
L: number of lanes
P: design cycle period
ESAL: Equivalent single
axle load
N: number of allowable
repetitions (1,500,000)
Q: Traffic volume (veh/day)
Pt: Percentage of trucks in
traffic
Tf: Truck Factor
Ozbay et al. (14)
The following subsections describe the areas in which benefits are expected, and
how they are calculated. USDOT guidelines for TIGER II Discretionary Grant
applications call for special attention to the following areas:
6. State of good repair
7. Economic impacts
8. Environmental sustainability
9. Livability
10. Safety
These criteria are met in cost-benefit analysis by monetizing the estimates of the
regional transportation model using the functions in Table 1.
State of Good Repair
The state of roadway infrastructure is critical to vehicle operators and agencies
tasked with maintaining it. The benefits to the infrastructure resulting from this project
are immediately realized by the reconstructed roadway and pavement. In addition to this
benefit, maintenance costs attributable to vehicles using all roadways in the network are
calculated. The needs and costs for resurfacing were studied (14) to monetize the
maintenance costs of links in the network, and are calculated for base and modified
modeled networks. The difference in the maintenance costs (i.e. benefits) arise from
changes between traffic conditions and travel patterns between the two networks.

Cost/Benefit Analysis of NJDOT Route 18/Hoes Lane Improvement Project Rutgers Intelligent Transportation Systems Laboratory (RITS) 8
Economic Effects
The transportation network-related effects to the economy are largely on individuals’
and businesses’ travel times and productivity in commuting and shipping.
Transportation models calculate vehicular flows and travel times on network links, which
are used as measures of congestion and vehicle hours traveled. These estimates are
monetized as congestion costs by a value of time (VOT) multiplying factor, which can be
different for cars, trucks, and other modes. The congestion costs for the base and
modified networks are then compared to find the congestion savings brought on by the
project, the most critical valuation component in cost-benefit analysis. These congestion
changes can occur in the project corridor, and can spread out to parallel roadways and
throughout the network. In addition, vehicle operating costs for all users are calculated.
Livability & Environmental Sustainability
Environmental effects are a critical component of transportation, and model output
can be used to calculate probable environmental impacts due to changes in traffic
conditions brought about the project. In this study noise and air pollution costs are
estimated for all links in the base and modified networks. These costs are estimated
based on volume and speed estimates generated by the model for both cases, with the
difference equaling the environmental benefit of the project.
Safety
Safety improvements are a critical component of most transportation projects. In this
analysis, model estimates are compared to estimate accident costs attributable to traffic
using all roadways in the network. These accident costs are calculated based volumes
and physical roadway characteristics.
Cost-Benefit Analysis Even though most transportation policies are local, their influence often spreads out
beyond the area of implementation. Responding to road changes, traffic will shift from
the impacted part of the network to other areas, and the intensity of the shift will depend
Cost/Benefit Analysis of NJDOT Route 18/Hoes Lane Improvement Project Rutgers Intelligent Transportation Systems Laboratory (RITS) 9
on several factors, such as road characteristics, demand structure, and network
configuration (15). Thus, quantification of the likely changes in transportation benefits and
costs associated with the capacity expansion is crucial for policy planners in order to
determine the net benefits from capacity expansion projects. Such information can be
used in the process to select the projects that are most likely to generate highest return
to society.
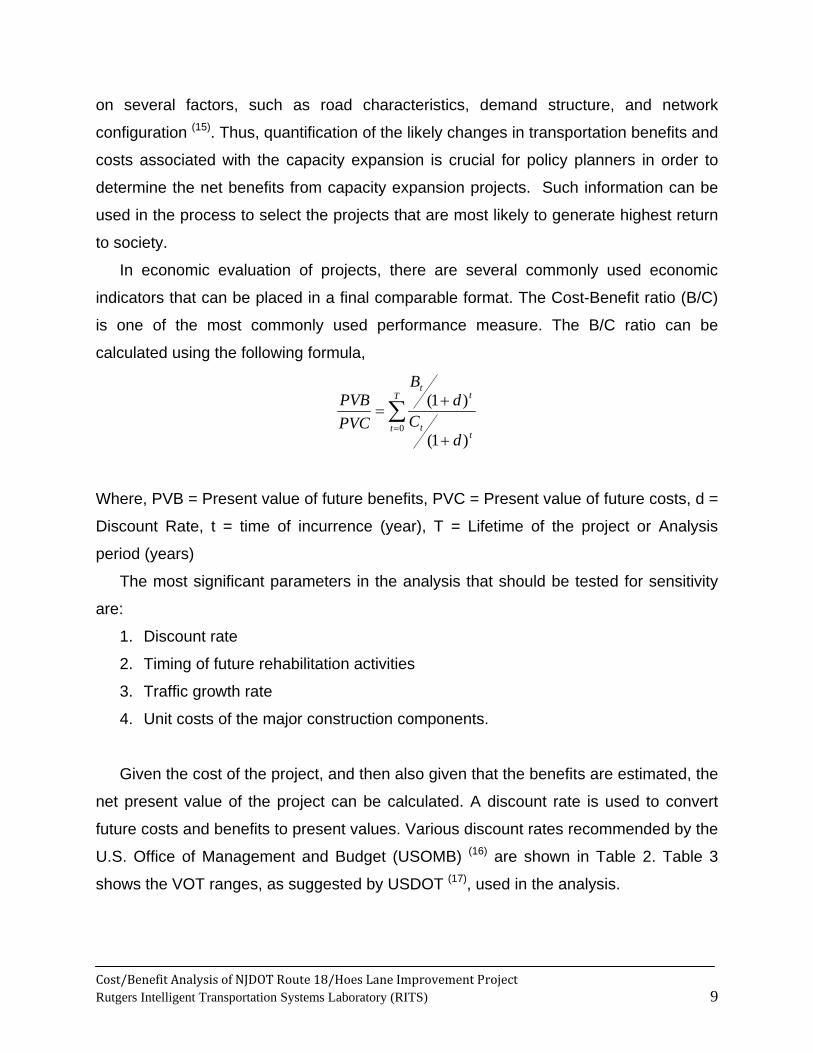
In economic evaluation of projects, there are several commonly used economic
indicators that can be placed in a final comparable format. The Cost-Benefit ratio (B/C)
is one of the most commonly used performance measure. The B/C ratio can be
calculated using the following formula,
∑=
+
+=
T
tt
t
tt
dC
dB
PVCPVB
0)1(
)1(
Where, PVB = Present value of future benefits, PVC = Present value of future costs, d =
Discount Rate, t = time of incurrence (year), T = Lifetime of the project or Analysis
period (years)
The most significant parameters in the analysis that should be tested for sensitivity
are:
1. Discount rate
2. Timing of future rehabilitation activities
3. Traffic growth rate
4. Unit costs of the major construction components.
Given the cost of the project, and then also given that the benefits are estimated, the
net present value of the project can be calculated. A discount rate is used to convert
future costs and benefits to present values. Various discount rates recommended by the
U.S. Office of Management and Budget (USOMB) (16) are shown in Table 2. Table 3
shows the VOT ranges, as suggested by USDOT (17), used in the analysis.
Cost/Benefit Analysis of NJDOT Route 18/Hoes Lane Improvement Project Rutgers Intelligent Transportation Systems Laboratory (RITS) 10
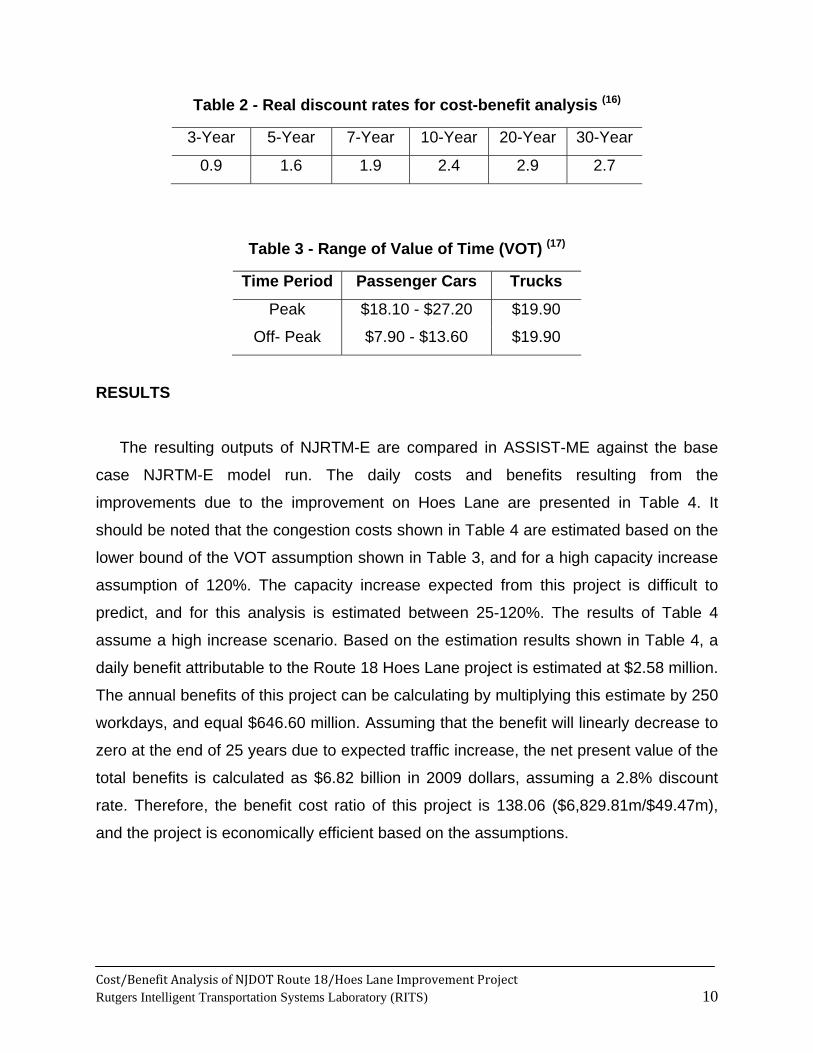
Table 2 - Real discount rates for cost-benefit analysis (16)
3-Year 5-Year 7-Year 10-Year 20-Year 30-Year
0.9 1.6 1.9 2.4 2.9 2.7
Table 3 - Range of Value of Time (VOT) (17)
Time Period Passenger Cars Trucks
Peak $18.10 - $27.20 $19.90
Off- Peak $7.90 - $13.60 $19.90
RESULTS
The resulting outputs of NJRTM-E are compared in ASSIST-ME against the base
case NJRTM-E model run. The daily costs and benefits resulting from the
improvements due to the improvement on Hoes Lane are presented in Table 4. It
should be noted that the congestion costs shown in Table 4 are estimated based on the
lower bound of the VOT assumption shown in Table 3, and for a high capacity increase
assumption of 120%. The capacity increase expected from this project is difficult to
predict, and for this analysis is estimated between 25-120%. The results of Table 4
assume a high increase scenario. Based on the estimation results shown in Table 4, a
daily benefit attributable to the Route 18 Hoes Lane project is estimated at $2.58 million.
The annual benefits of this project can be calculating by multiplying this estimate by 250
workdays, and equal $646.60 million. Assuming that the benefit will linearly decrease to
zero at the end of 25 years due to expected traffic increase, the net present value of the
total benefits is calculated as $6.82 billion in 2009 dollars, assuming a 2.8% discount
rate. Therefore, the benefit cost ratio of this project is 138.06 ($6,829.81m/$49.47m),
and the project is economically efficient based on the assumptions.
Cost/Benefit Analysis of NJDOT Route 18/Hoes Lane Improvement Project Rutgers Intelligent Transportation Systems Laboratory (RITS) 11
Table 4 - Estimated total daily costs ($) of original and modified networks for Route 18 Hoes Lane Improvement Project
Morning Peak
Cost Categ.
Economic Effects Safety Environmental Sustainability
State of Good Repair
Vehicle Operating Congestion Accident Air
Pollution Noise Maintenance Total
Original 12,269,130.00 39,133,860.00 3,090,104.00 1,866,980.00 42,316.23 688,671.80 57,091,062.03
Modified 12,180,070.00 37,421,850.00 3,047,125.00 1,864,988.00 42,216.12 731,138.70 55,287,387.82
Benefit 89,060.00 1,712,010.00 42,979.00 1,992.00 100.11 -42,466.90 1,803,674.21Midday Off-peak Original 13,290,220.00 14,092,140.00 4,131,657.00 2,538,840.00 65,369.86 1,584,298.00 35,702,524.86
Modified 13,290,610.00 14,099,900.00 4,131,771.00 2,538,690.00 65,368.71 1,583,974.00 35,710,313.71
Benefit -390.00 -7,760.00 -114.00 150.00 1.15 324.00 -7,788.85Afternoon Peak Original 13,737,490.00 45,214,080.00 3,422,373.00 2,054,029.00 45,853.54 740,909.60 65,214,735.14
Modified 13,704,140.00 44,652,880.00 3,407,163.00 2,052,434.00 45,828.50 741,115.40 64,603,560.90
Benefit 33,350.00 561,200.00 15,210.00 1,595.00 25.04 -205.80 611,174.24Night Off-peak Original 9,350,579.00 9,712,229.00 3,744,627.00 1,805,579.00 46,189.01 2,293,476.00 26,952,679.01
Modified 9,335,332.00 9,562,045.00 3,726,338.00 1,799,943.00 45,674.60 2,303,977.00 26,773,309.60
Benefit 15,247.00 150,184.00 18,289.00 5,636.00 514.41 -10,501.00 179,369.41Total Daily Benefit 2,586,429.01
Sensitivity Analysis To evaluate the economic benefits for various combinations of ranges of VOT and
capacity improvements, a sensitivity analysis is performed. This section investigates the
variation in the benefit-cost ratio for the Route 18 corridor project for two values of time
and capacity increase assumptions. The VOT ranges for passenger cars and trucks
during peak and off-peak hours are shown in Table 3. The benefit-cost ratios for each
project presented in the previous section are based on the low VOT range.
The increase in capacity due to each project is reflected in the NJRTM-E CUBE
model by multiplying the base capacity by a factor that is estimated based on the project
specifications, such as the increase in number of lanes and addition of shoulders. The
benefit-cost ratios presented in the previous section are based on the assumption of a
high capacity increase (120%). The variation in benefit-cost ratios assuming a lower

Cost/Benefit Analysis of NJDOT Route 18/Hoes Lane Improvement Project Rutgers Intelligent Transportation Systems Laboratory (RITS) 12
increase in capacity than initially assumed is investigated. Therefore, the factors used to
increase capacity are lowered by 50% in the CUBE model, and new results are
obtained accordingly (lower capacity). It should be noted that NJTRM-E model is a
macroscopic model and cannot capture operational level improvements beyond
capacity improvements.
The B/C ratios shown in Table 5 can be considered as an indication of the long-term
economic viability of these projects, not necessarily as point estimates of their exact
economic value. Moreover, over-interpretation of these B/C ratios should be avoided
since there are many modeling and estimation assumptions that can affect these. A
positive B/C ratio greater than an arbitrary threshold of 5 can be interpreted as a highly
beneficial project.
Table 5 - Benefit/Cost ratios as a result of sensitivity analyses
High Capacity Low Capacity
Low VOT High VOT Low VOT High VOT
138.06 206.69 107.65 162.03
SUMMARY AND CONCLUSIONS
The NJRTM-E network is run with and without the capacity improvements resulting
from the proposed Route 18/Hoes Lane corridor improvement project, and the network-
wide traffic flows are obtained from CUBE. The results are compiled and analyzed using
ASSIST-ME, a tool capable of calculating link costs that include accident, vehicle
operating, maintenance and environmental costs (e.g. noise and air pollution), based on
NJ-specific data. Using the before and after results, the benefits of each project are
estimated as reductions in various cost categories. A cost-benefit analysis is then
conducted using USOMB and USDOT guidelines, over a lifespan for the project of 25
years. Accordingly, the proposed methodology combines sound economic theory with
the output of a highly detailed transportation demand model for estimating the costs and
benefits of selected highway projects.

Cost/Benefit Analysis of NJDOT Route 18/Hoes Lane Improvement Project Rutgers Intelligent Transportation Systems Laboratory (RITS) 13
Based on the model output, this project is highly beneficial in terms of both direct
user costs such as travel times, and externalities such as air and noise pollution. The
results show that that the majority of benefits accrue through reduced travel times.
Therefore, the benefits vary with high margins with respect to value-of-time
assumptions. Sensitivity analyses conducted with respect to two variables, capacity
increase and value-of-time, show that the project has a highly positive benefit-cost ratio
for all cases within the range of assumptions.
REFERENCES
1. Banister, D. and Berechman, J. (2000) “Transport Investment and Economic
Development” University College London Press.
2. North Jersey Regional Transportation Model- Transportation Modeling Overview,
North Jersey Transportation Planning Authority Training Sessions Volume 1,
Newark, New Jersey, May 19, 2008.
3. Liberty Corridor: Section 1301 Grant Submission, Prepared for Federal Highway
Administration by New Jersey Department of Transportation in association with New
Jersey Institute of Technology, October 2007.
4. Map of Route 18 Extension, Section 3A, Hoes Lane Corridor, Township of
Piscataway, Middlesex County, New Jersey Department of Transportation.
5. American Automobile Association, Your Driving Costs 2003, American Automobile
Association (www.ouraaa .com), 2003. Based on Runzheimer International data.
6. US Department of Transportation. Cost of Owning and Operating Automobiles, Vans
and Light Trucks, 1999.
7. Kelly Blue Book Website, 2006. Available online at http://www.kbb.com/.
8. Mun, Se-IL. Traffic Jams and Congestion Tolls. Transportation Research B, Vol. 28,
1994, pp. 365-375.
9. Small K., and X. Chu. Hypercongestion. Journal of Transport Economics and Policy,
Vol. 37, 2003, pp. 319-352.
10. Federal Highway Administration (FHWA). Motor Vehicle Accident Costs, 2005,
Available online at http://www.fhwa.dot.gov/legsregs/directives/techadvs/t75702

Cost/Benefit Analysis of NJDOT Route 18/Hoes Lane Improvement Project Rutgers Intelligent Transportation Systems Laboratory (RITS) 14
11. US Department of Transportation. Crash Records, 2005, Available online at
http://www. state.nj.us/transportation/refdata/accident/rawdata01-03.shtm
12. Environmental Protection Agency Publications. National Emission Trends. 1995.
13. Delucchi, M., and S. Hsu. The External Damage Cost of Noise Emitted from Motor
Vehicles. Journal of Transportation and Statistics, Vol. 1, 1998, pp. 1-24.
14. Ozbay, K., Bartin, B. and Berechman, J. (2001). “Estimation and Evaluation of Full
Marginal Costs of Highway Transportation in New Jersey”, Journal of Transportation
and Statistics, Vol. 4, No.1, April 2001. (With Ozbay, K. and Berechman, J.)
15. Safirova, E., K. Gillingham, S. Houde. Measuring Marginal Congestion Costs of
Urban Transportation: Do Networks Matter? Transportation Research A, Vol. 41,
2007, pp. 734-749.
16. U.S. Office of Management and Budget (2008). "Guidelines and Discount Rates for
Benefit-Cost Analysis of Federal Programs". Circular No: A-94. Appendix C.
17. USDOT. Departmental Guidance on the Evaluation of Travel Time in Economic
Analysis”, Memo, USDOT Available online at http://ostpxweb.dot
.gov/policy/safety/VOT_Guidance_ Revision_1.pdf, April 9, 1997.
18. Ozbay, K., Yanmaz-Tuzel O., Mudigonda S., Bartin B., and Berechman J. Cost of
Transporting People in New Jersey-Phase II. New Jersey Department of
Transportation Final Report, Report No FHWA/NJ-2007-003, 2007.
19. Apogee Research (1994). “The Costs of Transportation”, Conservation Law
Foundation (Boston; www.clf.org).
20. K. Gwilliam. The Value of Time in Economic Evaluation of Transport Projects;
Lessons from Recent Research. World Bank (Washington DC), January 1997.
21. Mayeres, I., Ochelen, S. and Proost., S. (1996) “The Marginal External Cost of
Urban Transport”, Transportation Research Part D, No.2, pp. 111-130.
22. Booz Allen Hamilton, ACT (2003). “Transport Costing Study”, Canberra Department
of Urban Services Available online at http://www.actpla.act.gov.au/plandev/tp-
intro/tp-archive/transportstudy.pdf.
23. I.T. Transport. “The Value of Time in Least Developed Countries”, Department for
International Development, UK under its Knowledge and Research (KaR)

Cost/Benefit Analysis of NJDOT Route 18/Hoes Lane Improvement Project Rutgers Intelligent Transportation Systems Laboratory (RITS) 15
Programme, available online at www.transport-links.org /transport_links, Accessed
June 2005.
24. U.S. Department of Labor (2007). "State Occupational and Wage Estimates New
Jersey". Available online at http://www.bls.gov/oes/2007/may/oes_nj.htm#b00-0000.
Accessed December 2008.
25. National Safety Council (2007). "Estimating the Costs of Unintentional Injuries."
Available online at http://www.nsc.org/resources/issues/estcost.aspx. Accessed
January 2009.
26. National Highway Traffic Safety Administration, US Department of Transportation
(2000). "The Economic Impact of Motor Vehicle Crashes". Available online at
http://www.nhtsa.dot.gov. Accessed February 2009.
27. Federal Highway Administration (1994). "Motor Vehicle Accident Costs." Available
online at http://www.fhwa.dot.gov/legsregs/directives/techadvs/t75702.htm.
Accessed September 2005.
28. American Association of State Highway and Transportation Officials (2007) "Poll
Results: Crash Costs used for Prioritizing Safety Projects." Available online at
http://www.transportation.org/?siteid=62&pageid=1622. Accessed February 2009.
29. Ozbay, K., Bartin, B., Yanmaz-Tuzel, O., Berechman, J. (2008) “Alternative Methods
for Estimating Full Marginal Costs of Highway Transportation”, Transportation
Research A, Vol. 41, pp. 768-786.
30. Small, K. and Kazimi, C. (1995). “On Costs of Air Pollution from Motor Vehicles,”
Journal of Transport Economics and Policy,” 29 (1), pp. 7-32.
31. Small, K. (1977). “Estimating the Air Pollution Cost of Transportation Modes,”
Journal of Transport Economics and Policy, Vol. 11, pp. 109-132.
32. Nelson, J. P., May 1982. Highway Noise and Property Values: A Survey of Recent
Evidence. Journal of Transport Economics and Policy, pp. 117-138.

Cost/Benefit Analysis of NJDOT Route 18/Hoes Lane Improvement Project Rutgers Intelligent Transportation Systems Laboratory (RITS) 16
APPENDIX
Reductions in each cost category attributable to a project were estimated using data
obtained from NJDOT and other state and national sources. Data on vehicle operating
costs, accident costs, and infrastructure costs are NJ-specific. STATA software is used
to estimate the parameters of each cost function. Congestion and environmental costs,
however, were based on relevant studies in the literature. The parameters of the cost
functions were modified to reflect NJ-specific conditions. The individual cost reduction
functions are discussed below.
Vehicle Operating Costs Vehicle operating costs are directly borne by drivers. These costs are affected by
many factors, such as road design, type of the vehicle, environmental conditions, and
flow speed of traffic. In this study, vehicle operating costs depend on depreciation cost,
cost of fuel, oil, tires, insurance, and parking/tolls. Depreciation cost is itself a function of
mileage and vehicle age; other costs are unit costs per mile. In this study, we employed
the depreciation cost function estimated by Ozbay et al. (18)
The other cost categories, namely, cost of fuel, oil, tires, insurance, parking and tolls
are obtained from appropriate AAA report (5) and USDOT report (6). The unit operating
costs given in Table A1 are in 2005 dollars.
Table A1 - Operating costs (in 2005 dollars) (5,6)
Operating Expenses Unit Costs
Gas & oil 0.087 ($/mile)
Maintenance 0.056 ($/mile)
Tires 0.0064 ($/mile)
Insurance Cost 1,370($/year)
Parking and Tolls 0.021 ($/mile)

Cost/Benefit Analysis of NJDOT Route 18/Hoes Lane Improvement Project Rutgers Intelligent Transportation Systems Laboratory (RITS) 17
Congestion Costs Congestion cost is defined as the time-loss due to traffic conditions and drivers’
discomfort, both of which are a function of increasing volume to capacity ratios.
Specifically,
Time loss can be determined through the use of a travel time function. Its value
depends on the distance between any OD pairs (d), traffic volume (Q) and
roadway capacity (C).
Users’ characteristics: Users traveling in a highway network are not
homogeneous with respect to their value of time.
Since all these cost categories are directly related to travel time, the monetary value
of time (VOT) is a crucial determinant of cost changes. Depending on the mode used by
the traveler, travel time costs may include time devoted to waiting, accessing vehicles,
as well as actual travel.
In a study of congestion costs in Boston and Portland areas, Apogee Research
estimated congestion costs using VOT values based on 50% of the average wage rate
for work trips and 25% for other trip purposes (19). Based on a review of international
studies, K. Gwilliam (20) concluded that work travel time should be valued at 100% wage
rate, whereas non-work travel time should be valued at 30% of the hourly wage rate,
given the absence of superior local data. Similarly, the USDOT (17) suggests VOT values
between 50% and 100% of the hourly wage rate depending on travel type (personal,
business). In these studies, user characteristics, mode of travel, or time of day choices
are not included in the VOT estimation. To address these issues, stated preference
surveys are conducted in some studies to estimate VOT for different modes and trip
types (21, 22, 23).
In this study, we adopt the VOT ranges based on average hourly wages as
recommended by the USDOT (17). Following the USDOT, we assume two vehicle types:
passenger cars and trucks. For passenger cars, the VOT range, based on the hourly
wage, is assumed to be between 80% and 120% of the average hourly wage within
peak period, and between 35% and 60% of the average hourly wage within off-peak
periods, respectively. For trucks, the VOT range, based on the hourly wage, is assumed
to be 100% within both off-peak and peak periods.

Cost/Benefit Analysis of NJDOT Route 18/Hoes Lane Improvement Project Rutgers Intelligent Transportation Systems Laboratory (RITS) 18
U.S. Department of Labor (24) reported average hourly wages for all occupations in
New Jersey. The report indicates that, in 2007, the average hourly wage for all
occupations was $22.64 per hour. The hourly wage in trucking was $19.90 per hour.
Table A2 shows the VOT ranges, as suggested by USDOT (17), used in our analysis.
Table A2 - Value of Time Ranges
Time Period Passenger Cars Trucks
Peak $18.10 - $27.20 $19.90
Off- Peak $7.90 - $13.60 $19.90
The Bureau of Public Roads travel time function was used to calculate time loss.
Thus, the total cost of congestion between a given OD pair can be calculated by the
time loss of one driver along the route, multiplied by total traffic volume (Q) and the
average value of time (VOT).
Accident Costs
Accident costs are the economic value of damages caused by vehicle
accidents/incidents. These costs can be classified in two major groups: (1) cost of
foregone production and consumption, which can be converted into monetary values,
and (2) life-injury damages, which involves more complex techniques to convert into
monetary values. Costs associated with these two categories are given in Table A3.
The accident cost function estimates the number of accidents that occur over a
period of time, and converts the estimated number of accidents into a dollar value by
multiplying the number of accidents by their unit cost values. The cost of any specific
accident varies of course with individual circumstances. However, similar accidents
typically have costs that fall within the same range.

Cost/Benefit Analysis of NJDOT Route 18/Hoes Lane Improvement Project Rutgers Intelligent Transportation Systems Laboratory (RITS) 19
Table A3 - Accident Cost Categories
Pure Economic Costs
Major costs Description
Medically related costs Hospital, Physician, Rehabilitation, Prescription
Emergency services costs Police, Fire, ambulance, helicopter services,
incident management services
Administrative and legal costs Vehicle repair and replacement, damage to the
transportation infrastructure
Life Injury Costs
Employer costs
Wages paid to co-workers and supervisors to recruit
and train replacement for disabled workers, repair
damaged company vehicles, productivity losses due
to inefficient start-up of substitute workers
Lost productivity costs Wages, fringes, household work, earnings lost by
family and friends caring for the injured
Quality of life costs Costs due to pain, suffering, death and injury
Travel delay costs Productivity loss by people stuck in crash related
traffic jams
Accidents were categorized as fatal, injury and property damage accidents. Accident
occurrence rate functions for each accident type were developed using the traffic
accident database of New Jersey. Historical data obtained from NJDOT show that
annual accident rates, by accident type, are closely related to traffic volume and
roadway geometry.
Traffic volume is represented by the average annual daily traffic. The roadway geometry of a highway section is based on its engineering design. There are various
features of a roadway geometric design that closely affect the likelihood of an accident
occurrence. However, these variables are too detailed to be considered in a given
function. Thus, highways were classified on the basis of their functional type, namely
Interstate, freeway-expressway and local-arterial-collector. It was assumed that each
highway type has its unique roadway design features. This classification makes it

Cost/Benefit Analysis of NJDOT Route 18/Hoes Lane Improvement Project Rutgers Intelligent Transportation Systems Laboratory (RITS) 20
possible to work with only two variables: road length and number of lanes1. There are
three accident occurrence rate functions for each accident type for each of the three
highway functional types. Hence, nine different functions were developed. Regression
analysis was used to estimate these functions. The available data consists of detailed
accident summaries for the years 1991 to 1995 in New Jersey. For each highway
functional type, the number of accidents in a given year is reported.
The unit cost of each type of accident directly affects the cost estimates. The
National Safety Council (25) reported the average unit cost per person for three accident
types, as shown in Table A4. These values are comprehensive costs that include a
measure of the value of lost quality of life which was obtained through empirical studies
based on observed willingness to pay by individuals to reduce safety and health risks.
Table A4 - Average Comprehensive Cost per person by accident type (25)
Accident Type Cost
Death $4,100,000
Incapacitating Injury $208,500
Non-incapacitating Injury $53,200
Possible Injury $25,300
Property Damage $2,300
Accident cost estimation is not exact, it can only be approximated. The studies in the
relevant literature show varying unit costs for accidents. A NHTSA study (26) reports the
lifetime economic cost of each fatality as $977,000. Over 80% of this amount is
attributable to lost workplace and household productivity. The same study reports that
the cost of each critically injured survivor is $1.1 million (26).
A study by FHWA (27) reported the comprehensive cost of each accident by severity,
as shown in Table A5.
1 This approach is also consistent with previous studies e.g., Mayeres et al. (Error! Reference source not found.)

Cost/Benefit Analysis of NJDOT Route 18/Hoes Lane Improvement Project Rutgers Intelligent Transportation Systems Laboratory (RITS) 21
Table A5 - Average comprehensive cost by accident type (27)
Accident Type Cost
Fatal $3,673,732
Incapacitating $254,335
Evident $50,867
Possible $26,847
Property Damage $2,826 Note: All costs are in 2008 dollars, converted from 1994 values using 2.5% discount rate.
A recent poll conducted by AASHTO (28) reported accident costs by severity. The
reported figures shown in Table A6 reflect the average accident costs used by 24 states
for prioritizing safety projects.
Table A6 - Average cost by accident type (28)
Accident Type Cost
Fatality $2,435,134
Major Injury $483,667
Incapacitating Injury $245,815
Minor Injury $64,400
Non-incapacitating Evident Injury $46,328
Injury $59,898
Possible or Unknown injury $23,837
Property Damage $6,142
In our analysis, we use the unit accident costs reported by the FHWA (27) (see Table
A5). In order to align the cost estimates based on the accident types available in
NJDOT accident database, we regroup accident types in FHWA (27) into fatality, injury
(incapacitating) and property damage accidents. The accident cost functions are based
on unit accident cost for each accident type. The accident cost functions used in this
study were first developed by Ozbay et al. (14), and later improved by Ozbay et al. (29, 18)
with a new accident database. The statistical results of the estimation of accident
occurrence rate functions can be found in Ozbay et al. (18).

Cost/Benefit Analysis of NJDOT Route 18/Hoes Lane Improvement Project Rutgers Intelligent Transportation Systems Laboratory (RITS) 22
Environmental Costs Environmental costs due to highway transportation are categorized as air pollution
and noise pollution costs.
Air Pollution Costs
Highway transportation accounts for the air pollution due to the release of pollutants
during motor vehicle operations. This occurs either through the direct emission of the
pollutants from the vehicles, or the resulting chemical reactions of the emitted pollutants
with each other and/or with the existent materials in the atmosphere. The pollutants
included in estimating air pollution costs in this study are volatile organic compounds
(VOC), carbon monoxide (CO), nitrogen oxide (NOx), and particulate matters (PM10).
Estimating the costs attributable to highway air pollution is not a straightforward task,
since there are no reliable methods to precisely identify and quantify the origins of the
existing air pollution levels. The constraints for estimating the costs attributable to air
pollution are listed as follows:
• Air pollution can be local, trans-boundary or global. As the range of its
influence broadens, the cost generated increases, and after a certain point
the full cost impact becomes difficult to estimate.
• Air pollution effects are typically chronic in nature. Namely, unless the
pollution level is at toxic levels, the damage imposed on human health,
agricultural products and materials may be detectable only after years of
exposure.
Even if the influence of specific sources of air pollution could be isolated with precision,
quantifying the contribution of highway transportation requires several assumptions.
Emission rates depend on multiple factors, such as topographical and climatic
conditions of the region, vehicle properties, vehicle speed, acceleration and
deceleration, fuel type, etc. The widely used estimation model is available in US
MOBILE software, which requires, as inputs, the above listed factors. Based on the
input values, the program estimates emissions of each pollutant. However, the accuracy
of this specific model and the other current models is, as noted, imprecise (see Small, et

Cost/Benefit Analysis of NJDOT Route 18/Hoes Lane Improvement Project Rutgers Intelligent Transportation Systems Laboratory (RITS) 23
al. (30)). Cost values attributable to differing levels of air pollution require a detailed
investigation and an evaluation of people’s preferences and their willingness to pay in
order to mitigate or avoid these adverse effects.
There is extensive literature that attempts to measure the costs of air pollution (e.g.,
Small (31), Small and Kazimi al.(30), Mayeres et al. (21)). There are three ways of
estimating the costs of air pollution: Direct estimation of damages, hedonic price
measurement (relates price changes, demand, and air quality levels) and preference of
policymakers (pollution costs are inferred from the costs of meeting pollution
regulations), (Small and Kazimi (30)).
Small and Kazimi (30) adopt the direct estimation of damages method to measure the
unit costs of each pollutant. The study differentiates the resulting damages in three
categories: mortality from particulates, morbidity from particulates and morbidity from
ozone. It is assumed that human health costs are the dominant portion of costs due to
air pollution rather than the damage to agriculture or materials. Particulate Matter (PM10)
which is both directly emitted and indirectly generated by the chemical reaction of VOC,
NOx, and SOx, is assumed to be the major cause of health damage costs. Ozone (O3)
formation is attributed to the chemical reaction between VOC and NOx. In this study, we
adopt the unit cost values suggested by Small and Kazimi (30).
Noise Costs
The external costs of noise are most commonly estimated as the rate of depreciation
in the value of residential units located at various distances from highways. Presumably,
the closer a house to the highway the more the disamentity of noise will be capitalized
in the value of that house. While there are many other factors that are also capitalized in
housing values, “closeness” is most often utilized as the major variable explaining the
effect of noise levels. The Noise Depreciation Sensitivity Index (NDSI) as given in
Nelson (32) is defined as the ratio of the percentage reduction in housing value due to a
unit change in the noise level. Nelson (32) suggests the value of 0.40% for NDSI.
The noise cost function indicates that whenever the ambient noise level at a certain
distance from the highway exceeds 50 decibels, it causes a reduction in home values of

Cost/Benefit Analysis of NJDOT Route 18/Hoes Lane Improvement Project Rutgers Intelligent Transportation Systems Laboratory (RITS) 24
houses. Thus, the change in total noise cost depends both on the noise level and on the
house value. Detailed information is presented in Ozbay et al. (14).
Maintenance Costs Infrastructure costs include all long-term expenditures, such as facility construction,
material, labor, administration, right of way costs, regular maintenance expenditures for
keeping the facility in a state of good repair, and occasional capital expenditures for
traffic-flow improvement. Network properties represent the physical capabilities of the
constructed highway facility, which include the number of lanes, lane width, pavement
durability, intersections, ramps, overpasses, and so forth.
Maintenance and improvement constitute the only cost category that remains in our
marginal infrastructure cost function. We attempt to express the maintenance cost in
terms of input and output. Input in this context includes all components of maintenance
work, such as equipment usage, earthwork, grading, material, and labor. Output implies
the traffic volume on the roadway. The data employed include completed or ongoing
resurfacing works between 2004 and 2006 in New Jersey.
P factor represents the time period (in years) between two consecutive resurfacing
improvement works. ESAL converts the axle loads of various magnitudes and
repetitions to an equivalent number of “standard” of “equivalent” loads based on the
amount of damage they do the pavement (57). Truck factor changes with respect to
different road types. Values for various road types are provided in Table A7.
Table A7 – Truck factor values
Road Type Area Type
Rural Urban
Interstate 0.52 0.39
Freeway - 0.23
Principal 0.38 0.21
Minor Arterial 0.21 0.07
Major Collector 0.3 0.24
Minor Collector 0.12
![Principles and Standards for Benefit–Cost Analysis] Introduction- Professionalizing Benefit–Cost Analysis](https://static.fdocuments.us/doc/165x107/56d6beb21a28ab30169333bb/principles-and-standards-for-benefitcost-analysis-introduction-professionalizing.jpg)