COSTA RICA - SUTEL: Superintendencia de … · of the telecommunications in Costa Rica is known...
152
Sector Statistics COSTA RICA 2015 TELECOMMUNICATIONS
Transcript of COSTA RICA - SUTEL: Superintendencia de … · of the telecommunications in Costa Rica is known...

Sector StatisticsCOSTA RICA2015
TELECOMMUNICATIONS

First EditionMay 2016 Design, diagramming and print:Ingenio, Arte y Comunicación, S.A.Tel: 2293-6827
310 ISSN: 2215-3683S959e
Telecommunications Sector Statistics. Costa Rica. 2015Amador, Mauricio; Arias, Cinthya; Calderón, Laura; Castillo, Patricia; Cerdas, Bernarda; Cortés, Ileana; García, Juan Gabriel; Herrera, Walther; Irigaray, Erick; Mejías, Karla; Molina, Laura; Ovares, Juan Carlos; Quesada, Leonardo; Rodríguez, Rodolfo; Rodríguez, Victoria; Ruiz, Max; Segura, Ana Lucrecia; Vargas, David.
Superintendence of Telecommunications (SUTEL). –[San José, Costa Rica]. SUTEL, 2016150 pages: tables, graphics: 21.59 cm x 27.94 cm
1. STATISTICS; 2. TELECOMMUNICATIONS; 3. COSTA RICA

Content
Message from the President of the Council ofthe Telecommunications Superintendence ...........................................................4
Presentation: Telecommunications Market in Costa Rica ....................................... 7
Methodology and description of services .......................................................... 9
Chapter 1 General evolution of the industry .....................................................25
Chapter 2 Fixed telephony ............................................................................ 37
Chapter 3 Mobile phones ............................................................................. 51
Chapter 4 Data Transfer ..............................................................................65
Chapter 5 Paid television ............................................................................. 101
Chapter 6 Prices and rates ......................................................................... 109
Chapter 7 International............................................................................... 127
Statistical appendix .................................................................................... 139
Acronyms ................................................................................................ 150
3

Message from the President of the Council of the Telecommunications Superintendence
The Telecommunications Superintendence (SUTEL) is pleased to present the report “Statistics of the Telecommunications Sector 2015”, where readers will find for the fourth consecutive year, the main indicators of the different telecommunication services offered in our country.
On this occasion, the report showcases last year’s most relevant events, although it also highlights key moments between 2012 and 2015. Among the service indicators that were analyzed, the following highlight: subscriptions, revenue, traffic, investment, and human resources, among others.
Regarding available offer, SUTEL has a total of 139 authorized operators and suppliers. This amount confirms the growing trend, mainly
during the last year, whereby a 14 % increase is
expected, which is the highest
a m o u n t during the
2 0 1 0 -2 0 1 5 period.
In addition, it is worth noting that the amount of operators and suppliers with active commercial offers increased by 5 %, this evidences that Costa Rican users now have more options in the national market.
On 2015, the telecommunications sector generated 806 812 million colones in revenue, an amount 8 % greater than on 2014 (744 300 million colones). This represents, for the second consecutive year, a 3.1 % of the country’s Gross Domestic Product (GDP).
The total investment made by suppliers and operators in the rendering of their telecommunication services on 2015 remains the same for a third consecutive year, with an amount equal to 1 % of our GDP.
Nevertheless, it is important to point out that in absolute terms, investment in this sector grew 4 % in 2015 in contrast with 2014 (9 160 million colones). Smaller service suppliers and operators are investing and contributing to the growth of this indicator, as opposed to larger operators and service suppliers.
On a national level, given how the sector has matured since its opening, telecommunication services have shown great dynamism. For example, the amount
4

of subscribers of mobile services reached its historic maximum on 2015, with an additional 516 thousand subscribers.
According to the figures shown in the 2015 report, 59 % of the mobile traffic originates from the prepaid service, however a postpaid user consumes –on average- nearly 3 times more than a prepaid user and the main destination of their calls are on their own network, with 55 % of total traffic.
Ultimately, mobile telephony has been undergoing major transformations, which at the beginning of the opening were driven by the dynamics of the new offer, but within the last year it began to reflect variations in the tastes and preferences of local users, which are now familiar with having several options on the market.
Moreover, in regards to the data transfer service, over the last 4 years the use of Internet on mobile devices has increased. In 2012, the penetration rate was 57 % while in 2015 it was 101 %.
In regards to data traffic, it increased by 209 % between 2013 and 2015, unquestionably as the result in the change in user habits such as: instant messaging, file downloads, music and video streaming, photo sending, among others.
In the international context the report presents relevant facts such as standing second in the “Affordability Drivers Index”, given that Costa Rica shows one of the highest penetration rates for mobile broadband subscriptions among the countries analyzed in said index.
5

Mensaje de la Presidencia del Consejo de la SUTEL
Furthermore, according to international indicators, Costa Rica stands fifth in fixed telephony penetration, fifth in mobile telephony penetration, fourth in fixed Internet access penetration and first in mobile Internet access penetration in Latin America.
Parallel to the delivery of this fourth report, SUTEL is proud to present the Telecommunication Indicators System (SITEL), which is the result of institutional efforts, as well as the efforts made by network operators and telecommunications service providers.
In this sense and to improve the analysis and impact studies in the telecommunications sector, SITEL
provides a WEB application platform and a business intelligence solution that will enable SUTEL to build automated telecommunications market indicators and to –promptly- make them available both to the general public, as well as to network operators and providers.
I would like to thank the Directorate-General for Markets, Members of the Council and in general to all SUTEL’s employees for this commendable effort, which contributes to a continuous improvement in the growth and strengthening of the telecommunications sector.
Likewise, I thank the operators and telecommunications service providers for their trust and collaboration in this process, as well as for perpetuating their commitment to generate information to all Costa Ricans.
Manuel Emilio Ruiz GutiérrezPresident of the Council - SUTEL
Message from the President of the Council of the Telecommunications Superintendence
6

Presentation
Telecommunications Marketin Costa Rica
This annual report presents an overview of the latest developments in the telecommunications sector and is based on data that has been collected and processed according to international standards and internationally approved methodologies. It aims to stimulate the debate on telecommunications policies and to provide an objective performance evaluation of the country in the telecommunications field. It focuses on the analysis of the services with higher coverage provided to the population. Thus the Superintendence of Telecommunications and the Directorate-General for Markets have made available the Fourth Report of the Telecommunications Sector of Costa Rica, comprising the years from 2011 to 2015.
The methodology followed by this Superintendence is internationally recognized for its thoroughness in the
collection, validation and processing of data, as well as the results, which has allowed a
7

Presentation
proper perspective of the development of this services sector in the country. The status of the telecommunications in Costa Rica is known thanks to the joint efforts from the
operators, telecommunications service providers and the Superintendence.
The International Telecommunication Union has recognized the work of Costa Rica in this area, noting the rise of the country in the ICT Development Index. From position 80 in 2010, we have now moved in 2015 to place 57. Costa Rica was rewarded for such achievement at the World Telecommunications/ICT Indicators Symposium (WTIS) 2015, held in the city of Hiroshima, Japan.
This report reveals that the telecommunications sector in Costa Rica has been steadily growing from 2010 to 2015. I hope this document will be
useful for the formulation of strategies, analyzes and studies,
regardless if performed by service providers, academics, statesmen or governmental authorities.
Finally I want to express gratitude to operators and telecommunications service providers, who have believed in this project and that every day, with reliable data delivery, make possible the production of this type of instruments.
Walther Herrera CantilloDirector
SUTEL, Directorate-General for Markets
8

MethodologyThis is the fourth consecutive annual publication of this report on the “Statistics of the Telecommunications Sector in Costa Rica”. Along with the information of 2015, changes to the data from previous years are included, which arose from justified corrections provided by operators and service providers. Likewise, reports from companies that recently entered the regular statistic reporting process are also included.
As in previous reports, the procedure used for the production of performance indicators of the Costa Rican telecommunications sector comprises three phases: data collection, data review and analysis, and data reporting.
Figure 1Process of collecting, reviewing & analyzing, and releasing the performance indicators of the telecommunications sector
Each one of the stages of data collection and construction of indicators included in this report are detailed below.
Data Collection
As in previous years, the Data Collection stage involves several processes, including the compilation of the information using structured Excel templates. These templates are filled in by the operators and sent in the official layout by email to the email addresses created for that purpose: [email protected] and [email protected]. In addition, hard work has been carried out to maintain an open channel of communication with the operators and service providers, who also receive trainings, in order to ensure there is a proper understanding of the concepts and definitions associated with each indicator.
These activities are detailed below:
a. Release of the Data Collection Timetable: The Directorate-General for Markets released a timetable of activities about indicator management on the SUTEL website, in the Official Gazette (La Gaceta) and also in a national newspaper. This timetable was also officially sent to each one of the contacts appointed by the operators and telecommunications service providers.
This timetable included the deadlines for submitting the monthly, quarterly and semi-annual indicator templates; it also included the schedule for the Annual Workshop Event, in order to update and train the operators and providers, as well Source: SUTEL, Directorate-General for Markets.
1DataCollection
2Data Review& Analysis
3DataReporting
9

Methodology
as receiving feedback for the improvement of the data collection instruments.
As set out in this timetable, the operators and service providers must submit their monthly templates no later than 30 calendar days after the month closing, and the quarterly templates must be submitted no later than 30 calendar days after the quarter closing.
The schedule for the compilation of the 2015 indicators was published on December 19th 2014 in La Nacion and La República newspapers and in the Official Gazette of January 12, 2015.
b. Quarterly Reminders: In order to ensure the timely collection of information from the operators and telecommunication services providers, SUTEL sent out several reminders throughout the year, by email and by phone, to the contact list provided to submit information.
c. Update and Training Workshops for Operators and Providers: In 2015, SUTEL celebrated the third “Annual Indicators Workshop Event on the Telecommunications Sector”, from the 2nd to the 13th of February, 2015. The process of Data Collection to be carried out by the Directorate-General for Markets, was presented in detail. The purpose of this process was to build results reflecting the sector’s performance, explore the
indicator templates and emphasize on how important it is for the
regulator to have a robust and reliable base of indicators.
Overall, there were 160 representatives from the te lecommunicat ions service operators and providers, who work for 43 operators that are commercially active, as detailed below.
10

Methodology
Table 1Superintendence of Telecommunications: Attendance to the Annual Indicators Workshop Event for the Telecommunica-tions Market, February 2015
Date Service Operator Representatives
02/FEB/2015 Traditional Basic Phone Service Instituto Costarricense de Electricidad 6
04/FEB/2015 VoIP
American Data Networks 2Call My Way S.A. 1E-Diay S.A. 1Empresa de Servicios Públicos de Heredia (ESPH) 3Instituto Costarricense de Electricidad 1InterPhone S.A. 1Othos Telecomunicaciones S.A. 1Radiográfica Costarricense S.A. 2R & H International Telecom Services S.A. 1Telecable Económico T.V.E. S.A 5Televisora de Costa Rica S.A. (Cabletica, Tuyo Móvil) 2Millicom Cable Costa Rica, S.A. (TIGO) 1
Total 21
05/FEB/2015 Mobile Telephony
Claro Costa Rica CR 3Instituto Costarricense de Electricidad 6Radiográfica Costarricense S.A. 1Telefónica de Costa Rica TC S.A. 2Televisora de Costa Rica S.A. (Cabletica, Tuyo Móvil) 3
Total 15
09/FEB/2015 Internet Access
Almafamat de Costa Rica S.A. 2Anditel International AI, S.A. 2Cable Arenal del Lago S.A. 1Cable Caribe S.A. 1Cable Zarcero S.A (Mega Cable) 1Cable Visión de Costa Rica CVCR, S.A. 3Call My Way S.A. 1Claro Costa Rica CR 2Cooperativa de Electrificación Rural Los Santos R.L (COOPESANTOS R.L) 2
E-Diay S.A. 1Empresa de Servicios Públicos de Heredia (ESPH) 6GT Guatuso Trust INC. S.A. 1Millicom Cable Costa Rica, S.A. (TIGO) 2
Total 25
Continued ...
11

Methodology
Date Service Operator Representatives
10/FEB/2015 Internet Access
Blue Sat Servicios Administrados de Telecomunicaciones S.A. 1Cooperativa de Electrificación Rural de Guanacaste R.L. (COOPEGUANACASTE) 1
Cooperativa de Electrificación Rural de San Carlos R.L. (Coopelesca R.L.) 1
Instituto Costarricense de Electricidad 6Netsys C.R. S.A. 2OBCR Orange Business Costa Rica S.A. 1Radiográfica Costarricense S.A. 7Red Punto Com Technologies S.A. 1Redes Inalámbricas de C.R. (REICO) 2San Carlos Wireless S.A. 1Société Internationale de Télécomunications Aéronautiques (SITA) 2
Telecable Económico T.V.E. S.A 4Telefónica de Costa Rica TC S.A. 1Televisora de Costa Rica S.A. (Cabletica, Tuyo Móvil) 2Xarxes Networking S.R.L. 1
Total 33
11/FEB/2015 Leased Lines
American Data Networks 2BT Latam Costa Rica 3Call My Way S.A. 1Claro Costa Rica CR 2Columbus Networks S.A. 2Cooperativa de Electrificación Rural Los Santos R.L (COOPESANTOS R.L) 2
Costa Net S.A 1IBW Comunicaciones 1Instituto Costarricense de Electricidad 4Metro Wireless Solutions de Costa Rica MWS S.A. 1GT Guatuso Trust INC. S.A. 1RSL Telecom (Panamá) S.A. 1Radiográfica Costarricense S.A. 2Red Punto Com Technologies S.A. 1Redes Inalámbricas de C.R. (REICO) 2RSL Telecom (Panamá) S.A. 1San Carlos Wireless S.A. 1Telecable Económico T.V.E. S.A 4Televisora de Costa Rica S.A. (Cabletica, Tuyo Móvil) 2Millicom Cable Costa Rica, S.A. (TIGO) 1Wizard Comunications S.A. 1
Total 36
Continued ...
...Continuation
12

Methodology
...Continuation
Data Review& Analysis
Once the data is received, it is carefully reviewed and analyzed by the professional Indicators Team of the Directorate-
General for Markets. The review process verifies that
the submitted data does have the following characteristics:
• Complete data. The team verifies that the information requested with the forms to the operators and providers is complete. In case of missing information, the company responsible must include observations to justify its absence.
• Consistentfigures. The submitted figures must not reflect any mismatch with other periods, or with the data submitted by the same company to other domestic and/or foreign agencies, or to the SUTEL as part of other transactions. When an inconsistency is detected, the operator is notified and requested to provide a clarification or the appropriate correction.
Once this process is completed, the operators and service providers are notified about the status of the data they provided. If the submitted data meets the aforementioned criteria, a notification is sent and the data will then be systemized, in order to generate results. On the contrary, if the data provided failed to meet the criteria and needs to be clarified or corrected, a notification is sent with specific observations and the maximum response time.
Date Service Operator Representatives
13/FEB/2015 Subscription Television
Cable Caribe S.A. 1Cable Suiza S.A. 2Cable Talamanca S.A. 2Cable Visión de Costa Rica CVCR, S.A. 1Claro Costa Rica CR 2Cooperativa de Electrificación Rural de Guanacaste R.L. (COOPEGUANACASTE) 1
Cooperativa de Electrificación Rural de San Carlos R.L. (Coopelesca R.L.) 1
Empresa de Servicios Públicos de Heredia (ESPH) 3Instituto Costarricense de Electricidad 3Netsys C.R. S.A. 1Televisora de Costa Rica S.A. (Cabletica, Tuyo Móvil) 2Millicom Cable Costa Rica, S.A. (TIGO) 2Transdatelecom S.A 3
Total 24Source: SUTEL, Directorate-General for Markets.
13

Methodology
Additionally, to these review processes, various meetings were held with different operators, aiming to clarify the information required in the templates and sharing the observations made by SUTEL, regarding the data provided by them. Several inquiries by email and in digital form were addressed; as well as reminders sent to the operators, in order to obtain the required data on a timely and accurate manner.
Data Reporting
This stage consists on the creation of reports concerning the main results obtained from analyzing the data provided by operators and telecommunication service providers, as well as those gathered from secondary sources.
Because the Indicator Department is constantly receiving requests for information from agencies within SUTEL itself, as well as international organizations, institutions, companies and the general public, generating an indicator report is a recurring
necessity. This type of reports, along with the ones presented in this document, summarize the sector’s main results and statistics, including the main data for each of the services regulated by SUTEL: Fixed Telephony (both, basic traditional and VoIP), Mobile Telephony, Data Transfer (Internet Access and Leased Lines) and Subscription Television. Additionally, this report presents general data from the sector, such as total investment, total income and human resources employed.
Description of Telecommunication Services
In order to standardize and simplify the way in which the market data is collected from the service providers and operators, the telecommunication services available to the public have been classified based on the existing network and the signal type they carry. This classification is illustrated in Figure 2.
Figure 2General Classification of Services
Voice Transmission
Networks
Mobile Telephony
Fixed Telephony
Internet Access
Leased Lines
SubscriptionTelevision
DataNetworks
Television Networks
Source: SUTEL, Directorate-General for Markets.
14

Methodology
Telecommunications Services
All telecommunications services considered by the Directorate-General for Markets in this publication, are classified into three categories: Voice Services, Data Transfer Services and Subscription TV Services.
Mobile Telephony and Fixed Telephony services are included as part of the Voice Services. Mobile Telephony provides the users with two types of subscriptions: prepaid and postpaid payment method; having said this, it must be noted that the analysis and monitoring of this service is based on the amount of subscriptions, income, voice traffic and prices offered to the market.
On the other hand, the Fixed Telephony Service, as defined in Article 3 of the Regulation on the Protection Scheme of the Telecommunication Services for the End User (RPUF, Régimen de Protección al Usuario Final de los Servicios de Telecomunicaciones), will be classified into three different types of service: Traditional Basic Telephony (traditional basic phone service), IP Telephony (VoIP) and Public Telephony. As stated in Article 3 of the aforementioned regulation, all means of access are included in the Fixed Telephony Services, provided that the associated terminals do not allow mobility. These services are monitored by analyzing the income evolution, the number of subscribers and the voice traffic in the network.
The Data Transfer service is defined in Article 8, subsection 75 of the Rules for the Provision and Quality of Services; this article has subdivided this service in two markets,
as an analysis is performed: Internet Access and Leased Lines. In the first case, the following information is drawn: the number of subscribers, income reported by the companies and data traffic, classified by type of access network. As for the Leased Lines, the following data is drawn: number of connections, different technologies to provide the service and recorded income. Likewise, the subscription television service is analyzed by income and subscriptions per technology.
Summary of the Services Included in this Report
The following extract contains detailed telecommunication services currently provided with the appropriate authorization and commercializing modalities, as well as the features of the networks that support the service. Table 2
15

Methodology
Table 2Telecommunication Services Included in this Report
Telecommunication Service Category
Commercializing Modalities Features of the Supporting Networks
Mobile Telephony
Instant Messaging (SMS), Multimedia Messaging (MMS), Voice Post-paid, Voice Pre-paid.
It facilitates voice communications over wireless media access; it also allows sending and downloading data over the air interface. Its evolution is directed towards all-IP architecture.
Fixed TelephonyTraditional Basic Telephony, Voice over IP (VoIP), ISDN.
Known as PSTN, it uses a set of core exchange centrals and trunk links, in order to establish a temporary end-to-end connection, which is known as circuit switching. Furthermore, with the implementation of a softswitch and other active elements, you can interconnect the PSTN with any data network and provide a Voice over IP service.
Subscription Television Satellite TV, Cable TV, IPTV and MMDS TV
The service is provided by different technologies, it can be a satellite or wireless system based on DOCSIS 2.0 and superior. It can transmit data, so even if subscription television is not a telecommunications services, it is interesting to analyze its evolution.
Data Transfer
Internet Access, International Carrier, Mobile Data, Leased Lines.
Communications are achieved by generating data packets, which are forwarded through the network, regardless of the propagation medium or network used. It is based on two techniques: datagram routing and virtual circuits.
Source: SUTEL, Directorate-General for Markets.
Table 3Fixed Telephony Service Indicators, 2015
Indicator GeneralDefinition
Total Number of Active Fixed Telephone Lines
Total number of lines in service that have been properly assigned to a customer, when the service is not permanently suspended (Articles 12 and 34 of the RPUF) and which show at least one billable activity during the last month of the valuation or which remain as an existing contract to provide services with the operator.
VoIP Subscriptions / Active Lines
Number of active subscriptions to Active Fixed Lines, which use the Voice over IP Protocol (VoIP). This number should only include those VoIP Subscriptions showing to have generated inbound or outbound traffic during the last three months.Excluding: VoIP software applications (e.g., Skype P2P or PC to Phone VoIP).
ISDN, BRI & PRI Service Subscriptions
Total number of subscriptions to the Integrated Services Digital Network (ISDN), which can be separated into: Basic Rate Interface (BRI) and Primary Rate Interface (PRI) Services.
Summary of the Researched Indicators
This section contains general definitions for each indicator included in this report, in order
to provide clarity for the reader regarding the processed market data; volume and variety are expected to increase over time.
Continued ...
16

Methodology
Table 4Data Transfer Service Indicators, 2015
Indicator GeneralDefinitionActive Subscriptions to Fixed Wired Internet
Total amount of active subscriptions to Fixed Wired Internet Access (cable modem, xDSL, fiber optic and other fixed wired technologies).
Active Subscriptions to Fixed Wireless Internet
Total amount of active subscriptions to Fixed Wireless Internet Access (satellite, fixed WiMax and other fixed wireless technologies).
Active Subscriptions to Mobile Internet
Total amount of active subscriptions to Mobile Internet Access (both prepaid and postpaid, data card, mobile WiMax and other mobile technologies).
Active subscriptions to Dial-Up Internet
Number of active subscriptions to Dial-Up Internet. This service consists of an Internet connection via a modem and a fixed telephone line, in which the modem dials a phone number when Internet access is required.
Number of Leased Lines (Dedicated Links).
Number of Leased Private Connections. A leased line will connect two locations of voice and private data telecommunication service. These lines do not have a special cable but a reserved circuit between two points. Typically, companies lease these lines for their office connections, as they guarantee the necessary bandwidth for network traffic.
Internet Traffic This is the amount of transmitted / downloaded data (in Gigabytes) for all users of the Internet Access Service.
Total Income generated by dedicated lines Total amount of income billed by the dedicated line service altogether.
Maximum download speed offered Full Internet Speed offered for data download as part of the Internet Access Service.
Minimum download speed offered
Minimum Internet Speed offered for data download as part of the Internet Access Service.
Total income billed by Fixed Wired Internet Access
This is total amount of income billed, associated with the service of Fixed Wired Internet Access.
Total income billed by Fixed Wireless Internet Access
This is total amount of income billed, associated with the service of Fixed Wireless Internet Access.
Total income billed by Mobile Internet Access
This is total amount of income billed, associated with the service of Mobile Internet Access.
Source: SUTEL, Directorate-General for Markets.
Indicator GeneralDefinitionTotal Traffic of the Traditional Basic Telephony
Traffic pertaining to calls made through fixed telephone lines, both analog and digital.
Total VoIP Traffic Traffic pertaining to calls made via Fixed Managed VoIP Telephony (Voice over IP Protocol).
International Inbound Telephone Traffic Total traffic with an international origin and a fixed on net destination.
International Outbound Telephone Traffic Total on net traffic with a fixed origin and an international destination.
Total Income by Traditional Basic Telephony (retail)
Income generated in form of a Base Rate + Additional Minutes + other items associated with the fixed telephone service.
VoIP Total Income (retail) This indicator entails the income generated by a Base Rate + over + Additional Minutes + other items associated with the VoIP telephone service.
Source: SUTEL, Directorate-General for Markets.
...Continuation
17

Methodology
Table 5MobileTelephony Service Indicators, 2015
Indicator GeneralDefinitionActive Subscriptions to Postpaid Payment Method in Mobile
Total number of subscriptions to postpaid mobile cellular phones that pay a monthly fee, which show at least one billable activity during the month of the valuation and whose service is not in permanently suspended, as per Articles 12 and 34 of the RPUF.
Active Subscriptions to Prepaid Payment Method in Mobile
Total number of subscriptions to prepaid mobile cellular phones that show at least one billable activity in the balance of the service, within 90 calendar days prior to the final valuation and which are part of the prepaid platform.
Total Capacity of the Installed Mobile Lines
The maximum number of mobile lines that can be connected. This number includes those mobile lines already connected and those mobile lines available for future connections, including those used for the technical operation of the central (test numbers).
Mobile Traffic (Voice, SMS and MMS) This is the total traffic of the mobile phone service.
Mobile Traffic - Fixed Proprietary
Traffic originated from the proprietary mobile network (mobile on net) directed to a proprietary fixed network (fixed network of the same operator).
On Net Mobile Traffic Traffic originated from the wireless network directed to the same mobile network (on-net traffic).
Traffic Mobile - Other Mobile Networks
Traffic originated from the proprietary mobile network (mobile on net) directed to other mobile networks (mobile networks of other operators).
Traffic from Other Mobile Networks - Proprietary Mobile
Traffic originated from the mobile networks of other operators (mobile off net) directed to a proprietary mobile network (mobile on net)
Traffic from Proprietary Fixed Network - Proprietary Mobile Network
Traffic originated from the proprietary fixed network directed to the proprietary mobile network (mobile on net).
Traffic Mobile - Other Fixed Networks
Traffic originated from the proprietary mobile network (mobile on net) directed to other fixed networks (fixed off net).
Traffic from Other Fixed Networks - Proprietary Mobile
Traffic originated from fixed networks of other operators (fixed off net) directed to a proprietary mobile network (mobile on net)
Traffic Mobile - International
Traffic originated from the proprietary mobile network (mobile on net) directed to an international destination (international off net).
Traffic International Networks - Proprietary Mobile
Traffic originated from international networks (international off net) directed to a proprietary mobile network (mobile on net)
Mobile Transit TrafficOff net traffic (from other fixed networks, mobile networks and international long distance) directed to off net (other fixed networks, mobile networks and international long distance), passing through the proprietary mobile network.
Total Mobile Voice Traffic by Payment Method
It’s the sum of mobile voice traffic by payment method (prepaid and postpaid). In determining this indicator, one must add the on net traffic plus the outbound off net traffic.
Postpaid on net SMS trafficTotal Mobile Voice Traffic: On net mobile voice traffic + total off net mobile voice traffic (outbound mobile voice traffic to other mobile networks, to the proprietary fixed network, to other fixed networks and to international networks).
Prepaid on net SMS traffic
Short Message Service (SMS) traffic exchanged between subscribers within the same mobile network, in the postpaid payment method.
Continued ...
18

Methodology
Indicator GeneralDefinition
Postpaid off net SMS traffic Traffic from the Short Message Service (SMS) exchanged between subscribers within the same mobile network, in the prepaid payment method
Prepaid off net SMS traffic Traffic from the Short Message Service (SMS) sent and received by subscribers to the mobile telephony service in the postpaid payment method.
Postpaid and prepaid SMS traffic sent domestically
Traffic from the Short Message Service (SMS) sent and received by subscribers to the mobile telephony service in the prepaid payment method.
SMS traffic sent to international destinations, both postpaid and prepaid
Traffic from the Short Message Service (SMS) sent to domestic destinations, from mobile phones in the postpaid and prepaid payment method.
Postpaid on net MMS traffic Traffic from the Short Message Service (SMS) sent to international destinations, from mobile phones in the postpaid and prepaid payment method.
Prepaid on net MMS traffic Traffic from the Multimedia Messaging Service (MMS) exchanged between subscribers within the same mobile network, in the postpaid payment method.
Postpaid off net MMS traffic Traffic from the Multimedia Messaging Service (MMS) exchanged between subscribers within the same mobile network, in the prepaid payment method.
Prepaid off net MMS traffic Traffic from the Short Message Service (SMS) sent and received by subscribers to the mobile telephony service in the postpaid payment method.
MMS traffic sent domestically, postpaid and prepaid
Traffic of the Multimedia Messaging Service (MMS) sent and received by subscribers to the mobile telephony service in the prepaid payment method.Excluding: The on net MMS traffic.
MMS traffic sent to international destinations, both postpaid and prepaid
Traffic of the Multimedia Messaging Service (MMS) sent to domestic destinations from mobile phones in the postpaid and prepaid payment method.
Outbound roaming telephone traffic
Traffic of the Multimedia Messaging Service (MMS) sent to international destinations from mobile phones in the postpaid and prepaid payment method.
Inbound roaming telephone traffic
Total number of traffic minutes of communications carried out by proprietary customers through local networks in roaming modality with foreign networks, when outside the service area of the local network (outbound roaming).
Outbound SMS and MMS international roaming traffic
Total number of traffic minutes of communications received by proprietary customers through local networks in roaming modality with foreign networks, when outside the service area of the local network (outbound roaming).
Inbound SMS and MMS international roaming traffic
Traffic generated by mobile resident subscribers when sending SMS and MMS while out of the service area of their home network.
Inbound roaming data traffic (TB)
Traffic generated by mobile resident subscribers when receiving SMS and MMS while out of the service area of their home network (inbound roaming).
Outbound roaming data traffic (TB)
Traffic broadcast (TB) by resident subscribers when accessing the Internet service while out of the service area of the local network (inbound roaming).
Average RatesTraffic received (TB) by resident subscribers when accessing the Internet service while out of the service area of the local network (outbound roaming).These are the average call rates from a mobile phone (prepaid or postpaid).
Average rate of a local 1-minute call (peak hour, on net) for mobile cellular telephony
Rate of a local 1-minute call, made during peak hours from a mobile phone. The calculation of this indicator can be made based on the distribution of the income generated by mobile on net calls (prepaid or postpaid), made during the time slot considered to be “peak” or high consumption, divided by the amount of minutes used (traffic) on these calls. It includes taxes.
Continued ...
...Continuation
19

Methodology
Indicator GeneralDefinition
Average rate of a local call per minute (off-peak, on net) for mobile cellular telephony
Rate of a local 1-minute call, made on off-peak hours from a mobile phone (prepaid or postpaid) to another mobile phone within the same network. The calculation of this indicator can be made based on the distribution of the income generated by prepaid mobile on net calls, made during the time slot considered to be “off-peak” or low consumption, divided by the amount of minutes used (traffic) on these calls. It includes taxes.
Average rate of a local call per minute (off-peak, off net) for mobile cellular telephony
Rate of a local off-peak call per minute, made from a mobile phone (prepaid or postpaid) to a mobile phone on another network. The calculation of this indicator can be made based on the distribution of the income generated by prepaid mobile off net calls, made during the time slot considered to be “off-peak” or low consumption, divided by the amount of minutes used (traffic) on these calls. It includes taxes and the applicable tax rate.
Average rate of a local mobile call per minute (during peak hours) to a fixed network
Rate of a local call per minute in peak hours, made from a mobile phone (prepaid or postpaid) to the fixed telephony network. The calculation of this indicator can be made based on the distribution of the income generated by mobile prepaid calls to a fixed network, made during “peak” hours, divided by the amount of minutes used (traffic) on these calls. It includes taxes.
Average rate of a local mobile call per minute (off-peak) to a fixed network
Rate of a local call per minute, on off-peak hours, made from a mobile phone (prepaid or postpaid) to the fixed telephony network. The calculation of this indicator can be made based on the distribution of the income generated by prepaid mobile calls, made during off-peak hours, divided by the amount of minutes used (traffic) on these calls. It includes taxes and the applicable tax rate.
Average rate of a local mobile call per minute (on peak hours, off net)
Rate of a local call per minute in peak hours, made from a mobile phone (prepaid or postpaid) to a mobile phone on another network. The calculation of this indicator can be made based on the distribution of the income generated by prepaid mobile off net calls, divided by the amount of minutes used (traffic) on these calls. It includes taxes and the applicable tax rate.
Average rate of a local mobile call per minute (weekend / nighttime, on net).
Rate of a local call per minute on a weekend / during nighttime, made from a mobile phone (prepaid or postpaid) to another mobile phone in the same network. Taxes must be included. Otherwise, a note should be included showing the applicable tax rate.The calculation of this indicator can be made based on the distribution of the income generated by prepaid mobile on net calls, made on the weekend / during nighttime, divided by the amount of minutes used (traffic).It includes taxes.
Average rate of a local mobile call per minute (on the weekend / during nighttime, off net).
Rate of a local call per minute made on the weekend / during nighttime from a mobile phone (prepaid or postpaid) to a mobile phone on another network. The calculation of this indicator can be made based on the distribution of the income generated by prepaid mobile off net calls, made on the weekend / during nighttime, divided by the amount of minutes used (traffic). It includes taxes and the applicable tax rate.
Average rate of a local mobile call per minute (on the weekend / during nighttime) to a fixed network.
Rate of a local call per minute made on the weekend / during nighttime from a mobile phone (prepaid or postpaid) to a fixed telephony network. The calculation of this indicator can be made based on the distribution of the income generated by mobile prepaid calls to a fixed network, on the weekend or during nighttime, divided by the amount of minutes used (traffic).It includes taxes and the applicable tax rate.
...Continuation
Continued ...
20

Methodology
Indicator GeneralDefinition
Average SMS rate (on net) for mobile telephony, both prepaid and postpaid.
Average rate of sending a SMS message from a mobile phone (prepaid or postpaid) to another mobile phone in the same network. The calculation of this indicator can be made based on the distribution of the income generated, divided by the number of on net SMSs. It includes taxes.
SMS average rate (off net) for mobile telephony, both prepaid and postpaid.
Average rate of sending a SMS message from a mobile phone (prepaid or postpaid) to another mobile phone on another network. The calculation of this indicator can be made based on the distribution of the income generated, divided by the amount of off net SMSs. It includes taxes and the applicable tax rate.
Income generated by the mobile telephony service, both prepaid and postpaid.
Income related to the mobile telephony service, both prepaid and postpaid. It can be calculated by adding the income generated by the monthly fees, the income generated by the use of off-plan minutes and the amount of charges made as part of other fees of the mobile phone service, such as fines for suspension and reconnection.
Income generated by on net Mobile Voice Traffic, both prepaid and postpaid.
Income related to the mobile voice traffic, originated in the proprietary mobile network (mobile on net) directed to the same mobile network (mobile on net).
Income generated by the outbound mobile voice traffic, both prepaid and postpaid
Income related to the mobile voice traffic, originated in the proprietary mobile network (mobile on net), directed to an off net destination (proprietary fixed network, other fixed networks, other mobile networks, international networks).
Income generated by monthly subscription fees or by the minimum prepaid and postpaid fees.
Income generated by the collection of recurring charges billable for the subscription to the mobile telephony service, both prepaid and postpaid.
Income generated by off-plan minutes in the fixed mobile telephony service, both prepaid and postpaid
Income related to the off-plan minutes or with minutes that are not covered by the minimum fee of the prepaid and postpaid services.This includes off-plan minutes for domestic and international calls.
Income generated by the inbound mobile voice traffic, both prepaid and postpaid.
Income related to an off net originated traffic (proprietary mobile network, other fixed networks, other mobile networks, international networks) directed to an on net destination (proprietary fixed network).
Income generated by the international outbound mobile voice traffic, both prepaid and postpaid.
Income related to the mobile voice traffic, originated in the proprietary mobile network (on net mobile), directed to an international off net destination.
Income generated by international inbound mobile voice traffic, both prepaid and postpaid
Income related to the traffic that has an off net international origin and an on net destination (proprietary mobile network).
Income generated by number of on net SMSs, both postpaid and prepaid.
Revenue related to the traffic of SMS messages, exchanged between users in the same mobile network, both in the postpaid and prepaid modes.
Income generated by the number of off net SMSs, both postpaid and prepaid
Revenue related to the traffic of SMS messages, sent to domestic and international destinations from mobile phones, in the postpaid service.
Income generated by the number of on net MMSs, both postpaid and prepaid.
Revenue related to the traffic of MMS messages, exchanged between users of the same mobile network, in the postpaid modality.
...Continuation
Continued ...
21

Methodology
Indicator GeneralDefinitionIncome generated by the number of off net MMSs, both postpaid and prepaid.
Income related to the traffic of Multimedia Messaging Service (MMS) messages, sent to domestic and international destinations from mobile phones, in the postpaid modality.
Income generated by MMSs sent domestically, both postpaid and prepaid.
Income related to the total traffic of multimedia (MMS) messages, sent to domestic destinations. Messages sent from a computer to another computer are not included, nor those sent from a computer to a mobile phone.
Income generated by MMSs sent to an international destination, both postpaid and prepaid.
Income related to the total traffic of multimedia (MMS) messages, sent to international destinations. Messages sent from a computer to another computer are not included, nor those sent from a computer to a mobile phone.
Income generated by the number of SMSs sent domestically, both postpaid and prepaid.
Income related to the traffic of SMS messages, sent to domestic and international destinations from mobile phones.
Income generated by the amount of SMSs sent to international destinations, both postpaid and prepaid.
Income related to the traffic of SMS messages sent to international destinations from mobile phones.
Income generated by the total number of MMSs.
Income related to the total traffic of MMS messages sent to domestic and international destinations. Messages sent from a computer to another computer are not included, nor those sent from a computer to a mobile phone.
Income generated by outbound roaming telephony traffic (minutes)
Income generated by proprietary subscribers to mobile phones when making and receiving calls while outside the service area of the home network, e.g. when traveling abroad.
Income generated by inbound roaming telephony traffic (minutes)
Income generated by visiting subscribers (foreigners) when making and receiving calls within a country. This income is attained by the network operators in the country visited by these subscribers.
Income generated by outbound roaming SMS and MMS messages
Income generated by the proprietary subscribers to a mobile network when sending SMSs and MMSs while out of the service area of their home network.
Income generated by inbound roaming SMS and MMS messages
Income generated by the traffic created by visiting subscribers (foreigners) when receiving SMS and MMS messages. This income is attained by the network operators in the country visited by these subscribers.
Inbound roaming data traffic (TB)
Income generated by the traffic created by visiting subscribers (foreigners) when accessing the Internet. This income is attained by the network operators in the country visited by these subscribers.
Outbound roaming data traffic (TB)
Income generated by the proprietary subscribers to a mobile network when accessing the Internet while they are outside of the service area of their home network.
Wholesale income generated by the mobile telephony service
Wholesale income related to the delivery of the mobile telephony service. Specifically, this refers to the income generated by the termination charges of the calls on their proprietary mobile This indicator is calculated based on the income received by the inbound traffic into the proprietary mobile network (IDM75).
Source: SUTEL, Directorate-General for Markets.
...Continuation
22

Methodology
Table 6Subscription Television Service Indicators, 2015
Indicator GeneralDefinitionTotal number of subscriptions to the service of Multichannel Cable TV.
Number of subscriptions to Multichannel TV, broadcast by land via hybrid networks of fiber optic and coaxial cable (HFC). These networks allow the delivery of other telecommunication services.
Total number of subscriptions to Multichannel TV through DTH antennas.
Number of subscriptions to Multichannel TV, corresponding to TV signals received from a telecommunications satellite and broadcast from the operator to the end user's receiver.
Total number of subscriptions to Multichannel TV via IPTV.
Number of subscriptions to Multichannel TV via broadband connections over IP protocol.
Total number of subscriptions to Multichannel TV by Multipoint Microwave Distribution Service (MMDS)
Number of subscriptions to Multichannel TV, using Multipoint Microwave Distribution Service (MMDS), which broadcasts the signals wirelessly to the end user. This service allows for the delivery of other telecommunications services.
Income generated by Subscription TV (income generated by subscriptions, connections, basic plans and added value).
Total income billed by Subscription TV, without any deductions (taxes, returns, rebates, allowances, discounts, canceled sales, etc.), obtained by the Subscription TV service providers in the country.
Source: SUTEL, Directorate-General for Markets.
23


General evolution of the industry
Chapter 1

General evolution of the industry
In this section, as in previous reports, the behavior of the telecommunications industry, in terms of revenue, investment and human resources, among other indicators, is hereby presented for the 2010-2015 period. These results will be discussed in greater detail below.
Composition of the available supply
In regards to the number of telecom operators and providers, by the end of 2015, 139 operators and service providers had been authorized by SUTEL to provide telecommunication services. This figure is evidence that the available supply of telecom operators and service providers continues to increase, especially in the last year, in which the available supply rose to a record high 14 %; the highest value recorded in the 2010-2015 period.
It is important to note that, in preparing this report, only those companies that were currently engaged in providing telecommunications services, and had received the proper authorization to do so, were taken into consideration; including the 7 franchised operators that currently manage and control the radio spectrum.
Table 7 shows the percentage and total number of telecom operators and service providers that submitted their respective performance indicator reports and addressed, in a timely manner, the observations made by SUTEL, and are therefore included in this study.
In this matter it is important to clarify that not all authorized operators and service providers were marketing their services in the periods of analysis referenced herein. For this reason, when calculating these statistics, the total number of operators and/or service providers does not necessarily equal the total number of service suppliers available. Furthermore, each authorized service provider and/or operator may provide more than one type of service and comply, or fail to comply, with the necessary requirements to receive authorization to actively market the services provided, which give rise to multiple limitations in terms of the longitudinal analysis of data collected.
88 % of all operators and service providers (whether authorized, franchised or both) were included in the 2010-2015 industry performance report; they represent 97% of the total subscriptions, and 97 % of the total revenue generated, in each and every one of the services under study. Table 8 shows the percentage of operators that contributed to the study, classified by type of service.
The authorized services that were not included in this report, in accordance with the definition of service laid forth by SUTEL in 2013, were: geo-location, video conferencing, and trunking. The reason being that these services require the allocation, by means of concession, of frequencies of the radio spectrum for private commercial use. The telecommunications network used to provide these services is therefore classified as private and, as decided by SUTEL, private networks cannot be connected to public
General evolution of the industry
26

General evolution of the industry
telecom networks. As such, these services are not considered available to the public and are not subject to the other provisions of law.
Revenue generated by the industry
When analyzing the total revenue generated by the telecommunications industry, it is important to be aware that the services under analysis include fixed telephony, mobile telephony and data transfer, but exclude cable subscriptions, as these are not considered a telecommunications service. In accordance to paragraph 123 of Agreement No. 022-089-2011, “Review of the Current List of Tariffs”, SUTEL only monitors the transfer of information related to cable subscriptions, and not the service per se. As such, it is impossible to determine which part of the network is used to transfer data, and which part of the network is used to generate content.
The revenue generated by the telecommunications industry in 2015 amounted to 806 812 million Colones, 8 % higher than in 2014 (744 300 million Colones) and 84 % higher than in 2011 (437 672 million Colones. See graph 1 below.
The revenue-to-gross-domestic-product (GDP) ratio, in percentage terms, remains at 3.1 % for the second consecutive year. Nevertheless, as stated above, the total revenue generated by the industry continues to grow in terms of absolute value, but to a lesser extent than in the other years of the 2011-2015 period. See graph 2 below.
In regards to the total revenue generated by the industry, it is important to note that by the end of 2015, mobile voice telephony services remain the primary source of income for the industry, despite a 1.2 relative percentage decrease in 2015, when compared to other services. On the one hand, fixed telephony continued its downward trend, as it recorded 1.7 percentage decrease in relation to 2014. Likewise, but to a lesser extent, the dedicated line service exhibited a 1-point percentage decrease in 2015. On the other hand, fixed telephony internet access and mobile telephony internet access continues to increase, and remains the second largest service in terms of revenue. See graph 3 below.
Fixed telephony
The fixed telephony service, which includes the traditional basic telephone service as well as the VoIP service, continues its downward trend and recorded a 3 % decrease in 2011-2014, going from 88 614 million Colones to 80 531 million Colones, mainly due to a decrease in revenue generated by the traditional basic telephone service. In 2014, however, the trend shifted upwards in relation to the previous years (92 830 million Colones). Nevertheless, in 2015 the fixed telephony revenue amounted to 86 476 million Colones, a 7 % decrease compared to 2014.
Mobile telephony and internet access
The total revenue generated by the mobile voice telephony service in 2015 amounted to 412 742 million Colones; a 5 % increase in relation to 2014 and the highest recorded
27

General evolution of the industry
value in 2011-2015. In the last year of the period, however, despite a slowdown in the service’s rate of growth, it remains the service with the greatest revenue/yield in the telecommunications market.
Moreover, when considering the total revenue generated by the mobile network as a whole
(i.e.: including voice and data services), 2015 recorded a 12 % increase in relation to 2014, going from 518 631 million Colones to 583 116 million Colones. This situation is in stark contrast with the information recorded in 2013-2014, when there was a 34 % increase mainly due to the growth in the revenue generated by the mobile internet access service, which rose from 127 198 million Colones in 2014 to 170 422 million Colones in 2015.
In regards to the percentage distribution of these two components, in 2015 the
revenue generated by the voice service represented 71 % of the total
revenue, whereas internet access represented the remaining 29 %;
continuing the trend exhibited in 2013 and 2014. In 2015, however, the percentage composition shifted in favor of mobile internet access. There was a slight slowdown in the service’s rate of growth; in 2013-2014 the revenue generated by this service rose from 94 006 million Colones to 127 198 million Colones (a 35 % increase), whereas in 2015,
as was previously stated, that same service recorded a
34 % increase.
Internet access (excluding mobile internet access)
In 2015, the revenue generated by the wired and wireless fixed internet service
amounted to 96 970 million Colones; a 5 % increase in relation to 2014. The rate of
28

General evolution of the industry
growth is mainly determined by the behavior of the revenue generated by the wired fixed internet access service, which once more rose (but to a lesser extent than a year prior) by 7 %; going from 86,644 million Colones in 2014, to 95 590 million Colones in 2015. The wireless fixed internet service, however, presented a -22 % decrease between 2014 and 2015, as it went from 5607 million Colones to 4381 million Colones.
Dedicated lines
In 2015, the revenue generated by the dedicated line service presented a downward trend for the second consecutive year; the revenue decreased from 40588 million Colones in 2014 to 36 202 million Colones in 2015 (-10.8 %).
Total investment
The total investments made by operators and service providers in furtherance of telecommunications services in 2010-2015 (i.e.: total-investment-to-GDP ratio, in percentage terms), as in previous reports, recorded its greatest increase in the 2010-2011 biennium, in which the total-investment-to-GDP ratio rose from 0.8 % to 2.1 %. This ratio continued with its upward trend until 2012, when it peaked at 2.4 %. See graph 6 below.
In 2015, the ratio remained constant for the third consecutive year, with a total-investment-to-GDP ratio of 1%. However, it is important to note that, in terms of absolute value, the total investment in 2015 rose to 4 % in relation to 2014 (9160 million Colones). The justifications for this behavior
are twofold: (i) as a result of the growth presented by the second component of the GDP; and (ii) despite the entry of new operators and service providers, a large part, and the most representative sample, of these new service providers made significantly large investments in previous years to install a reliable telecommunications network infrastructure to offer their services. Moreover, it is important to note that this indicator measures the amount of new investments made in each period, and not the total accumulated investments made by each operator and service provider.
Human resources
The number of human resources directly employed in the telecommunications industry continued its upward trend, going from 11 002 employees in 2014 to 11 426 employees in 2015 (a 4 % increase).
The total-workforce-employed-in-the-industry-to-total-economically-active-population ratio remained at 0.5 % for the third consecutive year. Moreover, the total-workforce-employed-in-the-industry-to-total-population ratio has remained at 0.2 % (11 426 employees) since 2011.
The employment-to-population of women in the telecommunications industry continues to rise, going from 2911 women in 2014 to 3010 women in 2015. In 2015, this ratio, in addition to the total employment ratio, continues to grow but to a lesser extent than in the previous three years, when the employment-to-population ratio of women recorded 3 %, 4 %, and 2 % increases, respectively.
29

General evolution of the industry
Graphic N° 1Costa Rica: Total revenue generated by, and percentage variations in,
the telecommunications industry, 2011-2015In percentage (%) and in millions of Colones (CRC)
437 672501 648
576 742
744 300802 812
15 % 15 %
29 %8 %
2011 2012 2013 2014 2015Source: SUTEL, Directorate-General for Markets.
Graphic N° 2Costa Rica: Total revenue generated by the telecommunications industry as
percentage of GDP, 2011-2015In percentage (%)
2.3 % 2.4 % 2.6 %
3.1 % 3.1 %
2011 2012 2013 2014 2015Source: SUTEL, Directorate-General for Markets.
Graphic N° 3Costa Rica: Total revenue generated by the telecommunications industry
by type of service, 2011-2015In millions of Colones (CRC)
2011 2012 2013 2014 2015Mobile telephony (voice only)Internet access (includesMobile Internet)Traditional basic telephonyand VoIP telephonyDedicated lines
239 405 273 342 293 197 391 433 412 742
85 119 108 920 161 914 219 449 267 392
88 614 85 334 80 531 92 830 86 476
24 535 34 052 41 101 40 588 36 202Source: SUTEL, Directorate-General for Markets.
30

General evolution of the industry
Graphic N° 4Total revenue generated by the telecommunications industry by type
of service, 2011-2015In percentage (%)
2011 2012 2013 2014 2015
Mobile telephony (voice only) Internet access (includes Mobile Internet)Traditional basic telephony and VoIP telephony Dedicated lines
55 % 54 % 51 % 53 % 51 %
19 % 22 % 28 % 29 % 33 %
20 % 17 % 14 % 13 % 11 %6 % 7 % 7 % 5 % 5 %
Source: SUTEL, Directorate-General for Markets.
Note: The revenue generated by the mobile telephony service includes the revenue generated by the mobile internet service.Source: SUTEL, Directorate-General for Markets.
Graphic N° 5Costa Rica: Total revenue generated by the telecommunications industry by type
of service, 2011-2015In percentage (%)
Dedicated lines Fixed Internet access
Traditional basic telephony and VoIP telephony Mobile telephony and mobile Internet access(Mobile network)
2011 2012 2013 2014 2015
60 % 63 % 67 % 70 % 73 %
20 % 17 % 14 % 13 % 11 %14 % 13 % 12 % 12 % 12 %6 % 7 % 7 % 5 % 4 %
Source: SUTEL, Directorate-General for Markets and BCCR.
Graphic N° 6Costa Rica: Total revenue generated by the telecommunications industry as
percentage of GDP, 2010-2015In percentage (%)
0.80 %
2.10 %2.40 %
0.96 % 1.01 % 0.99 %
2010 2011 2012 2013 2014 2015
Perc
enta
ge
Year
31

General evolution of the industry
Graphic N° 7Costa Rica: Workforce employed in the telecommunications industry, 2010-2015
In absolute values
7835
9618 9900 10 442 11 002 11 426
2010 2011 2012 2013 2014 2015Source: SUTEL, Directorate-General for Markets.
Graphic N° 8Costa Rica: Workforce employed in the telecommunication sector with respect
to the total population, 201-2015In percentage (%)
0.4 %
0.4 % 0.4 % 0.5 % 0.5 % 0.5 %
2010 2011 2012 2013 2014 2015Source: SUTEL, Directorate-General for Markets and INEC.
Source: SUTEL, Directorate-General for Markets and INEC.
Graphic N° 9Costa Rica: Workforce employed in the telecommunication sector with respect
to the economically active population, 2010-2015In percentage (%)
0.2 %0.2 % 0.2 % 0.2 % 0.2 % 0.2 %
2010 2011 2012 2013 2014 2015
32

General evolution of the industry
Source: SUTEL, Directorate-General for Markets and INEC.
Graphic N° 10Costa Rica: Female work force in telecommunication sector, 2013-2015
In absolute values (per semester)
2792
2873
2811
2911
2963
3010
I Semester 2013 II Semester 2013 I Semester 2014 II Semester 2014 I Semester 2015 II Semester 2015
Table 7Total number of telecom operators and service providers, 2011-2015
2011 2012 2013 2014 2015
Total number of authorized companies 108 118 117 122 139
Response rate 89 % 89 % 84 % 84 % 88 %
Source: SUTEL, Directorate-General for Markets.
Table 8Costa Rica: Percentage distribution of companies included in the sector indicators report, by service , 2011-2015
2011 2012 2013 2014 2015
Fixed telephony 100 % 100 % 92 % 94 % 94 %
Mobile telephony 100 % 100 % 100 % 100 % 100 %
Data transfer 98 % 98 % 97 % 98 % 97 %
Subscription television 100 % 100 % 100 % 100 % 100 %
Source: SUTEL, Directorate-General for Markets.
33

General evolution of the industry
Table 9Summary of relevant performance indicators of the Costa Rican telecommunications industry, 2011-2015
Performance indicators 2011 2012 2013 2014 2015Industry’s aggregated dataTotal revenue (in millions of Colones)** 437 672 501 648 576 742 744 300 802 812
Total revenue/GDP (%) 2.3 % 2.4 % 2.6 % 3.1 % 3.1 %Total investment/GDP (%) 2.1 % 2.4 % 1.0 % 1.0 % 1.0 %Total workforce employed 9618 9900 10 442 11 002 11 426Total workforce employed/total economically active population 0.4 % 0.4 % 0.5 % 0.5 % 0.5 %
Fixed telephonyTotal subscriptions 1 031 719 995 089 968 459 881 217 859 514Total subscriptions/100 Costa Rican citizens 22 % 21 % 21 % 18 % 18 %
Total subscriptions/100 Costa Rican households 80 % 75 % 72 % 63 % 60 %
Total basic subscriptions (fixed telephony) 1 027 847 976 824 936 035 839 968 804 468
Total VoIP subscriptions 3872 18 265 32 424 41 249 55 046Total number of public phones 18 960 16 348 13 145 8188 5726Mobile telephonyTotal subscriptions 4 135 185 5 348 881 7 059 471 7 020 412 7 535 599Prepaid subscriptions 2 872 496 4 211 766 5 831 878 5 598 911 5 951 337Postpaid subscriptions 1 262 689 1 137 115 1 227 593 1 421 501 1 584 262Total subscriptions/100 Costa Rican citizens 90 % 115 % 150 % 147 % 156 %
Prepaid subscriptions/total subscriptions 69 % 79 % 83 % 80 % 79 %
Postpaid subscriptions/total subscriptions 31 % 21 % 17 % 20 % 21 %
Data transferTotal subscriptions with internet access 2 008 763 3 118 155 4 028 302 4 806 217 5 420 554
Total subscriptions with internet access (fixed telephony: wired) 414 384 439 043 474 433 503 347 545 813
Total subscriptions with internet access (fixed telephony: wireless)
5398 8904 10 450 12 493 12 843
Total subscriptions with internet access (mobile telephony) 1 588 981 2 670 208 3 543 419 4 290 377 4 861 898
Total subscriptions with internet access (fixed telephony)/100 Costa Rican citizens
9 % 10 % 10 % 11 % 12 %
Continued ...
34

General evolution of the industry
Total subscriptions with internet access (fixed telephony)/100 Costa Rican households
32 % 34 % 36 % 37 % 39 %
Total subscriptions with internet access (mobile telephony)/100 Costa Rican citizens
35 % 57 % 75 % 90 % 101 %
Total subscriptions with internet access (mobile telephony)/total subscriptions (mobile telephony)
38 % 50 % 50 % 61 % 65 %
Total number of dedicated line connections 10 273 11 993 16 375 16 286 14 093
Cable subscriptionsTotal subscriptions 498 137 540 693 641 042 732 546 797 230Total subscriptions/100 Costa Rican citizens 11 % 12 % 14 % 15 % 16 %
Total subscriptions/100 Costa Rican households 38 % 41 % 48 % 52 % 56 %
Other reference indicatorsTotal population 4 592 149 4 652 459 4 713 168 4 773 130 4 832 234Gross domestic product at basic prices (in millions of Colones) 18 952 080 207 501 928 22 451 325 24 358 070 25 629 763
Total Costa Rican households 1 297 522 1 326 805 1 348 036 1 399 271 1 436 120Notes:** These figures do not include capital gains and/or revenue for cable subscriptions.Source: SUTEL, Directorate-General for Markets, INEC and BCCR.
...Continuation
35


Fixed telephony
Chapter 2

Fixed telephony
Subscribers
According with the trend of the last years, during the year 2015, fixed telephony (traditional basic and VoIP) shows a decrease in the number of subscribers. From the 1 031 079 subscribers who had the fixed telephone service in 2011, at the end of the year 2015 only 859 514 clients remained with the service, as specified in table 39 of the Annex. Nevertheless, the reduction in this last year (21 704 subscribers, which is equivalent to 2.5 %) is less than the average for the three previous years (50 167 subscribers, that is an annual decrease of 5.1 %).
Considering that fixed telephony comprises both, the traditional basic phone service and the voice over IP (VoIP) service, the above-stated table evidences the behavior differences between the subscribers of both technologies. Thus, while the traditional basic phone service shows a meaningful decrease of subscribers (number of subscribers decreased from 1 027 847 in the year 2011 to 804 468 in 2015), the number of clients in the VoIP service increased during that same time span from 3872 subscribers to 55 046. In respect to the year 2015, while the VoIP service had an increasing tendency with 13 797 new subscribers, the traditional basic service experimented a reduction of 35 500 clients. See graphic 11.
For comparative purposes, if the number of quarterly registered subscribers in the fixed telephone service is considered for
the years 2014 and 2015, an overall and persistent decrease is observed in the total number of subscribers of that service during the eight quarters analyzed. While the client reduction is associated with the traditional basic telephony, it is noted that unlike the behavior shown in the fixed telephony as a whole, the figures of the VoIP service show that, except for the second quarter of 2015, there is a continuous growth in the number of subscribers over the last two years, on average equal to 5.8 % quarterly. The corresponding data are included in table 40 of the Annex.
As the result of that dissimilar behavior in the number of subscribers per service, participation rates in both services -within the total number of customers- has varied markedly, which in the annual perspective is reflected both in table 41 of the Annex, as well as in graphic 12. Meanwhile, during the last two years it may be noted –quarterly- that while in the first quarter of 2014 basic telephony had 96.1 % of the subscribers of the fixed telephony and VoIP had the remaining 3.9 %, during the fourth quarter of 2015 these percentages varied to 93.6 % and 6.4 %, respectively. Such variations are evident in table 42 of the Annex and in the graphic 13.
Service penetration of traditional basic telephony in the country, measured as the percentage of total users compared to the total population, shows a downward trend going from 22.4 % in 2011 to 16.6 % in 2015. This means that the traditional basic service went from 224 basic lines for each
Fixed telephony
38

Fixed telephony Fixed telephony
thousand inhabitants to 166 lines per each thousand inhabitants. The respective figures are shown in table 43 of the Annex and in the graphic 14.
As for the penetration of Voice over IP (VoIP), in 2015 this said service reached 11.4 lines per thousand inhabitants. The details of the corresponding evolution of this service are shown in table 44 of the Annex and in the graphic 15.
Meanwhile, the distribution per operator of the above-stated VoIP service subscribers and its evolution over the past two years is shown in the 16 and 17 graphics. While Tigo remains as the operator with the largest number of subscribers (41.6 % in 2014 and 36.1 % in 2015), also Cabletica (26 % 2015 compared to 20.2 % in 2014) and Telefonica (passing from 11.6 % in 2014 to 17.4 % in 2015) had a noticeable growth in their number of clients.
Given that the public telephone service should also be considered as fixed telephony, it is important to analyze the number of public phones available and their evolution over time. The available information indicates a decrease in the number of such devices, which went from 18 960 in late 2011 to 5 726 in 2015. As of 2013, the reduction was accentuated; hence the number of available payphones in 2015 represents only a 35 % of
those installed in 2012 (16 348). Obviously, such a decrease in the number of public telephones is associated with a minor need of the population of such service, given the availability of other options, including mobile telephony. The corresponding evolution is shown in table 45 of the Annex and in the graphic 18.
39

Fixed telephony
Income1
According to the subscriber data and telephone traffic behavior, which analysis is presented below, the income from the provision of fixed telephony in general also shows a downward trend during the period of analysis (2011-2015). While in 2011 fixed telephony generated 88 614 million colones, in 2015 the corresponding revenue decreased to 86 476 million colones, i.e. a reduction equivalent to 2.4 % in the five-year period (0.6 % annual average reduction). It should be noted, however, that the downward trend in revenue was much more marked in the period 2011-2013, since 2014 showed, on the contrary, a significant increase (15.3 %) as the result of the tariff adjustment approved by SUTEL, under resolution RCS-268-2013 on September 18, 2013, enforced later that year by the leading provider of fixed telephone services (Instituto Costarricense de Electricidad). In this regard, in 2014, the corresponding revenue reached a total of 92 831 million colones. Despite this upturn, again in 2015 a 6.8 % downward was experienced with respect to the 2014 period. A detail of the respective amounts and the aforementioned downward trend can be observed in table 46 of the Annex and in the graphic 19.
As occurred with the number of subscribers and telephone traffic (discussed below), in the case of the VoIP service, contrasting the behavior of the revenues for the fixed telephony service -in general- and the
traditional basic service –specifically-, income has increased over time, rising from 231 million colones in 2011 to 5071 million colones in 2015. This increase is persistent over time, to the extent that during the five years analyzed (2011-2015), the average annual growth reached 165.2 %. The aforementioned data are shown in table 47 of the Annex and in the graphic 20.
For comparison purposes, on a quarterly basis and considering the last two years, the revenues from fixed telephony show a marked decline, at least until the third quarter of 2015. Such revenues decreased from 24 116 million colones in the first quarter of 2014 to 20 931 million colones in the third quarter of 2015, which equals an average quarterly decline of 2.3 %. During the fourth quarter of the last year, an increase (2,3 %) was observed reaching a value of 21 420 million colones. Overall, quarterly data for 2014 surpassed those of the following year. The breakdown of the figures is shown in the table 48 of the Annex and in the graphic 21.
Meanwhile, the corresponding revenues from the VoIP service during the eight quarters comprised between the years 2014 and 2015 show a similar behavior to that presented in fixed telephony as a whole. Certainly, during the past two years, the growth experienced by the VoIP service, both in terms of number of subscribers as telephone traffic, did not resulted in an increase of the corresponding revenues, at least until the third quarter of 2015, to such an extent that while during the first quarter
1 It should be noted that the revenues from fixed telephony set forth in this report, comprising the period of time between 2011 to 2014, do not match those that were included in previous reports, because unlike these, the actual includes revenues from calls originating in ICE’s fixed network that are intended for different mobile networks. This omission by the operator in the reports issued for the previous years has meant that the current data markedly exceeded those referred to for the purposes of the preparation of the 2012 , 2013 and 2014 reports.
40

Fixed telephony Fixed telephony
of 2014 such revenue totaled 1457 million colones, during the third quarter of 2015 it reached 1184 million colones, thus showing an average quarterly decrease of 3.4 %. In the following quarter an increase was observed in the corresponding amount, so that in that fourth quarter of 2015, the value was of 1266 million colones. Such decrease is primarily explained by the termination in the provision of the international calls service by one of the leading providers.The corresponding data are included in table 48 of the Annex and in the graphic 22.
The revenue and number of subscribers’ available information allows obtaining the average revenue per user (ARPU). Obviously, the above average revenue per user can be calculated both for all the services included in the fixed telephony, as well as for each of the different types of service comprised within this telephone modality, i.e. the traditional basic telephony and VoIP service.
When considering fixed telephony -in general-, as well as the traditional basic telephony, the calculations show a very similar average annual income per subscriber for the first three years analyzed (2011-2013). During this period, the corresponding value varied in a range between 83 000 and 86 000 colones. As a result of the above-mentioned tariff adjustment, this average income increased above 104 000 colones in 2014 (26 %), decreasing in the following year to a lower figure (101 172 colones in the case of traditional basic telephony and 100 593 colones for fixed telephony in general). The corresponding detail can be seen in table 50 of the Annex, which also includes the resulting figures in the case of the VoIP service.
Meanwhile, in the case of the VoIP service, revenue per subscriber has shown an fluctuating behavior, with a significant increase from 2011 to 2012 (increased from 59 592 colones to 84 254 colones), a decrease in 2013 (77 274 colones) and another increase in 2014, when it reached a value of 116 989 colones, higher than the one shown by traditional basic telephony for the same year. In 2015, the corresponding amount (92 113 colones) is 1721 lower than the one recorded for the previous year. Refer to graphic 23.
Available information also allows obtaining the average revenue per minute for both the traditional basic telephone service and the VoIP service. The resulting amounts set forth in table 51 of the Annex, show a steady decline in the average price paid by users of the VoIP service, which is explained in part by the loss of relevance of international telephony (decrease in both traffic and the average price per minute), and, moreover, by the significant increase in the number of customers, which involves providing the service to clients with increasingly lower consumption. In the case of traditional basic telephony, the average prices show a significant increase as of 2014, which is a consequence, as above-stated, of the increased tariff enforced by ICE at the end of the 2013 year. The aforementioned behavior can be observed in graphic 24.
Traffic
Telephone traffic through fixed networks has been declining over time, so that while 5441 million minutes were transferred, in 2015
41

Fixed telephony
that traffic had decreased to 3208 million minutes, equivalent to an average annual reduction of 12.4 %. It should be noted, however, that the traffic decline experienced in the last year (265 million minutes), represents a lower decrease (7.6 %) than the average reduction. The corresponding detail is shown in table 52 of the Annex and in graphic 25.
Unlike the behavior shown in the fixed telephony as a whole, primarily because of what occurred with the traditional basic telephony, concerning the VoIP telephone service, the corresponding telephone traffic
has been increasing with the passage of time and the subsequent consolidation
of the service, as observed in table 53 of the Annex, to which graphic
26 related to. In such sense, the minutes coursed thru VoIP increased from 5602 thousand minutes in 2011 to 229 984 thousand minutes in 2015. A growth of 196.6 % experienced during the 2014-2015 biennium in relation to the VoIP traffic on 2013 (77 532 thousand minutes) is noticeable.
When considering quarterly data, specifically for the eight quarters
that are included within the last two years, a downward trend in
telephone traffic is clear in the case of fixed telephony services in general,
which has been decreasing repeatedly in each one of the quarters considered, as the result of the reduction experienced over time in the telephone traffic thru traditional basic telephony network. The relevant data shows that while in the first quarter of 2014 the transfer of minutes via the fixed telephony reached 926 million minutes, in the fourth quarter of 2015, said telephone traffic had dropped to 790 million minutes, which represents an average quarterly decline of 2.2 %. An exception to this downward trend was experienced during the fourth quarter of 2015, were traffic increased by 5.4 % compared to the figure shown in the third quarter of that same year (750 million
42

Fixed telephony Fixed telephony
minutes). In this regard, please refer to table 54 of the Annex and to graphic 27.
As for the VoIP service, the quarterly figures for the period 2014-2015 show a sustained growth, so that the 45 million minutes of telephone traffic recorded during the first quarter of 2014, increased to 63 million minutes in the fourth quarter of 2015, which means that on average such traffic increased on a quarterly basis by 4.9 % (table 55 of the Annex and graphic 28).
With regard to the VoIP service, the available information allows to determine the percentage distribution of telephone traffic per operator. In that sense, the 2014 distribution showed that the three operators with higher traffic concentrated 75 % of the transferred minutes. Meanwhile, the 2015 data clearly evidenced a reduction in the share of these three operators, which reaches a 71.5 %. This does not mean a traffic reduction thru said operators, since the total traffic from 2014 to 2015 shows an increase of 31.7 % and, additionally, other operators have gained market share at the expense of these three high-traffic operators. The corresponding distributions are specified in graphics 29 and 30.
Finally, in connection with fixed telephony traffic as a whole, an important data that can be calculated is the average traffic per subscriber. The figures show that while in 2011, specifically regarding traditional basic telephony, the average traffic per subscriber reached the 5269 minutes, in 2015 that average had decreased to 3465
minutes, which represents an annual average decrease of 9.9 %. The opposite occurs when it comes to the VoIP service, were the average traffic per user has increased from 1447 minutes in the year 2011 to 4178 minutes in 2015, with an annual average increase of 30.4 %. Thus, in the last two years of the period analyzed the average VoIP telephony traffic exceeded the average traffic for the traditional basic telephone service traffic. Refer to graphic 31.
43

Fixed telephony
Source: SUTEL, Directorate-General for Markets.
Graphic N° 11Costa Rica: Subscriptions to VoIP service 2011-2015
Figures by the end of each year
3872
18 265
32 424
41 249
55 046
2011 2012 2013 2014 2015
Graphic N° 12Costa Rica: Percentage distribution of subscriptions to traditional basic
and VoIP telephony, 2011-2015Figures by the end of each year
98.2 %99.6 %
96.7 % 95.3 % 93.6 %
0.4 % 1.8 % 3.3 % 4.7 % 6.4 %
2011 2012 2013 2014 2015Traditional Basic Telephony VoIP
Source: SUTEL, Directorate-General for Markets.
Graphic N° 13Costa Rica: Percentage distribution of subscriptions to traditional basic
and VoIP telephony, 2014-2015Figures by the end of each quarter
96.1 % 95.9 % 95.7 % 95.3 % 94.5 % 94.5 % 94.1 % 93.6 %
3.9 % 4.1 % 4.3 % 4.7 % 5.5 % 5.5 % 5.9 % 6.4 %
Q1 Q2 Q3 Q4 Q1 Q2 Q3 Q42014 2015
Traditional Basic Telephony VoIPSource: SUTEL, Directorate-General for Markets.
Between2011 and 2015, the number of
subscriptions to the VoIP service
has experienced a significant increase.
44

Fixed telephony Fixed telephony
Graphic N° 14Costa Rica: Traditional basic phone telephony 2011-2015
Connections in relation to the total population (%)
22.4 %
21.0 %19.9 %
17.6 %16.6 %
2011 2012 2013 2014 2015Source: SUTEL, Directorate-General for Markets.
Graphic N° 15Costa Rica: VoIP telephony service penetration, 2011-2015
Connections per 1000 Inhabitants
0.1 %
0.4 %
0.7 %
0.9 %
1.1 %
2011 2012 2013 2014 2015Source: SUTEL, Directorate-General for Markets.
Graphic N° 16Costa Rica: VoIP Service Subscription Distributed by Operator,
December 2014 (%)
41.6 %
20.2 %
7.4 %
17.1 %
11.6 %
2.0 %
Tigo Cabletica CallMyWay Telecable Telefónica OthersSource: SUTEL, Directorate-General for Markets.
Penetration rate of the traditional basic telephone service
decreasedbetween the year 2011 and 2015, passing from22.4 % to 16.6 %
45

Fixed telephony
Graphic N° 17Costa Rica: VoIP Service Subscription Distributed by Operator,
December 2015 (%)
36.1 %
26.0 %
6.7 %
12.7 %
17.4 %
1.0 %
Tigo Cabletica Telecable Telefónica OthersCallMyWaySource: SUTEL, Directorate-General for Markets.
Graphic N° 18Costa Rica: Number of public pay phones in operation, 2011-2015
Figures by the end of each year
18 960
16 348
13 145
8188
5726
2011 2012 2013 2014 2015Source: SUTEL, Directorate-General for Markets.
Graphic N° 19Costa Rica: Fixed telephony service total income,
2011-2015Figures in millions of colones
2011 2012 2013 2014 2015
88 614 85 33480 531
92 83186 476
Source: SUTEL, Directorate-General for Markets.
The number of public pay phones in
the country
decreasedfrom 18 960 in the
year 2011 to 5726 in 2015
46

Fixed telephony Fixed telephony
Graphic N° 20Costa Rica: VoIP telephony income, 2011-2015
Figures in millions of colones
231
1539
2506
48265071
2011 2012 2013 2014 2015
Source: SUTEL, Directorate-General for Markets.
Graphic N° 21Costa Rica: Fixed telephony total income, 2014-2015
Quarterly figures in millions of colones
2014 2015
24 116 23 226 22 856 22 63222 161 21 964 20 931 21 420
Q1 Q2 Q3 Q4
Source: SUTEL, Directorate-General for Markets.
Graphic N° 22Costa Rica: VoIP telepony income, 2014-2015
Quarterly figures in millions of colones
2014 2015
1457
1078 11171173
1334 12871184
1266
Q1 Q2 Q3 Q4
Source: SUTEL, Directorate-General for Markets.
A larger number of users have allowed an increase in the revenues from the
VoIP service
47

Fixed telephony
Graphic N° 23Costa Rica: Average income per fixed telephony subscriber, as per type of connection:
Traditional basic and VoIP, 2011-2015Annual figures in colones (CRC)
59 59284 254
77 274
116 989
92 13285 988 85 783 83 357 104 772
101 172
2011 2012 2013 2014 2015
VoIP Traditional Basic TelephonySource: SUTEL, Directorate-General for Markets.
Graphic N° 24Costa Rica: Average income per coursed minute thru fixed telephony, as per type
of connection: Traditional Basic and VoIP, 2011-2015 Figures in colones (CRC)
41 40
32
25 21
16 17 19
27 27
2011 2012 2013 2014 2015VoIP Traditional Basic Telephony
Source: SUTEL, Directorate-General for Markets.
Graphic N° 25Costa Rica: Fixed telephony traffic, 2011-2015
Millions of minutes per year
54414908
4138
34733208
2011 2012 2013 2014 2015Source: SUTEL, Directorate-General for Markets.
Average income per
VoIP service subscriber still
remains below the traditional basic
telephony
The average income per coursed minute
thru the
VoIP serviceis less than the one
generated by the traditional basic
telephony
48

Fixed telephony Fixed telephony
Graphic N° 26Costa Rica: VoIP telephony traffic, 2011-2015
Thousand of minutes per year
6
39
78
175
230
2011 2012 2013 2014 2015Source: SUTEL, Directorate-General for Markets.
Graphic N° 27Costa Rica: Fixed telephony traffic, 2014-2015
Quarterly figures in millions of minutes
926884 825
838
858 810 750790
Q1 Q2 Q3 Q4
2014 2015Source: SUTEL, Directorate-General for Markets.
Graphic N° 28Costa Rica: VoIP telephony traffic, 2014-2015
Quarterly figures in millions of minutes
4542
41
46
50
60 5863
Q1 Q2 Q3 Q42014 2015
Source: SUTEL, Directorate-General for Markets.
During the last four years telephone traffic originatedin the
VoIP networkshows a significant increase
49

Fixed telephony
Graphic N° 29Costa Rica: Percentage VoIP telephony traffic distribution
per operator, 2014
Three mainoperators
75 %
Otheroperators
25 %
Source: SUTEL, Directorate-General for Markets.
Graphic N° 30Costa Rica: Percentage VoIP telephony traffic distribution
per operator, 2015
Three mainoperators71.5 %
Otheroperators
28.5 %
Source: SUTEL, Directorate-General for Markets.
Graphic N° 31Costa Rica: Average annual traffic per fixed telephony subscriber, as per type
of connection: Traditional basic and VoIP, 2011-2015Figures in minutes
1447
2133 2391
4235 417852694893
41923743
3465
2011 2012 2013 2014 2015
VoIP Traditional Basic TelephonySource: SUTEL, Directorate-General for Markets.
In 2015, three VoIP service operators
concentrate
more than 70%of the traffic
coursed thru that network
As of 2014, the average traffic per
VoIP servicesubscriber exceeded the traditional basic
telephony average
50
Fixed telephony
Mobile phones
Chapter 3

Mobile phones
Subscriptions
2015 reported around 7 536 000 subscribers in the mobile telephone service, which translates into a 7 % increase compared to 2014. It should be noted that this increase was reflected both in prepaid and postpaid services (6 % and 11 %, respectively). A 156 % penetration was accomplished, which is the highest recorded in Costa Rica. This can be seen in graphics 32, 36 and 37.
Though, in the case of market operators, in contrast to 2014 Claro, Telefónica and Fullmóvil experienced a year-on-year increase of 24 %, 17 % and 93 %, respectively. The change of Fullmóvil’s historical trend is highlighted, as this operator, since 2013, had experienced continuous declines. See graphic 33.
In regards to the form of payment, the prepaid service remains as the preferred service by the users with a 79 % market share, while the postpaid service represents
a 21 %. Since 2012, these figures continue showing a similar behavior. This can be
seen in graphics 38 and 35.
In connection with market distribution per number of subscribers, ICE remains the operator with the largest share (58 %), followed by Telefonica (22 %) and Claro (19 %). Tuyo Móvil
and Fullmóvil together registered a 1 % participation. However, attention
must be paid to the fact that despite ICE
remains the operator with the largest share, since 2011 ICE has experienced a steady decline (approximately 33 % in 4 years). By 2015, Claro (3 %) followed by Telefónica (2 %) experienced the largest percentage increase in their market share in contrast to 2014. See graphic 34.
When analyzing the numbers of users based in the form of payment and operator, in the case of the prepaid service, ICE has the largest share (54 %), followed by Telefónica (25 %), Claro (19 %), and virtual operators with a 1 % each. In the postpaid service, the structure changes as ICE prevails with a 71 % market share. However, Claro moves to the second position with 19 % and Telefónica remains third with a 10 %. It is important to note that the prepaid service is more fragmented than the postpaid, in which nearly three quarters of the users correspond to ICE, despite that the historical behavior shows that since 2011 this operator has reduced its participation hence giving market space to other operators. See graphics 39 and 40.
Income
Revenues from mobile telephony services (income from voice and messaging services) experienced an increase of 21 309 million colones in contrast to the year 2014 (5 %). Thus, in 2015 they reached a figure close to 413 000 million colones. However, despite the revenue growth, the increase was lower than the annual average growth for the 2011-2014 period (18 %). This is shown in graphic 41.
Mobile phones
52

Mobile phones Mobile phones
As for the conformation, year-by-year mobile voice income has gained a larger share, reaching in 2015 a 97 % high peak, 3 percentage points more than in 2014. In addition, said service experienced an 8 % increase during the last year, registering 398 422 million colones, while in 2015 messaging (SMS/MMS) represented just a 3 %, as it recorded a significant decrease of 39 % for the 2014-2015 period. For that particular case, it is presumed that OTT (over the top) services, through applications such as Whatsapp, Facebook messenger, among others, have replaced the use of traditional messaging, which is reflected in the data transfer section, with an increase of more than 30 % in the revenues generated by that service in the mobile data market. See graphic 43.
Income from voice roaming remained similar to the previous year, as it only increased by 0,12 % compared to 2014; registering in 2015 the amount of 6596 million colones. The income from SMS/MMS roaming + data increased 2 % over the previous year, accumulating a total of 5788 million colones. See graphics 45 and 46.
The income from mobile data increased by 34 % with a final amount in 2015 of 170 366 million colones (See table 60 of the Annex), however even with this rise,
the growth presented was the lowest since 2012. Revenue generated by the mobile network -as a whole- is determined by adding the mobile date income along with mobile voice and messaging, which figure closed at 583 108 million, showing 12 % increase compared to 2014 (the lowest since 2012).
53

Mobile phones
As for income as per the form of payment in 2015, even though the postpaid service represents only a 21 % of the subscriptions, the total income share within the mobile network is of 57 %, which represents 330 555 million colones, showing a year-by-year increase of 34 %. The 252 553 million colones reported for the prepaid service showed a 7 % decrease compared to 2014, and represents a 43 % income within the mobile network income. See graphic 42.
In line with the above, the average monthly income per postpaid subscriber of the mobile network in the year 2015 was 17 387 colones (highest figure since 2011). While income per prepaid subscriber was of 3537 colones (13 % below 2014). See graphic 47.
Traffic
Mobile voice traffic closed 2015 with 8252 million minutes, which is 9 % lower than 2014, mainly because the number of minutes in the prepaid service, which accounted for 59 % of total traffic, decreased by 16 % compared to 2014 (4868 million minutes in 2015 and 5799 million minutes in 2014). While the postpaid service experienced only a 5 % increase with 3384 million minutes in 2015. It is important to note that for the first time since the opening of the telecommunications market, mobile voice traffic dropped, as shown in graphic 48.
In terms of traffic per subscriber, in 2015 users of the prepaid service had a monthly average consumption of 68 minutes, while those belonging to the postpaid service consumed around 178 minutes. At this point it should be noted that prepaid users consume less and less, as in 2011, 102 minutes were monthly transferred per user, i.e. in four years decreasing by 33 %. The same applies to the postpaid service, however this behavior has not been as pronounced as in 2011 when users consumed 210 minutes per month, i.e. in this period their consumption has reduced by 15 %. See graphic 55.
Participation by destination network experienced no major changes with respect to its historic behavior, as calls with mobile
54

Mobile phones Mobile phones
destination remained as the most user-consumed (79 % of total traffic divided into 55 % on net and 24 % off net), while an 18 % was destined to fixed telephony and a 3 % to international. Despite the fact that market shares are similar to those of 2014, trends by destination continue, since the on net mobile termination and the fixed telephony decreased, on average 2 and 4 percentage points per year, respectively, while mobile off net increased 6 points on average per year, and internationally telephony destinations practically remain unvaried over the years. See graphic 49.
International traffic closed 2015 with 503 million minutes (5 % less than the previous year). It is conformed by 46 % of incoming international traffic and 54 % international outgoing traffic. The latter presents an upward trend, given that in 2011 their share was of 28 %. Contrary to the foregoing is the incoming international traffic , given that in 2011 its share was around 72 % and at the end of 2015 it reached its lowest level. See graphic 54.
The voice roaming traffic totaled 42 million minutes at the end of 2015 showing a 50 % increase compared to 2014 (the largest in the analyzed period), especially in roaming incoming (58 % compared to 2014 ), while outbound roaming traffic experienced a 15 % increase. This can be seen in graphic 53.
As for messaging traffic, the short message service (SMS) has experienced an annual average decrease of 21 %; moving from 22 839 million messages in 2012 to 9551 million messages in 2015. Of these, 48 % were bound off net and 52 % on net. Since 2013,
MMS messaging has been decreasing at an annual average rate of 56 % and closed 2015 with 10 million messages. See graphics 50, 51 y 52.
Number Portability
Since 2013 the possibility for mobile users to carry numbers to other mobile operators was established. From that date until December 2015, 485 966 successful ported numbers have been accomplished, with an approximate monthly average of 20 000.
The fact that in 2015 the largest amount of exports (294 553) was performed, i.e. 69 % compared with 2014. The third quarter of that year recorded the highest number of exports.
Portability has resulted that in net terms (imported numbers - exported numbers), ICE, Fullmóvil and Tuyomóvil have withdrawn a total of 296 800 numbers (291 348, 2576 and 2876, respectively). In contrast to the above, Claro and Telefónica have received thru this mechanism 118 074 and 178 726 new users, respectively. See graphics 56 and 57.
55

Mobile phones
Graphic N° 32Costa Rica: Mobile telephone service subscriptions, 2011-2015
Figures in thousands of subscriptions by the end of the year
4135
5349
7059 70207536
2011 2012 2013 2014 2015Source: SUTEL, Directorate-General for Markets.
Graphic N° 33 Costa Rica: Mobile telephone service subscriptions per operator, 2014-2015
Figures in thousands of subscriptions
4348
1144 1431
31 67
4339
14141677
59 46
ICE Claro Telefónica Fullmóvil Tuyo Móvil
2014 2015Source: SUTEL, Directorate-General for Markets.
Graphic N° 34 Costa Rica: Share of mobile telephone service subscriptions per operator,
2011-2015Percentages
90 %73 %
62% 62 % 58 %
3 %15 %
18 % 16 % 19 %
3 %8 % 18 % 20 % 22 %
2 % 2 % 1 % 1 % 1 %2 % 2 % 1 % 1 % 0 %
2011 2012 2013 2014 2015ICE Claro Telefónica Fullmóvil Tuyo Móvil
Source: SUTEL, Directorate-General for Markets.
Subscriptionsreach a
record highin 2015
2015
increasedby 516 thousand
subscribers compared to 2014
Claro and Telefonica reach their
highest market share in their
history
56

Mobile phones Mobile phones
Graphic N° 35Costa Rica: Mobile telephone service subscriptions by form of payment,
2014-2015 Quarterly figures in thousands of subscriptions
1422 1584
55995951
Q4 2014 Q4 2015Postpaid Prepaid
Source: SUTEL, Directorate-General for Markets.
Graphic N° 36Costa Rica: Year-by-year variations in mobile telephone service subscriptions
by method of payment, 2011-2015Percentages
89 %
47 %38 %
-4 %
6 %
-22 % -10 %
8 %16 % 11 %
2011 2012 2013 2014 2015
Prepaid year-by-year variation Postpaid year-by-year variationSource: SUTEL, Directorate-General for Markets.
Graphic N° 37Costa Rica: Mobile telephone service subscriptions per 100 inhabitants,
2011-2015Percentages
90 %
115 %
150 % 147 % 156 %
2011 2012 2013 2014 2015Source: SUTEL, Directorate-General for Markets.
Prepaid subscriptions quarterly
increased–on average- by0.3 %, while postpaid by 3.3 %
Subscriptions
increased by 7 %
compared to the data recorded in 2014
156 % mobile penetration,
the highestin the history of Costa Rica
57

Mobile phones
Graphic N° 38Costa Rica: Share of mobile telephone service subscriptions by form of payment,
2011-2015Percentages
Prepaid Postpaid
69 %79 % 83 % 80 % 79 %
31 %21 % 17 % 20 % 21 %
2011 2012 2013 2014 2015
Source: SUTEL, Directorate-General for Markets.
Graphic N° 39Costa Rica: Share of prepaid mobile telephone service subscriptions by operator,
2011-2015Percentages
87 %
70 %
57 % 58 %54 %
3 %
16 % 20 % 17 % 19 %
4 %9 %
20 % 23 % 25 %
3 % 2 % 1 % 1 % 1 %3 % 3 % 2 % 1 % 1 %
2011 2012 2013 2014 2015
ICE Claro Telefónica Fullmóvil Tuyo MóvilSource: SUTEL, Directorate-General for Markets.
Graphic N° 40Costa Rica: Share of postpaid mobile telephone service subscriptions by operator,
2011-2015Percentages
97 %84 % 80 % 76 % 71 %
2 %12 % 12 % 15 % 19 %
1 % 4 % 8 % 9 % 10 %
2011 2012 2013 2014 2015
ICE Claro TelefónicaSource: SUTEL, Directorate-General for Markets.
For eachpostpaid user,
4 prepaidusers exist
ICE is the operator with the largest
market share in the
prepaidform of payment,
with 54 %
ICE is the operator with the largest
market share in the
postpaidform of payment,
with 71 %
58

Mobile phones Mobile phones
Graphic N° 41Costa Rica: Mobile telephone service total income, 2011-2015
Figures in millions of colones
239 405273 342
293 197
391 433412 742
2011 2012 2013 2014 2015Source: SUTEL, Directorate-General for Markets.
*Includes income from mobile voice, messaging and data; roaming is not considered.Source: SUTEL, Directorate-General for Markets.
Graphic N° 42Costa Rica: Ratio of total income for the mobile network*,
as per form of payment, 2011-2015Percentages with respect to the total
50 % 58 % 54 % 52 % 43 %
50 % 42 % 46 % 48 % 57 %
2011 2012 2013 2014 2015Prepaid Postpaid
Graphic N° 43Costa Rica: Ratio of total income for the mobile network*, as per component,
2011-2015 Percentages with respect to the total
82 % 86 % 87 % 94 % 97 %
18 % 14 % 13 %6 % 3 %
2011 2012 2013 2014 2015
Voice (roaming not included) SMS/MMSSource: SUTEL, Directorate-General for Markets.
Mobile telephony income
increased by 5 %
compared to 2014
57 %of the income from the mobile network originates in the postpaid form of payment
Voice income is the largest component of mobile telephony with
a 97 %
59

Mobile phones
Income for mobile network
grew 12 % compared to 2014
Income for SMS/MMS and Internet
roaming
increased by 2 %
compared to the year 2014
Income for
voice roaming practically remains
unchanged since 2014
*Includes income from mobile voice, messaging and data; roaming is not considered.Source: SUTEL, Directorate-General for Markets.
Graphic N° 44Costa Rica: Total quarterly income for the mobile network*, 2014-2015
Figures in millions of colones
124 623
129 460128 258
136 166142 054
147 252
146 024
147 777
Q1 2014 Q2 2014 Q3 2014 Q4 2014 Q1 2015 Q2 2015 Q3 2015 Q4 2015
Graphic N° 45Costa Rica: Quarterly income for roaming, SMS/MMS and data, 2014-2015
Absolute figures in millions of colones
1710
1427 1393
1136
1713
13661499
1211
Q1 2014 Q2 2014 Q3 2014 Q4 2014 Q1 2015 Q2 2015 Q3 2015 Q4 2015
Source: SUTEL, Directorate-General for Markets.
Graphic N° 46Costa Rica: Total income for voice roaming, 2013-2015
Absolute figures in millions of colones
6299 6588 6596
2013 2014 2015
Source: SUTEL, Directorate-General for Markets.
60
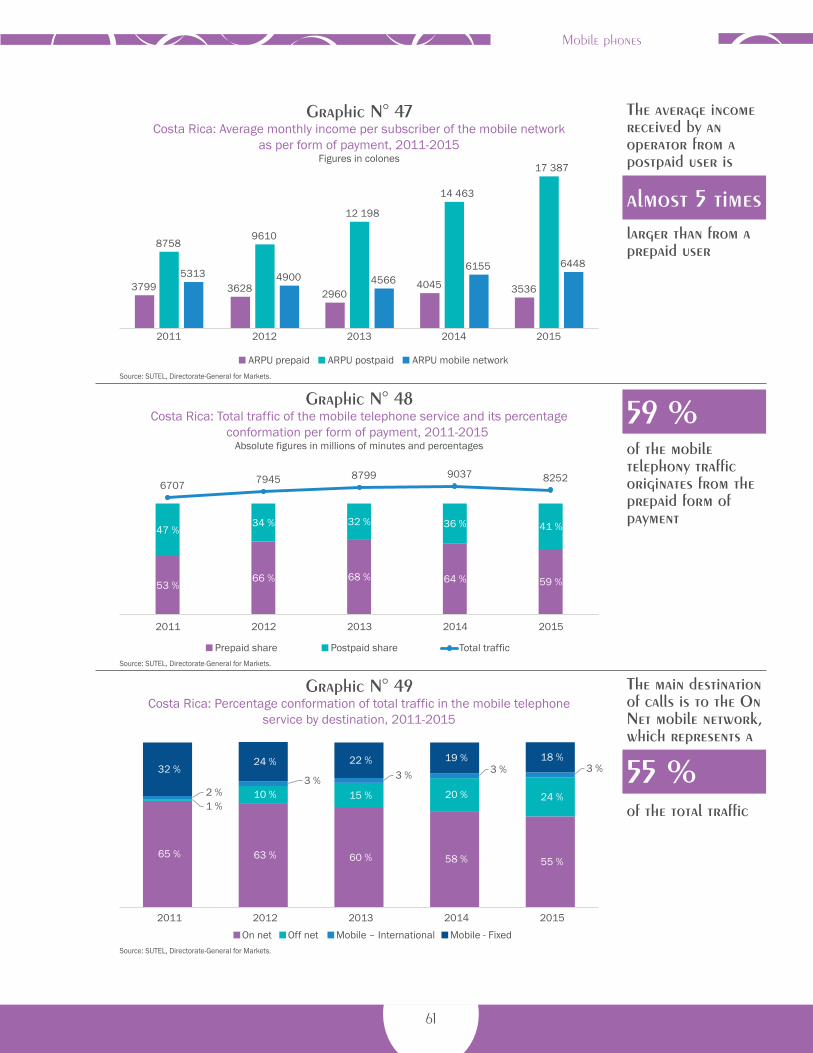
Mobile phones Mobile phones
Graphic N° 47Costa Rica: Average monthly income per subscriber of the mobile network
as per form of payment, 2011-2015Figures in colones
3799 3628 29604045 3536
87589610
12 198
14 463
17 387
5313 4900 45666155 6448
2011 2012 2013 2014 2015
ARPU prepaid ARPU postpaid ARPU mobile networkSource: SUTEL, Directorate-General for Markets.
Graphic N° 48Costa Rica: Total traffic of the mobile telephone service and its percentage
conformation per form of payment, 2011-2015 Absolute figures in millions of minutes and percentages
53 %66 % 68 % 64 % 59 %
47 %34 % 32 % 36 % 41 %
6707 7945 8799 9037 8252
2011 2012 2013 2014 2015
Prepaid share Postpaid share Total trafficSource: SUTEL, Directorate-General for Markets.
Graphic N° 49Costa Rica: Percentage conformation of total traffic in the mobile telephone
service by destination, 2011-2015
65 % 63 % 60 % 58 % 55 %
1 %10 % 15 % 20 % 24 %2 %
3 % 3 % 3 % 3 %32 %24 % 22 % 19 % 18 %
2011 2012 2013 2014 2015
On net Off net Mobile – International Mobile - FixedSource: SUTEL, Directorate-General for Markets.
The average income received by an operator from a postpaid user is
almost 5 timeslarger than from a prepaid user
59 %of the mobile telephony traffic originates from the prepaid form of payment
The main destination of calls is to the On Net mobile network, which represents a
55 %of the total traffic
61

Mobile phones
Graphic N° 50Costa Rica: Total SMS traffic, 2012-2015
Figures in millions of messages
22 83920 454
14 936
9 551
2012 2013 2014 2015Source: SUTEL, Directorate-General for Markets.
Graphic N° 51Costa Rica: Total and percentage conformation of SMS traffic in the mobile
telephone service, 2014-2015Absolute figures in millions of messages and percentages
60 % 52 %
40 % 48 %
14 936 9551
2014 2015On net Off net SMS
Source: SUTEL, Directorate-General for Markets.
Source: SUTEL, Directorate-General for Markets.
Graphic N° 52Costa Rica: Total MMS traffic, 2012-2015
Figures in millions of messages
219
127
75
10
2012 2013 2014 2015
A historic low in the number of
SMS messages is recorded
(9551)
52 % of the SMS messages are
On net
A historic low in the number of
MMS messages is recorded
(10 million)
62

Mobile phones Mobile phones
Graphic N° 53Costa Rica: Total and percentage conformation of voice roaming traffic in the
mobile telephone service, 2011-2015 Absolute figures in millions of minutes and percentages
83 %76 % 75 % 81 % 85 %
17 % 24 % 25 % 19 % 15 %
14 18 21 2842
2011 2012 2013 2014 2015Incoming roaming Outgoing roaming Total roaming traffic
Source: SUTEL, Directorate-General for Markets.
Graphic N° 54Costa Rica: Total and percentage conformation of international traffic in the
mobile telephone service, 2011-2015Absolute figures in millions of minutes and percentages
72 % 65 % 57 % 48 % 46 %
28 % 35 % 43 % 52 % 54 %
463 566 589531
503
2011 2012 2013 2014 2015Incoming international Outgoing international International traffic
Source: SUTEL, Directorate-General for Markets.
Graphic N° 55Costa Rica: Average monthly subscriber traffic per form of payment, 2011-2015
Figures in monthly minutes per subscriber
135 123 103 107
91 102 103 85 86
68
210 199 192 190 178
2011 2012 2013 2014 2015
Total monthly traffic Monthly prepaid traffic Monthly postpaid traffic
Source: SUTEL, Directorate-General for Markets.
The year 2015 recorded
42 millionminutes of voice roaming
International traffic
decreased 5 %compared to the year 2014
A postpaid user consumes almost
3 times morethan a prepaid user
63

Mobile phones
*Successful exports: Number of porter numbers finally activates in the new operator’s network.Source: SUTEL, Directorate-General for Markets and Directorate-General for Quality.
Graphic N° 56Costa Rica: Successful* ported numbers at the end of the quarter, 2014-2015
Figures in monthly minutes per subscriber
41 96137 741
41 925
52 874 55 11962 836
92 887
83 711
Q1 2014 Q2 2014 Q3 2014 Q4 2014 Q1 2015 Q2 2015 Q3 2015 Q4 2015
Successful exports
Graphic N° 57Costa Rica: Successful* ported numbers per operator, (December 2013 – December 2015)
118 074
- 2 576
- 291 348
178 726
- 2 876
Claro Fullmóvil ICE Teléfonica Tuyo Móvil*Successful imported numbers: Number of imports finally activates in the new operator’s network.Source: SUTEL, Directorate-General for Markets and Directorate-General for Quality.
The year 2015
recorded 69 %
of successfulported numbers
Telefónicais the operator with the largest
number of imported numbers
64

Mobile phones
Data Transfer
Chapter 4

Data Transfer
Data Transfer
Internet access via mobile networks
This section presents the analysis performed to the data transfer service and the evolution of the related markets during the period 2014 to 2015. At the beginning of each section the general data of each market for all years with available information will be presented, however, the main focus will be the 2014 to 2015 evolution, and special emphasis is made to points of interest during 2015.
The specific services to be analyzed are: mobile Internet access, retail fixed Internet access, wholesale fixed Internet access and leased lines. The analysis of variables such as connections sold and total revenue, which are also specified by connection technologies and purchased speed ranges, are also contemplated. The variable data traffic is analyzed only for the mobile Internet access and retail fixed Internet markets.
For this analysis information was gathered from 3 network operators with a concession within the spectrum and from the authorized mobile virtual network authorized operators. These companies operate networks with 2G, 3G and 4G technologies. The study of this market is presented taking into consideration the following aspects: type of access device, form of payment and speed ranges. The details are exposed in the following sections.
Subscriptions
Graphic 58 shows the service evolution in terms of the number of users. From 2012 to 2015 a sustained increase has been observed ranging from 2 670 708 subscribers at the beginning of the period in question, to 4 861 898 at the end of 2015, with an average growth of 82 % during this period.
This increase of 2 191 690 subscriptions during the period comprised between 2012-2015 denotes the increasing rate of the mobile data market in recent years. This can be observed in the increase in the per capita penetration of this service, which passed from a 57 % in 2012, until reaching a 101 % at the end of 2015.
Following, Graphic 59 shows the total subscriptions per quarter registered during the 2014-2015 period. As shown, a 12.3 % variation is observed in this period, which indicates that the mobile Internet market experienced during the last years a steady growth in the number of customers.
As shown, in 2015 a quarter-by-quarter growth occurred and the year closed with 508 494 active subscriptions, more than the amount recorded in the first quarter, which represents a 11.7 % variation during the year.
66

Data Transfer Data Transfer
A detailed analysis is performed in connection with the composition of the number of subscriptions, the review is shown, in most of the cases, by quarter during 2015, and annually for certain cases where previous years information is available. This analysis shows subscriptions per access device, form of payment and speed.
One point of interest in the mobile Internet market is the distribution of subscriptions per access device, given that still USB devices and other receivers that provide access to mobile Internet are found in the market.
As shown in Graphic 60, the number of subscriptions via mobile phones represents 98 % of the total market, while the other mentioned devices represent the remaining 2 %, figure that remains constant in each quarter for the year 2015, possibly because these devices cover the need for Internet access in areas where the supply of fixed services is insufficient.
Following, the conformation detail of the 98 % of the subscriptions thru mobile devices is analyzed. Firstly, the details per form of payment are presented.
Graphic 61 presents the annual behavior of the mobile market in terms of prepaid
and postpaid subscriptions, where it is observed that
subscriptions have varied from 2013 to 2015. It is
noted that the postpaid service had a slight decrease in 2014, though experienced a recovery in 2015; on the other hand, the prepaid service shows a steady growth year after year.
Hereafter, Graphic 62 presents a per
quarter analysis for the 2014-2015 period. The
percentage of prepaid and postpaid customers
is shown for each quarter with the intention to see the
subscribers’ variation over time. It is noted how the percentage of prepaid
67

Data Transfer
customers decreased from 78.3 % during the first quarter of 2014 to 73.9 % during in the fourth quarter of 2015.
However, as noted, only during the year 2015 the tendency among postpaid subscriptions and prepaid subscriptions remained almost constant quarter-by-quarter. The number of postpaid customers ranged at most in 1.3 % of total mobile customers, i.e. 24.9 % in the first quarter and 26.2 % in the third quarter, therefore, the amount of prepaid
subscriptions recorded its highest share in the first quarter with 75.1 %
and its lowest share in the third quarter with a 73.8 %.
It should be noted that as in 2014, the relationship
between prepaid and postpaid in 2015 was approximately of 3 to 1, which means that the prepaid wireless service is an important costumer source for operators.
To complement the description of the
subscriptions variable in the mobile Internet
market, graphic 63 shows hoy how these are
distributed according to the connection speed, variable
which, as observed, is defined by ranges.
According to data provided by the mobile operators and in accordance with the ranges established by SUTEL to collect the
information, only in four of the ranges of speed there are active connections to the mobile Internet service access, i.e. 0 to 256 kbps, 256 kbps to 512 kbps, 512 kbps to 2 Mbps and 2 Mbps to 10 Mbps.
The first two ranges together represent 40.6 % of the subscriptions during the first quarter, figure which drops to 34.9 % at the end of the fourth quarter. That means, 2015 closed with a smaller ratio of subscribers connected to speeds of less than or equal to 512 kbps.
The speed range between 512 kbps and 2 Mbps shows a positive variation during 2015, increasing from 33.8 % in the first quarter to 36.7 % in the fourth quarter. Finally, it is seen as the 2 Mbps to 10 Mbps range ended the year with a 28.4 % of subscriptions, 2.8 % more than at the beginning of 2015.
Briefly, Graphic 63 shows that on average during 2015, 73 % of the mobile Internet subscriptions purchased were below 2 Mbps. Now, to extend this, the percentage of prepaid and postpaid subscriptions can be further analyzed by speed range. Accordingly, graphic 64 graph shows the conformation by form of payment for each quarter during 2015.
It should be noted that graphic 64 is fully linked to graphic 63. First, it should be pointed out that the 0 to 256 kbps and 256 kbps to 512 kbps ranges are added to graphic 63, thus a 0 to 512 kbps range is created. Now, from graphic 63 it can be observed that during the first quarter this range recorded 40.6 % of the total subscriptions, and during the third and fourth quarters, it recorded 36.2 % and 34.9 %, respectively.
68

Data Transfer Data Transfer
Hereafter, graphic 64 shows each of the foregoing percentages by form of payment. 40.6 % of the subscriptions during the first quarter are divided into 2.2 % for postpaid users and 38.4 % for prepaid users; the 38 % observed during the second quarter is divided into 2 % for postpaid and 36 % for prepaid; the 36.2% observed during the third quarter is divided into 34.3 % for prepaid and 1.9 % for postpaid, and finally, the 34.9 % during the fourth quarter is comprised by a 33.2 % for prepaid and 1.7% for postpaid.
From the detail of the speed range from 0 to 512 Kbps, it can be concluded that a high percentage of prepaid customers access mobile Internet at low speeds. This analysis is reproduced for the other two speed ranges, i.e. from 512 kbps to 2 Mbps and 2 Mbps to 10 Mbps. In both ranges the scenario changes, i.e. increasing the number of postpaid customers in each. For 512 kbps to 2Mbps range, which covers the largest number of subscriptions, 13.2 % of the total during the first quarter and 14 % of the total during the second, third and fourth quarters.
Income
In addition to the subscription results, the mobile Internet access service study comprises the total revenue generated by the companies providing this service.
Graphic 65 shows the total volume of revenue per year for the mobile Internet service during the period from 2013 to 2015. During that period, a sustained profit growth is observed for network operators, which records a 81 %
variation, as it moves from 94 000 million in 2013 to more than 170 000 million colones in 2015.
Graphic 66 shows the total revenue for each quarter during 2014-2015. It should be emphasized that the figures shown include revenues generated from mobile Internet through devices connected to second, third and fourth generation networks, either mobile or USB devices, as well as WiMax mobile, which has a small stake. As shown in graphic 66, growth has been sustained during the period and shows a 52 % variation.
Graphic 66 provides an approximation of the revenue growth during 2015. Nearly a 10 000 million growth is observed between the fourth quarter of 2014 and the fourth quarter of 2015, representing a 27 % increase.
The analysis of total revenue for 2015 is supplemented as in the subscription analysis, with the income distribution by device, form of payment and speed ranges.
The relationship between revenues from subscribers using mobile phones and those connected via USB devices and others, are shown in Graphic 67. It is noted that the income from mobile subscriptions represents 96 % of the total during each of the quarters of the year .
In the same manner as the subscription detail was presented, in this case the annual performance of the mobile market is shown in terms of revenue by form of payment. Only revenue generated by mobile telephones is considered, as 96 % of the income is
69

Data Transfer
obtained from such devices. Graphic 68 enables to observes the income variation during the 2013-2015 period.
As shown, revenues have increased year-after-year. Prepaid revenues show a 73 % variation and postpaid an 83 % variation. Prepaid growth during 2014 and 2015 is highlighted, with a 44 % year-by-year growth; and for the same period, postpaid revenues experienced a 27 % growth.
The breakdown by form of payment is shown in Graphic 69, which shows the percentage distribution by quarter for revenues during the 2014-2015 period. A similar income situation can be observed in all quarters, which remain near a 50 % in each form of payment, although prepaid income are slightly higher.
As previously stated, the relationship between postpaid and prepaid subscriptions in 2015 is about 3 to 1; nevertheless, graphic 69 shows that the ratio of the income for the both types of payment is almost 1 to 1. During the first quarter, prepaid revenues totaled up to 52 % and therefore the postpaid revenues represented a 48 % of the total income; this remains similar throughout the year, except in the third quarter where the difference slightly increased, with 54 % for prepaid and 46 % for postpaid. This parity between prepaid and postpaid revenue was largely due to a higher volume of prepaid customers and to pricing differences between postpaid plans and prepaid data downloading.
To conclude the income distribution analysis for mobile Internet in mobile telephone devices, the percentage of these is reviewed based on speed range. Explanation is
made that not all operators submitted this information with the required accuracy, thus only three ranges of speed can be included in this report: 512 kbps to 2 Mbps, 2 Mbps to 10 Mbps and a unspecified range of speeds, which when contrasted with the subscription analyses, is observed to be at speed lower than 512 Kbps.
Graphic 70 enables to show how ranges -as a whole- of 512 kbps to 2 Mbps and 2 Mbps to 10 Mbps have a smaller share of revenues, compared to the unspecified speed; the quarterly average of the both ranges is approximately 37.3 %, while the group of unspecified speeds does totals over 62 % of the total income for the mobile internet market thru mobile devices. This implies that the majority of the costumers connected to low speeds generated the largest share of income by speed range.
Traffic
A brief analysis of data traffic on mobile networks is shown below. Graphic 71 enables to observe that data consumption has been increasing from 24 270 TB in 2013 to 74 933 TB during 2012015 , this represents 209 % variation for the period shown. Accordingly, the trend is clear and it shows that users in Costa Rica consume a greater amount of data each yearyea, for instance, between 2014 and 2015 the annual growth was of 97 %.
To expand the analysis, graphic 72 is presented, where the quarterly detail for the 2014-2015 period can be observed. It can be observedshows how in the first quarter of 2014 the total estimated data was
70

Data Transfer Data Transfer
In this service modality, the operators involved in the provision of the service compete using different technology platforms -wired and wireless connections-. More than 20 service providers reported their data for this publication, as many of these are companies that offer the service along with cable television through HFC networks.
Subscriptions
Regarding the total subscriptions per year in the period 2012-2015, in graphic 73 enables to observe that 448 594447 947 subscriptions were recorded in 2012, while in 2015 this increased to 558 656, with a 25 % variation during the period. In the last year, growth in comparison to 2014 was of 8 %.
Graphic 74 shows the number of connections per quarter during the period 2014 to 2015. It is noted that the variation in this period was of 12.4 %. It is further appreciatedappreciate, that by the end of the fourth quarter of 2015, 558 656 subscriptions were accounted and when said figure is associated to the
number of registered households, as per the last national household survey, the result obtained is a penetration of 38.9 %, hence an additional 2% in comparison with 2014. With the estimated population at the end of 2015, the per capita penetration rate was of 11.6 %.
approximately over 8000 TB, while in the fourth quarter of 2015 this number nearly tripled reaching 23 504 TB that represents a 184 % variation, which is evidence that the mobile data market grows day-by-day, hence presenting new challenges for quality and service offering.
It is interesting to note that in 2015 the trend in the mobile Internet market showed a slight increase in subscriptions and revenues and a double-digit growth in traffic volume. Moreover, it is also observed that most subscribers access the Internet at speeds lower than 2 Mbps.
Internet via fixed networks
71

Data Transfer
In the last year, the in the number of subscribers between the first and fourth quarter was of 30 992 customers, which represents a 5.9 % variation.
For in depth analysis on the behavior of subscribers to this service, hereafter the analysis is sub-divided, in first instance by means of access, i.e. the use of wired or wireless connections, then the specific connecting technology and speed ranges shall be reviewed.
Graphic 75 shows the percentage of customers in each of the above-stated access means, where it is evident that wireless connections represent only a 3 % of the total, making it clear that access thru fixed wired networks (xDSL, HFC and optical fiber) predominate in terms of coverage, capacity and user preference.
Following, the technology conformation for each of these access means is presented, i.e. xDSL, HFC and optical fiber for wired means, and WiMax, Satellite and microwave for wireless means.
Graphic 76 shows the details by connection technology. Data was
gathered for HFC, xDSL and last mile optical fiber networks.
It is noted that the market share of the latter
increases gradually from 0.5 % in the first quarter to 1.2 % in the fourth quarter. Moreover, cable networks slightly exceed slightly xDSL networks in number of subscribers, given that the average cable networks
account for almost 53 % and xDSL for
about 46 % of the total subscribers.
Graphic 77 shows the participation percentages of
wireless technologies available on the market (satellite, WiMax and
72

Data Transfer Data Transfer
microwave). It is noted that the WiMax service continues to concentrate the majority of the subscriptions. In the first three quarters of 2015, WiMax concentrated about 87 % of the total subscriptions, while microwave subscribers represent little less than 10 % and satellite about 3.5 %. It should be noted that in the fourth quarter, microwave subscriptions increased to 11.7 % of the total.
The number of subscriptions per speed range and per access means is shown in graphic 78, where the details for fixed networks with wired means can be observed. For speeds of less than 256 kbps, a quarterly average of nearly 0.012 % of the subscriptions’ is obtained, for speeds between 256 kbps and 512 kbps the quarterly average is of 3 %, for the 512 kbps to 2 Mbps range, said average is of 51 % and for speeds between 2 Mbps to 10 Mbps the quarterly average obtained is of 44.3 %. This indicates that more than half of the subscribers purchase services with speeds of less than or equal to 2 Mbps, however, at the end of the year, a slightly increase is observed in the percentage of subscriptions with speeds over 2 Mbps.
Graphic 79 shows the distribution by speed ranges for the total number of subscriptions’ thru wireless means. In particular it is noted that on average 31.6 % of wireless links have speeds higher than 10 Mbps, which is probably explained by the presence of business customers in this fixed Internet access market share. The quarterly percentage for the 512 kbps to 2Mbps range fluctuated between 30.3 % and 6.2 % during the year, and for speeds lower than 10 Mbps but higher than 2 Mbps, the variation was between 27.2 % and 35.8 % during the year.
IncomeIn terms of total income from the fixed Internet access market, graphic 80 shows the annual evolution within the 2013-2015 period. An increase is observed in 2015, with 42.8 % variation within the period and a 5 % annual increase from 2014 to 2015.
Graphic 81 shows the total income evolution -by quarter- during the period under review. The behavior is slightly variable. An average of 23 653 million per quarter and a 8 % variation is maintained.
If 2015 is independently examined, it can be observed that the fourth quarter closed at 25 004 million colones, with a 6 %. Variation.
The total income is divided according to the means of access, connections in wired networks and systems with wireless connection. Graphic 82 suggests that, similar to what happened with the number of subscriptions, the percentage of wireless service revenues is much lower: 4 % at year-´s end.
Graphic 83 shows the income distribution in wired networks, according to the three technologies in which data is recorded: HFC, xDSL and opticaloptic fiber.
Despite that Internet access over opticaloptic fiber represented only 1% of the quarterly subscriptions in 2015, it meant about 12.4 % of total quarterly revenues. This is due to its market value, quality of service and restricted supply. It is noted that HFC networks generated approximately 41 % of the total income each quarter, while xDSL networks produced around 46 % each quarter.
73

Data Transfer
Graphic 84 shows the percentage of each of the three wireless technologies available on the market: Satellite, WiMax and microwave. Satellite connections received, on average, 3 % of the quarterly revenues. Microwave connections have fewer subscribers than WiMax, as this produced, on average, 50.5 % of the quarterly revenues. Finally, WiMax received 46.6 % of the quarterly revenue. It is evident in the graphic that
WiMax revenues decreased towards the end of the year, while microwave connections increased.
Breaking down the total income earned in the retail fixed Internet segment, according to the speed ranges purchased by customers with Internet access via fixed networks using wired media, it can be observed that the largest share of those revenues are generated in the 2 Mbps to 10 Mbps range. This range closed the year with a 55.8 % revenue market share, followed by the range of 512 kbps to
2Mbps that received 28.9 % and speeds between 10 Mbps and 100 Mbps
represented a 11.3 % at the end of the year. Such behavior is
observed in graphic 85.
Moreover, graphic 86 presents the income distribution by speed ranges in the fixed retail segment using wireless access means. Similarly, it is observed that the largest share of income is in the 2 Mbps to 10 Mbps range, which closed the year with
a 53.4 % of the total, while speeds
between 512 kbps and 2 Mbps closed
with a 35.2 % of the total revenue, and then the
speeds higher than 10Mbps and lower than 100Mbps closed
the year with 9.5 %.
74

Data Transfer Data Transfer
Wholesale access to fixed Internet
Traffic
To conclude the retail fixed Internet segment study, below is shown the revision that was made to the data traffic reported by network operators and service providers. Graphic 96 shows the annual evolution between the years 2014 to 2015. Significant growth in the amount of data transferred over fixed access networks is observed. The simple growth for this period is of 95 %.
Graphic 88 shows the quarterly for 2014-2015 period. A sustained growth is noticeable from the beginning of 2014; however, growth is higher from the fourth quarter of 2014 to the first quarter of 2015. A 207 % variation is observed during the period.
As noted, 2015 closed with more than 76 000 TB during the fourth quarter and a 37 % variation. These figures reflect the growing trend of data consumption by fixed network subscribers.
Graphic 89 chart shows the distribution of traffic by connecting technology in the fixed network for each quarter of 2015. It can be observed that data consumption prevails in the case of customers with access over HFC networks, which gradually increased their share from the first quarter to close the year with 67.9 %. XDSL networks closed the year with 30.4 %, while only a 1.8 % was jointly recorded for microwave, WiMax and optic fiber.
For the first time the analysis of the behavior of the wholesale segment is set forth below, where operators offer the service to other service providers. Information was gathered from 7 network operators, which was classified by connecting technology and speed ranges on the market, additionally, subscriptions’ data and income are shown.
Subscriptions
The total subscriptions’ during 2015 for this market segment are shown in graphic 90; where a significant growth is observed in the last quarter, which represents a 20 % variation for the period. Following, the study extends by reviewing the percentage distributions by technology and speed.
Percentage distribution is shown for each quarter by access technology type; details are observed in graphic 91.
Four types of technology are classified that, according to the operators, are being marketed in the fixed Internet access wholesale market. Passive fiber networks have the highest number of subscriptions, with a quarterly average of 74.1 %. Meanwhile the quarterly share of SDH and DWDM fluctuates, ranging between 9.7 % and 7.6 % for SDH and between 14.2 % and 6.8 % for DWDM.
Graphic 92 shows the quarterly composition of total subscriptions in the wholesale segment, according to the speed ranges in
75

Data Transfer
which the service is offered. It can also be observed which of these ranges market the largest number of connections. Speed ranges between 2 Mbps and 10 Mbps and 600 Mbps to 100 Mbps are the ones showing the largest amount of subscribers. During the first quarter between both ranges a 66.7 % is accounted, of which the speeds between 2 Mbps to 10 Mbps represent a 35 %. In the fourth quarter, these same ranges represent
a 62.5 % share, of which the speeds between 2 Mbps and 10 Mbps represent a 43.1 %. This means that connections at speeds lower than 10 Mbps have increased towards the end of the year, hence in detriment of the number of customers at speeds over 100 Mbps.
Income
A review of the total income reported in the wholesale segment during 2015 is made. Graphic 93 shows how the total income exceeds 1300 million colones in the first quarter, figure that fluctuates during the year, with a -5 % variation over the period.
While comparing graphic 90 with graphic 93, it is evident that the growth of subscriptions
(20 %) is not reflected in the total income growth rate, which on average showed a negative behavior (-5 %), with a 14 % reduction of between the fourth and third quarters of the year.
Graphic 94 shows the quarterly distribution of income depending on the type of technology. It is noted that during the year subscriptions on passive fiber networks represented most of the revenues, with a quarterly
average of 63.2 %, followed by SDH connections with a 27.7 %.
Graphic 95 shows the percentage distribution by speed range. It can be
observed that the 2 Mbps to 10 Mbps range generated most of the revenue during the year, with a 47.7 % quarterly average, followed by the 100 Mbps to 600 Mbps range, reporting a 20.4 % quarterly average.
76

Data Transfer Data Transfer
Following, the service status of leased lines during 2015 is presented. It is important to note that information gathered for this service is classified by connecting technology, speed ranges, retail or wholesale segment and by geographical location of the customer, whether national or international.
To illustrate the behavior of this service, graphic 96 shows the evolution of connections for the 2012-2015 period. A year-after-year fluctuation is observed, while it rose in 2013, it decreased during 2014 and 2015. The period shows an 18 % variation, however, the annual growth from 2014 to 2015 was -13 %.
To expand the detail, graphic 97 shows the quarterly behavior during the 2014 to 2015 period. During this period a -14 % variation was experimented, given that since the first quarter of 2015 the number of connections has been decreasing.
Connections
Graphic 98 shows the customers’ distribution by geographic location or territory, where clearly it can be observed that 99 % of the service connections correspond to customers located within the national territory.
Meanwhile, understanding that the number of customers in the country is significantly higher, a detailed analysis is made in connection with the distribution of that 99% of the connections. For such purposes, graphic 99 shows the quarterly number of total connections.
The behavior towards the end of the year shows a slight decrease, as the fourth quarter recorded 200 connections less than at the beginning of 2015, representing -1 % variation. Graphic 100 details the percentage distribution of national connections between the wholesale market segment and the retail segment.
Graphic 100 shows that the percentage of connections in the retail segment represents –during the year- the largest market share, so, accordingly, the retail segment by customers located in the national territory is analyzed. A technology breakdown is presented. Graphic 101 shows that the variation for each type of technology remains relatively constant throughout the year. At the same time, it can be observed that over IP connections and virtual private networks remain the most widely used platforms to market leased lines, holding a 55.9 % quarterly average. It is interesting to note that analog lines still represent a 19.1 % quarterly average share in the number of total connections in the domestic retail segment, suggesting that the deployment of next generation networks has been slow. Finally, although not shown graphically, it should be noted that in the wholesale segment also IP-VPN connections cover almost the totality in that market segment.
Leased lines service
77

Data Transfer
Complementing the leased lines service review, a detail by connecting speed ranges for the retail segment and by customers in the country is presented. Graphic 102 evidences that the highest percentage of connections is at speeds lower than 2 Mbps, near a 68 % quarterly average. However, connections between 2 Mbps and 10 Mbps represent, on average, about 27 % of the domestic connections in the retail segment during 2015.
Income
The total revenues behavior reported by operators in the leased lines
service is shown below. Graphic 103 shows the annual situation
for the 2012-2015 period, with 6.5 % variations. 2015 closed with more than 36 000 million colones.
To thoroughly investigate the situation of the dedicated leased lines service, graphic 104 shows the quarterly evolution during the 2014-2015 period, where it can
becane observed that, based on the above-
stated connections’ analysis,analyses the leased
lines service has decreased in revenue, showing an -18.7 %
variation.
Graphic 105 presents a study –by geographical location- of the total revenue from the leased lines service. It is observed that customers with connections in the country cover 95.4 % of the total revenues, which makes it clear that operators with customers outside the country have a relative important contribution margin, if considered that they only represent 1 % of the connections.
Meanwhile, to better appreciate the volume of this service during 2015 , graphic 106 shows the total quarterly revenue during
78

Data Transfer Data Transfer
General information ofthe data transfer service
2015 for the domestic market. It is noted that the fourth quarter virtually closes with the same amount of income than at the beginning of the year, with only a 0.02 % variation.
After showing the total revenue generated by connections within the national territory, following the composition of the 95 % generated in the retail segment is reviewed. For such purposes, graphic 107 shows the percentage of income earned in each segment of the domestic market, where the retail segment covers about 83 % of revenue in each quarter.
Graphic 108 shows the details of leased lines services composition in the domestic retail segment, as per the available connecting technologies. The most commonly traded technologies are connections to virtual
private networks and IP technologies, which generate, on average, 60.4 % of total market revenues. Graphic 108 additionaly shows that, on average, analogue lines still represent 19.1 % of the connections, thus they only represent 3.8 % of the total quarterly average income. In turn, digital connections represent, on average, 33.1 % and other services such as dark fiber, frames and port leasing, represent, on quarterly average, 2.6 %.
Graphic 109 indicates the percentage of revenue by speed ranges, it is observed that speeds lower than 2Mbps, cover, on quarterly average, 33.4 % of the total revenues, speeds between 2 Mbps and 100 mbps generated a 50 % quarterly average of revenues and speeds higher than 100 mbps generated, on quarterly average, 16.4 %, the latter covering solely 1 % of the connections.
Relevant information for the evaluation of this market is presented below. Such information arises from bandwidth-under contract- data gathered from 23 companies. Said data vary varies from company to company, both in the number of purchased connections and in the amount of Gbps acquired, accordingly, with the intention to estimate a price in colones per Gbps that represents an amount equal to half the
rate paid by the operator to purchase their bandwidth, the median for the bandwidth contracted by operator and the median price paid in colones was estimated. This The Gbps price totals 1 070 953 colones and is calculated at the end of 2015. It should be noted that this it is is positioned right in the middle of the recorded data, which means that there are operators who paid prices well above this amount to acquire bandwidth.
79

Data Transfer
The total bandwidth recorded in 2015 was 180.2 Gbps, which compared to the 117.6 Gbps recorded in 2014, represents a 24 % variation in the amount of bandwidth used to access the Internet. This number is relevant however lower than the 46 % growth estimated by the Telegeography in its global bandwidth research for connections from Latin America to the United States.
Another important detail is the market share in terms of number of subscriptions. Therefore,
below are presented a number of graphics are presented showing
the participation shares for the retail segment of
leased line services, fixed Internet
(wireless and wired), and
w i r e l e s s Internet.
Graphic 110 shows the market share by subscriptions for companies that provide fixed Internet access through wired media. Only the top 5 companies holding market share are shown, as these cover 95 % of the total registered during 2015. It is noted that ICE continues to dominate in this segment with 45.4 % of the subscriptions, followed by Tigo and Cabletica, which together represent a 39 % of the market share.
Graphic 111 shows that the distribution share of the 5 operators covers 99 % of the subscribers accessing the Internet thru fixed wireless means. It is observed in the graphic how IBW and ICE cover 86% of this service, both over WiMax; also, that from the service providers using microwave, only Metrowireless appears in the top 5 with a 4% share.
Graphic 112 shows the details of the national leased lines retail segment. Only the top 5 operators holding market share are shown, as these represent 94 % of the total market. It can be concluded from graphic 112, that ICE continues to dominate this market as it holds a 68 % stake and provides various types of connection. Meanwhile, RACSA and Tigo, through various technologies, contribute with 20 % of the subscriptions.
Finally, graphic 113 allows to observe the market shares of the 3 mobile network operators holding a spectrum concession, which represent 99 % of the market. It is evident that ICE dominates the market, as it concentrates more than half of the customers. Meanwhile Claro covers 26 % of the market and Telefonica 21 %.
80

Data Transfer Data Transfer
Graphic N° 58Costa Rica: Subscription, Internet access via the mobile network, by year, 2012-2015
2 670 208
3 543 419
4 290 377
4 861 898
2012 2013 2014 2015Source: SUTEL, Directorate-General for Markets.
Graphic N° 59Costa Rica: Subscriptions, Internet access via the mobile network, by quarter, 2014-2015
4 330 695 4 336 8214 084 140 4 290 377 4 353 404 4 444 433 4 627 875
4 861 898
Q1 Q2 Q3 Q4 Q1 Q2 Q3 Q4
2014 2015Source: SUTEL, Directorate-General for Markets.
Graphic N° 60Costa Rica: Subscriptions, Internet access via the mobile network,
percentage distribution per access device, by quarter, 2015
98 % 98 % 98 % 98 %
2 % 2 % 2 % 2 %
Q1 Q2 Q3 Q4
Mobile OthersSource: SUTEL, Directorate-General for Markets.
81

Data Transfer
Graphic N° 61Costa Rica: Subscriptions, mobile Internet access, comparison by form of payment,
2013-2015
2 717 475
1 115 227
3 173 234
1 044 167
3 530 595
1 246 812
Prepaid Postpaid
2013 2014 2015Source: SUTEL, Directorate-General for Markets.
Graphic N° 62Costa Rica: Subscriptions, Internet access via the mobile network,percentage distribution by form of payment, by quarter, 2014-2015
21.7 % 22.8 % 23.8 % 24.8 % 24.9 % 26.0 % 26.2 % 26.1 %
78.3 % 77.2 % 76.2 % 75.2 % 75.1 % 74.0 % 73.8 % 73.9 %
Q1 Q2 Q3 Q4 Q1 Q2 Q3 Q4
2014 2015
Prepaid PostpaidSource: SUTEL, Directorate-General for Markets.
Graphic N° 63Costa Rica: Subscriptions, Internet access via the mobile network,
percentage distribution by speed range, by quarter, 2014-2015
39.6 % 37.0 % 35.3 % 34.1 %
1.0 % 1.0 % 0.9 % 0.8 %
33.8 % 35.6 % 36.3 % 36.7 %
25.6 % 26.4 % 27.5 % 28.4 %
Q1 Q2 Q3 Q4
V ≤ 256 Kbps 256 Kbps < V ≤ 512 kbps 512 Kbps < V ≤ 2 Mbps 2 Mbps < V ≤ 10 MbpsSource: SUTEL, Directorate-General for Markets.
82

Data Transfer Data Transfer
Graphic N° 64Costa Rica: Subscriptions, Internet access via the mobile network,
percnetage distribution by form of payment and speed range, by quarter, 2015
38.4 % 36.0 % 34.3 % 33.2 %
20.6 % 21.5 % 22.0 % 22.4 % 16.1 % 16.5 % 17.5 % 18.2 %
2.2 % 2.0 % 1.9 % 1.7 %
13.2 % 14.1 % 14.13 % 14.3 % 9.5 % 9.9 % 10.0 % 10.1 %
Q1 Q2 Q3 Q4 Q1 Q2 Q3 Q4 Q1 Q2 Q3 Q4
0 Kbps < V ≤ 512 kbps 512 Kbps < V ≤ 2 Mbps 2 Mbps < V ≤ 10 Mbps
Prepaid Postpaid Source: SUTEL, Directorate-General for Markets.
Graphic N° 65Costa Rica: Income, Internet access via the mobile network,
2013-2015Annual figures in millions of colones
94 006
127 198
170 421
2013 2014 2015Source: SUTEL, Directorate-General for Markets.
Graphic N° 66Costa Rica: Income, Internet access via the mobile network,
quarterly in millions of colones, 2014-2015
29 050 31 450 31 71434 944
39 56942 080 44 499 44 273
Q1 Q2 Q3 Q4 Q1 Q2 Q3 Q4
2014 2015
Source: SUTEL, Directorate-General for Markets.
83

Data Transfer
Graphic N° 67Costa Rica: Income, Internet access via the mobile network.
Percentage distribution by device, by quarter, 2015
96 % 96 % 96 % 96 %
4 % 4 % 4 % 4 %
Q1 Q2 Q3 Q4
Mobile Others Source: SUTEL, Directorate-General for Markets.
Graphic N° 68Costa Rica: Income, Internet access via the mobile network,
comparision by form of payment in millions of colones, 2013-2015
49 94542 135
60 288 60 803
86 58177 188
Prepaid Postpaid
2013 2014 2015Source: SUTEL, Directorate-General for Markets.
Graphic N° 69Costa Rica: Income, Internet access via the mobile network.
Percentage distribution by form of payment, by quarter, 2014-2015
50 % 47 % 53 % 51 % 52 % 53 % 54 % 51 %
50 % 53 % 47 % 49 % 48 % 47 % 46 % 49 %
Q1 Q2 Q3 Q4 Q1 Q2 Q3 Q4
2014 2015
Prepaid PostpaidSource: SUTEL, Directorate-General for Markets.
84

Data Transfer Data Transfer
Graphic N° 70Costa Rica: Income, Internet access via the mobile network.
Distribution by speed range, by quarter, 2015
64.5 % 62.0 % 62.2 % 61.5 %
7.5 % 8.5 % 9.3 % 10.3 %
27.9 % 29.4 % 28.4 % 28.0 %
Q1 Q2 Q3 Q4
Not specified 512 Kbps < V ≤ 2 Mbps 2 Mbps < V ≤ 10 MbpsSource: SUTEL, Directorate-General for Markets.
Graphic N° 71Costa Rica: Data traffic, Internet access via the mobile network.
In TB, by year, 2013-2015
24 270
37 965
74 933
2013 2014 2015Source: SUTEL, Directorate-General for Markets.
Graphic N° 72Costa Rica: Data traffic, Internet access via the mobile network.
In TB, quarterly, 2014-2015
8268 84259956
11 316
14 66316 821
19 945
23 504
Q1 Q2 Q3 Q4 Q1 Q2 Q3 Q4
2014 2015Source: SUTEL, Directorate-General for Markets.
85

Data Transfer
Graphic N° 73Costa Rica: Subscriptions, fixed internet access, annually,
2014-2015
447 947484 883
515 840558 656
2012 2013 2014 2015Source: SUTEL, Directorate-General for Markets.
Graphic N° 74Costa Rica: Subscriptions, fixed Internet access, quarterly,
2014-2015
497 092 502 655 504 105 515 840 527 664 537 483 547 558 558 656
Q1 Q2 Q3 Q4 Q1 Q2 Q3 Q4
2014 2015Source: SUTEL, Directorate-General for Markets.
Graphic N° 75Costa Rica: Subscriptions, fixed Internet acces, by means of access, end of 2015
3 %
97 %
Wireless WiredSource: SUTEL, Directorate-General for Markets.
86

Data Transfer Data Transfer
Graphic N° 76Costa Rica: Subscriptions, fixed Internet access.
Percentage distribution of subsriptions, wired means, by technology, quarterly, 2015
52.2 % 52.7 % 52.9 % 53.5 %
47.2 % 46.6 % 46.3 % 45.3 %
0.5 % 0.6 % 0.8 % 1.2 %
Q1 Q2 Q3 Q4
HFC xDSL Optical FiberSource: SUTEL, Directorate-General for Markets.
Graphic N° 77Costa Rica: Subscriptions, fixed Internet access.
Percentage distribution of subscriptions, wireless means, by technology, quarterly, 2015
3.5 % 3.5 % 3.1 % 3.3 %
86.8 % 86.7 % 87.2 % 85.0 %
9.7 % 9.8 % 9.8 % 11.7 %
Q1 Q2 Q3 Q4
Satellite WiMax MicrowaveSource: SUTEL, Directorate-General for Markets.
Graphic N° 78Costa Rica: Subscriptions, fixed Internet access.
Percentage distribution of subscriptions, wired means, by speed ranges, quarterly, 2015
3.5 % 3.1 % 2.8 % 2.6 %
52.1 % 51.5 % 50.8 % 49.5 %
42.8 % 43.7 % 44.6 % 46.2 %
1.0% 1.1 % 1.3 % 1.3 %0.012 % 0.013 % 0.013 % 0.010 %
Q1 Q2 Q3 Q4
V ≤ 256 Kbps 256 Kbps < V ≤ 512 kbps 512 Kbps < V ≤ 2 Mbps
2 Mbps < V ≤ 10 Mbps 10 Mbps < V ≤ 100 Mbps 100 Mbps < VSource: SUTEL, Directorate-General for Markets.
87

Data Transfer
Graphic N° 79Costa Rica: Subscriptions, fixed Internet access.
Percentage distribution of subscriptions, wireless means, by speed ranges, quarterly, 2015
2.7 % 2.4 % 2.0 % 2.0 %
36.2 % 34.6 % 30.3 % 32.0 %
27.2 % 32.1 % 35.8 % 34.8 %
33.5 % 30.6 % 31.6 % 30.8 %
0.4 % 0.3 % 0.3 % 0.4 %
Q1 Q2 Q3 Q4
256 Kbps < V ≤ 512 kbps 512 Kbps < V ≤ 2 Mbps 2 Mbps < V ≤ 10 Mbps
10 Mbps < V ≤ 100 Mbps 100 Mbps < VSource: SUTEL, Directorate-General for Markets.
Graphic N° 80Costa Rica: Income, fixed Internet access by year, 2013-2015
67 909
92 252 96 970
2013 2014 2015Source: SUTEL, Directorate-General for Markets.
Graphic N° 81Costa Rica: Income, fixed internet access by quarter,
2014-2015
23 05224 351
22 631 22 21723 556 24 096 24 314 25 004
Q1 Q2 Q3 Q4 Q1 Q2 Q3 Q4
2014 2015Source: SUTEL, Directorate-General for Markets.
88

Data Transfer Data Transfer
Graphic N° 82Costa Rica: Income, fixed internet access, by means of access, end of 2015
4 %
96 %
Wireless WiredSource: SUTEL, Directorate-General for Markets.
Graphic N° 83Costa Rica: Income, fixed Internet access via wired means,
by technology, quarterly, 2015
41.5 % 41.7 % 41.1 % 41.5 %
46.2 % 46.3 % 46.3 % 45.8 %
12.2 % 12.0 % 12.6 % 12.7 %
Q1 Q2 Q3 Q4
HFC xDSL FiberSource: SUTEL, Directorate-General for Markets.
Graphic N° 84Costa Rica: Income, fixed Internet access via wired means,
by technology, quarterly, 2015
2.4% 2.9% 3.3% 3.2%
53.5% 45.8% 47.2% 39.7%
44.1% 51.3% 49.5% 57.1%
Q1 Q2 Q3 Q4
Satellite WiMax MicrowaveSource: SUTEL, Directorate-General for Markets.
89

Data Transfer
Graphic N° 85Costa Rica: Income, fixed Internet acces viawired means, by speed ranges, quarterly, 2015
V ≤ 256 Kbps 256 Kbps < V ≤ 512 kbps 512 Kbps < V ≤ 2 Mbps2 Mbps < V ≤ 10 Mbps 10 Mbps < V ≤ 100 Mbps 100 Mbps < V
1.3 % 1.2 % 1.0 % 0.9 %
31.8 % 31.5 % 30.0 % 28.9 %
53.9 % 54.6 % 54.9 % 55.8 %
10.3 % 10.3 % 11.0 % 11.3 %
2.4 % 2.3 % 2.8 % 2.9 %
Q1 Q2 Q3 Q4
Source: SUTEL, Directorate-General for Markets.
Graphic N° 86Costa Rica: Income, fixed Internet access via wireless means,
by speed ranges, quarterly, 2015
256 Kbps < V ≤ 512 kbps 512 Kbps < V ≤ 2 Mbps 2 Mbps < V ≤ 10 Mbps10 Mbps < V ≤ 100 Mbps 100 Mbps < V
2.1 % 2.0 % 2.0 % 1.9 %
35.0 % 33.6 % 34.5 % 35.2 %
55.7 % 55.9 % 55.7 % 53.4 %
7.3 % 8.5 % 7.8 % 9.5 %
Q1 Q2 Q3 Q4
Source: SUTEL, Directorate-General for Markets.
Graphic N° 87Costa Rica: Data traffic, fixed Internet access, wired and wireless means,
annually, in TB, 2014-2015
138 545
270 427
2014 2015Source: SUTEL, Directorate-General for Markets.
90

Data Transfer Data Transfer
Graphic N° 88Costa Rica: Data traffic, fixed Internet access, wired and wireless means,
quarterly, in TB, 2014-2015
25 01231 850
38 28243 401
55 99864 760
72 942 76 726
Q1 Q2 Q3 Q4 Q1 Q2 Q3 Q4
2014 2015Source: SUTEL, Directorate-General for Markets.
Graphic N° 89Costa Rica: Data traffic, fixed Internet access by technology in TB,
quarterly, 2015
61.0 % 64.7 % 63.9 % 67.9 %
36.0 % 29.8 % 33.7 % 30.4 %
3.0 % 5.4 % 2.3 % 1.8 %
Q1 Q2 Q3 Q4
HFC xDSL Fiber/WiMax/MicrowaveSource: SUTEL, Directorate-General for Markets.
Graphic N° 90CCosta Rica: Subscriptions, wholesale access to fixed Internet, quarterly, 2015
120 117124
144
Q1 Q2 Q3 Q4Source: SUTEL, Directorate-General for Markets.
91

Data Transfer
Graphic N° 91Costa Rica: Subscriptions, wholesale access to fixed Internet,
percentage distribution by technology, quarterly, 2015
14.2 % 6.8 % 8.1 % 12.5 %
9.2 %8.5 % 9.7 % 7.6 %
68.3 % 77.8 % 75.8 % 74.3 %
8.3 % 6.8 % 6.5 % 5.6 %
Q1 Q2 Q3 Q4
DWDM SDH Fiber (xPON) OthersSource: SUTEL, Directorate-General for Markets.
Graphic N° 92Costa Rica: Subscriptions, wholesale access to fixed internet,
percentage distribution by speed ranges, quarterly, 2015
35.0 % 37.6 % 41.1 % 43.1 %
5.8 % 7.7 % 7.3 % 6.9 %
16.7 % 14.5 % 18.5 % 22.2 %31.7 % 29.1 % 22.6 % 19.4 %
9.2 % 9.4 % 8.9 % 6.9 %1.7 % 1.7 % 1.6 % 1.4 %
Q1 Q2 Q3 Q4
V ≤ 2 Mbps 2 Mbps < V ≤ 10 Mbps 10 Mbps < V ≤ 100 Mbps 100 Mbps < V ≤ 600 Mbps
600 Mbps < V ≤ 1 Gbps 1 Gbps < V ≤ 10 Gbps 10 Gbps < V ≤ 100 Gbps 100 Gbps < VSource: SUTEL, Directorate-General for Markets.
Graphic N° 93Costa Rica: Income, wholesale access to fixed internet, in millions of colones, 2015
13191426 1452
1252
Q1 Q2 Q3 Q4Source: SUTEL, Directorate-General for Markets.
92

Data Transfer Data Transfer
Graphic N° 94Costa Rica: Income, wholesale accesss to fixed Internet,percentage distribution by technology, quarterly, 2015
5.0 % 6.9 % 7.7 % 8.9 %
33.7 % 28.0 % 25.8 % 23.3 %
59.2 % 63.3 % 64.7 % 65.8 %
2.1 % 1.9 % 1.8 % 2.1 %
Q1 Q2 Q3 Q4
DWDM SDH Fiber (xPON) OthersSource: SUTEL, Directorate-General for Markets.
Graphic N° 95Costa Rica: Income, wholesale Internet access,
percentage distribution by speed ranges, quarterly, 2015
45.1 % 45.7 % 47.3 % 52.9 %
8.1 % 10.6 % 10.3 %3.8 %
25.7 % 19.7 % 18.5 % 17.7 %
9.9 % 12.4 % 12.6 % 15.5 %11.2 % 11.5 % 11.3 % 10.1 %
0%
20%
40%
60%
80%
100%
Q1 Q2 Q3 Q4
V ≤ 2 Mbps 2 Mbps < V ≤ 10 Mbps 10 Mbps < V ≤ 100 Mbps 100 Mbps < V ≤ 600 Mbps
600 Mbps < V ≤ 1 Gbps 1 Gbps < V ≤ 10 Gbps 10 Gbps < V ≤ 100 Gbps 100 Gbps < VSource: SUTEL, Directorate-General for Markets.
Graphic N° 96Costa Rica: Connections, leased lines service, by year, 2012-2015
11 993
16 375 16 286
14 195
2012 2013 2014 2015Source: SUTEL, Directorate-General for Markets.
93

Data Transfer
Graphic N° 97Costa Rica: Connections, leased lines service, by quarter, 2014-2015
16 572 16 371 16 155 16 28614 456 14 419 14 438 14 195
Q1 Q2 Q3 Q4 Q1 Q2 Q3 Q4
2014 2015
Source: SUTEL, Directorate-General for Markets.
Graphic N° 98Costa Rica: Connections, leased lines service, by geographical location, end of 2015
1 %
99 %
International NationalSource: SUTEL, Directorate-General for Markets.
Graphic N° 99Costa Rica: Connections, dedicated lines service, customers within the national territory,
quarterly, 2015
14 349 14 332 14 364 14 149
Q1 Q2 Q3 Q4Source: SUTEL, Directorate-General for Markets.
94

Data Transfer Data Transfer
Graphic N° 100Costa Rica: Connections, leased lines service.
Percentage distribution by retail and wholesale segment, quarterly, 2015
94.4 % 94.6 % 94.8 % 94.7 %
5.6 % 5.4 % 5.2 % 5.3 %
Q1 Q2 Q3 Q4
Retailer WholesalerSource: SUTEL, Directorate-General for Markets.
Graphic N° 101Costa Rica: Connections, leased lines service, retail segment, national costumers,
by technology, quarterly, 2015
55.4 % 55.2 % 56.1 % 57.0 %
20.3 % 19.3 % 18.6 % 18.4 %
22.8 % 23.3 % 23.5 % 23.0 %
1.6 % 2.2 % 1.8 % 1.6 %
Q1 Q2 Q3 Q4
IP-VPN Analog lines Digital links Frames/ports/OFSource: SUTEL, Directorate-General for Markets.
Graphic N° 102Costa Rica: Connections, leased lines service, retail segment, national customers,
by speed ranges, quarterly, 2015
26.1 % 24.8 % 23.8 % 23.2 %
6.9 % 6.9 % 6.5 % 5.6 %
37.7 % 37.1 % 37.2 % 37.4 %
24.7 % 25.9 % 27.2 % 28.5 %3.4 % 3.9 % 4.0 % 4.0 %1.2 % 1.4 % 1.3 % 1.2 %
0%
20%
40%
60%
80%
100%
Q1 Q2 Q3 Q4
V ≤ 256 Kbps 256 Kbps < V ≤ 512 kbps 512 Kbps < V ≤ 2 Mbps
2 Mbps < V ≤ 10 Mbps 10 Mbps < V ≤ 100 Mbps 100 Mbps < VSource: SUTEL, Directorate-General for Markets.
95

Data Transfer
Graphic N° 103Costa Rica: Income, leased lines service, by year, in millions of colones, 2012-2015
34 051
41 101 40 58836 202
2012 2013 2014 2015Source: SUTEL, Directorate-General for Markets.
Graphic N° 104CCosta Rica: Income, leased lines service, quarterly, 2014-2015
10 835 10 612 10 2118930 8910 9370 9193 8807
Q1 Q2 Q3 Q4 Q1 Q2 Q3 Q4
2014 2015Source: SUTEL, Directorate-General for Markets.
Graphic N° 105Costa Rica: Income, leased lines service, by geographical location, end of 2015
4.6 %
95.4 %
International NationalSource: SUTEL, Directorate-General for Markets.
96

Data Transfer Data Transfer
Graphic N° 106Costa Rica: Rica: Income, leased lines service, customers within the national territory,
2014-2015
84909014 8633 8492
Q1 Q2 Q3 Q4Source: SUTEL, Directorate-General for Markets.
Graphic N° 107Costa Rica: Income, leased lines service, as per retail and wholesale segments,
quarterly, 2015
83 % 83 % 82 % 82 %
17 % 17 % 18 % 18 %
Q1 Q2 Q3 Q4
Retail WholesaleSource: SUTEL, Directorate-General for Markets.
Graphic N° 108Costa Rica: Income, leased lines service, retail segment, national customers,
by technology and quarterly, 2015
59.9 % 59.4 % 60.5 % 61.7 %
4.5 % 3.7 % 3.6 % 3.6 %
33.6 % 34.2 % 33.0 % 31.9 %
2.1 % 2.7 % 2.9 % 2.9 %
Q1 Q2 Q3 Q4
IP-VPN Analogue lines Digital connectionslinks Frames/ports/OFSource: SUTEL, Directorate-General for Markets.
97
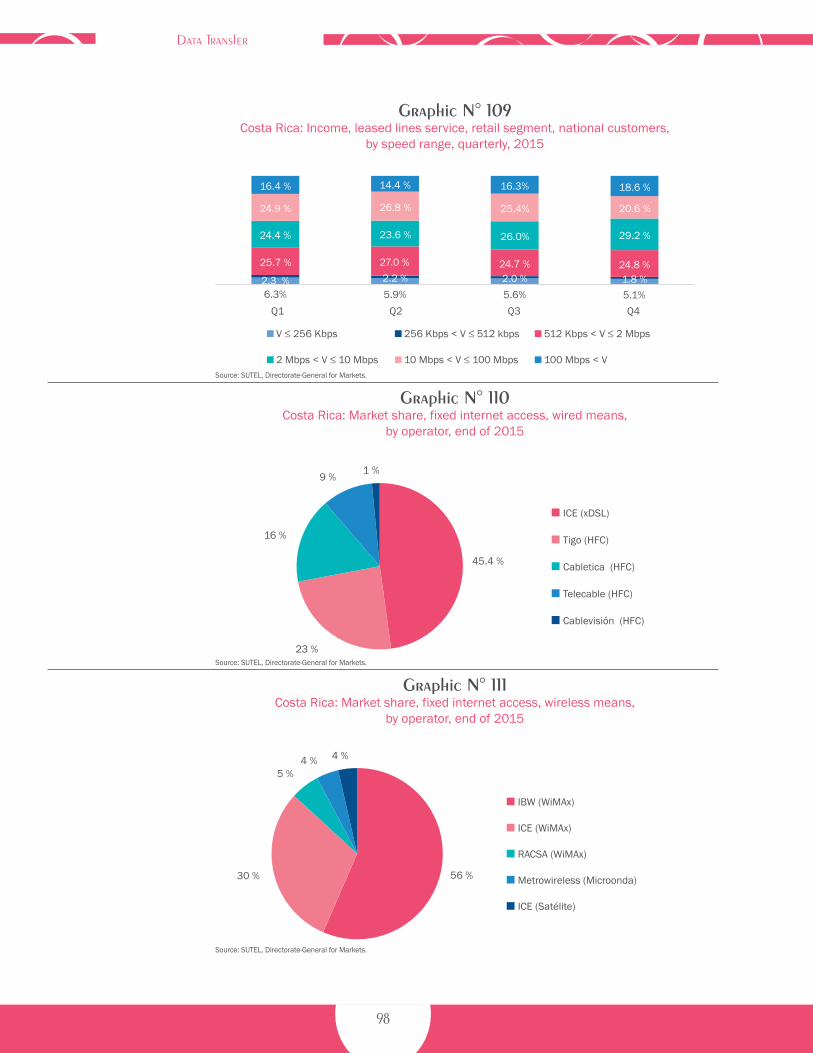
Data Transfer
Graphic N° 109Costa Rica: Income, leased lines service, retail segment, national customers,
by speed range, quarterly, 2015
6.3% 5.9% 5.6% 5.1%2.3 % 2.2 % 2.0 % 1.8 %25.7 % 27.0 % 24.7 % 24.8 %
24.4 % 23.6 % 26.0% 29.2 %
24.9 % 26.8 % 25.4% 20.6 %
16.4 % 14.4 % 16.3% 18.6 %
Q1 Q2 Q3 Q4
V ≤ 256 Kbps 256 Kbps < V ≤ 512 kbps 512 Kbps < V ≤ 2 Mbps
2 Mbps < V ≤ 10 Mbps 10 Mbps < V ≤ 100 Mbps 100 Mbps < VSource: SUTEL, Directorate-General for Markets.
Graphic N° 110Costa Rica: Market share, fixed internet access, wired means,
by operator, end of 2015
45.4 %
23 %
16 %
9 %1 %
ICE (xDSL)
Tigo (HFC)
Cabletica (HFC)
Telecable (HFC)
Cablevisión (HFC)
Source: SUTEL, Directorate-General for Markets.
Graphic N° 111Costa Rica: Market share, fixed internet access, wireless means,
by operator, end of 2015
56 %30 %
5 %4 % 4 %
IBW (WiMAx)
ICE (WiMAx)
RACSA (WiMAx)
Metrowireless (Microonda)
ICE (Satélite)
Source: SUTEL, Directorate-General for Markets.
98

Data Transfer Data Transfer
Graphic N° 112Costa Rica: Market share by operator, dedicated lines,
national retail segment, end of 2015
68 %
10 %
10 %3 % 2 %
ICE
Racsa
Tigo
Konectiva
REICO
Source: SUTEL, Directorate-General for Markets.
Graphic N° 113Costa Rica: Market share by operator, Mobile Internet, end of 2015
52 %
26 %
21 %
ICE (2G/3G/4G)
Claro (2G/3G/4G)
Telefónica (2G/3G/4G)
Source: SUTEL, Directorate-General for Markets.
99


Paid television
Chapter 5

Paid television
TítuloPaid television is a service that has shown a greater variety of commercial options and available technologies. Currently users have access to the service via coaxial cable, satellite, IPTV and microwave.
In 2015, subscriptions to the service grew by 64 684 over the previous year, which means an increase of 9 % and 60 % compared to 2014 and 2011, respectively. The breakdown of these figures can be seen in graphic 114.
If the quarterly information for the period 2014 is compared to 2015, it is observed that subscriptions had a stable growth. During the first two quarters of this year an 11 % growth is observed, in comparison to the same periods for the previous year. A 12 % and 9 % increase was observed during the third and fourth quarters, respectively, in comparison to the year 2014. On average, the foregoing growth represented 75 000 new quarterly subscriptions during 2015. A 3 % decrease is observed in the last quarter of the year 2015.
In relation to the behavior of subscriptions by type of access technology, paid
television via coaxial cable remains with the largest market share,
i.e.67 %, followed by satellite television with 32 %, and
other technologies hold the remaining 1 %, as shown in graphic 116. However, although the coaxial cable service has the largest market share, its percentage share has been declining if compared with previous years. The foregoing is observed
in graphic 117, where the numbers indicate
that the service via coaxial cable has weakened and
the average satellite service has steadily gained a largest
share.
Paid television
102

Paid television Paid television
According to the data presented in table 10, by measuring the penetration of the paid service, it can be highlighted that in 2015 more than half of the country’s housing had a purchased service, i.e. a 56 % total. This penetration rate increased by 4 % if compared to 2014. When comparing the number of houses during 2015 with the data of 2011, an increase of 18 percentage points is observed. See graphic 118.
Income
According to the data shown in graphic 119, the total revenue associated with the paid television service continues to show an upward trend, reaching 134 850 million colones during 2015, thus representing an 8 % if compared to 2014. The technologies that show revenue growth are satellite and coaxial cable technologies, with 13 % and 7 % respectively. The foregoing data can be observed in table 11.
If 2015 quarterly revenue is compared to that of 2014, an 8 % quarterly growth –on average- can be observed, which represents an average amount of 2615 million colones. This amount contrasts with the figure presented for the 2013 and 2014 periods, where the reported growth was of 5147 million colones, consequently representing a quarterly average growth of 20 %. Said figures are shown in graphic 120.
If the percentage share of income by technology during 2015 is analyzed, then it can be observed that the coaxial cable continues to dominate in this category, with a 73 % of the total income, followed
by satellite technology with 26 % and other technologies with 1 %. When the 2011 and 2015 periods are compared, the coaxial cable shows a percentage decrease, passing from 91 % in 2011 to 73 % in 2015. Satellite technology shows significant growth, moving from 9 % in 2014 to 26 % in 2015, while other technologies represented 1 % of the revenues. These figures are seen in detail in graphic 121.
As shows in graphic 122, the average revenue per user during the 2012 – 2013 period for the paid television service remains constant, albeit showing slight decreases. However, according to the data shown in table 30, during the last year the average revenue per subscriber to the paid television service by access technology shows a variable behavior. If the 2015 period is compared to 2014, it can be observed that the coaxial cable revenue increased by approximately 500 colones, satellite service decreased by 600 colones and the service showing the most significant decrease is the television over IP service with 14 400 colones less than in 2014.
103

Paid television
Graphic N° 114Costa Rica: Total subscriptions to the paid television service, annually, 2011-2015
Absolute annual figures
498 137540 693
641 042
732 546797 230
2011 2012 2013 2014 2015Source: SUTEL, Directorate-General for Markets.
Graphic N° 115Costa Rica: Subscriptions to the paid television service, quarterly,
2014-2015Absolute annual figures
666 945682 291
699 539
732 546742 216759 099
786 542 797 230
Q1 Q2 Q3 Q42014 2015
Source: SUTEL, Directorate-General for Markets.
1 %
Graphic N° 116
Coaxial cabletelevision
67 %
Satellitetelevision
32 %
Television over IP
Multipointtelevision
0 %
Costa Rica: Percentage distribution for subscriptions to the paid television service,by access technology, 2015
Percentage figures
Source: SUTEL, Directorate-General for Markets.
797 230 TV subscriptions
by 2015
67 %of the
subscriptions are via coaxial cable
104

Paid television Paid television
Graphic N° 117Costa Rica: Evolution of the percentage share for paid television technologies,
by access technology, 2011-2015Percentage annual figures
87 % 86 %76 % 70 % 67 %
13 % 14 %23 % 30 % 32 %
1 % 1 % 1 %
2011 2012 2013 2014 2015
Television over IPMultipoint television
Satellite television
Coaxial cabletelevision
Source: SUTEL, Directorate-General for Markets.
Graphic N° 118Costa Rica: Ration of houses with paid television services, 2011-2015
Percentage annual figures
38 % 41 %
48 %52 %
56 %
0 %
10 %
20 %
30 %
40 %
50 %
60 %
2011 2012 2013 2014 2015
Source: SUTEL, Directorate-General for Markets.
56 %More than half of the houses have a paid television service
Table 10Costa Rica: Ratio of houses with paid television services,
2011-2015Absolute annual figures and percentages
Subscription TV penetration 2011 2012 2013 2014 2015
Subscriptions 498 137 540 693 641 042 732 546 797 230Houses 1 297 522 1 326 805 1 348 036 1 399 271 1 436 120Ratio 38 % 41 % 48 % 52 % 56 %
Source: SUTEL, Directorate-General for Markets and INEC, 2011-2015.
105

Paid television
Graphic N° 119Costa Rica: Total income of the paid television service, 2011-2015
Annual figures in millions of colones
70 435
89 716 103 802
124 390 134 850
2011 2012 2013 2014 2015
Source: SUTEL, Directorate-General for Markets.
Graphic N° 120Costa Rica: Total income of the paid television service, 2014-2015
Quarterly figures in millions of colones
30 022
30 893
31 695 31 779
32 919
33 659 34 318 33 954
Q1 Q2 Q3 Q42014 2015
Source: SUTEL, Directorate-General for Markets.
Table 11Costa Rica: Total income of the paid television service, by access technology,
2011-2015Annual figures in millions of colones
Technology 2011 2012 2013 2014 2015Coaxial cable television 64 350 75 369 80 810 91 994 98 859Satellite television 6059 14 287 22 484 30 721 34 570Television over IP 447 1618 1371Television over ground multipoint distribution 26 61 61 57 49
Total 70 435 89 716 103 802 124 390 134 850 Source: SUTEL, Directorate-General for Markets.
106
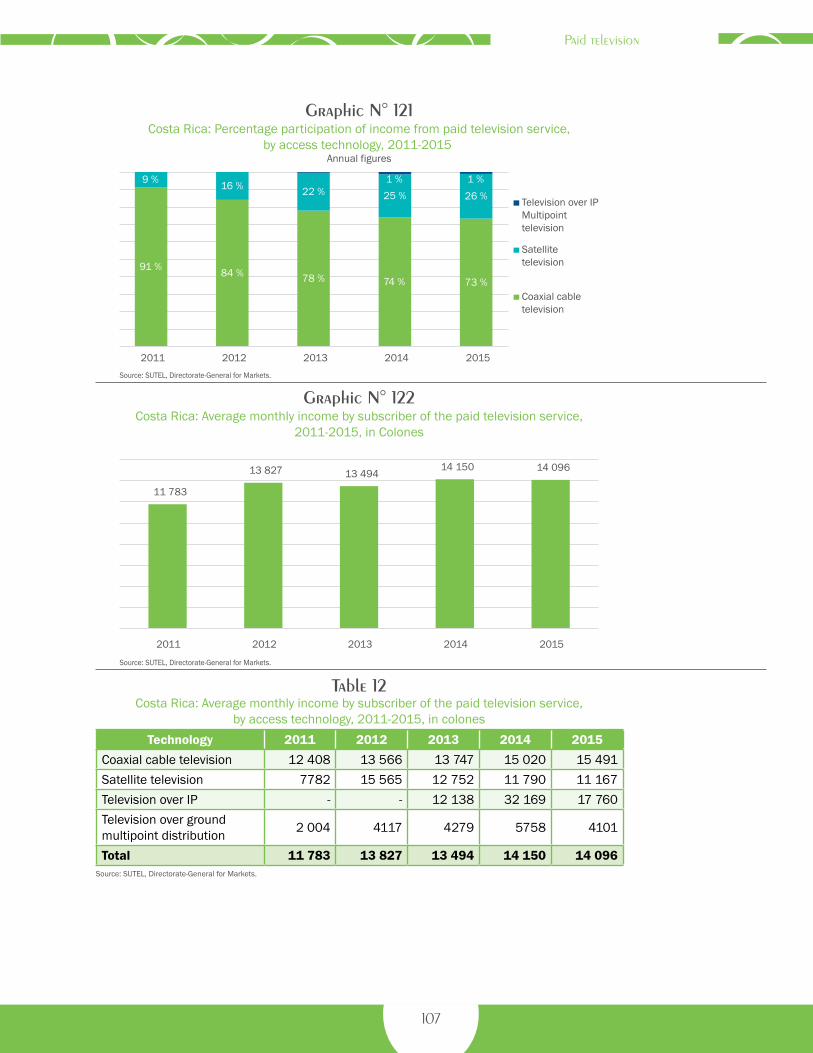
Paid television Paid television
Graphic N° 121Costa Rica: Percentage participation of income from paid television service,
by access technology, 2011-2015 Annual figures
91 % 84 % 78 % 74 % 73 %
9 % 16 % 22 % 25 % 26 %1 % 1 %
2011 2012 2013 2014 2015
Television over IPMultipointtelevision
Satellitetelevision
Coaxial cabletelevision
Source: SUTEL, Directorate-General for Markets.
Graphic N° 122Costa Rica: Average monthly income by subscriber of the paid television service,
2011-2015, in Colones
11 783
13 827 13 494 14 150 14 096
2011 2012 2013 2014 2015
Source: SUTEL, Directorate-General for Markets.
Table 12Costa Rica: Average monthly income by subscriber of the paid television service,
by access technology, 2011-2015, in colonesTechnology 2011 2012 2013 2014 2015
Coaxial cable television 12 408 13 566 13 747 15 020 15 491Satellite television 7782 15 565 12 752 11 790 11 167Television over IP - - 12 138 32 169 17 760Television over ground multipoint distribution 2 004 4117 4279 5758 4101
Total 11 783 13 827 13 494 14 150 14 096 Source: SUTEL, Directorate-General for Markets.
107


Prices and rates
Chapter 6

Prices and rates
Prepaid mobile telephonyIn 2015, telecommunications operators offered their prepaid mobile services at the maximum allowable tariff rate (40 Colones per minute), in contrast to 2013, when they offered the same services at 38 Colones per minute. Similarly, the minimum allowable tariff rate (27.60 Colones in 2015) – which was calculated considering the various options available to users, depending on peak/off-peak hours and the destination of the call – was higher than in the previous two years. In terms of average, the minimum tariff rate in 2015 increased by 3.8 Colones per minute in relation to 2014, as evidenced in graph 123 and table 13. In terms of proportion, the percentage increases in that period equals 1 %, which is well below the average increase recorded in 2013-2014 (7 %), mainly due to a lesser degree of promotions
offered by mobile telecommunications operators during 2015. In regards
to text messages, the 2015 rates reflect the maximum
allowable tariff set by the operators (3 Colones per message), as this service is not currently regulated due to the fact that it is classified as an information service, in accordance with
the provisions established by the Board of Directors of
ARESEP, in resolution RJD-019-2014 of April 4th, 2013.
Postpaid mobile telephonyIn 2015, in regards to postpaid mobile telephony plans, telecommunications operators offered their services at the maximum allowable tariff rate (34 Colones per minute, including sales tax), in contrast to 2013, when they offered the same services at approximately 30 Colones per minute. The minimum allowable tariff rate, consistent with the behavior of the minimum allowable tariff rate of prepaid mobile telephony services, increased in 2015 by 2.40 Colones in relation to 2014. Average rates increased in that biennium by 3 % to 16 %; this reflects an overall increase of 7 %, which is in stark contrast to the increase recorded in the 2013-2014 biennium (3 %). In -relation to text message rates, even though the maximum allowable tariff rate remained at 3 Colones per text message, the minimum tariff rate fell to 1.40 Colones per message (when sent to other users in the operator’s network). This meant that, unlike the previous two years (in which a 16 % increase was recorded), the rates decreased by 6 % from 2014 to 2015, as evidenced in graph 124 and table 14.
Mobile Internet Access
Regarding the mobile internet service provided by telecommunications operators and service providers, particularly the postpaid plan internet service, the tariff
Prices and rates oftelecommunication services
110

Prices and rates Prices and rates
rates vary greatly depending on the plan’s connection speed, as is the case with the rates of the wired internet service. Given that this service is provided by only three telecommunications operators, any change in the respective rates will have a significant impact in the resulting average rates. As such, considering one of these operators modified its rates according to what was offered in 2013, the rates in 2015 greatly resemble the rates of that year, in nearly every connection speed. The resulting average rates vary between 2623 Colones (for connection speeds of 256 Kbps) and 20 500 Colones (for connection speeds of 5120 Kbps); in general, these rates are lower than those recorded in 2014, with the exception of the average rates for connections speeds of 2048 Kbps and 4096 Kbps. The average rate of a 5120 Kbps connection in 2015 fell to 17 000 Colones; a significant decrease in relation to 2014 (24 000 Colones). Please refer to table 15, which shows the maximum and minimum average rates, and graph 125, which shows the variations in each of the rates.
In regards to the mobile internet service provided by telecommunications operators and service providers, particularly the prepaid plan internet service, the fact that operators are allowed to charge for data download volume means that – even though connection speed is in fact one of the variables considered when calculating the rate – the determining factor is the volume of information downloaded by users; therefore, for the purposes of this statistical report, that is the variable according to which the respective tariff rates are scrutinized. It should be noted, however, that in order to differentiate themselves from their
competitors, the services provided by telecommunications operators differ from one another, and as such – in regards to the information collected – some connections speeds are only offered by one of the three available service providers. Moreover, given that in 2013 the information was recorded in a different format, the results referenced herein correspond exclusively to the information recorded in 2014 and 2015, and are evidence of an overall increase in tariff rates in 2015, in relation to the previous year, that is consistent with the commercial offers made by the respective telecommunications operators. The results are shown in table 16 and graph 126; however this only includes the data of download volumes greater than 200 MB.
Internet Service Rates
Based on the information provided by the different telecommunications operators that provide internet service, in this section of the report a comparative analysis of the monthly rates charged for the fixed internet service in 2015 was performed. The analysis includes the variations in the rates in 2015, in relation to the rates recorded in the previous two years.
111

Prices and rates
This information was requested by SUTEL, and considers the different customers that subscribe to the internet service; the differences between any two customers are the type of connection (symmetric or asymmetric)1 and the oversubscription ratio2. Therefore, being as how these are the determining factors of the rate that is charged, these are the variables according to which the respective tariff rates are scrutinized. It is important to note that the offers are categorized in accordance with the information reported by the service providers and the corresponding oversubscription ratio. In each case, the maximum, minimum, and average rates are the relevant indicators under scrutiny, and are not organized by operator. This is due to the fact that the upload speed offered greatly differs from one service provider to another, and this prevents a proper comparison of the rates offered by the service providers.
Fixed internet service with oversubscription ratio of 1:20
Internet connectivity with an oversubscription ratio of 1:20 is the service offered by the majority of the telecommunications operators; since this service is offered at the lowest rate, it has the largest number of subscribers, particularly in asymmetric internet connections. Therefore, this service is primarily provided to the residential sector and, to a lesser extent, to small and medium enterprises. The rates of this service in 2015, for asymmetric internet connections, is shown in table 17.
With the exception of the 6144/1024 Kbps connection speed, which has a low number of subscribers, the comparative analysis shows a direct relationship between price and connection speed; the higher the connection speed, the higher the rate.
It should be noted that in 2015, the average variation ranges between 6902 Colones (for 256/128 Kbps connection speeds) and 29 403 Colones (for 10240/1024 Kbps connection speeds). The variation range, although similar to the range recorded the previous year, greatly differs from the average variation recorded in 2013 for the 10240/1024 Kbps connection speed, which rose to 45 999 Colones. This occurred despite a significant increase (44 % on average) in the tariff rates of the 256/128 Kbps connection speed, both in 2014 and 2015, in relation to the rate recorded in 2013 (4904 Colones). The variations in the rates at which the service is provided, in 2015 and in the previous two years, is shown in graph 127.
Fixed internet service with oversubscription ratio of 1:5
Another level of oversubscription in which there is an offer available that allows rates of the different connection speeds to be compared is the internet connectivity with an oversubscription ratio of 1:5. In this case, considering the characteristics of asymmetric connections, in addition to the behavior exhibited by the fixed internet service with oversubscription ratio of 1:20, the fact that there is a significantly higher number of service providers creates a direct relationship between price and connection speed. Overall
1 Symmetric connection speeds have the same download and upload speed. Asymmetric connection speeds have different download and upload speeds, being that the download speed is faster than the upload speed.
2 Oversubscription refers to how many connections (users) are contending for the same amount of bandwidth on the backhaul connection.
112

Prices and rates Prices and rates
– with the exception of the 5120/1024 Kbps connection speed, which has a lower rate than two of the slower connection speeds available – the faster the connection speed, the higher the rate. As expected, the rates recorded, which on average range between 33 782 Colones (for 512/256 Kbps connection speeds) and 127 251 Colones (for 10240/1024 Kbps connection speeds), are higher than those recorded for internet connectivity with oversubscription ratio of 1:20. The maximum, minimum, and average rates offered by service providers in 2015, for asymmetric connections with oversubscription level of 1:5, are shown in table 18.
The variations in the rates of asymmetric connections with oversubscription ratio of 1:5, in 2014 and 2015, are shown in graph 128. Overall, as evidenced in the graph, the rates offered in 2015 are lower than the rates recorded in the previous year3.
In regards to the symmetric internet service with oversubscription ratio of 1:5, based on the information recorded in 2013 and 2014, the higher the connection speed the higher the rate. In 2015, however, the relationship between the connection speed and the rate of the service is erratic (i.e.: some of the rates offered for certain connection speeds are lower than the rates of slower connection speeds). This variability can be explained by the number of service providers; the greater the number of providers for a particular service, the lower the resulting rate. Furthermore, due to this erratic behavior, the rates recorded in 2015 are higher than the
rates recorded in the two previous years, as evidenced in table 19 and graph 129.
Fixed internet service with oversubscription ratio of 1:1
Business clients generally require faster connection speeds, in addition to dedicated access to the connection channel. As such, it is understandable that the respective tariff rates rise as the oversubscr ipt ion ratio gets smaller. Bearing in mind the above-stated nature of the service, the maximum, minimum and average rates of symmetric internet connectivity in 2015 are shown in table 20.
Given that the average rates for this service in 2013 and 2014 are recorded in said table, the respective comparative analysis can be performed. In general, the average rate offered in 2015 increased in relation to the two previous years, as is evidenced in graph 130.
3 It is important to caveat that this case does not include a comparison with the 2013 data, given that within the available data for that year it was not possible to identify data that could –for comparative purposes- be associated with an access service to asymmetric Internet with a 1:5 oversubscription ratio.
113
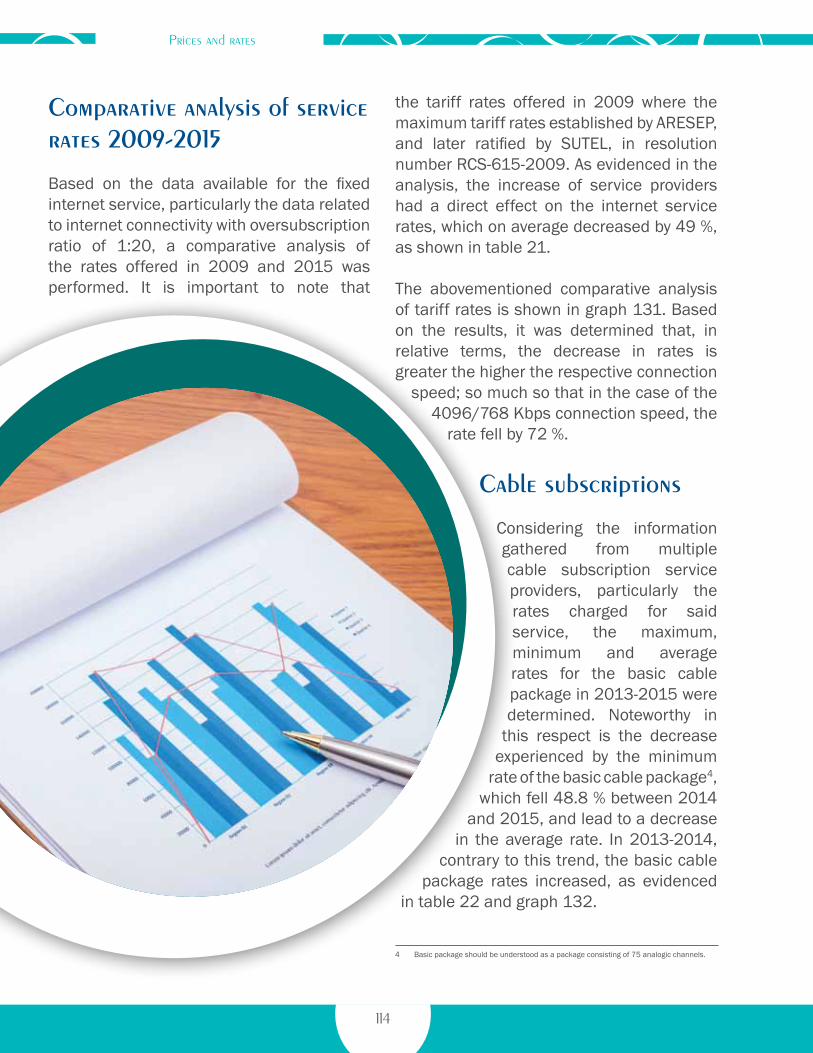
Prices and rates
Comparative analysis of service rates 2009-2015
Based on the data available for the fixed internet service, particularly the data related to internet connectivity with oversubscription ratio of 1:20, a comparative analysis of the rates offered in 2009 and 2015 was performed. It is important to note that
the tariff rates offered in 2009 where the maximum tariff rates established by ARESEP, and later ratified by SUTEL, in resolution number RCS-615-2009. As evidenced in the analysis, the increase of service providers had a direct effect on the internet service rates, which on average decreased by 49 %, as shown in table 21.
The abovementioned comparative analysis of tariff rates is shown in graph 131. Based on the results, it was determined that, in relative terms, the decrease in rates is greater the higher the respective connection
speed; so much so that in the case of the 4096/768 Kbps connection speed, the
rate fell by 72 %.
Cable subscriptions
Considering the information gathered from multiple cable subscription service providers, particularly the rates charged for said service, the maximum, minimum and average rates for the basic cable package in 2013-2015 were determined. Noteworthy in
this respect is the decrease experienced by the minimum
rate of the basic cable package4, which fell 48.8 % between 2014
and 2015, and lead to a decrease in the average rate. In 2013-2014,
contrary to this trend, the basic cable package rates increased, as evidenced
in table 22 and graph 132.
4 Basic package should be understood as a package consisting of 75 analogic channels.
114

Prices and rates Prices and rates
Graphic N° 123Costa Rica: Maximum and minimum rates per minute in prepaid telephony plans,
2013-2015
38.0
24.5
40.0
23.8
40.0
27.6
Maximum Rate Minimum Rate2013 2014 2015
Source: SUTEL, Directorate-General for Markets.
Table 13Costa Rica: Rates per minute by type of usage in prepaid telephony plans, 2013-2015
Peak/Off-peak Hours, prepaid plans2013 2014
Max rate Min rate Average
rateMax rate Min rate Average
rate
Average rate per minute of local calls in peak hours (on net), mobile telephony 38 18 31 40 14 31
Average rate per minute of local calls in off-peak hours (on net), mobile telephony 38 18 28 40 14 31
Average rate per minute of local calls in off-peak hours (off net), mobile telephony 38 28 32 40 29 35
Average rate per minute of local calls in peak hours (fixed network), mobile telephony 38 29 33 40 29 35
Average rate per minute of local calls in off-peak hours (fixed network), mobile telephony 38 25 30 40 29 35
Average rate per minute of local calls in peak hours (off net), mobile telephony 38 29 33 40 29 35
Average rate per minute of local calls made during-the-weekend/at-night (on net, other operator networks), mobile telephony
38 18 31 40 14 32
Average rate per minute of local calls made during-the-weekend/at-night (off net), mobile telephony 38 29 33 40 29 35
Average rate per minute of local calls made during-the-weekend/at-night (fixed network), mobile telephony
38 25 32 40 29 35
Average SMS rate (to other users in same network), mobile telephony 3.0 1.7 2.6 3.5 1.7 2.9
Average SMS rate (other operator networks), mobile telephony 3.0 1.7 2.7 3.5 1.7 2.9
Continued ...
115

Prices and rates
Peak/Off-peak Hours, prepaid plans2015 Average
variation 2013-2014
Average variation
2014-2015Max rate Min rate Average
rate
Average rate per minute of local calls in peak hours (on net), mobile telephony 40 29 34 2 % 10 %
Average rate per minute of local calls in off-peak hours (on net), mobile telephony 40 23 33 9 % 6 %
Average rate per minute of local calls in off-peak hours (off net), mobile telephony 40 30 35 8 % -1 %
Average rate per minute of local calls in peak hours (fixed network), mobile telephony 40 30 35 5 % -1 %
Average rate per minute of local calls in off-peak hours (fixed network), mobile telephony 40 23 33 17 % -5 %
Average rate per minute of local calls in peak hours (off net), mobile telephony 40 23 33 4 % -5 %
Average rate per minute of local calls made during-the-weekend/at-night (on net, other operator networks), mobile telephony
40 30 34 4 % 8 %
Average rate per minute of local calls made during-the-weekend/at-night (off net), mobile telephony 40 30 35 4 % -1 %
Average rate per minute of local calls made during-the-weekend/at-night (fixed network), mobile telephony
40 30 35 9 % -1 %
Average SMS rate (to other users in same network), mobile telephony 3 3 3 11 % 2 %
Average SMS rate (other operator networks), mobile telephony 3 3 3 8 % 3 %
Source: SUTEL. Directorate-General for Markets.Sales tax included in price.
Graphic N° 124Costa Rica: Maximum and minimum rates per minute in postpaid telephony plans,
2013-2015
29.726.5
33.9
25.8
34.0
28.2
Maximum Rate Minimum Rate2013 2014 2015
Source: SUTEL, Directorate-General for Markets.
...Continuation
116

Prices and rates Prices and rates
Table 14Costa Rica: Rates per minute by type of usage in postpaid telephony plans, 2013-2015
Peak/Off-peak Hours, postpaid plans2013 2014
Max rate Min rate Average
rateMax rate Min rate Average
rate
Average rate per minute of local calls in peak hours (on net), mobile telephony 30 29 30 34 29 31
Average rate per minute of local calls in off-peak hours (on net), mobile telephony 29 21 27 34 19 28
Average rate per minute of local calls in off-peak hours (off net), mobile telephony 30 28 29 34 28 31
Average rate per minute of local calls in peak hours (fixed network), mobile telephony 30 29 29 34 28 31
Average rate per minute of local calls in off-peak hours (fixed network), mobile telephony 29 23 27 34 23 29
Average rate per minute of local calls in peak hours (off net), mobile telephony 30 23 29 34 20 29
Average rate per minute of local calls made during-the-weekend/at-night (on net, other operator networks), mobile telephony
30 29 30 34 29 31
Average rate per minute of local calls made during-the-weekend/at-night (off net), mobile telephony 30 29 31 34 28 31
Average rate per minute of local calls made during-the-weekend/at-night (fixed network), mobile telephony
30 29 30 34 28 31
Average SMS rate (to other users in same network), mobile telephony 3.0 1.7 2.3 3.0 1.4 2.6
Average SMS rate (other operator networks), mobile telephony 3.0 1.7 2.5 3.0 1.6 2.7
Continued ...
117

Prices and rates
Peak/Off-peak Hours, postpaid plans2015 Average
variation 2013-2014
Average variation
2014-2015Max rate Min rate Average
rate
Average rate per minute of local calls in peak hours (on net), mobile telephony 34 29 32 2 % 4 %
Average rate per minute of local calls in off-peak hours (on net), mobile telephony 34 29 32 4 % 16 %
Average rate per minute of local calls in off-peak hours (off net), mobile telephony 34 28 32 7 % 3 %
Average rate per minute of local calls in peak hours (fixed network), mobile telephony 34 28 32 7 % 3 %
Average rate per minute of local calls in off-peak hours (fixed network), mobile telephony 34 28 32 5 % 11 %
Average rate per minute of local calls in peak hours (off net), mobile telephony 34 28 32 -1 % 11 %
Average rate per minute of local calls made during-the-weekend/at-night (on net, other operator networks), mobile telephony
34 29 32 2 % 4 %
Average rate per minute of local calls made during-the-weekend/at-night (off net), mobile telephony 34 28 32 1 % 3 %
Average rate per minute of local calls made during-the-weekend/at-night (fixed network), mobile telephony
34 28 32 1 % 3 %
Average SMS rate (to other users in same network), mobile telephony 3 1.4 2.5 16 % -6 %
Average SMS rate (other operator networks), mobile telephony 3 1.6 2.5 8 % -4 %
Source: SUTEL. Directorate-General for Markets.Sales tax included in price.
Table 15Costa Rica: Mobile internet service rates
Postpaid telephony plans2013-2015
In Colones (monthly rates)
Maximum download/upload speed
Max rate (2015) Min rate (2015) Average rate
(2015)Average rate
(2014)Average rate
(2013)256 Kbps 3995 1250 2623 2998 2623 512 Kbps 6500 2000 3500 4167 3500
1024 Kbps 10 000 4000 6000 8667 6000 1536 Kbps 12 000 7000 9500 9500 9500 2048 Kbps 12 000 12 000 12 000 11 333 12000 3072 Kbps 13 000 13 000 13 000 15 000 13000 4096 Kbps 15 000 15 000 15 000 14 500 15000 5120 Kbps 17 000 17 000 17 000 24 000 20500
Source: SUTEL. Directorate-General for Markets.
...Continuation
118

Prices and rates Prices and rates
Table 16Costa Rica: Mobile internet service rates, prepaid telephony plans, 2014-2015
In Colones (monthly rates)
Max download speed Max rate (2015) Min rate (2015) Average rate
(2015)Average rate
(2014)
40 MB 300 200 250 ---
50 MB 275 275 275 80
60 MB 500 500 500 100
100 MB 400 400 400 300
150 MB 289 289 289 270
200 MB 700 700 700 500
600 MB 2500 2300 2400 2300
1 GB 2500 2500 2500 2000
2 GB 10 000 9000 9500 10 000
3 GB 9000 9000 9000 6250Source: SUTEL. Directorate-General for Markets.
Graphic N° 125Costa Rica: Mobile internet service rates - Postpaid telephony plans, 2013-2015
In colones (monthly rates)
0
5 000
10 000
15 000
20 000
25 000
30 000
256 Kbps 512 Kbps 1024Kbps
1536Kbps
2048Kbps
3072Kbps
4096Kbps
5120Kbps
201520142013
Source: SUTEL, Directorate-General for Markets.
119

Prices and rates
Graphic N° 126Costa Rica: Mobile internet service rates, prepaid telephony plans, 2014-2015
In colones (monthly rates)
500
2300 2000
10 000
6250
700
2400 2500
95009000
200 MB 600 MB 1 GB 2 GB 3 GB
20142015
Source: SUTEL, Directorate-General for Markets.
Table 17Costa Rica: Asymmetric internet service rates with oversubscription ratio of 1:20, 2015
In Colones (monthly rates)
Download/upload speeds (Kbps) Max rate Min rate Average rate
256/128 8551 5500 6902
512/256 10 390 5500 7444
1024/512 15 907 7080 9019
1536/512 21 424 8407 12 929
2048/768 42 878 7080 14 806
3072/768 28 568 8673 15 645
4096/768 61 267 13 150 24 040
5120/1024 47 617 14 823 25 848
6144/1024 64 283 16 500 35 513
10 240/1024 47 172 22 124 29 403Source: SUTEL. Directorate-General for Markets.
120

Prices and rates Prices and rates
Graphic N° 127Costa Rica: Asymmetric internet service rates with oversubscription ratio of 1:20,
2013-2015In Colones (monthly rates)
05 000
10 00015 00020 00025 00030 00035 00040 00045 00050 000
Speed (kbps)
201520142013
Source: SUTEL, Directorate-General for Markets.
Table 18Costa Rica: Asymmetric internet service rates with oversubscription ratio of 1:50, 2014-2015
In Colones (monthly rates)
Download/upload speeds (Kbps) Max rate Min rate Average rate
Download/upload speeds Average Rate (2014)
Average Rate (2015)
Annual variation (%)
512/256 31 762 33 782 6 %
1024/512 40 651 39 199 -4 %
2048/768 98 833 51 992 -47 %
3072/768 97 903 62 115 -37 %
4096/1024 165 264 75 430 -54 %
5120/1024 153 426 54 487 -64 %
6144/1024 291 605 94 213 -68 %
8192/1024 388 805 135 506 -65 %
10 240/1024 437 416 127 251 -71 %Source: SUTEL. Directorate-General for Markets.
121

Prices and rates
Graphic N° 128Costa Rica: Asymmetric internet service rates with oversubscription ratio of 1:5,
2014-2015In Colones (monthly rates)
050 000
100 000150 000200 000250 000300 000350 000400 000450 000500 000
Speed (kbps)
20142015
Source: SUTEL, Directorate-General for Markets.
Table 19Costa Rica: Symmetric internet service rates with oversubscription ratio of 1:5, 2014-2015
In Colones (monthly rates)
Download/upload speeds Average Rate (2013)
Average rate (2014)
Average rate (2015)
1/1 Mbps 67 500 88 651
2/2 Mbps 130 266 132 300 138 736
3/3 Mbps 181 471 172 800 243 000
4/4 Mbps 199 620 213 300 191 356
5/5 Mbps 254 559 253 800 340 200
6/6 Mbps 272 435 294 300 273 925
7/7 Mbps 342 713 334 800 448 200
8/8 Mbps 341 982 375 300 348 001
9/9 Mbps 405 605 415 800 513 000
10/10 Mbps 387 179 456 300 409 728Source: SUTEL. Directorate-General for Markets.
122

Prices and rates Prices and rates
Graphic N° 129Costa Rica: Symmetric internet service rates with oversubscription ratio of 1:5,
2013-2015In Colones (monthly rates)
100 000150 000200 000250 000300 000350 000400 000450 000500 000550 000600 000
2/2Mbps
3/3Mbps
4/4Mbps
5/5Mbps
6/6Mbps
7/7Mbps
8/8Mbps
9/9Mbps
10/10Mbps
Speed
201320142015
Source: SUTEL, Directorate-General for Markets.
Table 20Costa Rica: Symmetric internet service rates with oversubscription ratio of 1:1, 2013-2015
In Colones (monthly rates)
Download/upload speeds (Kbps)
Average rate (2013)
Average rate (2014)
Average rate (2015)
Min rate (2015)
Max rate (2015)
512/512Kbps 456 221 486 000 487 143 487 143 487 143
1/1 Mbps 187 551 513 000 514 207 514 207 514 207
2/2 Mbps 197 378 373 567 373 990 191 900 541 270
3/3 Mbps 308 944 453 867 454 332 222 200 595 397
4/4 Mbps 295 728 522 783 523 291 277 750 649 524
5/5 Mbps 406 076 495 906 580 759 285 325 753 300
6/6 Mbps 425 853 547 000 547 445 222 675 893 700
7/7 Mbps 649 933 705 392 706 027 320 675 985 500
8/8 Mbps 490 410 659 303 659 811 284 063 1 120 500
9/9 Mbps 631 324 1 078 650 1 079 730 920 159 1 239 300
10/10 Mbps 662 875 816 888 927 945 459 550 1 350 000
15/15 Mbps 1 245 620 1 135 467 1 338 700 652 400 2 025 000
20/20 Mbps 1 302 117 1 401 592 1 616 388 532 775 2 700 000Source: SUTEL. Directorate-General for Markets.
123
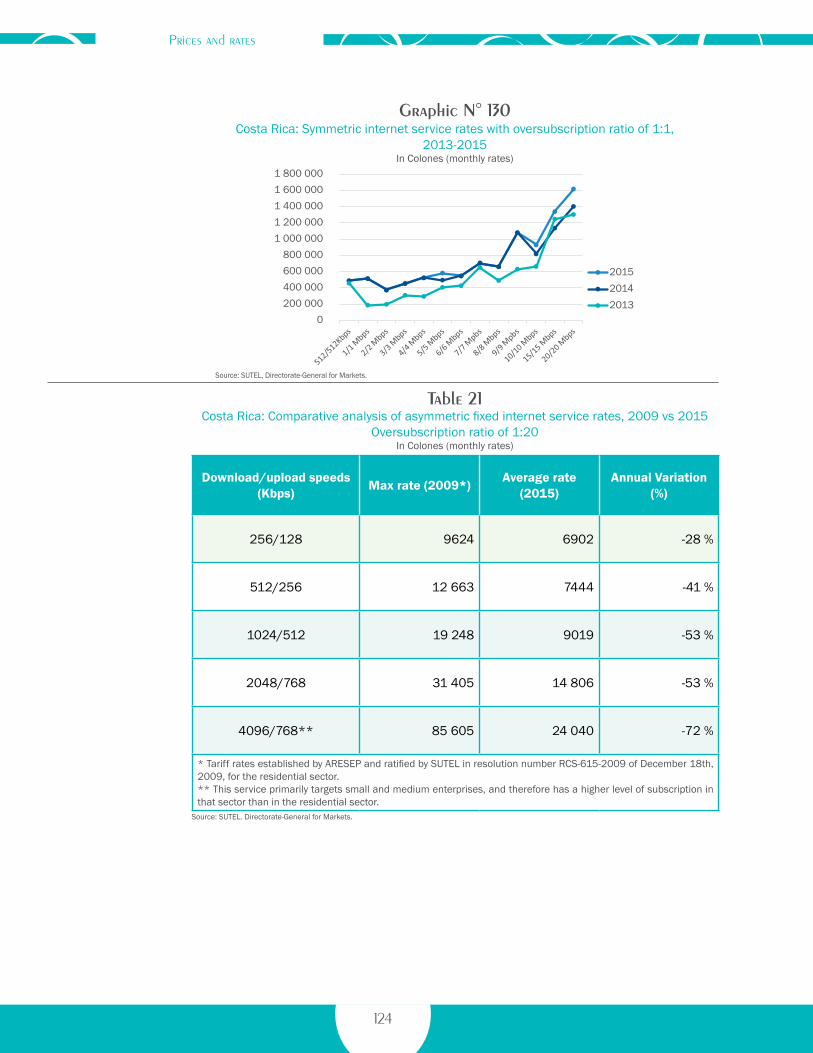
Prices and rates
Graphic N° 130Costa Rica: Symmetric internet service rates with oversubscription ratio of 1:1,
2013-2015In Colones (monthly rates)
0 200 000 400 000 600 000 800 000
1 000 0001 200 0001 400 0001 600 0001 800 000
201520142013
Source: SUTEL, Directorate-General for Markets.
Table 21Costa Rica: Comparative analysis of asymmetric fixed internet service rates, 2009 vs 2015
Oversubscription ratio of 1:20 In Colones (monthly rates)
Download/upload speeds (Kbps) Max rate (2009*) Average rate
(2015)Annual Variation
(%)
256/128 9624 6902 -28 %
512/256 12 663 7444 -41 %
1024/512 19 248 9019 -53 %
2048/768 31 405 14 806 -53 %
4096/768** 85 605 24 040 -72 %
* Tariff rates established by ARESEP and ratified by SUTEL in resolution number RCS-615-2009 of December 18th, 2009, for the residential sector.** This service primarily targets small and medium enterprises, and therefore has a higher level of subscription in that sector than in the residential sector.
Source: SUTEL. Directorate-General for Markets.
124

Prices and rates Prices and rates
Graphic N° 131Costa Rica: Comparative analysis of asymmetric internet service rates with
oversubscription ratio of 1:20, 2009-2015In Colones (monthly rates)
80 000
90 000
Speed (kbps)
0
10 000
20 000
30 000
40 000
50 000
60 000
70 000
256/128 512/256 1024/512 2048/768 4096/768
Maximum rate 2009Minimum rate 2015
Source: SUTEL, Directorate-General for Markets.
Table 22Costa Rica: Cable subscription rates, basic package
In Colones, 2013-2015
Rate 2013 2014 2015 Variation 2013-2014
Variation 2014-2015
Max 16 412 21 900 22 500 33.4 % 2.7 %
Min 6495 7300 3738 12.4 % -48.8 %
Average 11 425 12 803 12 290 12.1 % -4.0 %
Source: SUTEL. Directorate-General for Markets.
Graphic N° 132Costa Rica: Maximum and minimum cable subscription rates, basic package,
2013-2015In Colones (monthly rates)
6495
16 412
7300
21 900
3738
22 500
Maximum rate Minimum rate2013 2014 2015
Source: SUTEL, Directorate-General for Markets.
125


International
Chapter 7

International
The following section aims to analyze Costa Rica’s position in the international context, exposing the important contributions offered by the telecommunications sector to developing nations, as well as to analyze the behavior of the different services in the international markets and possible future trends.
For the purposes of this analysis, the following topics will be developed:
• Analysis of general international indicators• Analysis of the Affordability Drivers Index
(ADI)
Upon completion of this report, the International Telecommunication Union (ITU) had yet no available public information for the 2015 period, so this information could not be included in this edition. However, some figures from the year 2014 are included, whose source is the ITU.
Analysis of general international indicators
As in previous years, it is important to understand the position of Costa Rica in the top general indicators with respect to leading countries in the field of telecommunications and Latin American countries. As noted in the previous section, 2014 information provided by the International Telecommunication Union (ITU) was used for this analysis, as no public information was available for the
2015 period at the time of this document. In lieu, the information was completed with the corresponding 2015 updated indexes for Costa Rica.
In this opportunity, also the position of Costa Rica in the main indicators was contrasted with that of other similar Latin American countries, or otherwise, considering to that extent the stage or time of opening of their telecommunication markets, as further specified in Table 23. In addition, the comparison with other important countries of reference in the international context is maintained.
Costa Rica is in the initial opening stage of its telecommunications market, with less than 10 years of being opened and emphasizing that it is the only Latin American country in that condition. The majority of Latin American countries are located in the intermediate stage (at least six countries depending on the service) and located in the advanced stage, those South American countries that began the opening process of the telecommunications market in the region.
International
128

International International
Table 23Time lapse as of the opening of the telecommunication markets in the Latin American Countries, shown by service
Service
Initial StageLess than 10 years
Intermediate StageBetween 10 – 20 years*
Advanced StageMore than 20 years
Open between January 1, 2005
and December 31, 2014
Open between January 1, 1995 and December 31, 2004
Open prior to January 1, 1995
Mobile voice Costa RicaEl SalvadorGuatemalaPanama
Dominican RepublicPeruUruguay
Chile ColombiaEcuador
ArgentinaBrazilMexico
Fixed voice Costa RicaEcuadorGuatemalaMexico
Dominican RepublicUruguayPeru
Chile ColombiaArgentina
Brazil
Mobile internet Costa Rica
ChileColombiaEcuadorEl SalvadorDominican Republic
GuatemalaUruguayMexicoPanama
N/A
Fixed internet Costa RicaChileColombiaDominican Republic
UruguayMexicoPeru
N/A
* Countries with over 10 years as of the opening date are included for Internet services.Source: SUTEL, Directorate-General for Markets.
The fixed telephony, mobile telephony, and fixed and mobile Internet access services are analyzed, specially those aspects related to evolution in the number of subscribers and the total penetration, as well as the relative importance of telecommunications revenues with respect to the GDP.
In recent years the penetration of fixed telephony -in general- has shown a decrease. This situation is not unique to Costa Rica considering that the amount of subscriptions are also continuing to decline in countries such as Switzerland, United Kingdom, Sweden and Denmark. In the case of Costa Rica, penetration in 2014 was of 18 % and then dropped in 2015 to 16.6 %. It is noted that Costa Rica surpasses countries at advanced and intermediate stages in the opening of this sector of the market and is very close to Chile that has more than 20
years of being opened. Specific details are shown in graphic 133.
In the mobile phone service, as in the year 2013, Costa Rica remains among the top 10 countries with the highest penetration. In 2014 held the sixth position. In 2015 Costa Rica shows an increase, and moves from 144 % and to 156 %, with an upturn in the market. In this case, Costa Rica surpasses Chile, Colombia, Ecuador and Mexico that are countries in advanced stages of the opening of the mobile telephony market. Specific details are shown in graphic 134.
If the form of payment of mobile phone service is analyzed, the proportion of prepaid subscriptions has increased year-by-year; increasing from 79 % of the total subscriptions in 2013 to 80 % in the year 2014. In 2015 Costa Rica shows a slight decrease and
129

International
reaches 79 %, which demonstrates stability in the indicator. In that respect, Latin American countries follow a similar pattern: Guatemala, Nicaragua, Panama, Mexico, Ecuador, Colombia, Dominican Republic, among others, have a share of prepaid services far superior than postpaid services, which contrasts with the behavior registered in European countries and Asia where the relationship is reversed. Specific details are shown in graphic 135. In this case, Costa Rica is at the level of countries in advanced stages such as Colombia, Ecuador and Mexico, among others.
As occurred one year ago, according to data from the ITU Report 2014, an inverse relationship between the share of prepaid services and per capita income continues. Mobile phone users in more developed countries mainly choose postpaid services. Specific details are shown in graphic 136.
Service penetration measured by fixed Internet connections per each 100 inhabitants has remained with a slight growth near to a 1-percentage point. Thus in 2014 Costa Rica surpassed Mexico and closely positioned to Brazil. Meanwhile, Chile showed an increase of 2 percentage points compared to 2013. According to 2014 data of the ITU, European countries have higher values, which almost quadruple that of Costa Rica. In this case, Costa Rica surpasses Mexico, Colombia, Peru and the Dominican Republic, which are countries in intermediate stages as of the opening of their fixed Internet markets. Specific details are shown in graphic 137.
As for the mobile Internet service, in 2014 Costa Rica continues to show an important
position regarding the penetration of this service. It remains within the top 10 places, outperforming more developed countries such as Switzerland and the Netherlands (Holland) and holds the first place in Latin America, where it surpasses countries including Brazil, Uruguay, Argentina and Chile, among others. In 2015 Costa Rica experienced a significant growth and reached levels recorded in 2014 for Denmark and Sweden. It is important to highlight that the above-mentioned Latin American countries are in intermediate stages as of the opening of their mobile Internet, while Costa Rica is located in its initial stage. Specific details are shown in graphic 138.
To end this section on the international context, according to each country, the relative importance of telecommunications revenues in relation to gross domestic product (GDP) is measured in dollars. The latest data on telecommunications revenues available from the records of the ITU is of 2014, so to ensure the comparability of the indicator at the international context said measurement is used, although in other sections of this report updated 2015 figures are included for Costa Rica.
In 2014 Costa Rica was located among the countries of the region whose telecommunications exceed 3 % of their GDP. Peru, USA and Sweden are countries included in this group that behave similarly to Costa Rica, as well as in other indicators shown in this section. Among the countries with the best positions, Honduras and Colombia stand out above the threshold of 5 % in revenues. In the case of European countries, these have values ranging between 1 % and 2 %. Specific details are shown in graphic 139.
130

International International
Analysis of the Affordability Drivers Index for the year 2015
This year the name of the index changed, it went from the Affordability Index to the Affordability Drivers Index. This index is developed by the Alliance For Affordable Internet (A4AI), which is composed of a group of global institutions of private, public, academic and civil society sectors. It aims to achieve the goal of the Broadband Commission of the UN (United Nations) which has established as its target for the price of basic broadband service to represent less than 5 % of the average monthly per capita income. It also promotes the goal of universal Internet access by 2020, which was established by UN in September 2015.
The index does not measure directly the price of Internet services, but shows a strong relationship between the index scores and the price of broadband in countries of analysis, as noted in graphic 140.
Therefore countries with higher scores tend to have better prices for broadband services. Costa Rica shows a significant relationship between high index scores and low prices on Internet services.
The Affordability Drivers Index is composed of two sub-indexes that internally operate as follows.
• InfrastructureSub-Index:measures the infrastructure deployment and operation, together with policies and regulatory frameworks that encourage investment and allow for future infrastructure growth. Some of the variables included are
available international bandwidth and evaluation of the spectrum policy.
• Broadbandaccesssub-index:measures adoption rates, policies and regulatory frameworks to encourage growth and supply of broadband services. Variables used are the Internet penetration rate and the evaluation of the effectiveness of universal service funds.
The index is calculated for 51 countries divided into two groups (developing economies and developed economies) and it’s calculated on a scale from 0 to 100, based on penetration rates, usage, policy and regulatory environment. The index analysis shows that high scores are correlated with low broadband prices. This means that values close to 100 in the countries index show that prices in broadband services tend to fall.
In 2015, Costa Rica and Colombia moved to positions 2 and 1, respectively, in contrast to 2014 (the positions were inverted); this in the case of developing economies. For underdeveloped economies, Rwanda maintains the first place followed by Uganda. In the classification of emerging economies, Colombia and Costa Rica are at the top followed by Malaysia, Turkey and Peru. Specifics of the foregoing are shown in tables 25 and 26.
The A4AI report analyzes the first two positions and how both Colombia and Costa Rica remain there and emphasizes in the following:
131

International
Colombia:
• Promotes digital literacy, encourages telecommuting and improves digital government services.
• Encourages the adoption of broadband through the elimination of duties on computer purchases and offers preferential tariffs for low-income households.
• Promotes the development of ICT’s thru increased marketing of digital services (development of applications).
• Promotes network sharing.• Deletes customer retention barriers
(minimum dwelling periods of time for clients).
Costa Rica:
• Established that ICT’s are an important tool to reduce poverty.
•It has one of the highest mobile broadband subscription penetration rates among the countries analyzed in the index.
• Prices of fixed and mobile broadband represent around 1 % of the GDP per capita and are among the lowest in Latin America.
• Approximately 50 % of the country has some type of Internet service.
• The government has created a National Telecommunications Fund (FONATEL) , which has focused on providing access to broadband Internet and telephony services to underserved schools, institutions of public health and other public entities.
• The new Telecommunication Development Plan aims to increase the use of Internet and improve broadband
speeds according to the policies of the OECD.
132

International International
Source: SUTEL, Directorate-General for Markets based on the International Telecommunication Union.
Graphic N° 133Fixed Telephone Subscriptions per 100 Inhabitants, 2014
Percentages
6 %6 %
10 %11 %12 %12 %
15 %15 %15 %
18 %18 %
19 %21 %22 %
23 %32 %
33 %36 %
39 %40 %
41 %52 %
54 %60 %
0 % 10 % 20 % 30 % 40 % 50 % 60 % 70 %
NicaraguaHonduras
PeruGuatemala
Dominican RepublicFinland
ColombiaEl Salvador
PanamaMexico
Costa RicaChileBrazil
ArgentinaNorway
UruguayDenmark
SingaporeSweden
United StatesNetherlands
United KingdomSwitzerland
Taiwan
201516.6 %
Latin American markets located in anadvance stage of fixed telephony openingLatin American markets located in anintermediate stage of fixed telephony openingCosta Rica (initial stage) offixed telephony opening
Other markets
Graphic N° 134Subscriptions to mobile telephone services per each 100 inhabitants, 2014
Percentages
79 %82 %
94 %104 %104 %
107 %108 %110 %
113 %115 %116 %116 %
124 %126 %128 %130 %
133 %137 %139 %140 %
144 %144 %
147 %158 %159 %161 %
0 % 20 % 40 % 60 % 80 % 100 % 120 % 140 % 160 % 180 %
Dominican RepublicMexico
HondurasPeru
EcuadorGuatemala
SpainUSA
ColombiaNicaragua
NorwayNetherlands
United KingdomDenmark
SwedenTaiwan
ChileSwitzerland
BrazilFinland
Costa RicaEl SalvadorSingapore
PanamaArgentina
Uruguay
2015156 %
Latin American markets located in anadvance stage of mobile telephony opening Latin American markets located in anintermediate stage of mobile telephony opening Costa Rica (initial stage) ofmobile telephony opening
Other markets
Source: SUTEL, Directorate-General for Markets based on the International Telecommunication Union.
Costa Rica
stands fifthin fixed telephony penetration in Latin America
Costa Rican
stands fifthin mobile telephony penetration in Latin America
133
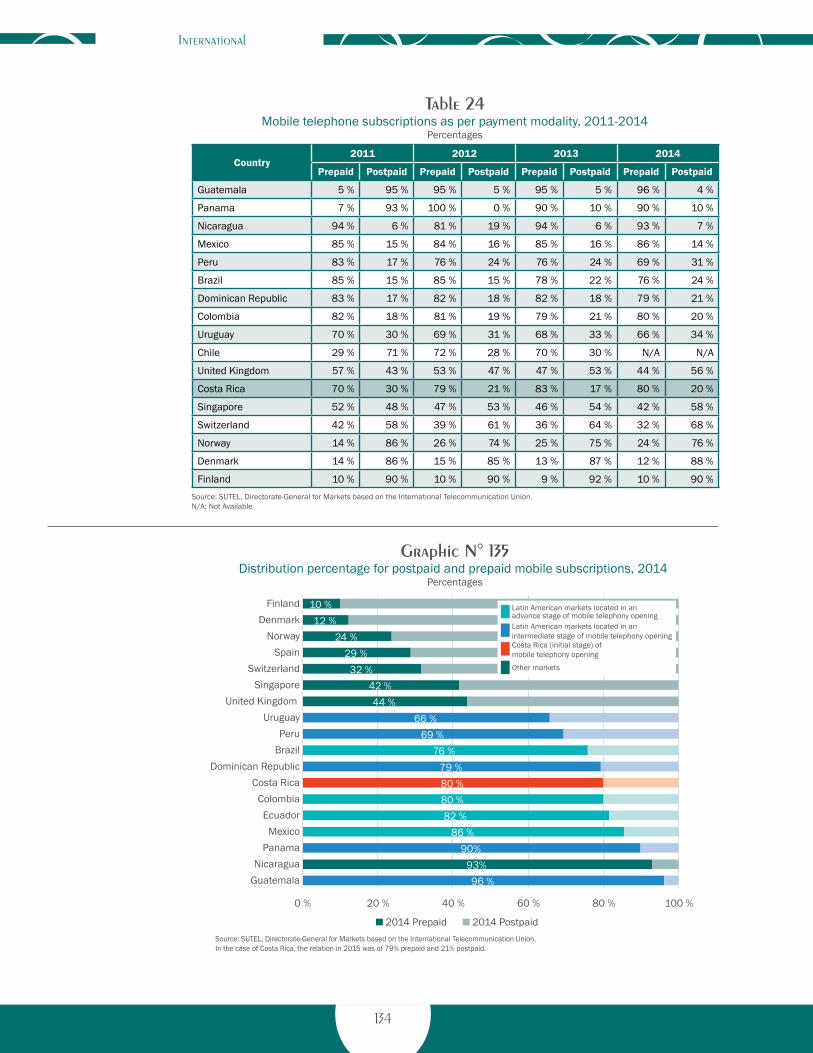
International
Source: SUTEL, Directorate-General for Markets based on the International Telecommunication Union.In the case of Costa Rica, the relation in 2015 was of 79% prepaid and 21% postpaid.
Graphic N° 135Distribution percentage for postpaid and prepaid mobile subscriptions, 2014
Percentages
10 %12 %
24 %29 %
32 %42 %44 %
66 %69 %
76 %79 %80 %80 %82 %
86 %90%
93%96 %
0 % 20 % 40 % 60 % 80 % 100 %
FinlandDenmark
NorwaySpain
SwitzerlandSingapore
United Kingdom Uruguay
PeruBrazil
Dominican RepublicCosta Rica
ColombiaEcuador
MexicoPanama
NicaraguaGuatemala
2014 Prepaid 2014 Postpaid
Latin American markets located in anadvance stage of mobile telephony opening Latin American markets located in anintermediate stage of mobile telephony opening Costa Rica (initial stage) ofmobile telephony opening
Other markets
Table 24Mobile telephone subscriptions as per payment modality, 2011-2014
Percentages
Country2011 2012 2013 2014
Prepaid Postpaid Prepaid Postpaid Prepaid Postpaid Prepaid Postpaid
Guatemala 5 % 95 % 95 % 5 % 95 % 5 % 96 % 4 %
Panama 7 % 93 % 100 % 0 % 90 % 10 % 90 % 10 %
Nicaragua 94 % 6 % 81 % 19 % 94 % 6 % 93 % 7 %
Mexico 85 % 15 % 84 % 16 % 85 % 16 % 86 % 14 %
Peru 83 % 17 % 76 % 24 % 76 % 24 % 69 % 31 %
Brazil 85 % 15 % 85 % 15 % 78 % 22 % 76 % 24 %
Dominican Republic 83 % 17 % 82 % 18 % 82 % 18 % 79 % 21 %
Colombia 82 % 18 % 81 % 19 % 79 % 21 % 80 % 20 %
Uruguay 70 % 30 % 69 % 31 % 68 % 33 % 66 % 34 %
Chile 29 % 71 % 72 % 28 % 70 % 30 % N/A N/A
United Kingdom 57 % 43 % 53 % 47 % 47 % 53 % 44 % 56 %
Costa Rica 70 % 30 % 79 % 21 % 83 % 17 % 80 % 20 %
Singapore 52 % 48 % 47 % 53 % 46 % 54 % 42 % 58 %
Switzerland 42 % 58 % 39 % 61 % 36 % 64 % 32 % 68 %
Norway 14 % 86 % 26 % 74 % 25 % 75 % 24 % 76 %
Denmark 14 % 86 % 15 % 85 % 13 % 87 % 12 % 88 %
Finland 10 % 90 % 10 % 90 % 9 % 92 % 10 % 90 %Source: SUTEL, Directorate-General for Markets based on the International Telecommunication Union.N/A: Not Available
134

International International
Source: SUTEL, Directorate-General for Markets based on the International Telecommunication Union.
Graphic N° 136Average increase per inhabitant and percentage of prepaid subscriptions per country, 2014
Finland
Norway
Spain
Switzerland
Singapore
United Kingdom
Uruguay
Peru
Brasil
Dominican Republic
Costa Rica
Colombia
Ecuador
Mexico
PanamaNicaragua
Guatemala
-20000
0
20000
40000
60000
80000
100000
120000
0 % 20 % 40 % 60 % 80 % 100 % 120 %
Percentage of prepaid subscriptions
Per c
apita
inco
me,
Dol
lars
Denmark
Graphic N° 137Fixed Internet access penetration per 100 inhabitants, 2014
Percentages
1 %
6 %
6 %
8 %
10 %
10 %
11 %
12 %
14 %
25 %
31 %
32 %
32 %
34 %
37 %
38 %
41 %
41 %
42 %
0 % 5 % 10 % 15 % 20 % 25 % 30 % 35 % 40 % 45 %
Honduras
Dominican Republic
Peru
Panama
Colombia
Mexico
Costa Rica
Brazil
Chile
Uruguay
United States
Singapore
Taiwan
Sweden
United Kingdom
Norway
Netherlands
Denmark
Switzerland
2015 11.6 %
Latin American markets located in anadvance stage of fixed Internet opening Latin American markets located in anintermediate stage of fixed Internet openingCosta Rica (initial stage) offixed Internet opening
Other markets
Source: SUTEL, Directorate-General for Markets based on the International Telecommunication Union.
The
inverse relationship
between high per capita income and the ratio of prepaid telephony services persists
Costa Rica
stands fourthin fixed Internet access penetration in Latin America
135
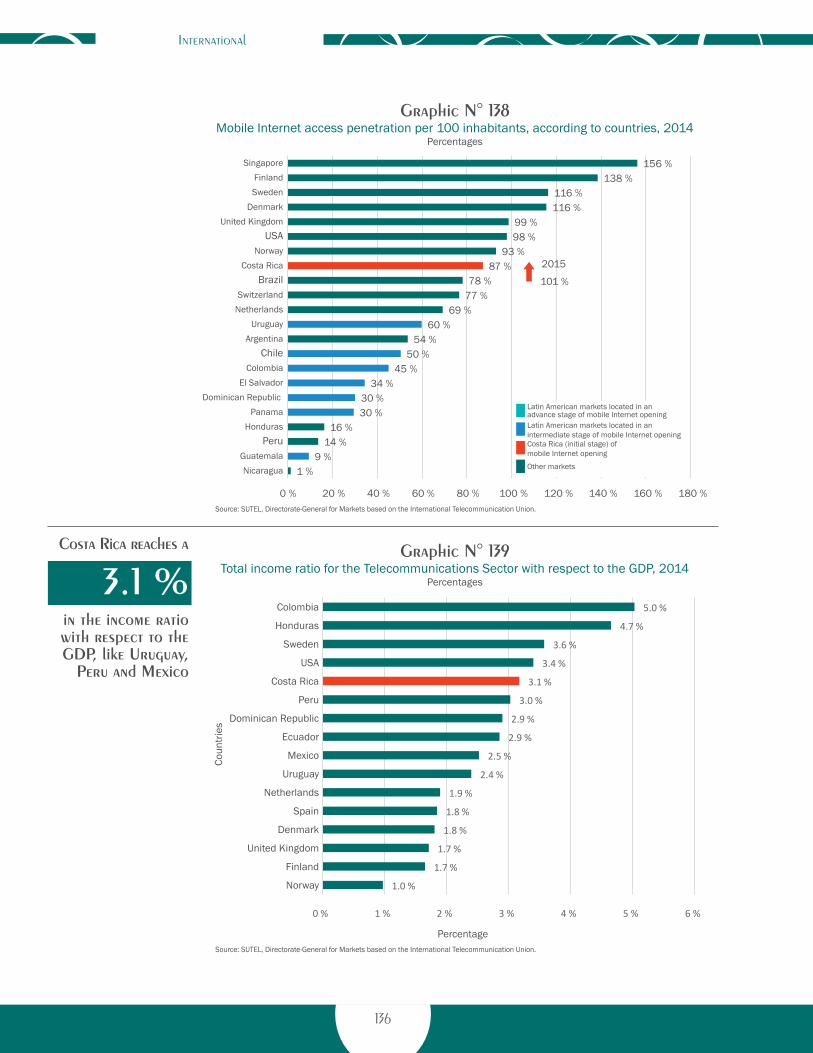
International
Graphic N° 138Mobile Internet access penetration per 100 inhabitants, according to countries, 2014
Percentages
1 %9 %
14 %16 %
30 %30 %
34 %45 %
50 %54 %
60 %69 %
77 %78 %
87 %93 %
98 %99 %
116 %116 %
138 %156 %
0 % 20 % 40 % 60 % 80 % 100 % 120 % 140 % 160 % 180 %
NicaraguaGuatemala
PeruHonduras
PanamaDominican Republic
El SalvadorColombia
ChileArgentina
UruguayNetherlandsSwitzerland
BrazilCosta Rica
NorwayUSA
United KingdomDenmark
SwedenFinland
Singapore
2015
101 %
Latin American markets located in anadvance stage of mobile Internet opening Latin American markets located in anintermediate stage of mobile Internet opening Costa Rica (initial stage) ofmobile Internet opening
Other markets
Source: SUTEL, Directorate-General for Markets based on the International Telecommunication Union.
Graphic N° 139Total income ratio for the Telecommunications Sector with respect to the GDP, 2014
Percentages
1.0 %
1.7 %
1.7 %
1.8 %
1.8 %
1.9 %
2.4 %
2.5 %
2.9 %
2.9 %
3.0 %
3.1 %
3.4 %
3.6 %
4.7 %
5.0 %
0 % 1 % 2 % 3 % 4 % 5 % 6 %
Norway
Finland
United Kingdom
Denmark
Spain
Netherlands
Uruguay
Mexico
Ecuador
Dominican Republic
Peru
Costa Rica
USA
Sweden
Honduras
Colombia
Percentage
Coun
tries
Source: SUTEL, Directorate-General for Markets based on the International Telecommunication Union.
Costa Rica reaches a
3.1 %in the income ratio with respect to the GDP, like Uruguay,
Peru and Mexico
136

International International
(1) ADI: Affordability Drivers Index.
Graphic N° 140Relation between the ADI1 2015 score and the price of a 500MB prepaid
mobile telephony plan (GDP% per capita, 2014)
Zimbabwe
Tunisia
ThailandSouth Africa
Pakistan
Malawi
Indonesia
India
Haiti
Ethiopia
Costa Rica
Burkina Faso
-5
0
5
10
15
20
25
30
35
0 10 20 30 40 50 60 70
ADI (1) Scores (2015)
Pric
e of
pre
paid
mob
ile b
road
band
(500
MB)
,as
GD
P pe
rcen
tage
, 201
4
Senegal
Dominican Republic
Ecuador
Colombia
Gambia
Turkey
Malaysia
Peru
Mali
Benin
Mozambique
Nepal
JordanVenezuela
Kazakhstan
Tanzania
Vietnam
Ghana Kenya
Brazil
Uganda Ruanda
Nigeria
MarruecosBotswana
Jamaica
Mexico
MauritiusNamibia
BangladeshEgypt
Philippines
Source: SUTEL, Directorate-General for Markets based on information from the A4AI.
Zambia
Costa Rican
ranks secondin the A4AI Affordability Drivers Index
Table 25Ranking in the Affordability Drivers Index by country, for emerging economies
2014-2015
RankingEmerging economies
2014 2015
1 Costa Rica Colombia
2 Colombia Costa Rica
3 Turkey Malaysia
4 Malaysia Turkey
5 Peru PeruSource: SUTEL, Directorate-General for Markets based on information from the A4AI.
137

International
Table 26Scores in the Affordability Drivers Index by country, 2014-2015
Ranking Country 2014 2015
1 Colombia 63.13 65.32
2 Costa Rica 63.37 64.60
4 Malaysia 61.52 63.28
5 Turkey 62.43 62.35
6 Perú 59.59 61.82
7 Brazil 57.57 59.90
8 Mauritius 57.18 55.20
9 Mexico 48,48 53.85
1 Argentina 51.75 53.35
2 Thailand 49.84 52.39
4 Jamaica 47.27 50.84
5 Ecuador 52.31 50.60
6 Dominican Republic 44.35 47.23
7 Tunisia 45.10 46.83
8 South Africa 43.44 46.44Source: SUTEL, Directorate-General for Markets based on information from the A4AI.
138

International
Statistical appendixGeneral evolution of the industryTable 27Costa Rica: Telecommunications sector total income, 2012-2015Quarterly figures in millions of colones
Indicator2012 2013 2014 2015
2012 2013 2014 2015Q1 Q2 Q3 Q4 Q1 Q2 Q3 Q4 Q1 Q2 Q3 Q4 Q1 Q2 Q3 Q4
Income 121 343 123 855 126 834 129 616 133 856 140 012 148 801 154 074 182 658 187 658 183 996 189 966 196 687 202 676 200 454 202 995 501 648 576 742 744 300 802 812
Variation % 6 % 2 % 2 % 2 % 3 % 5 % 6 % 4 % 18 % 3 % -2 % 3 % 4 % 3 % -1 % 1 % 15 % 15 % 29 % 8 %
Source: SUTEL, Directorate-General for Markets.
Table 28Costa Rica: Telecommunications sector total income by service, 2012-2015Quarterly figures in millions of colones
Q1 2012 Q2 2012 Q3 2012 Q4 2012 Q1 2013 Q2 2013 Q3 2013 Q4 2013 Q1 2014 Q2 2014 Q3 2014 Q4 2014 Q1 2015 Q2 2015 Q3 2015 Q4 2015
Traditional basic telephony and VoIP telephony 21 884 21 546 21 152 20 752 19 993 20 249 19 568 20 720 24 116 23 226 22 856 22 632 22 161 21 964 20 931 21 420
Mobile telephony (Voice only) 66 218 65 825 68 997 72 302 70 336 71 149 74 448 77 264 95 605 98 004 96 581 101 243 102 510 105 185 101 535 103 511
Internet access (includes mobile Internet) 25 678 28 184 28 019 27 039 34 122 38 175 44 204 45 413 15 102 55 841 54 345 57 161 64 126 66 176 68 814 69 277
Dedicated lines 7 563 8 300 8 665 9 524 9 404 10 439 10 581 10 677 10 835 10 612 10 211 8 930 8 890 9 351 9 174 8 787
Total 121 343 123 855 126 834 129 616 133 856 140 012 148 801 154 074 182 134 187 687 184 003 189 978 197 771 203 514 201 458 203 584
Source: SUTEL, Directorate-General for Markets.
Table 29Costa Rica: Telecommunications sector total income by service, 2011-2015Annual figures in millions of colones
2011 2012 2013 2014 2015Mobile telephony (Voice only) 239 405 273 342 293 197 391 433 412 742 Traditional basic telephony and VoIP telephony 88 614 85 334 80 531 92 830 86 476Internet access (includes mobile Internet) 85 119 108 920 161 914 219 449 267 392Dedicated lines 24 535 34 052 41 101 40 588 36 202Total 437 672 501 648 576 242 744 300 802 812
Source: SUTEL, Directorate-General for Markets.
139

Statistical appendix
Table 30Costa Rica: Telecommunications sector total income by service, 2011-2015Annual percentages
2011 2012 2013 2014 2015Mobile telephony (Voice only) 55 % 54 % 51 % 53 % 51 %Traditional basic telephony and VoIP telephony 20 % 17 % 14 % 13 % 11 %Internet access (includes mobile Internet) 19 % 22 % 28 % 29 % 33 %Dedicated lines 6 % 7 % 7 % 5 % 5 %Total 100 % 100 % 100 % 100 % 100 %
Source: SUTEL, Directorate-General for Markets.
Table 31Costa Rica: Telecommunications sector total income by service, 2011-2015Annual figures in millions of colones
2011 2012 2013 2014 2015Mobile telephony and mobile Internet access 263 819 314 598 387 202 518 631 583 164Traditional basic telephony and VoIP telephony 88 614 85 334 80 531 92 830 86 476Fixed Internet access 60 704 67 664 67 908 92 251 96 970Dedicated lines 24 535 34 052 41 101 40 588 36 202Total 437 672 501 648 576 742 744 300 802 812
Source: SUTEL, Directorate-General for Markets.
Table 34Costa Rica: Telecommunications sector total investment with respect to GDP, 2011-2015Annual percentages
2011 2012 2013 2014 2015Annual percentages 2.1 % 2.4 % 1.0 % 1.0 % 1.0 %
Source: SUTEL, Directorate-General for Markets and BCCR.
Table 33Costa Rica: Telecommunications sector total income with respect to GDP, 2011-2015Annual percentages
Year 2011 2012 2013 2014 2015Total income/GDP (percentage) 2.30% 2.40% 2.60% 3.10% 3.10%
Source: SUTEL, Directorate-General for Markets.
Table 32Costa Rica: Telecommunications sector total income by service, 2011-2015Annual percentages
2011 2012 2013 2014 2015Mobile telephony and mobile Internet access (Mobile network) 60 % 63 % 67 % 70 % 73 %Traditional basic telephony and VoIP telephony 20 % 17 % 14 % 13 % 11 %Fixed Internet access 14 % 13 % 12 % 12 % 12 %Dedicated lines 6 % 7 % 7 % 5 % 4 %Total 100 % 100 % 100 % 100 % 100 %
Source: SUTEL, Directorate-General for Markets.
140

Statistical appendix
Table 35Costa Rica: Telecommunications sector labor force 2011-2015 Absolute figures by semesters and annually
Indicator2011 2012 2013 2014 2015
2011 2012 2013 2014 2015I Semester II Semester I Semester II Semester I Semester II Semester I Semester II Semester I Semester II Semester
Persons 8766 9618 9933 9900 10 347 10 442 11 006 11 002 11 497 11 426 9618 9900 10 442 11 002 11 426
Variation % 12 % 10 % 3 % 0 % 5 % 1 % 5 % 0 % 5 % -1 % 23 % 3 % 5 % 5 % 4 %
Source: SUTEL, Directorate-General for Markets.
Table 36Costa Rica: Work force percentage in the telecommunications sector with respect to active economic population, 2011-2015Annual percentages
Indicator 2011 2012 2013 2014 2015Total Country 2 142 937 2 212 031 2 235 770 2 284 142 2 276 104Telecommunications sector 9618 9900 10 442 11 002 11 426Percentage 0.4 % 0.4 % 0.5 % 0.5 % 0.5 %Variation % 19 % 0 % 4 % 8 % 7 %
Source: SUTEL, Directorate-General for Markets and INEC (Permanent Work Survey).
Table 37Costa Rica: Percentage of work force in the telecommunications sector with respect to total population, 2011-2015 Annual figures in percentages
Indicator 2011 2012 2013 2014 2015Total population 4 592 149 4 652 459 4 713 168 4 773 130 4 832 234Work force in telecommunications 9618 9900 10 442 11 002 11 426Percentage 0.2 % 0.2 % 0.2 % 0.2 % 0.2 %
Source: SUTEL, Directorate-General for Markets and INEC (Permanent Work Survey).
Table 38Costa Rica: Female work force in telecommunications, 2013-2015Absolute figures by semester
Indicator2013 2014 2015
I Semester 2013
II Semester 2013
I Semester 2014
II Semester 2014
I Semester 2015
II Semester 2015
Persons 2792 2873 2811 2911 2963 3010Variation by semester % 3 % 4 % 2 %
Source: SUTEL, Directorate-General for Markets.
141

Statistical appendix
Fixed telephonyTable 39Costa Rica: Subscriptions to Traditional Basic Phone Service and VoIP Service, 2011–2015Figures by the end of each year
Subscriptions 2011 2012 2013 2014 2015Total 1 031 719 995 089 968 459 881 217 859 514Traditional Basic Phone Service 1 027 847 976 824 936 035 839 968 804 468VoIP 3 872 18 265 32 424 41 249 55 046
Source: SUTEL, Directorate-General for Markets.
Table 40Costa Rica: Subscriptions to Traditional Basic Phone Service and VoIP Service, 2014–2015Figures by the end of each quarter
Subscriptions2014 2015
Q2 Q3 Q4 Q1 Q2 Q3 Q4Total 956 002 940 762 896 637 881 217 880 380 871 594 865 364 859 514Traditional Basic Phone Service 918 880 902 611 858 210 839 968 831 837 824 070 813 987 804 468
VoIP 37 122 38 151 38 427 41 249 48 543 47 524 51 377 55 046Source: SUTEL, Directorate-General for Markets.
Table 42Costa Rica: Percentage Distribution of Traditional Basic Phone Service and VoIP Service Subscriptions, 2014–2015Percentage figures by the end of each year
Subscriptions2014 2015
Q2 Q3 Q4 Q1 Q2 Q3 Q4Traditional Basic Phone Service 96.1 % 95.9 % 95.7 % 95.3 % 94.5 % 94.5 % 94.1 % 93.6 %
VoIP 3.9 % 4.1 % 4.3 % 4.7 % 5.5 % 5.5 % 5.9 % 6.4 %Source: SUTEL, Directorate-General for Markets.
Table 41Costa Rica: Distribution of Traditional Basic Phone Service and VoIP Service Subscriptions, 2011–2015Percentage figures by the end of each year
Subscriptions 2011 2012 2013 2014 2015Traditional Basic Phone Service 99.6 % 98.2 % 96.7 % 95.3 % 93.6 %VoIP 0.4 % 1.8 % 3.3 % 4.7 % 6.4 %
Source: SUTEL, Directorate-General for Markets.
142

Statistical appendix
Table 43Costa Rica: Traditional basic phone service penetration, 2011-2015
Indicator 2011 2012 2013 2014 2015Penetration (connections per inhabitants) 22.4 % 21.0 % 19.9 % 17.6 % 16.6 %Traditional basic phone service 1 027 847 976 824 936 035 839 968 804 468Total Population 4 592 149 4 652 459 4 713 168 4 773 130 4 832 234
Source: SUTEL, Directorate-General for Markets.
Table 45Costa Rica: Number of public pay phones in operation, 2011-2015Figures by the end of each year
Indicator 2011 2012 2013 2014 2015Public pay phones 18 960 16 348 13 145 8188 5726
Source: SUTEL, Directorate-General for Markets.
Table 44Costa Rica: VoIP service penetration, 2011-2015
Indicator 2011 2012 2013 2014 2015Connections per 1000 inhabitants 0,1 % 0,4 % 0,7 % 0,9 % 1,1 %
VoIP subscribers 3872 18 265 32 424 41 249 55 046Total Population 4 592 149 4 652 459 4 713 168 4 773 130 4 832 234
Source: SUTEL, Directorate-General for Markets.
Table 46Costa Rica: Traditional basic phone service total income, 2011–2015Annual figures by millions of colones (CRC) and variation percentages
Indicator 2011 2012 2013 2014 2015Amount 88 164 85 334 80 531 92 831 86 476Variation % -3.7 % -5.6 % 15.3 % -6.8 %
Source: SUTEL, Directorate-General for Markets.
Table 47Costa Rica: VoIP service total income, 2011–2015Annual figures by millions of colones (CRC) and variation percentages
Indicator 2011 2012 2013 2014 2015Amount 231 1539 2506 4826 5071Variation % 566.9 % 62.8 % 92.6 % 5.1 %
Source: SUTEL, Directorate-General for Markets.
143

Statistical appendix
Table 48Costa Rica: Fixed phone service total income (Traditional Basic and VoIP service), 2014–2015Quarterly figures by millions of colones (CRC) and variation percentages
Indicator2014 2015
Q1 Q2 Q3 Q4 Q1 Q2 Q3 Q4Amount 24 116 23 226 22 856 22 632 22 161 21 964 20 931 21 420Variation % -3.7 % -1.6 % -1.0 % -2.1 % -0.9 % -4.7 % 2.3 %
Source: SUTEL, Directorate-General for Markets.
Table 49Costa Rica: VoIP service income, 2014-2015Quarterly figures by millions of colones (CRC) and variation percentages
Indicator2014 2015
Q1 Q2 Q3 Q4 Q1 Q2 Q3 Q4Amount 1457 1078 1117 1173 1334 1287 1184 1266Variation % -26 % 3.6 % 5 % 13.7 % -3.5 % -8 % 7 %
Source: SUTEL, Directorate-General for Markets.
Table 50Costa Rica: Traditional basic phone and VoIP service average income by subscriberFigures in colones (CRC) and variation percentage, period 2011-2015
YearAverage Income Variation Percentage
Trad. Basic VoIP Fixed Phone Trad. Basic VoIP Fixed Phone2011 85 988 59 592 85 8892012 85 783 84 254 85 755 0 % 41 % 0 %2013 83 357 77 274 83 153 -3 % -8 % -3 %2014 104 772 116 989 105 344 26 % 51 % 27 %2015 101 172 92 132 100 593 -3 % -21 % -5 %
Source: SUTEL, Directorate-General for Markets.
Table 51Costa Rica: Traditional basic phone and VoIP service average income by coursed minuteFigures in colones (CRC) and variation percentage, period 2011-2015
YearAverage Income Variation Percentage
Trad. Basic VoIP Fixed Phone Trad. Basic VoIP Fixed Phone2011 16 41 16 2012 17 40 17 6 % -4 % 7 %2013 19 32 19 12 % -18 % 12 %2014 27 25 27 39 % -23 % 37 %2015 27 21 27 0 % -16 % 0 %
Source: SUTEL, Directorate-General for Markets.
144

Statistical appendix
Table 52Costa Rica: Traffic for traditional basic phone, completed within the network and outboundYearly figures in millions of minutes and variation percentages, 2011-2015
Indicator 2011 2012 2013 2014 2015Minutes 5441 4908 4138 3473 3208Variation % -9.8 % -15.7 % -16.1 % -7.6 %
Source: SUTEL, Directorate-General for Markets.
Table 53Costa Rica: VoIP service traffic, completed within the network and outbound, 2011-2015Yearly figures in thousands of minutes and variation percentages
Indicator 2011 2012 2013 2014 2015Minutes 5602 38 951 77 532 174 685 229 984Variation % 595.4 % 99.0 % 125.3 % 31.7 %
Source: SUTEL, Directorate-General for Markets.
Table 54Costa Rica: Traffic for traditional basic phone and VoIP services, completed within the network and outbound, 2014-2015 Quarterly figures in millions of minutes and variation percentages
Indicator2014 2015
Q1 Q2 Q3 Q4 Q1 Q2 Q3 Q4Minutes 926 884 825 838 858 810 750 790Variation % -4.5 % -6.7 % 1.7 % 2.4 % -5.6 % -7.5 % 5.4 %
Source: SUTEL, Directorate-General for Markets.
Table 55Costa Rica: VoIP service traffic, completed within the network and outbound, 2014 - 2015Quarterly figures in millions of minutes and variation percentages
Indicators2014 2015
Q1 Q2 Q3 Q4 Q1 Q2 Q3 Q4Minutes 45 42 41 46 50 60 58 63Variation % -6.2 % -2.0 % 11.7 % 7.7 % 20.8 % -3.9 % 8.9 %
Source: SUTEL, Directorate-General for Markets.
145

Statistical appendix
Table 56Costa Rica: Total mobile telephone service subscriptions by operator, and variation Q1 2011 - Q4 2015 Figures by the end of each quarter in thousands of subscriptions
TOTAL Q1 2011
Q2 2011
Q3 2011
Q4 2011
Q1 2012
Q2 2012
Q3 2012
Q4 2012
Q1 2013
Q2 2013
Q3 2013
Q4 2013
Q1 2014
Q2 2014
Q3 2014
Q4 2014
Q1 2015
Q2 2015
Q3 2015
Q4 2015
ICE 3274 3506 3605 3738 3899 3819 3830 3893 3977 4075 4278 4337 4177 4251 4297 4348 4253 3925 4048 4339
Variation % 5 % 7 % 3 % 4 % 4 % -2 % 0 % 2 % 2 % 2 % 5 % 1 % -4 % 2 % 1 % 1 % -2 % -8 % 3 % 7 %
Claro 0 0 0 115 227 351 601 806 899 923 1056 1307 1386 1282 1121 1144 1206 1319 1328 1414
Variation % 0 % 0 % 0 % 0 % 98 % 55 % 71 % 34 % 12 % 3 % 14 % 24 % 6 % -7 % -13 % 2 % 5 % 9 % 1 % 6 %
Telefónica 0 0 0 122 268 361 410 448 645 814 1063 1272 1369 1326 1361 1431 1515 1493 1637 1677
Variation % 0 % 0 % 0 % 0 % 120 % 35 % 14 % 9 % 44 % 26 % 31 % 20 % 8 % -3 % 3 % 5 % 6 % -1 % 10 % 2 %
Fullmóvil 0 0 14 75 41 59 79 95 79 48 44 45 34 24 27 31 33 41 50 59
Variation % 0 % 0 % 0 % 443 % -46 % 45 % 32 % 21 % -17 % -39 % -8 % 2 % -24 % -28 % 9 % 15 % 8 % 24 % 22 % 19 %
Tuyo Móvil 0 12 64 85 106 105 109 107 101 93 93 98 83 73 68 67 55 47 48 46
Variation % 0 % 0 % 0 % 56 % 12 % 4 % 9 % 4 % 3 % 3 % 7 % 5 % -16 % -12 % -7 % -2 % -18 % -14 % 2 % -5 %
Total 3274 3518 3683 4135 4540 4695 5028 5349 5700 5952 6534 7059 7049 6957 6873 7020 7061 6826 7112 7536
Variation % 5 % 7 % 5 % 13 % 10 % 4 % 7 % 7 % 7 % 5 % 10 % 8 % 0 % -1 % -1 % 2 % 0 % -1 % -1 % 2 %
Source: SUTEL, Directorate-General for Markets.
Mobile phones
Table 57Costa Rica: Total mobile telephone service subscriptions by form of payment, Q1 2011 - Q4 2015Figures by the end of each quarter in thousands of subscriptions, quarterly variation rates, quarterly market share
2011 2012 2013 2014 2015
Q1 2011 Q2 2011 Q3 2011 Q4 2011 Q1 2012 Q2 2012 Q3 2012 Q4 2012 Q1 2013 Q2 2013 Q3 2013 Q4 2013 Q1 2014 Q2 2014 Q3 2014 Q4 2014 Q1 2015 Q2 2015 Q3 2015 Q4 2015
Prepaid 1676 1947 2121 2872 3318 3548 3896 4212 4544 4808 5367 5832 5723 5590 5491 5599 5602 5344 5579 5951
Quarterly prepaid variation 10 % 16 % 9 % 35 % 16 % 7 % 10 % 8 % 8 % 6 % 12 % 9 % -2 % -2 % -2 % 2 % 0 % -5 % 4 % 7 %
Quarterly prepaid share 51 % 55 % 58 % 69 % 73 % 76 % 77 % 79 % 80 % 81 % 82 % 83 % 81 % 80 % 80 % 80 % 79 % 78 % 78 % 79 %
Postpaid 1598 1571 1561 1263 1223 1147 1132 1137 1156 1144 1168 1228 1326 1366 1383 1422 1459 1481 1532 1584
Quarterly postpaid variation -1 % -2 % -1 % -19 % -3 % -6 % -1 % 0 % 2 % -1 % 2 % 5 % 8 % 3 % 1 % 3 % 3 % 2 % 3 % 3 %
Quarterly postpaid share 49 % 45 % 42 % 31 % 27 % 24 % 23 % 21 % 20 % 19 % 18 % 17 % 19 % 20 % 20 % 20 % 21 % 22 % 22 % 21 %
Total 3274 3518 3683 4135 4540 4695 5028 5349 5700 5952 6534 7059 7049 6957 6873 7020 7061 6826 7112 7536
Quarterly variation % 5 % 7 % 5 % 12 % 10 % 3 % 7 % 6 % 7 % 4 % 10 % 8 % 0 % -1 % -1 % 2 % 1 % -3 % 4 % 6 %
Source: SUTEL, Directorate-General for Markets.
146

Statistical appendix
Table 58Costa Rica: Penetration of the mobile telephone service per 100 inhabitants, 2011-2015
2011 2012 2013 2014 2015Penetration rate 90 % 115 % 150 % 147 % 156 %
Source: SUTEL, Directorate-General for Markets.
Table 59Costa Rica: Mobile telephony subscription share by operator and by form of payment, 2011-2015
2011 2012 2013 2014 2015PrepaidICE 87 % 70 % 57 % 58 % 54 %Claro 3 % 16 % 20 % 17 % 19 %Telefónica 4 % 9 % 20 % 23 % 25 %Fullmóvil 3 % 2 % 1 % 1 % 1 %Tuyo Móvil 3 % 3 % 2 % 1 % 1 %PostpaidICE 97 % 84 % 80 % 76 % 71 %Claro 2 % 12 % 12 % 15 % 19 %Telefónica 1 % 4 % 8 % 9 % 10 %
Source: SUTEL, Directorate-General for Markets.
Table 60Costa Rica: Total income from mobile telephony and network (includes Internet) by component, 2011-2015Figures in millions of colones*
2011 2012 2013 2014 2015 Mobile network 263 653 314 503 386 819 518 507 583 108Mobile telephony 239 405 273 342 293 197 391 433 412 742Voice 195 910 234 567 254 527 367 871 398 422SMS/MMS 43 494 38 775 38 670 23 562 14 320Mobile data 24 248 41 161 93 622 127 074 170 366
*Roaming income not included.Source: SUTEL, Directorate-General for Markets.
Table 61Costa Rica: Total income from mobile network by form of payment*, 2011-2015Figures in millions of colones
2011 2012 2013 2014 2015 TOTAL (prepaid + postpaid) 263 653 314 503 386 819 518 507 583 108Prepaid 130 951 183 374 207 126 271 793 252 553Postpaid 132 702 131 129 179 693 246 714 330 555
*Roaming income not included.Source: SUTEL, Directorate-General for Markets.
147

Statistical appendix
Table 62Costa Rica: Total traffic and share by form of payment, per year, 2011-2015Figures in millions of minutes and percentages
Form of payment 2011 2012 2013 2014 2015Totaltraffic 6707 7945 8799 9037 8252Total prepaid 3524 5229 5967 5799 4868Total postpaid 3183 2716 2832 3238 3384Prepaid share 53 % 66 % 68 % 64 % 59 %Postpaid share 47 % 34 % 32 % 36 % 41 %
Source: SUTEL, Directorate-General for Markets.
Table 63Costa Rica: Relative share of net mobile telephone service traffic by origin and destination, in relation to total traffic, 2011-2015Figures in millions of minutes and percentages
Mobiletraffic(onnet-offnet) 2011 2012 2013 2014 2015Totaltraffic 6707 7945 8799 9037 8252Mobile - mobile (On net) 65 % 63 % 60 % 58 % 55 %Mobile - mobile (Off net) 1 % 10 % 15 % 20 % 24 %Mobile - fixed 32 % 24 % 22 % 19 % 18 %Mobile - international 2 % 3 % 3 % 3 % 3 %
Source: SUTEL, Directorate-General for Markets.
148

Statistical appendix
Table 64Costa Rica: Quarterly number of subscriptions to paid television services by access technology 2011-2015
Technology2011 2012 2013 2014 2015
Q1 Q2 Q3 Q4 Q1 Q2 Q3 Q4 Q1 Q2 Q3 Q4 Q1 Q2 Q3 Q4 Q1 Q2 Q3 Q4
Cable television 404 285 410 044 419 092 432 180 444 924 453 987 455 783 462 977 467 125 469 332 474 119 489 848 500 016 505 883 508 268 510 390 510 921 512 431 527 140 532 201
Satellite television 54 349 56 826 58 984 64 885 67 610 70 449 73 408 76 491 99 610 116 371 130 495 146 936 162 355 171 641 186 591 217 140 226 130 240 900 252 908 257 592
IP television 0 0 0 0 0 0 0 0 886 1294 2168 3071 3483 3674 3804 4191 4534 5111 5889 6434
Ground television by multipoint distribution
1065 1134 1148 1072 1173 1145 1192 1225 1136 1097 922 1187 1091 1093 876 825 631 657 605 1003
Total 459 699 468 004 479 224 498 137 513 707 525 581 530 383 540 693 568 757 588 094 607 704 641 042 666 945 682 291 699 539 732 546 742 216 759 099 786 542 797 230
Source: SUTEL, Directorate-General for Markets.
Subscription TV service
Table 65Costa Rica: Total quarterly income from television services by access technology, 2011-2015Figures in millions of colones
Technology2011 2012 2013 2014 2015
Q1 Q2 Q3 Q4 Q1 Q2 Q3 Q4 Q1 Q2 Q3 Q4 Q1 Q2 Q3 Q4 Q1 Q2 Q3 Q4
Cable television 15 279 15 520 15 961 17 591 18 434 18 940 18 727 19 267 20 061 19 973 19 907 20 870 22 374 22 642 23 690 23 288 24 344 24 749 24 631 25 134
Satellite television 911 953 989 3206 3354 3496 3642 3795 4510 5388 6038 6548 7207 7774 7590 8150 8275 8583 9303 8409
IP television 0 0 0 0 0 0 0 0 48 72 123 204 426 463 402 328 287 315 371 398
Ground television by multipoint distribution
4 4 4 14 14 15 16 15 17 15 14 15 14 15 14 14 12 12 12 12
Total 16 194 16 476 16 954 20 811 21 802 22 451 22 385 23 077 24 635 25 449 26 082 27 636 30 022 30 893 31 695 31 779 32 919 33 659 34 318 33 954
Source: SUTEL, Directorate-General for Markets.
149
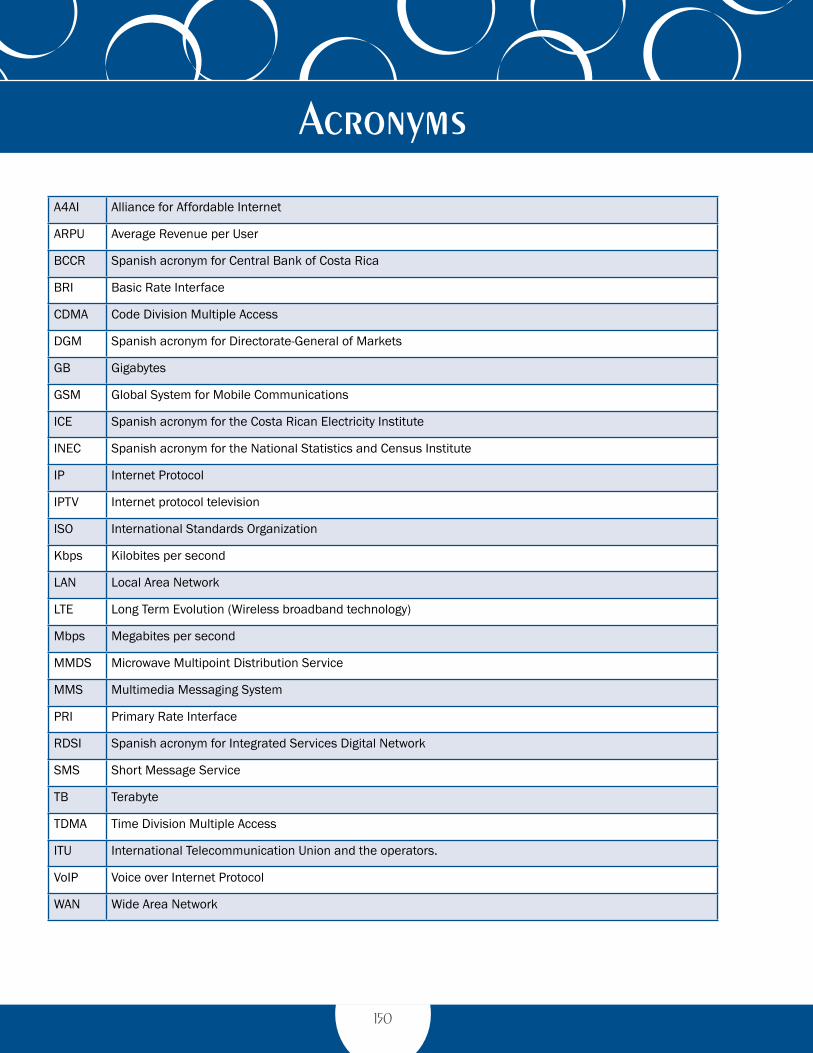
Acronyms
A4AI Alliance for Affordable Internet
ARPU Average Revenue per User
BCCR Spanish acronym for Central Bank of Costa Rica
BRI Basic Rate Interface
CDMA Code Division Multiple Access
DGM Spanish acronym for Directorate-General of Markets
GB Gigabytes
GSM Global System for Mobile Communications
ICE Spanish acronym for the Costa Rican Electricity Institute
INEC Spanish acronym for the National Statistics and Census Institute
IP Internet Protocol
IPTV Internet protocol television
ISO International Standards Organization
Kbps Kilobites per second
LAN Local Area Network
LTE Long Term Evolution (Wireless broadband technology)
Mbps Megabites per second
MMDS Microwave Multipoint Distribution Service
MMS Multimedia Messaging System
PRI Primary Rate Interface
RDSI Spanish acronym for Integrated Services Digital Network
SMS Short Message Service
TB Terabyte
TDMA Time Division Multiple Access
ITU International Telecommunication Union and the operators.
VoIP Voice over Internet Protocol
WAN Wide Area Network
150


Guachipelín, EscazúMultipark Business Center, Tapantí Building, 3rd FloorToll-free line: 800-88SUTELTel: Main Offices: 4000-0000Fax: 2215-6821Electronic Mail: [email protected]