
Cost of Infrastructure to Serve New Residential Development in
77
Copyright ©2011 by Fodor & Associates LLC Cost of Infrastructure to Serve New Residential Development in Austin, Texas Originally Issued May 2010 Updated January 2011 For Brian Rodgers By Eben Fodor Eugene, Oregon www.FodorandAssociates.com
Transcript of Cost of Infrastructure to Serve New Residential Development in

Copyright ©2011 by Fodor & Associates LLC
Cost of Infrastructure to Serve New Residential Development in
Austin, Texas
Originally Issued May 2010
Updated January 2011
For Brian Rodgers
By Eben Fodor
Eugene, Oregon
www.FodorandAssociates.com
Cost of Infrastructure to Serve New Residential Development in Austin Fodor & Associates LLC January 2011 Page 2
Table of Contents Table of Contents .............................................................................................................. 2
Introduction ....................................................................................................................... 3
1. SH 130 District Case Study .......................................................................................... 5
2. Methodology .................................................................................................................. 7
3. Characteristics of New Housing in Austin ............................................................... 12
4. School Facility Costs ................................................................................................... 17
5. Road System Costs ...................................................................................................... 27
6. Water System Costs ..................................................................................................... 37
7. Wastewater System Costs ........................................................................................... 45
8. Stormwater System Costs ........................................................................................... 50
9. Park and Recreation System Costs ............................................................................ 53
10. Development Impact Fees in Austin ....................................................................... 56
11. Conclusions ................................................................................................................ 61
Appendices ....................................................................................................................... 65
A. Population Projections for Austin ............................................................................ 66
B. Data on Student Generation ...................................................................................... 67
C. Water and Wastewater System Cost Estimates from Other City Reports ............. 68
D. Relative Impacts of New Single- and Multifamily Units ....................................... 71
E. Notes on Data and Calculations Used in Study ....................................................... 75
Cost of Infrastructure to Serve New Residential Development in Austin Fodor & Associates LLC January 2011 Page 3
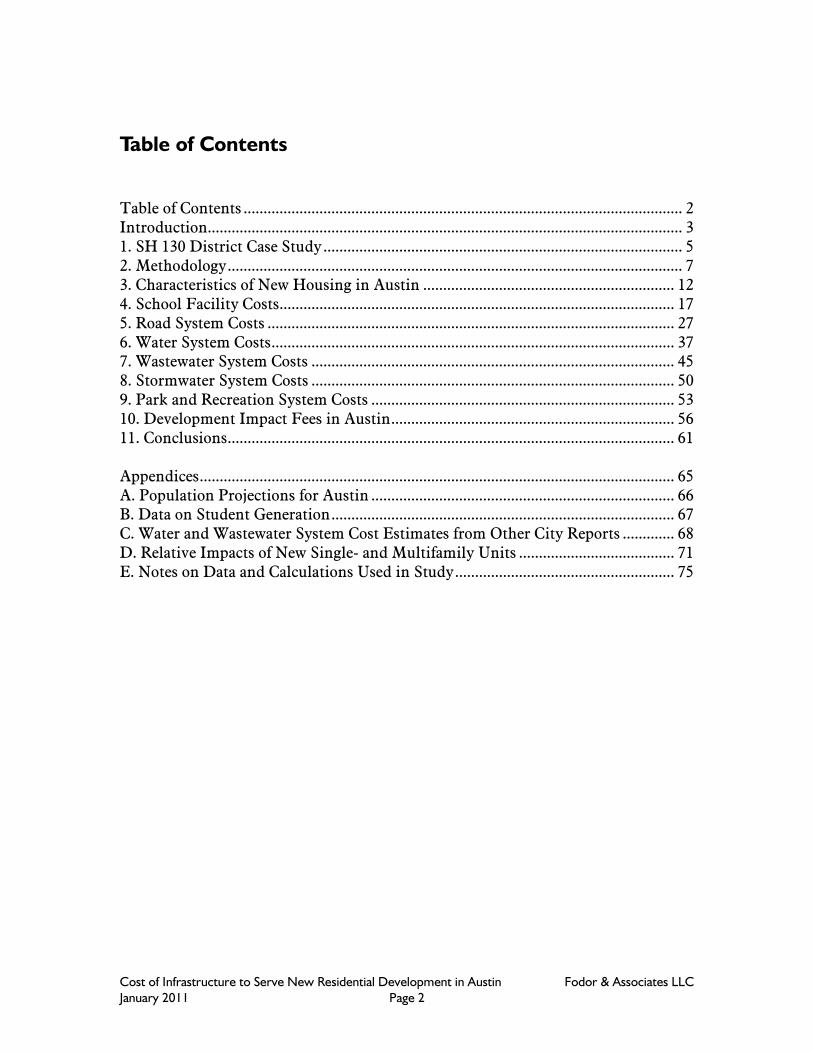
Introduction This study examines the costs of public facilities and infrastructure required to serve new residential development in Austin, Texas. Each new residential unit adds to the demand for public facilities such as roads, schools, sewers, and so forth. The incremental costs for these facilities are compared with the fees and revenues each new residential unit is likely to generate that offset the costs. As shown in Table 1, there are 12 categories of basic infrastructure provided by local government in Austin. This report constitutes Part 1 of an envisioned multi-part research project and looks at the first six of these categories, including school facilities, roads, sanitary sewer system, water service, stormwater drainage system, and park and recreation facilities.
Table 1
Basic Public Infrastructure Required by New Residential Development
All Categories
Included in this
Report?
1 School Facilities Yes 2 Transportation System Yes 3 Water Service Facilities Yes 4 Sanitary Sewer System Yes 5 Storm Drainage System Yes 6 Parks & Rec. Facilities Yes 7 Fire & EMS Facilities No 8 Police Facilities No 9 Library Facilities No 10 General Gov. Facilities No 11 Solid Waste Facilities No 12 Power Gen. & Dist. Sys. No
The cost of providing infrastructure to serve new urban development is well known by many in the design, construction, and urban planning professions. However, the general public is often unaware of the magnitude of these costs and the commitment of local financial resources required to support urban growth. Cities typically provide little or no information that would help citizens and public officials understand these fiscal impacts. When they do, it can significantly improve the quality of decision-making on major land use actions. One local example is provided in the SH 130 District Case Study in the next section.
Cost of Infrastructure to Serve New Residential Development in Austin Fodor & Associates LLC January 2011 Page 4
The following two sections, Methodology and Characteristics of New Housing in Austin, provide essential information that is used elsewhere in the report. Reviewing later sections without reading these two sections may leave the reader unclear about the methodology or the calculations used. Each of the six infrastructure categories is addressed in a separate section. The cost for each type of facility is determined and the demand for capacity by each new residential unit is estimated. This is followed by a section on Impact Fees in Austin that describes which fees are allowed by state law and which fees are collected in Austin. The findings of the study are summarized in the Conclusions. This update to the original study, issued in May 2010, adds improved cost data for water and wastewater systems based on a detailed analysis of Austin’s South I-35 Water/Wastewater Program conducted by Fodor & Associates in September of 2010. All final capital cost figures were updated to 2010 values using the ENR Construction Cost Index.
Cost of Infrastructure to Serve New Residential Development in Austin Fodor & Associates LLC January 2011 Page 5
1. SH 130 District Case Study An illustration of the costs associated with new development can be found in the City of Austin’s SH 130 Infrastructure District Report, conducted in 2006 to study the fiscal impacts of a proposed development district along the SH 130 corridor. The idea was to create a special 42-square-mile district surrounding SH 130 outside of current city limits, but inside the City’s extraterritorial jurisdiction (ETJ) that could be prepared for future development. In theory, future development in the SH 130 District would pay for all of the new infrastructure needed to serve the area. All of the new taxes generated by the new development would be allocated to the district’s infrastructure costs and to operation and maintenance of the facilities. However, the study’s findings revealed a different conclusion. The study examined only the costs for the new roads, water and sewer mains, and drainage systems within the district. The study found that the cost of financing these basic infrastructure requirements would exceed the proposed district’s revenues by a wide margin and would ultimately result in large debts being transferred to the City to be repaid by all the City’s taxpayers. Specifically, the SH 130 District would require $569 million for the four categories of basic infrastructure evaluated (roads, water and sewer mains, and drainage systems). The study did not include costs for expanding water and sewage treatment plants and did not try to estimate additional costs of providing the other facilities and services new development requires from local government (schools, parks, libraries, fires stations, police stations, etc.). Had these been included, the costs would have been considerably higher. Potential new revenues from all future property taxes and sales taxes in the District could reach $13 million to $26 million per year, depending on how much development actually occurs. Even if 100% of this revenue was devoted to making payments on the bonds to fund the infrastructure, they would not be adequate to repay the $569 million cost. Furthermore, once facilities are built, they must be operated and maintained. The estimated operating cost for the facilities in the study is $13 million per year. The operation and maintenance of the new facilities alone would consume the entire lower-range estimate of all tax revenues from the district, leaving little or nothing to repay the $569 million in infrastructure bonds. In a more-optimistic scenario, with more development and higher tax revenues, some of the tax revenues from the new district would go toward repaying bonds. According to the study, when the district is closed after its 15-year life, the remaining bonded debt transferred to the City would range from $184 million to $460 million. City taxpayers and ratepayers would repay most of the balance of the costs for the infrastructure to serve the SH 130 District. The report indicates that
Cost of Infrastructure to Serve New Residential Development in Austin Fodor & Associates LLC January 2011 Page 6
42% of the costs would end up being repaid by the Austin Water Utility, presumably via increased water and sewer rates for customers citywide. The bottom line from this study is that, under current tax rates, utility rates, and fees, new development will not pay its own way and will instead create a substantial cost burden on local taxpayers and utility ratepayers. Due to the negative fiscal impacts shown in this report, no further action has been taken to create the new district. In most cases, cities embark on annexations and growth plans, like the SH 130 District, without any sort of fiscal impact study. Citizens and city leaders have no clear idea what the financial impact will be on the existing community. Frequently it is assumed that the new growth will bring a bonanza of new revenues to fill city coffers. Not until after the development has occurred do citizens discover the true fiscal impacts of these decisions. Fortunately the City of Austin prepared the SH 130 Infrastructure District Report and identified the fiscal impacts before making a decision.

Cost of Infrastructure to Serve New Residential Development in Austin Fodor & Associates LLC January 2011 Page 7
2. Methodology Fiscal impact analysis focuses on the differences between government revenues and costs that will result from a proposed action. As shown in Figure 2-1, revenues include taxes, fees and other income. Costs include operation (services) and maintenance (O&M) and new or expanded capital facilities and equipment. The difference between costs and revenues is the net fiscal impact — either a cost or a surplus.
Figure 2-1: Diagram of fiscal impacts on local government. (Fodor & Associates)
Usually local governments must balance their budgets every year so that costs don’t exceed revenues. While this is generally true for government services (O&M costs), it is not the case for major capital expenditures. Local governments may issue general obligation bonds for new capital facilities that enable them to carry debt into the future. General obligation debt is a reasonable way to finance facilities that have a broad public benefit and a life that exceeds the financing period (typically 20 years for bonds). However, when the new facilities are constructed primarily to serve new development, an inherent inequity results whereby all City taxpayers pay to fund facilities that benefit a small segment of the population. One solution to this problem is the special tax district or local improvement district (LID) that limits funding of improvements to the area that will benefit from the investment. Another is the development impact fee that directly recovers some, or all, of the costs associate with providing certain facilities to new development. Austin uses several impact fees to partially offset costs, as described in more detail later in the section Impact Fees in Austin. This study focuses on the costs and revenues associated with the expansion of the City’s capital facilities that will be required to serve residential development. Capital
Cost of Infrastructure to Serve New Residential Development in Austin Fodor & Associates LLC January 2011 Page 8
costs include all construction and land costs for buildings, roads, equipment, utility mains, and so forth. Capital facilities are typically funded by general obligation bonds. These bonds are repaid through direct increases in local tax rates for the life of the bond. This phase of the study does not evaluate the costs and revenues associated with operating and maintaining city services for new development. The net fiscal impact associated with providing public infrastructure to new development in Austin can be expressed as:
Net Fiscal Impact = Revenues toward Infrastructure – Cost of Infrastructure
Where,
Revenues toward Infrastructure = Impact Fees Paid + Taxes Paid Toward Infrastructure A net fiscal impact that is a cost will be negative in the above equations. However, rather than report costs as negative values, they are simply labeled as costs. From an accounting perspective, there are two basic types of costs and revenues: annual streams that occur every year, and one-time costs or payments. Tax revenues and service costs represent the former. Infrastructure costs and any associated impact fees or charges are treated as the latter. As soon as a new development is completed, the occupants will need water and sewer service, adequate road capacity, classroom space for their children, fire protection, and public safety services, so all these facilities must be in place. Estimating Demand for Infrastructure From a practical perspective, infrastructure is not built or expanded each time a new house is built. Instead, infrastructure is built in larger increments based on recent development that has occurred and future development that is expected. None-the-less, each new housing unit adds to system demand. There are a number of standard methods for estimating the demand for new facilities and infrastructure a new development will generate. These include:
Existing service standards (or level-of-service requirements); Planning estimates based on long-range plans; and, Averaged demand based on the total population of the service area.
Each method has advantages and drawbacks. The methods used here were selected to yield the best estimates of demand given the limitations of available data. Where
Cost of Infrastructure to Serve New Residential Development in Austin Fodor & Associates LLC January 2011 Page 9
more than one method is available, a second method can be used to crosscheck results. In some cases the capacity of infrastructure must be adequate to serve peak demands. For example, water treatment capacity must be adequate to meet peak demand periods, not just average demand. In such cases, the demand for public facilities is based on peak demand, rather than average demand. The basic unit of development evaluated in this study is the “typical new housing unit.” This housing unit represents the average of new units being built today. It is based on the mix of single-family and multifamily units built in recent years in Austin (see the following section Characteristics of New Housing in Austin for more details). The demand for infrastructure, and the associated costs and revenues calculated in this report, are based on serving this typical new housing unit. The demand for infrastructure from a new development may be different than from an older development. This has been taken into consideration in a number of ways. For example, the following section on Characteristics of New Housing in Austin shows that new housing will tend to be larger, have more occupants, and generate a greater demand for services than the average of existing housing. Also, new water and sewer mains are likely to be tighter and have fewer leaks than older ones, reducing the demand for these services. The costs for City infrastructure are taken from available City reports and supplemented by information provided by City staff. Where necessary, capital costs are adjusted to 2010 values using a construction cost index. The cost per unit of capacity for each category of infrastructure is multiplied by the demand for that infrastructure created by a typical housing unit, resulting in a “gross” cost per unit. Accounting for Future Tax Contributions New development will pay property taxes. These additional taxes will largely go toward funding the ongoing services provided to all developed areas by the City of Austin. Some of these tax revenues will offset a portion of the capital cost of the public facilities required to serve the development. The portion funded in this manner depends on how each category of infrastructure is funded by the City. Funding is addressed at the end of the section for each type of infrastructure. In most cases, general obligation bonds are used to finance capital projects. These bonds are issued for specific capital projects and are typically repaid over 20 years through fixed increases in the property taxes paid by all property owners in the City. The total assessed value of all private property in the City forms the tax base that is used to repay bonds. The contribution of new development towards bond repayment can be estimated by examining a single year of urban growth. If new development in a given year
Cost of Infrastructure to Serve New Residential Development in Austin Fodor & Associates LLC January 2011 Page 10
increases the City’s total tax base by 2%, then this development will pay for 2% of the cost of the bonds issued in that year to pay for new infrastructure to serve the development. The remaining 98% of the costs will be paid by the existing tax base. This is a simplification of a more complex dynamic. In reality, development will continue year after year and new infrastructure will be added on a regular basis. The infrastructure will be built in larger increments, intended to anticipate the needs of future development for many years (for example, a new school or sewage treatment plant). However, each new residential unit contributes to the demand for new or expanded facilities. Nonetheless, this simplification provides a reasonable approximation of the contribution new development makes towards bond repayment for the infrastructure costs it creates. Austin’s population is projected to grow at a rate of about 1.5% per year over the next two decades. Residential and commercial development in the City can be expected to increase at about the same rate. For infrastructure funded through the general tax base (or through the rate base in the case of water and wastewater facilities), it has been assumed that new development will contribute 2% of the capital costs. This percentage is slightly higher based on the assumption that new development will have a higher assessed value than existing development. The actual increase in Austin’s tax base resulting from new development for fiscal year 2010 was 1.55 percent, so the 2% estimate used here may overstate future tax contributions slightly.1 An example of the calculation of future tax contributions toward infrastructure is provided in the funding discussion at the end of the School Facility Cost section. In the final tally of costs in the Conclusions section of the report, this tax contribution is deducted from the total gross infrastructure costs. New residential development will also pay impact fees towards the costs for water, wastewater and park infrastructure. The impact fees that will be paid are calculated in the section Impact Fees in Austin. These impact fees are also deducted from the gross infrastructure costs. The final “net” cost for each type of infrastructure is the result of deducting any impact fees and future tax contributions from the gross cost. Data Sources The study methodology is intended to be transparent. All essential data is provided, sources of all information are identified, and the calculations used are explicit in this report. The study relied on existing data and reports from City, County, State, and Federal sources. It was beyond the scope of the study to collect or generate new empirical data where none existed. For each category of public facilities studied, all available, relevant public information was collected and carefully reviewed. Where published reports and
1 Source: TCAD 2010 Certification Information for the City of Austin.

Cost of Infrastructure to Serve New Residential Development in Austin Fodor & Associates LLC January 2011 Page 11
documents were insufficient, Public Information Requests were used to request additional data and clarifications. In some areas, excellent data was available. However, in others, information was very limited and reasonable assumptions or estimates had to be made. These assumptions are stated in the report. In a few cases there were no data available for Austin and proxy data from other nearby cities, or national data, had to be used. Other Notes on Methodology The capital costs associated with all onsite facilities, such as local roads and water and sewer lines, are assumed to be borne by the developer. Only the costs of the offsite public facilities are included in this study. All revenue and cost figures are given in 2010 dollars and values, unless otherwise stated.. Costs from other years were adjusted to 2010 values based on the appropriate inflation index or construction cost index. Tax rates, utility rates, impact fees, and other charges were based on the 2010 rates. This study examines only impacts on the City of Austin, and does not include impacts to Travis County, the State of Texas, or the Federal Government. This is especially significant in connection with transportation system costs, as most of the funding for these facilities comes from state and federal governments. The City of Austin will fund less than 4% of future transportation system improvements for the tri-county metro area.2 The terms “gross” and “net” are used to describe costs and revenues in this report. In the case of costs, a gross cost would be the total cost to provide a particular facility or service, while the net cost would be the gross cost, minus any payment or revenue from the development towards that facility. In other words, it is the balance of costs after any revenues are deducted. In the Conclusions section of the report, future tax revenues towards the infrastructure costs and any impact fees or other direct payments by new development are deducted from the gross cost to yield a final net cost.
2 See the Road System Costs section for a description of regional transportation funding.
Cost of Infrastructure to Serve New Residential Development in Austin Fodor & Associates LLC January 2011 Page 12
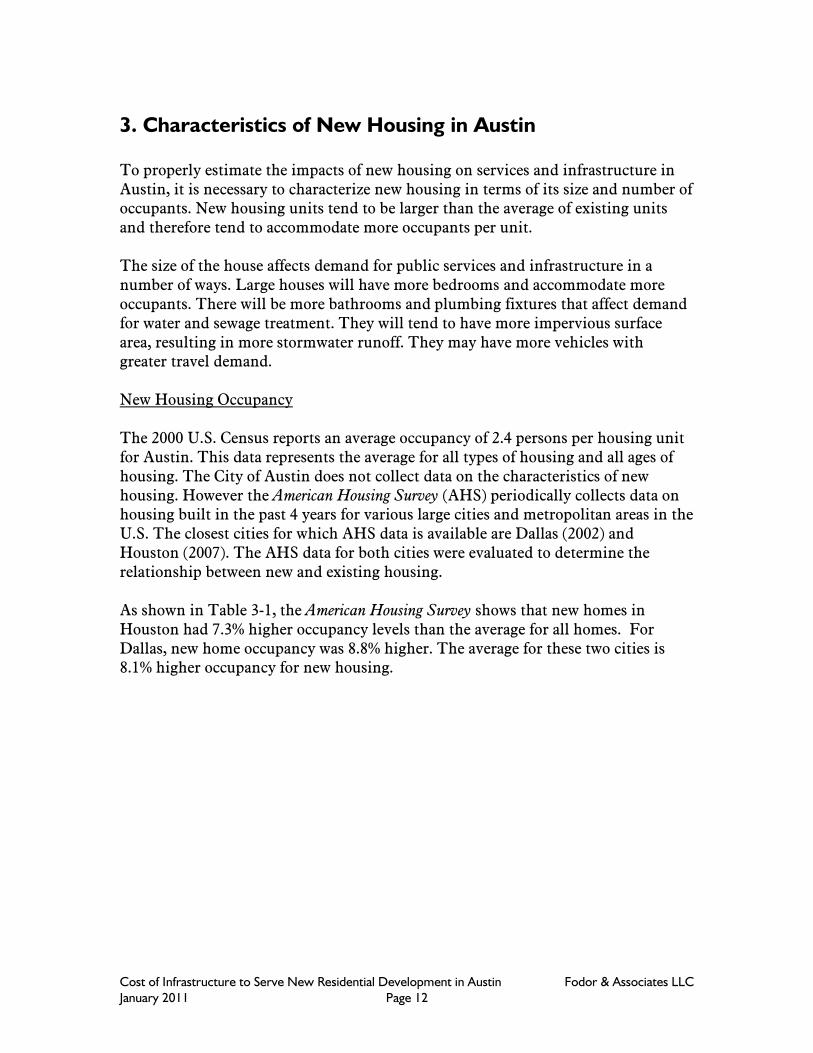
3. Characteristics of New Housing in Austin To properly estimate the impacts of new housing on services and infrastructure in Austin, it is necessary to characterize new housing in terms of its size and number of occupants. New housing units tend to be larger than the average of existing units and therefore tend to accommodate more occupants per unit. The size of the house affects demand for public services and infrastructure in a number of ways. Large houses will have more bedrooms and accommodate more occupants. There will be more bathrooms and plumbing fixtures that affect demand for water and sewage treatment. They will tend to have more impervious surface area, resulting in more stormwater runoff. They may have more vehicles with greater travel demand. New Housing Occupancy The 2000 U.S. Census reports an average occupancy of 2.4 persons per housing unit for Austin. This data represents the average for all types of housing and all ages of housing. The City of Austin does not collect data on the characteristics of new housing. However the American Housing Survey (AHS) periodically collects data on housing built in the past 4 years for various large cities and metropolitan areas in the U.S. The closest cities for which AHS data is available are Dallas (2002) and Houston (2007). The AHS data for both cities were evaluated to determine the relationship between new and existing housing. As shown in Table 3-1, the American Housing Survey shows that new homes in Houston had 7.3% higher occupancy levels than the average for all homes. For Dallas, new home occupancy was 8.8% higher. The average for these two cities is 8.1% higher occupancy for new housing.
Cost of Infrastructure to Serve New Residential Development in Austin Fodor & Associates LLC January 2011 Page 13
Table 3-1
Occupancy of New vs. All Housing for Houston and Dallas
Persons per Occupied Housing Unit
Houston 2007(1)
Dallas 2002(2)
Average for Two Cities
All Units 2.73 2.73 2.73 New Units 2.93 2.97 2.95 Difference 7.3% 8.8% 8.1% (1) Derived from American Housing Survey for the Houston Metropolitan Area: 2007, Issued February 2009, U.S. Department of Housing and Urban Development. (2) Derived from American Housing Survey for the Dallas Metropolitan Area: 2002, Issued July 2003, U.S. Department of Housing and Urban Development.
To estimate the occupancy of a typical new housing unit in Austin, the average occupancy of 2.4 persons per unit from the 2000 Census was increased by 8.1% based on the average increase found in Dallas and Houston. This results in an estimated average occupancy of 2.6 persons per new unit in Austin. This estimate was used in the study to reflect typical new housing units. Note that this estimate is not for a single-family house, but is an average for all new housing, including multifamily housing. The estimate of occupancy for new housing units used here (2.6 persons/housing unit) is likely to be lower than the actual occupancy in Austin due to the use of the 2000 Census base year. The AHS provides data allowing comparison of new housing built in the previous 4 years with all existing housing at the time of the study. The relationship between new and existing housing in the same year from the AHS is being applied in 2010 to housing occupancy data for Austin from 2000. Ten years have passed since the Census, and housing has almost certainly increased in both size and occupancy levels during that time. For example, new single-family houses in the U.S. have increased in size from an average of 2,266 sq.ft. in 2000 to 2,534 sq.ft. in 2008, an increase of 12% in eight years.3 The increase in house sizes would likely have resulted in an increase in occupancy levels. Lacking any clear method to estimate this increase in occupancy in Austin from 2000 to 2010, it could not be included in the study. Since the occupancy rate used here is likely lower than actual rates, the impacts of new housing on demand for services and infrastructure will be understated somewhat. New Housing Floor Area New housing tends to be larger than the average for existing housing. As noted above, the average size for a new single-family house built in the U.S. in 2008 was 2,534 square feet. House sizes have been increasing steadily for many decades. The
3 Annual 2008 Characteristics of New Housing, U.S. Census, released June 1, 2009, One-Family Houses.
Cost of Infrastructure to Serve New Residential Development in Austin Fodor & Associates LLC January 2011 Page 14
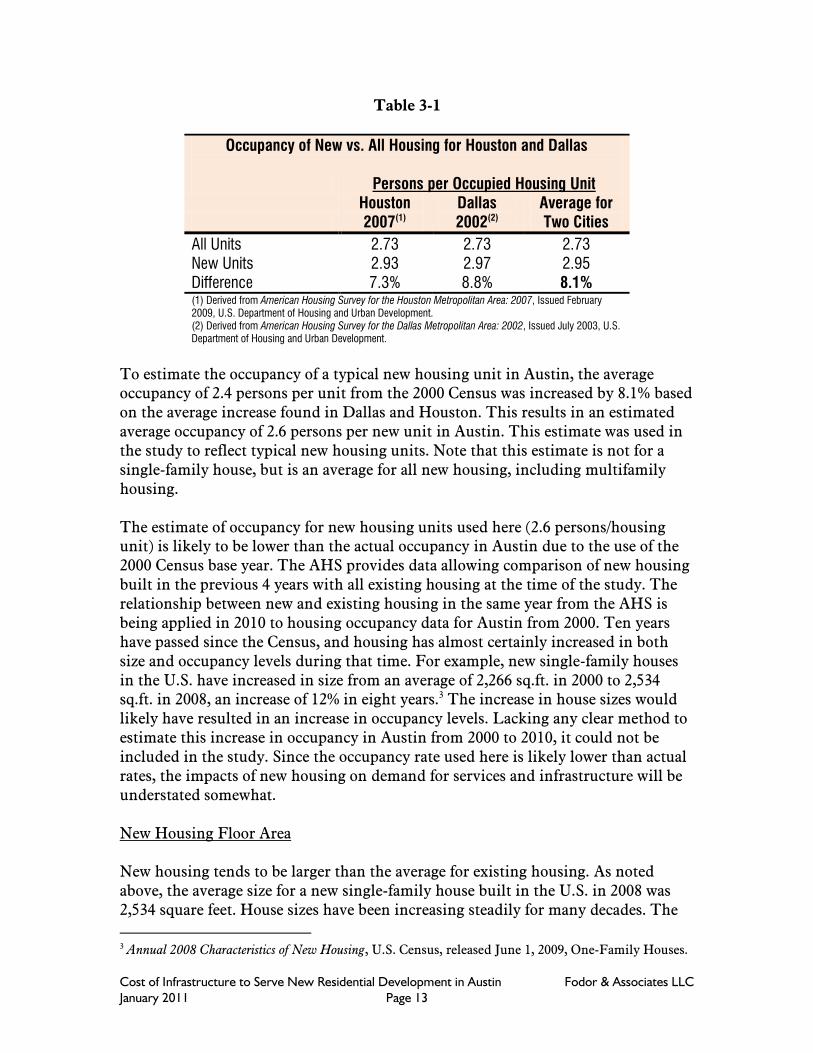
house built in 2008 is 16% larger than one built 10 years earlier (2,190 sq.ft.) and 27% larger than one built 20 year earlier (1,995 sq.ft.). Data on the size of the average new housing unit in Austin is not available. As shown in Table 3-2, the American Housing Survey for Dallas and Houston reported the floor area of new housing to be from 17% to 33% larger than the median for all housing in those cities. The average for the two cities is a 25% increase for new housing. Based on data from Dallas and Houston, it is reasonable to assume that new housing units in Austin will be roughly 25% larger than the average of all existing units. Average floor area for new housing units will also depend on the unique mix of single-family and multifamily housing in Austin. This mix is addressed later in this section. In the U.S., new multifamily housing units averaged 1,259 square feet in 2008, which is approximately 50% of the size of new single-family units (2,534 sq.ft.).4 Multifamily units have increased less in size than single-family units and have remained relatively constant for the past four years.
Table 3-2
Size of New vs. All Housing for Houston and Dallas
Median Floor Area per Housing Unit
(Sq.Ft.)
Houston 2007(1)
Dallas 2002(2)
Average for Two Cities
All Units 1,956 1,927 1,942 New Units 2,287 2,559 2,423 Difference 16.9% 32.8% 24.8% (1) Derived from American Housing Survey for the Houston Metropolitan Area: 2007, Issued February 2009, U.S. Department of Housing and Urban Development. (2) Derived from American Housing Survey for the Dallas Metropolitan Area: 2002, Issued July 2003, U.S. Department of Housing and Urban Development.
Population and Housing Growth in Austin For the purposes of estimating future changes in the population and housing in Austin, a population forecast is used based on figures prepared by the City Demographer.5 As shown in Figure 3-1, future growth is expected to occur at a rate
4 Annual 2008 Characteristics of New Housing, U.S. Census, released June 1, 2009, Units in New Multifamily Buildings. 5 Data from City of Austin Demographics, by Ryan Robinson, City Demographer, Department of Planning, City of Austin, dated January 2010. The population data used in this report is provided in the Appendix.

Cost of Infrastructure to Serve New Residential Development in Austin Fodor & Associates LLC January 2011 Page 15
of about 1.5% per year for the next two decades. These population figures do not assume further annexations by the City, which would have the effect of increasing the population levels. The full population data is provided in Table A-1 in the Appendix. In the next 20 years the population of Austin is expected to grow by 269,943 people, from 785,850 people in 2010 to 1,055,793 in 2030. Based on the estimated average of 2.6 persons occupying new housing units, this increase in population will result in the construction of 103,824 additional housing units in the City.
Figure 3-1
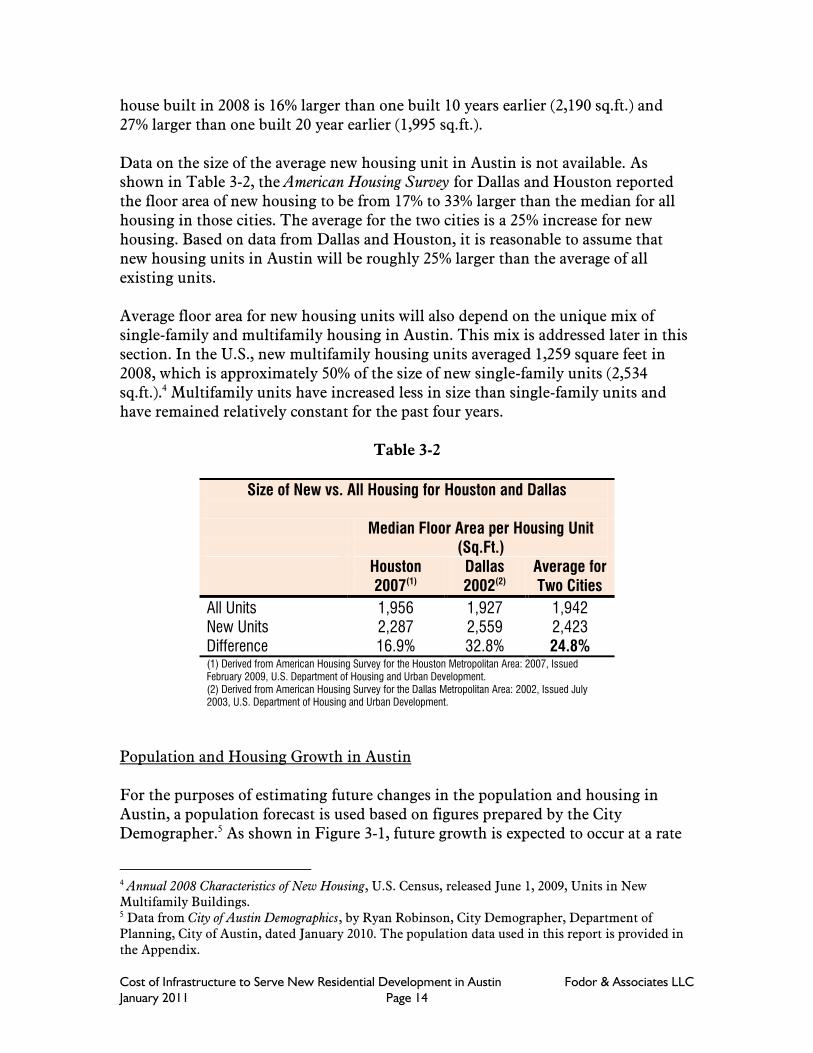
Single-Family and Multifamily Housing in Austin The figures in this study are for average new housing units. These are composed of a mix of new single-family and multifamily units. Nationally, in 2008 about 73% of new housing units were single-family and 27% were multifamily.6 In Austin the percentage of multifamily is much higher. According to an analysis of tax records from the Travis Central Appraisal District by the Austin ISD, there were 129,000
6 Annual 2008 Characteristics of New Housing, U.S. Census, released June 1, 2009.
Cost of Infrastructure to Serve New Residential Development in Austin Fodor & Associates LLC January 2011 Page 16
single-family units and 143,000 multifamily units in the City in 2007.7 Therefore, single-family units currently comprise 47% and multifamily comprise 53% of the 272,000 housing units identified in the study. For a look at more recent development, the City analyzed housing starts from 2000 to 2004 and reported that single-family comprised 15,290 units (46%) and multifamily comprised 18,023 units (54%) of the total.8 As shown graphically in Figure 3-2, it appears that the mix of new housing in Austin is similar to the existing mix, with a much higher share of new multifamily housing than is being built nationally. This 46%/54% mix of housing is used in the study to reflect the typical new housing unit in Austin.
Figure 3-2: Mix of single-family and multifamily housing in Austin compared with nation.
All of the final costs and revenues in the main report are for a typical residential housing unit. Cost estimates for single- and multifamily units are provided in Appendix D.
7 Demographic Analysis and Enrollment Projections for the Austin Independent School District, 2008-2009 Update, Harner and Associates, January 8, 2008, pages 19 and 20. Multifamily included condos and townhouses in this study. Note that City Limits vary somewhat from the AISD boundary. 8 City of Austin Population and Households Forecast by ZIP Code, Updated Forecast, Table on page 13 titled: City of Austin Housing Starts by ZIP Code January 1, 2000 through October 1, 2004 (http://www.ci.austin.tx.us/demographics/downloads/zip_forecast_update_2020c.pdf).
Cost of Infrastructure to Serve New Residential Development in Austin Fodor & Associates LLC January 2011 Page 17
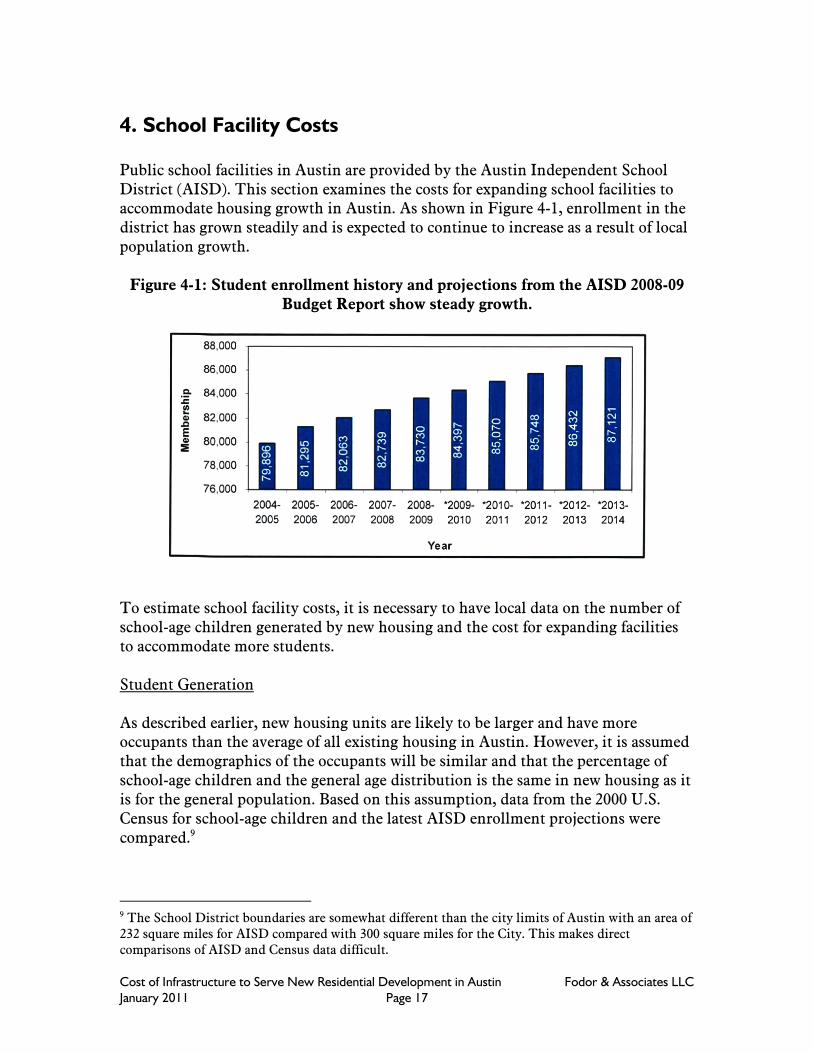
4. School Facility Costs Public school facilities in Austin are provided by the Austin Independent School District (AISD). This section examines the costs for expanding school facilities to accommodate housing growth in Austin. As shown in Figure 4-1, enrollment in the district has grown steadily and is expected to continue to increase as a result of local population growth.
Figure 4-1: Student enrollment history and projections from the AISD 2008-09 Budget Report show steady growth.
To estimate school facility costs, it is necessary to have local data on the number of school-age children generated by new housing and the cost for expanding facilities to accommodate more students. Student Generation As described earlier, new housing units are likely to be larger and have more occupants than the average of all existing housing in Austin. However, it is assumed that the demographics of the occupants will be similar and that the percentage of school-age children and the general age distribution is the same in new housing as it is for the general population. Based on this assumption, data from the 2000 U.S. Census for school-age children and the latest AISD enrollment projections were compared.9
9 The School District boundaries are somewhat different than the city limits of Austin with an area of 232 square miles for AISD compared with 300 square miles for the City. This makes direct comparisons of AISD and Census data difficult.

Cost of Infrastructure to Serve New Residential Development in Austin Fodor & Associates LLC January 2011 Page 18
U.S. Census data for the City of Austin in 2000 shows that 15.36% of the population was of K-12 school age (5 to 17 years old). A breakdown of population for each school level is shown in Table 4-1. For a typical new housing unit with 2.6 occupants, this would equate to 0.40 school-age children per unit (2.6 x 0.1536). However, for various reasons, not all of these children will go to AISD schools.
Table 4-1
School-Age Children in Austin from 2000 Census(1)
Grades Age Cohort Population in Age Cohort
Percent of Total City Population(2)
Children per New Housing Unit(3)
K-5 Total 5-10 years 49,070 7.47% 0.19 6-8 Total 11-13 years 22,091 3.36% 0.09 9-12 Total 14-17 years 29,672 4.52% 0.12
All School Age 5-17 years 100,833 15.36% 0.40 1) Source: Compiled from Table QT-P1, Age Groups and Sex: 2000. Data set: Census 2000 Summary File 1 (SF 1) 100-Percent Data. 2) Population reported in 2000 Census for Austin was 656,562. 3) Based on 2.6 occupants per new residential unit.
AISD commissioned a study of demographics and student enrollment that was released at the beginning of 2008 which provides the best recent data on enrollment.10 According to this study, existing single-family housing units in the District have 0.40 students per unit on average and multifamily units have 0.22 students per unit on average.11 Combining these two categories yields an average of 0.31 students for all housing units in the School District (see Table 4-2).
10 Demographic Analysis and Enrollment Projections for the Austin Independent School District, 2008-2009 Update, Harner and Associates, January 8, 2008. Contents of the report indicate that it was updated later in 2008 after it was issued. 11 For this study, “multifamily units” included condos and townhouses.

Cost of Infrastructure to Serve New Residential Development in Austin Fodor & Associates LLC January 2011 Page 19
Table 4-2
Students per Existing Housing Unit in AISD, 2008(1)
Housing Type Number of Students
Housing Units
Students per Unit
Single Family Units(2) 52,000 129,000 0.40 Multifamily Units(3) 31,000 143,000 0.22
Average All Housing Units 83,000 272,000 0.31 (1) Source: Demographic Analysis and Enrollment Projections for the Austin Independent School District, 2008-2009 Update, Harner and Associates, January 8, 2008. (2) Single Family includes manufactured housing. (3) AISD defines “multifamily” as including townhouses and condos.
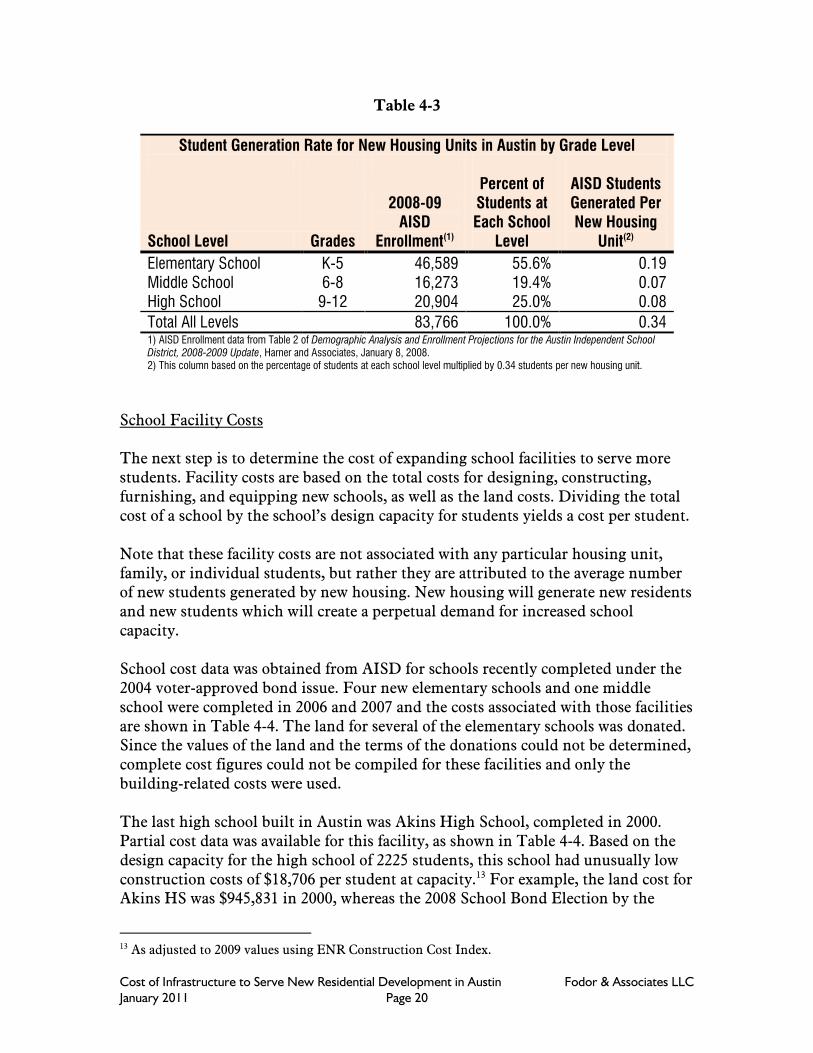
To adjust the AISD figures for the larger size and corresponding occupancy levels of new housing units, the average of 0.31 students/unit for existing housing was increase by 8.1 percent. This results in a student generation rate of 0.34 students per new housing unit. These figures are for students actually attending public schools in the AISD and are not for all school-age children in the District. Some children may attend private schools, be home schooled, or may have dropped out of the school system. No data is provided in the AISD report regarding what portion of school-age children in the District are not attending public schools.12 The distribution of students generated by new housing at each school level are shown in Table 4-3 based on a total of 0.34 students per new housing unit. This distribution is used to estimate the costs associated with school facilities at each level (elementary, middle and high). The distribution of students based on school-age students reported in the 2000 Census is slightly different and is provided in Appendix B for comparison purposes.
12 According to the AISD, the District does not have any information on the percentage of school-age children in the District that attend private schools, are home-schooled, or otherwise do not attend public schools.
Cost of Infrastructure to Serve New Residential Development in Austin Fodor & Associates LLC January 2011 Page 20
Table 4-3
Student Generation Rate for New Housing Units in Austin by Grade Level
School Level Grades
2008-09 AISD
Enrollment(1)
Percent of Students at Each School
Level
AISD Students Generated Per New Housing
Unit(2)
Elementary School K-5 46,589 55.6% 0.19 Middle School 6-8 16,273 19.4% 0.07 High School 9-12 20,904 25.0% 0.08
Total All Levels 83,766 100.0% 0.34 1) AISD Enrollment data from Table 2 of Demographic Analysis and Enrollment Projections for the Austin Independent School District, 2008-2009 Update, Harner and Associates, January 8, 2008. 2) This column based on the percentage of students at each school level multiplied by 0.34 students per new housing unit.
School Facility Costs The next step is to determine the cost of expanding school facilities to serve more students. Facility costs are based on the total costs for designing, constructing, furnishing, and equipping new schools, as well as the land costs. Dividing the total cost of a school by the school’s design capacity for students yields a cost per student. Note that these facility costs are not associated with any particular housing unit, family, or individual students, but rather they are attributed to the average number of new students generated by new housing. New housing will generate new residents and new students which will create a perpetual demand for increased school capacity. School cost data was obtained from AISD for schools recently completed under the 2004 voter-approved bond issue. Four new elementary schools and one middle school were completed in 2006 and 2007 and the costs associated with those facilities are shown in Table 4-4. The land for several of the elementary schools was donated. Since the values of the land and the terms of the donations could not be determined, complete cost figures could not be compiled for these facilities and only the building-related costs were used. The last high school built in Austin was Akins High School, completed in 2000. Partial cost data was available for this facility, as shown in Table 4-4. Based on the design capacity for the high school of 2225 students, this school had unusually low construction costs of $18,706 per student at capacity.13 For example, the land cost for Akins HS was $945,831 in 2000, whereas the 2008 School Bond Election by the
13 As adjusted to 2009 values using ENR Construction Cost Index.
Cost of Infrastructure to Serve New Residential Development in Austin Fodor & Associates LLC January 2011 Page 21
AISD included $32 million just for the land costs for a planned new high school in the City. Based on other recent high school costs, the construction and land costs for Akins HS were not considered to be representative of the cost AISD will incur for a future high school. For comparison, data collected by the Council of Educational Facility Planners International (CEFPI) for Texas high schools shows an average building construction cost of $24,892 per student capacity for a sample of nine high schools built in Texas from 1997 to 2008.14 The construction costs were adjusted by CEFPI to 2009 costs. These figures are building construction costs only and do not include land costs or the costs of designing, equipping and furnishing the schools, and therefore do not reflect the full facility costs. The 2009 CEFPI construction costs for the nine high schools average $186 per square foot of building floor area. To obtain more-recent and complete cost figures for high school facilities, information was obtained for the Conrad High School in Dallas, as shown in Table 4-4. This high school was completed in 2006 and the Dallas ISD provided complete cost and capacity data. Adjusting the construction costs to 2010 values using a construction cost index resulted in a current construction cost of $168 per square foot (including designing, furnishing and equipping the facility). While this construction cost is less than the CEFPI estimate, it was considered to be the most-complete and recent data and was used in the study.
14 Data provided by The Council of Educational Facility Planners International on 7/21/09 and dated 8/14/08. Costs were adjusted by CEFPI to estimate 2009 values.

Cost of Infrastructure to Serve New Residential Development in Austin Fodor & Associates LLC January 2011 Page 22
Table 4-4
Nominal Costs of Building Recent Schools in Austin(1)
Dallas Nine Texas High
Schools Blazier ES Clayton ES Overton ES Perez ES Garcia MS Akins HS(2) Conrad HS(3) (CEFPI, 2009$)(4)
Year Completed(5) 2007 2006 2007 2006 2007 2000 2006 Various School Design Capacity(6) 748 880 726 792 1,100 2,225 2,000 19,341 Land Area, acres(7) 15.71 16.84 70.36 15.5 41.34 57.65 [14.37] NA Buidling Costs: Construction $13,369,444 $14,787,529 $18,026,151 $13,063,557 $27,546,027 $30,911,101 $43,002,972 $481,439,090 Architectural/Engineering $810,779 $1,186,980 $1,040,229 $957,713 $1,323,037 NA $2,517,123 included Furniture/Fixtures/Equipment $291,491 $290,010 $385,870 $279,083 $884,097 NA $1,530,492 NA Computers $362,212 $404,060 $681,379 $334,477 $960,361 NA $782,463 NA Library Collection $106,224 $114,119 $103,118 $137,980 $88,604 NA $119,630 NA
Total Building Cost: $14,940,150 $16,782,698 $20,236,747 $14,772,810 $30,802,126 $30,911,101 $47,952,680 NA
Land Cost $525,000 Donated by Circle
C Land L.P. Joint Land Use
with City of Austin
Donated by Chateau Comity at Bluff Springs, L.P. $599,900 $945,831 $10,063,816 NA
Total School Cost $15,465,150 $16,782,698 $20,236,747 $14,772,810 $31,402,026 $31,856,932 $58,016,496 NA NA = Not Available 1) All costs are nominal dollars at time of construction. Cost information for elementary and middle schools provided by AISD on May 28, 2009 in response to a public information request. 2) Cost information for Akins High School provided by AISD on July 10, 2009 in response to public information request. Complete cost data for design and furnishings was not available. 3) Cost data for Conrad HS in Dallas was provided by the Dallas ISD in letters dated July 16, 2009 and August 10, 2009 in response to a public information request. Additional information from Dallas ISD web site: http://www.dallasisd.org/bond/schools/conrad.html. Figure for land area provided by Dallas ISD does not appear to reflect all acreage of school site and does not include adjoining park land used by school. 4) Data provided by The Council of Educational Facility Planners International on 7/21/09 and dated 8/14/08. Costs were adjusted by CEFPI to estimate 2009 values. 5) Completion dates are from the AISD web site: http://www.austinisd.org/inside/2004bond/bond.phtml?opt=schoolNames 6) Student capacity of schools as originally built. Information provided by AISD on June 24, 2009 in response to public information request. 7) Land area for schools provided by AISD on July 10, 2009 in response to public information request. Data for Perez ES was revised in correspondence from AISD on July 27, 2009.
Cost of Infrastructure to Serve New Residential Development in Austin Fodor & Associates LLC January 2011 Page 23
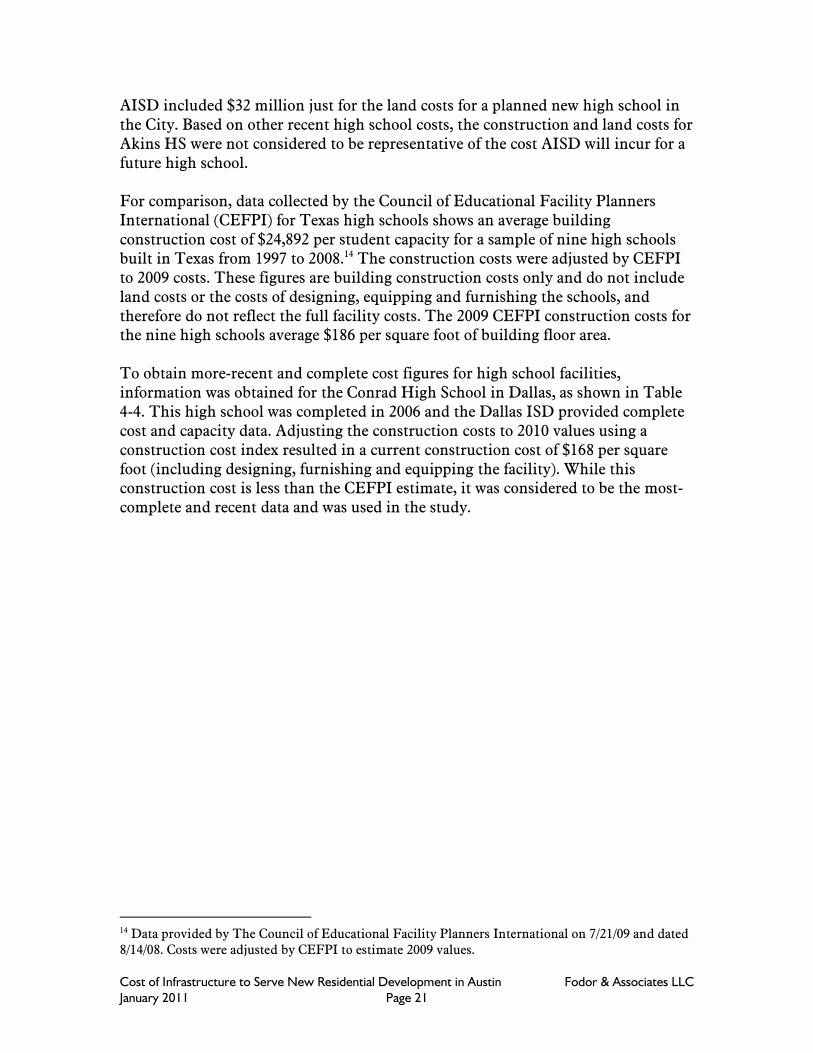
Land costs vary widely around the City. To obtain an average value for vacant land, data were obtained from the Travis Central Appraisal District (TCAD). As shown in Table 4-5, land values for schools are based on average assessed market values for vacant land in the “agricultural” and “non-qualified” land categories (tax codes D1 and D2). Vacant land values in tax code “C” (vacant lots) were not included, since TCAD had no data on total acreage in this category. Vacant lots are likely to have a higher value on a per-acre basis than agricultural and non-qualified land. Therefore the land cost of $30,991 per acre used here for schools is likely to be lower than the actual average for vacant land. For example, the Leander ISD northwest of Austin paid $198,000 per acre for 126 acres of land purchased for two schools in 2006.15 As another example, the 92 acres of land for planned Wastewater Treatment Plant #4 were purchased at a cost of $348,000 per acre.16
Table 4-5
Assessed Values for Vacant Land in Austin, 2009
Code Categories Market Value Acres Value per Acre
D1 Qualified Ag Land $212,074,525 7,550.11 $28,089 D2 Non-Qualified Land $220,329,501 6,402.46 $34,413
Total Vacant Land $432,404,026 13,952.57 $30,991
Source: 2009 Preliminary Totals, City of Austin, by Travis County on 6/30/09.
The land area requirements for new schools are based on the actual land areas for each level of the Austin schools shown previously in Table 4-4. Land costs for new schools are based on the land area required for each level multiplied by the average vacant land value per acre in Table 4-5. School construction costs have increased significantly in the past few years, as shown in Figure 4-2 for schools in Houston. To obtain current cost estimates, all construction costs were adjusted to 2010 costs based on the ENR Construction Cost Index for the nearest city (Dallas).
15 Source: Real property appraisal report dated December 28, 2007 by Paul Hornsby & Company ordered by the City of Austin for the purchase of land as the future site of Water Treatment Plant #4 and obtained through open records. 16 Based on a response to a Public Information Request by the Austin Water Utility, September 24, 2009.

Cost of Infrastructure to Serve New Residential Development in Austin Fodor & Associates LLC January 2011 Page 24
Figure 4-2: School facility costs in Houston (from School Construction Cost Outlook, Fall 2008 and Projection for Spring 2009, by Council of Educational
Facility Planners).
Total school facility costs are obtained by adding the current construction costs with the average land values. The total cost for each level of school facility is shown in Table 4-6 on a per-student-capacity basis. To obtain a cost per housing unit, the per-student cost at each level is multiplied by the students generated by a typical new housing unit. The final cost of providing the school facilities for new residential development in Austin is estimated to be $9,270 per new housing unit.
Table 4-6
School Costs Per New Housing Unit in Austin, 2010
School Level
2010 Building Cost Per Student
Capacity1
Land Area Per
Student
Land Cost per Student Capacity2
Total Facility Cost Per Student
AISD Students
Generated Per New
Housing Unit3
School Cost Per
New Housing
Unit
Elementary School $24,340 0.020 $615 $24,955 0.19 $4,719 Middle School $31,848 0.038 $1,165 $33,013 0.07 $2,181 High School4 $27,781 0.026 $803 $28,584 0.08 $2,425
All Levels
0.34 $9,325 1) School building costs were adjusted to 2010 values using the ENR Construction Cost Index for the closest city (Dallas). Original construction costs were assumed to be established at the start of construction, approximately one year before completion. 2) Based on average 2009 assessed market value of vacant land in Austin of $30,991 per acre. This figure includes only land categories D1 and D2. Data for category C (vacant lots) was not available from TCAD. Category C land values are likely much higher per acre. 3) From Table 4-3. 4) Due to limited recent local data, high school building costs may be low. High school construction costs typically exceed elementary and middle schools on a per-student capacity basis due to increased space and facility requirements.

Cost of Infrastructure to Serve New Residential Development in Austin Fodor & Associates LLC January 2011 Page 25
Funding for New Schools School system costs fit into two basic categories: operations and maintenance; and capital facilities. This study is focused on the costs associated with capital facilities. However, funding for both is addressed briefly here. School operations and maintenance (O&M) are funded primarily through property taxes. These property taxes are based on a fixed annual level that is limited by the State of Texas. Some of the property tax funds collected by the school district are sent to the state and the state distributes the money back to school district based on the number of students enrolled. O&M costs are funded on a pay-as-you-go system where the expenditures match revenues on an annual basis. Financing via bonds is generally not used to fund O&M costs because it would require taxpayers to continue paying off bonds long after the services have been provide and would place an unfair burden on future taxpayers to fund past services. Because school O&M costs are funded with a fixed property tax rate, each new house will increase revenues to the school district. In this manner, new growth tends to pay its own way for school O&M. New and expanded capital facilities are funded exclusively through long-term general obligation bonds of 20 or 25 years in duration that are repaid through property tax revenues. This financing method is reasonable because the life of school facilities is longer than the bond period, so the taxpayers will continue receiving the benefits of the facilities throughout the repayment period. These bonds are essentially city-wide loans taken out by the school district with guaranteed repayment by all of the City’s property tax payers. The school district makes regular payments of interest and principal on the bonds until they are paid off. Taxpayers agree to take on these payments through higher property taxes when they vote to approve a school bond issue.
Cost of Infrastructure to Serve New Residential Development in Austin Fodor & Associates LLC January 2011 Page 26
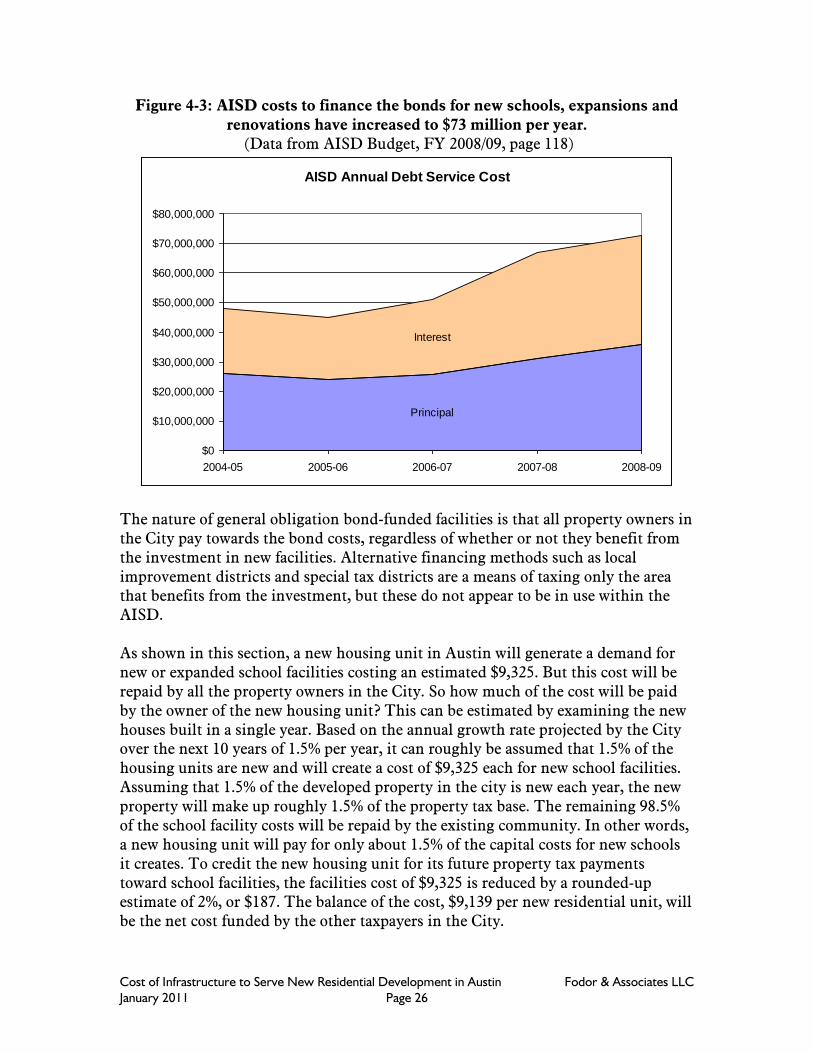
Figure 4-3: AISD costs to finance the bonds for new schools, expansions and renovations have increased to $73 million per year.
(Data from AISD Budget, FY 2008/09, page 118)
The nature of general obligation bond-funded facilities is that all property owners in the City pay towards the bond costs, regardless of whether or not they benefit from the investment in new facilities. Alternative financing methods such as local improvement districts and special tax districts are a means of taxing only the area that benefits from the investment, but these do not appear to be in use within the AISD. As shown in this section, a new housing unit in Austin will generate a demand for new or expanded school facilities costing an estimated $9,325. But this cost will be repaid by all the property owners in the City. So how much of the cost will be paid by the owner of the new housing unit? This can be estimated by examining the new houses built in a single year. Based on the annual growth rate projected by the City over the next 10 years of 1.5% per year, it can roughly be assumed that 1.5% of the housing units are new and will create a cost of $9,325 each for new school facilities. Assuming that 1.5% of the developed property in the city is new each year, the new property will make up roughly 1.5% of the property tax base. The remaining 98.5% of the school facility costs will be repaid by the existing community. In other words, a new housing unit will pay for only about 1.5% of the capital costs for new schools it creates. To credit the new housing unit for its future property tax payments toward school facilities, the facilities cost of $9,325 is reduced by a rounded-up estimate of 2%, or $187. The balance of the cost, $9,139 per new residential unit, will be the net cost funded by the other taxpayers in the City.
AISD Annual Debt Service Cost
Principal
Interest
$0
$10,000,000
$20,000,000
$30,000,000
$40,000,000
$50,000,000
$60,000,000
$70,000,000
$80,000,000
2004-05 2005-06 2006-07 2007-08 2008-09
Cost of Infrastructure to Serve New Residential Development in Austin Fodor & Associates LLC January 2011 Page 27
5. Road System Costs This section examines the roadway expansion costs incurred by the City of Austin to accommodate new residential development. Local roadways that are funded by other government entities (i.e., state and federal) are not included. Transit, pedestrian and bicycle improvements are also not included, so that the focus is exclusively roadways. Road costs included here are limited to those capital expenditures for increasing system capacity and do not include operations or maintenance. Future road system costs can be evaluated based on a long-range planning estimate. This method has the advantage of a longer time period that averages variations in spending that are likely to occur from year to year. These long-range plans benefit from the experience of local planners. They use relatively recent cost figures and take local revenue sources into account. However, planning estimates also rely on the ability of planners to accurately predict future needs and estimate future costs. The Capital Area Metropolitan Planning Organization (CAMPO) is the Metropolitan Planning Organization (MPO) for the Williamson, Travis and Hays Counties in central Texas. CAMPO is the main transportation planning organization for the greater Austin area. The CAMPO Mobility 2030 Plan (2030 Plan), adopted by the Transportation Policy Board on June 6, 2005, is a planning guide that contains transportation policies, projects, programs and action items for the next 25 years (to 2030).17 The 2030 Plan includes programs and policies for congestion management, transit, bicycle and pedestrian facilities, roadways, freight and financing strategies. This long-range metropolitan transportation plan is revised every five years. The 2030 Plan is a financially constrained plan in which planned expenditures must be matched with anticipated revenues. According to the Plan, “the projects and programs will not meet the full extent of future transportation need that has been identified through the planning process.”18 In other words, the projects proposed under the 2030 Plan are not sufficient to maintain the current level of service of the transportation system. This is evident in the “System Performance” section of the Plan. As shown in Table 5-1, system performance will decline by 2030, even if all planned projects are constructed. The implication of declining system performance is that there are other significant growth costs related to increased congestion, delays and loss of mobility that are not included in the dollar figures for transportation improvements.
17 The currently adopted Mobility 2030 Plan is scheduled to be replaced in June, 2010 with a new plan to be titled, People, Planning and Preparing for the Future: Your 25 Year Transportation Plan. 18 CAMPO Mobility 2030 Plan, page 203.

Cost of Infrastructure to Serve New Residential Development in Austin Fodor & Associates LLC January 2011 Page 28
Table 5-1
Transportation System Performance (from CAMPO Mobility 2030 Plan, June, 2005)
Performance Parameter 2000 20301
Percent Change 2000 to 2030
Total vehicle lane miles 7,347 12,719 73% Percent of roadways experiencing congestion2 10% 23% 130% Texas Congestion Index3 1.22 1.32 8% Total motor vehicle hours of delay per year 58,462 419,647 618% Average network travel speed (mph) 36.1 31.2 -14% 1) Data for 2030 is based on completion of the financially-constrained project list adopted with the Plan. 2) Congestion is defined as the percentage of roadways that experience a volume-to-capacity ratio of greater than or equal to 1 over a 24-hour period." 3) The Texas Congestion Index is defined as the ratio of peak period traffic speed to free-flow speeds in the region.
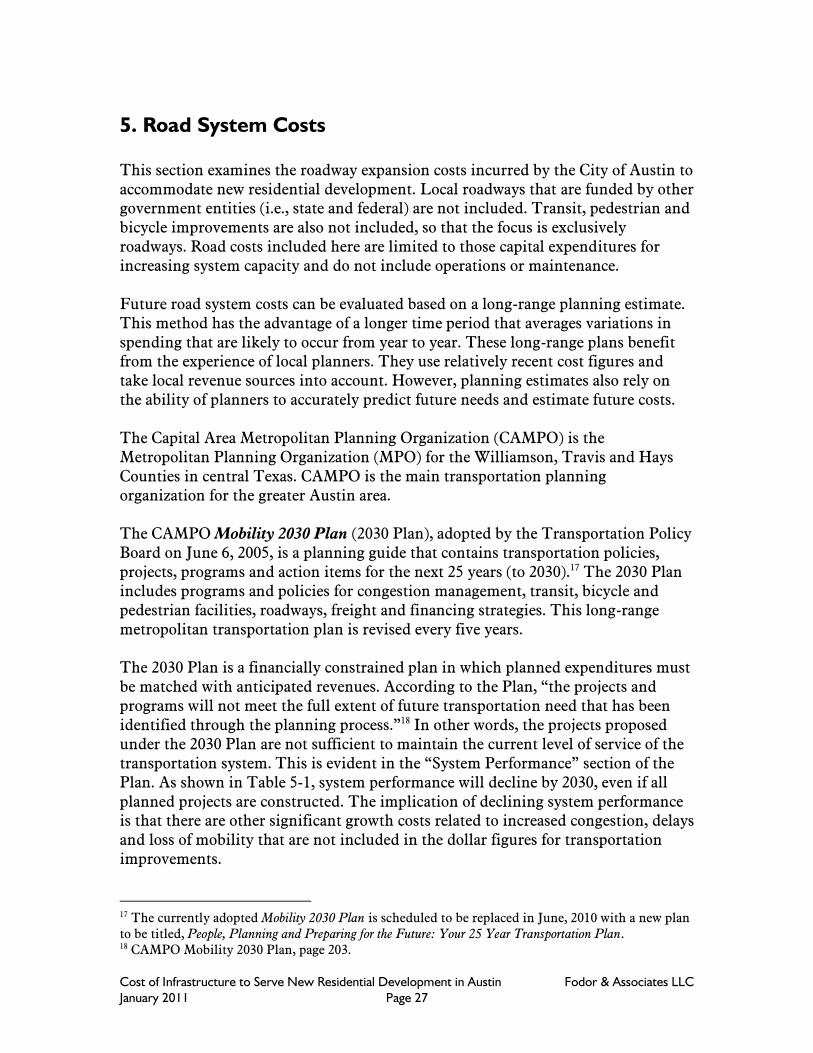
The 2030 Plan’s Project List contains planning estimates for the costs of all projects envisioned by the plan for the 25-year period from 2005 to 2030. The planning estimates for road costs are based on a simple $1,000,000 per lane-mile cost formula. This cost is for the year 2003 and all CAMPO costs are in 2003 dollars. The costs for planning studies and corridor studies were not included in the CAMPO figures. As shown in Figure 5-1, regional roadway construction costs greatly exceed roadway operations and maintenance expenses for the three-county CAMPO planning area. According to the 2030 Plan, Austin’s road construction costs for new and expanded capacity will total $496.6 million19 through 2030, while Austin’s operation and maintenance (O&M) costs will total $126.9 million20 over this same period.
19 CAMPO Mobility 2030 Plan, page G-11 20 CAMPO Mobility 2030 Plan, page G-17
Cost of Infrastructure to Serve New Residential Development in Austin Fodor & Associates LLC January 2011 Page 29
Figure 5-1
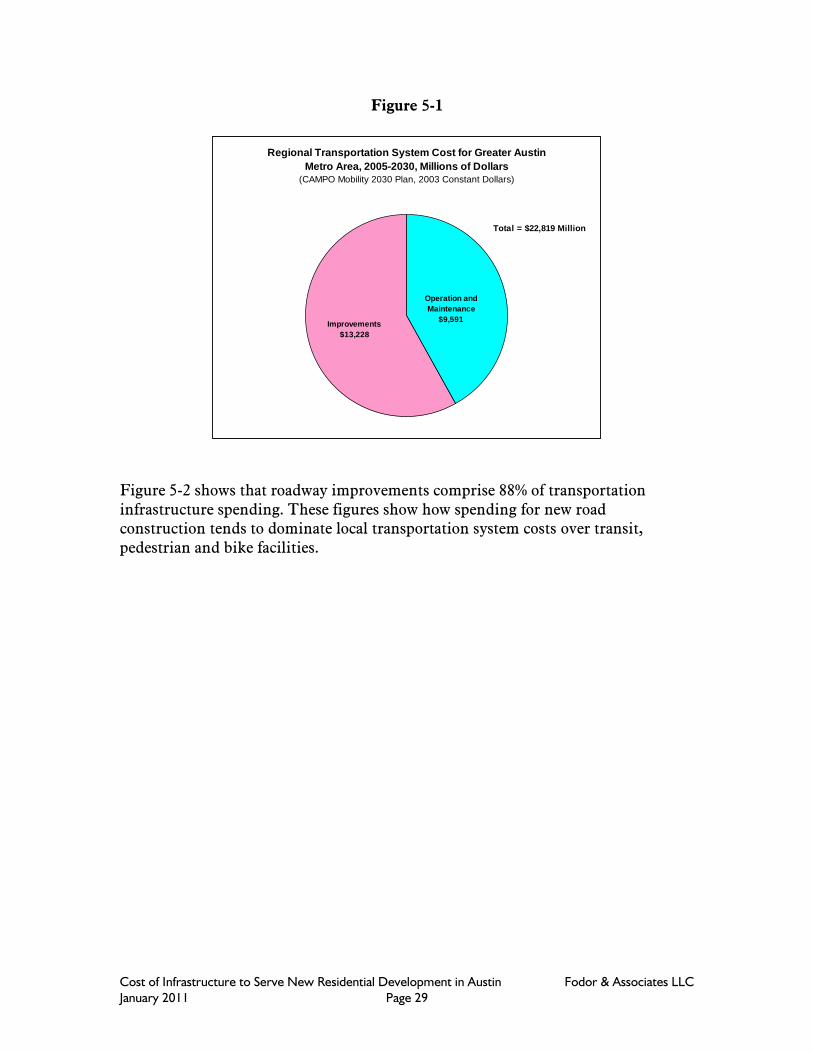
Figure 5-2 shows that roadway improvements comprise 88% of transportation infrastructure spending. These figures show how spending for new road construction tends to dominate local transportation system costs over transit, pedestrian and bike facilities.
Regional Transportation System Cost for Greater Austin
Metro Area, 2005-2030, Millions of Dollars
(CAMPO Mobility 2030 Plan, 2003 Constant Dollars)
Operation and
Maintenance
$9,591Improvements
$13,228
Total = $22,819 Million
Cost of Infrastructure to Serve New Residential Development in Austin Fodor & Associates LLC January 2011 Page 30
Figure 5-2
Figure 5-3 shows the relative government funding share of roadway improvements. Most of the costs for new roads will be paid by the state and only 22% will be funded by local governments. Finally, Figure 5-4 shows that Austin’s share of the three-county regional road expansion costs is relatively small, amounting to $496.6 million at 2003 construction costs. No toll roads are included in the City’s road list.
Capital Improvements for Greater Austin Metro Area
Transportation System, 2005-2030, Millions of Dollars
(CAMPO Mobility 2030 Plan, 2003 Constant Dollars)
Roadway
Capacity/Capital
Improvements
$11,629
Transit Facilities
(bus & rail)
$1,222
Pedestrian, Bicycle
& Other
$377
Total = $13,228 Million

Cost of Infrastructure to Serve New Residential Development in Austin Fodor & Associates LLC January 2011 Page 31
Figure 5-3
Figure 5-4
Roadway Capital Costs for Greater Austin Metro Area, 2005-
2030, Millions of Dollars
(CAMPO Mobility 2030 Plan, 2003 Constant Dollars)
Local Government
Project Costs,
$2,881
State Project Costs
(Tolled), $3,207
State Project Costs
(Non-tolled), $5,541
Total = $11,628 Million
Local Government Roadway Capital Costs for Greater Austin
Metro Area, 2005-2030, Millions of Dollars
(CAMPO Mobility 2030 Plan, 2003 Constant Dollars)
Other Local
Governments
$2,384
City of Austin
$497
Total = $2,881 Million

Cost of Infrastructure to Serve New Residential Development in Austin Fodor & Associates LLC January 2011 Page 32
A summary of the 2030 Plan costs is provided in Table 5-2. The costs from the Plan are given in 2003 dollars. To estimate current costs, a construction cost index was used to adjust values to 2010 levels in the table. The adjusted 2010 value of Austin road projects is $660 million. The last column of Table 5-2 show the share of regional transportation improvement for each roadway category. Note that the City of Austin’s roadway improvement costs represent only 3.8% of the region’s total improvement costs. While Austin may be driving the region’s growth, other jurisdictions are building and paying for most of the new roads.
Table 5-2
Roadway Project Costs for 3-County Austing Metro Area, 2005-2030 CAMPO Mobility 2030 Plan
Roadway Category
2003 Costs (millions of
dollars)
Costs Adjusted to 2010
(millions of dollars)1
Percent of Regional
Transportation Improvements
Regional Costs: Operation and Maintenance $9,591 NA NA Improvements $13,228 $17,585 100.0% Improvements by Category:
Roadway Capacity/Capital Improvements $11,629 $15,459 87.9% Transit Facilities (bus & rail) $1,222 $1,624 9.2% Pedestrian, Bicycle & Other $377 $501 2.9%
$13,228 $17,585 100.0%
Roadway Improvements by Government: State Project Costs (Non-tolled) $5,541 $7,366 41.9%
State Project Costs (Tolled) $3,207 $4,263 24.2% Local Government Project Costs $2,881 $3,830 21.8%
$11,628 $15,458 87.9%
Local Government Costs (Road Imp.): City of Austin $497 $660 3.8%
Other Local Governments $2,384 $3,170 18.0%
$2,881 $3,830 21.8%
1) The ENR Construction Cost Index for Dallas was used to adjust costs from 2003 dollars used in the 2030 Plan to 2010 values. NA = not applicable. The construction cost adjustment does not apply to O&M costs.
The $660 million in roadway projects for the City of Austin represent planned roadway construction costs to expand the capacity of the system to serve new

Cost of Infrastructure to Serve New Residential Development in Austin Fodor & Associates LLC January 2011 Page 33
growth. The increase in Austin’s population over the 2005-2030 planning period is 355,386 people, based on the City’s current projection (see Table 5-3). Using the estimate of 2.6 occupants per new household (developed earlier), this growth equates to 136,687 new housing units.
Table 5-3
Projected Population and Housing Changes in Austin Over 2005-2030 Planning Period1
Metric Value
Population 2005 700,407 Population 2030 1,055,793 Pop Change over planning period 355,386 Housing Units Added 2005-2030(2) 136,687 1) See Appendix for population data and projections used in this study. 2) Based on average of 2.6 occupants per new housing unit, as described earlier in report.
Roadway improvement costs must be distributed between residential and non-residential land uses. On an area basis, residential land use represents approximately 70% of the land area and non-residential represents 30%.21 Allocating road expansion costs to residential uses based on the rough estimate that they will generate 70% of the new travel demand, results in a cost for expanding roads of $3,380 per new housing unit ([$660 million x 0.7]/136,687 new housing units).
Table 5-4
Austin Road Cost Based on CAMPO Planning Estimate
Metric Value
Austin Road Costs, 2005-30 (per CAMPO) $660,000,000 Percent of Roads Serving Residential Uses 70% Residential Road Costs $462,000,000 New Housing Units 2005-2030 136,687 Road Costs per New Housing Unit $3,380
This road cost estimate based on the CAMPO 2030 Plan is likely to be low for several reasons. First, CAMPO’s road costs are based on a planning estimate of $1,000,000 per lane mile for road construction. Even for 2003 construction costs, this
21 Cost allocated based on 70/30 residential/non-residential land use split from SH 130 Infrastructure District Report, City of Austin, January 26, 2006, page 1-6.

Cost of Infrastructure to Serve New Residential Development in Austin Fodor & Associates LLC January 2011 Page 34
estimate is at the low end of road cost estimates. Other sources indicate that current road construction costs may be two to four times higher.22 Second, no value is included for the existing roadway system capacity (excess capacity) that will be consumed by new development. And third, the roads included in the CAMPO Project List are not adequate to maintain the current levels of service (as shown previously in Table 5-1). The result of planning inadequate road infrastructure is that the cost of unbuilt roadways will be transferred to the road users, who will pay through increasing congestion and delays. Alternative Road Costing Method An alternative level-of-service method for estimating road system costs can be used as a comparison to the planning estimate calculated above. The level-of-service (LOS) method assumes that LOS is either maintained at the current level or not allowed to fall below an adopted standard. The first step is to establish the level of service that will be applied to future development. The City of Austin appears to have a minimum LOS standard of “D” or better.23 This is based on a standard grade scale ranking transportation facilities from A to E, with A being free-flowing traffic, and E being extremely congested. The average daily vehicle trips (ADT) that can be accommodated on a roadway depend on the number of lanes, roadway width and posted speed. The City does not provide any specific ADT guidelines for local roadways to achieve LOS D. For the purposes of this study it is assumed that 5,000 ADT per lane is the maximum under LOS D.24 This would mean that a 4-lane roadway could accommodate up to 20,000 ADT without exceeding the standard. According to the CAMPO 2030 Plan, average daily vehicle miles traveled (VMT) per capita was 26.4 in 2000.25 The projected increase in the population of the City from 2005 to 2030 is 355,386 people. This will result in an increase in total daily VMT of 9,382,184 miles over this planning period. Based on maintaining the LOS D standard with a maximum of 5,000 ADT per lane, this additional travel demand will require 1,876 new lane miles of roadway (9,382,184/5,000).
22 State models for estimating new road costs based on the Federal Highway Administration's Highway Economic Requirements System for Florida and Oregon show lane-mile costs on level terrain in the $2 million to $4 million range. Costs can be much higher in urban areas and hilly terrain. 23 According to the City of Austin’s Transportation Criteria Manual, Section 2.3.4 Capacity Analysis and Traffic Impact Assessment, “Level of Service D shall be the minimum acceptable standard.” This applies to traffic studies for new development and is not a true city-wide performance standard. 24 While no City vehicle volume standard for roadways could be identified, The Code Of The City Of Austin, Title 25, Land Development, § 25-6-116 Desirable Operating Levels for Certain Streets, states the desirable traffic levels on collector street of 40 feet or greater in width is under 4,000 vehicles per day (2,000 in each direction). 25 See CAMPO Mobility 2030 Plan, page 33, Table 3.

Cost of Infrastructure to Serve New Residential Development in Austin Fodor & Associates LLC January 2011 Page 35
Using CAMPO’s 2003 planning cost estimate of $1,000,000 per new lane mile (adjusted to 2010 values), the total cost for new roadways over the 25-year planning period is $2.5 billion.26 Assuming that 70% of future travel demand is generated by new housing, the cost per new housing unit is $12,775 (Table 5-5).
Table 5-5
Austin Road Cost Estimate Based on Level of Service
Metric Value
CAMPO Lane-Mile Cost Adjusted to 2010$ $1,329,356 New Lane Miles Needed in Austin to Maintain LOS D 1,876 Total Cost for New Roads (2005-2030) $2,494,452,648 Roads Serving Residential Land Uses1 70% Residential Road Costs $1,746,117,231 New Housing Units 2005-2030 136,687 Road Costs per New Housing Unit $12,775 1) Based on 70/30 residential/non-residential land use split from SH 130 Infrastructure District Report, City of Austin, January 26, 2006, page 1-6.
As shown in Table 5-6, this LOS-based estimate is almost five times greater than the figure based on CAMPO’s 2030 Plan Project List. Some of this difference can be explained by the fact that the LOS-based cost estimate is based on the predicted total increase in travel demand generated within Austin. It includes all road costs necessary to meet this demand and does not assume further degradation of transportation system performance. The LOS-based estimate does not distinguish which government entity is funding the improvements (city, county, or state). Whereas the planning estimate includes only the local road costs that will be funded by the City. This study uses the lower cost figure of $3,380 per new housing unit in the final tally of costs because this figure is supported by the available city and regional transportation planning documents and reflects only the City’s roadway costs. However, this cost appears to be low for a large city like Austin.27
26 Calculation: 1,876 new lane miles x $1,329,356 per lane-mile construction cost (2010$). 27 This study is intended to report the full cost of infrastructure. Nationally, average impact fees for roads are $3,227 per single-family dwelling unit (National Impact Fee Survey 2010, by Duncan Associates), and impact fees typically recover only a portion of the full cost.

Cost of Infrastructure to Serve New Residential Development in Austin Fodor & Associates LLC January 2011 Page 36
Table 5-6
Roadway Facility Costs Based on Two Estimation Methods
Method1 Cost per New Housing Unit
Planning Estimate (Mobility 2030 Plan) $3,380 Level-of-Service-Based Estimate $12,775 1) Both methods are based on the 2003 roadway costs of $1 million per lane-mile of new roadway used by CAMPO in the Mobility 2030 Plan adjusted to 2010 values using the ENR Construction Cost Index.
Road Funding Current transportation system revenues are not adequate to fund the projects called for in the 2030 Plan.28 One possible new revenue source to pay for future road projects proposed in the 2030 Plan is to “assess transportation impact fees through system development charges and other mechanisms.” A roads impact fee is authorized by state statutes, but Austin does not collect any fees. The Plan also assumes that a new 3.5 cent local option gas tax increase will be implemented to help fund the plan. According to the 2030 Plan, Austin will fund its road projects primarily through bonds that will be repaid through future sales tax revenues. A small portion will also be funded through the City’s general fund, which is supported largely by property taxes. In this manner, broad-based tax revenues will be used to pay for new roads needed to serve new development. As with school facility costs, new development will pay for only a small fraction of road costs needed to serve it. According to City Code, the City may require developers to contribute towards the cost of new roads that directly serve their developments, but the City is not required to do so.29 It is not clear how much of future roadway costs will be addressed in this manner. There is no formal policy requiring developer payments, and no record was available from the City of what portion of new road costs are paid in this manner. For the purposes of this study it is assumed that developers may pay some portion of new road costs, but there is no basis for estimating this contribution.
28 CAMPO recently reported that 27% less funding will be available for transportation projects than estimated in the 2030 Plan. See Austin American-Statesman article “Planner see dip in money for roads,” of 9/15/09. 29 See The Code Of The City Of Austin, Title 25, Land Development, § 25-6-55 Dedication of Right-of-Way.

Cost of Infrastructure to Serve New Residential Development in Austin Fodor & Associates LLC January 2011 Page 37
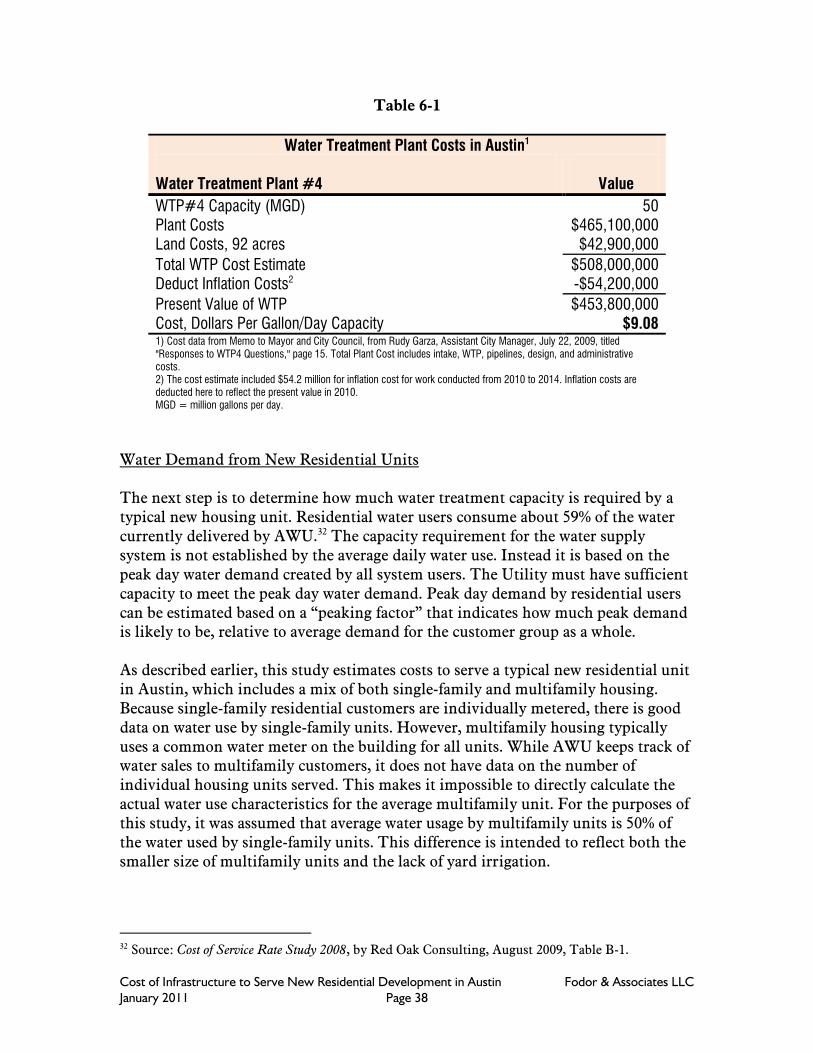
6. Water System Costs Water and sewerage in Austin are provided by Austin Water Utility. Austin Water Utility (AWU) maintains and operates two water treatment plants totaling 285 million gallons per day (MGD) of treatment capacity to meet the potable water needs of the city. AWU’s service area is 537 square miles and is larger than the Austin City Limits (285 sq. mi.) and includes all of City and some of the Extraterritorial Jurisdiction outside the City Limits. There are 3,500 miles of water mains, 16 pumping stations, and 18 major reservoirs (storage tanks) to deliver water to AWU’s service area.30 Water system costs include both the cost of the water treatment plant and the cost of the water distribution system (mains, pumping stations, and reservoirs). Water Treatment Plant Costs AWU is planning to add a third water treatment plant (WTP) to the system, which is being called “WTP #4” (the third plant was decommissioned in 2008). WTP #4 will have an initial capacity of 50 MGD by 2014, but could be expanded to an ultimate capacity of 300 MGD in the future. The costs for WTP #4 are used here to estimate the water system costs associated with new residential development. As shown in Table 6-1, the estimated costs for WTP #4 total $508 million, including land and construction costs (water intake, WTP, pipelines, design, and administrative costs). This cost estimate includes $54.2 million in inflation costs to account for likely construction cost increases from 2010 to 2014.31 To obtain a present value for the plant, the $54.2 million is deducted from the total, resulting in a present value of $453.8 million. Dividing this present value by the 50 million gallons per day capacity, results in a unit cost of $9.08 per gallon/day of water treatment capacity.
30 Austin Water Utility Cost of Service Rate Study 2008, Report Vol. II, Red Oak Consulting, August 2009, page C-36, and 37. 31 The WTP#4 cost breakdown showing inflation costs is from the response to a Public Information Request by Austin Water Utility, City of Austin, Texas, 9/24/09.
Cost of Infrastructure to Serve New Residential Development in Austin Fodor & Associates LLC January 2011 Page 38
Table 6-1
Water Treatment Plant Costs in Austin1 Water Treatment Plant #4 Value
WTP#4 Capacity (MGD) 50 Plant Costs $465,100,000 Land Costs, 92 acres $42,900,000
Total WTP Cost Estimate $508,000,000 Deduct Inflation Costs2 -$54,200,000
Present Value of WTP $453,800,000 Cost, Dollars Per Gallon/Day Capacity $9.08 1) Cost data from Memo to Mayor and City Council, from Rudy Garza, Assistant City Manager, July 22, 2009, titled "Responses to WTP4 Questions," page 15. Total Plant Cost includes intake, WTP, pipelines, design, and administrative costs. 2) The cost estimate included $54.2 million for inflation cost for work conducted from 2010 to 2014. Inflation costs are deducted here to reflect the present value in 2010. MGD = million gallons per day.
Water Demand from New Residential Units The next step is to determine how much water treatment capacity is required by a typical new housing unit. Residential water users consume about 59% of the water currently delivered by AWU.32 The capacity requirement for the water supply system is not established by the average daily water use. Instead it is based on the peak day water demand created by all system users. The Utility must have sufficient capacity to meet the peak day water demand. Peak day demand by residential users can be estimated based on a “peaking factor” that indicates how much peak demand is likely to be, relative to average demand for the customer group as a whole. As described earlier, this study estimates costs to serve a typical new residential unit in Austin, which includes a mix of both single-family and multifamily housing. Because single-family residential customers are individually metered, there is good data on water use by single-family units. However, multifamily housing typically uses a common water meter on the building for all units. While AWU keeps track of water sales to multifamily customers, it does not have data on the number of individual housing units served. This makes it impossible to directly calculate the actual water use characteristics for the average multifamily unit. For the purposes of this study, it was assumed that average water usage by multifamily units is 50% of the water used by single-family units. This difference is intended to reflect both the smaller size of multifamily units and the lack of yard irrigation.
32 Source: Cost of Service Rate Study 2008, by Red Oak Consulting, August 2009, Table B-1.

Cost of Infrastructure to Serve New Residential Development in Austin Fodor & Associates LLC January 2011 Page 39
Various City studies were consulted to determine the appropriate water use and peaking factor to use in calculating peak day demand. According to data in the 2008 Cost of Services Rate Study, the average demand for existing single-family residential customers is calculated in Table 6 to be 275 gallons per day (gpd).33 This study reports that the peaking factor is 1.66 for single-family residential. The peak demand is therefore 457 gpd per single-family residential unit (1.66 x 275), as shown in Table 6-2. While this figure represents an average peak demand for existing AWU customers, new single-family residential units will tend to be larger and have correspondingly higher water demands.
Table 6-2
Existing Residential Water Demand (Based on 2008 Cost of Service Rate Study)
Metric Single-Family Residential
Number of Accounts1 185,620 Water Sales (kgal/year)1 18,637,701 Average Daily Water Use per Account or Unit, gpd 275 Peaking Factor (max day)2 1.66 Peak Day Demand per Unit, gpd3 457 (1) Cost of Service Rate Study 2008, by Red Oak Consulting, August 2009, Table B-1. Note that the 3% water loss reported by AWU was not include here on the assumption that new water services would have fewer losses. (2) Cost of Service Rate Study 2008, Table B-13, page B-14. (3) Peak day demand = average daily use x peaking factor. Notes: kgal = 1000 gallons; gpd = gallons per day.
The AWU 2007 Impact Fee Reports provides a second source of information on water demand. System-wide average water use per service unit is reported to be 445 gpd.34 A “service unit” is equivalent to a 5/8-inch meter service, which is the smallest available meter size and is standard for a typical single-family house. A residential peaking factor of 1.7 is used in this report for calculating water treatment capacity, resulting in a peak demand of 756 gpd per single-family residential unit. This is the figure AWU applies to new residential units when calculating the water system impact fee. A third source of information on water demand is the City of Austin’s Utilities Criteria Manual.35 This manual specifies that the peak day water demand for estimating system capacity for residential users is 530 gpd/person. The “living unit equivalent” or LUE is the AWU equivalent of a new single family dwelling for
33 Cost of Service Rate Study 2008, Table B-13, page B-14 34 2007 Impact Fee Reports, AWU, page LUA-7 35 Utilities Criteria Manual, City of Austin, Texas, Section 2.9.2, Water Systems, Updated February 2010.
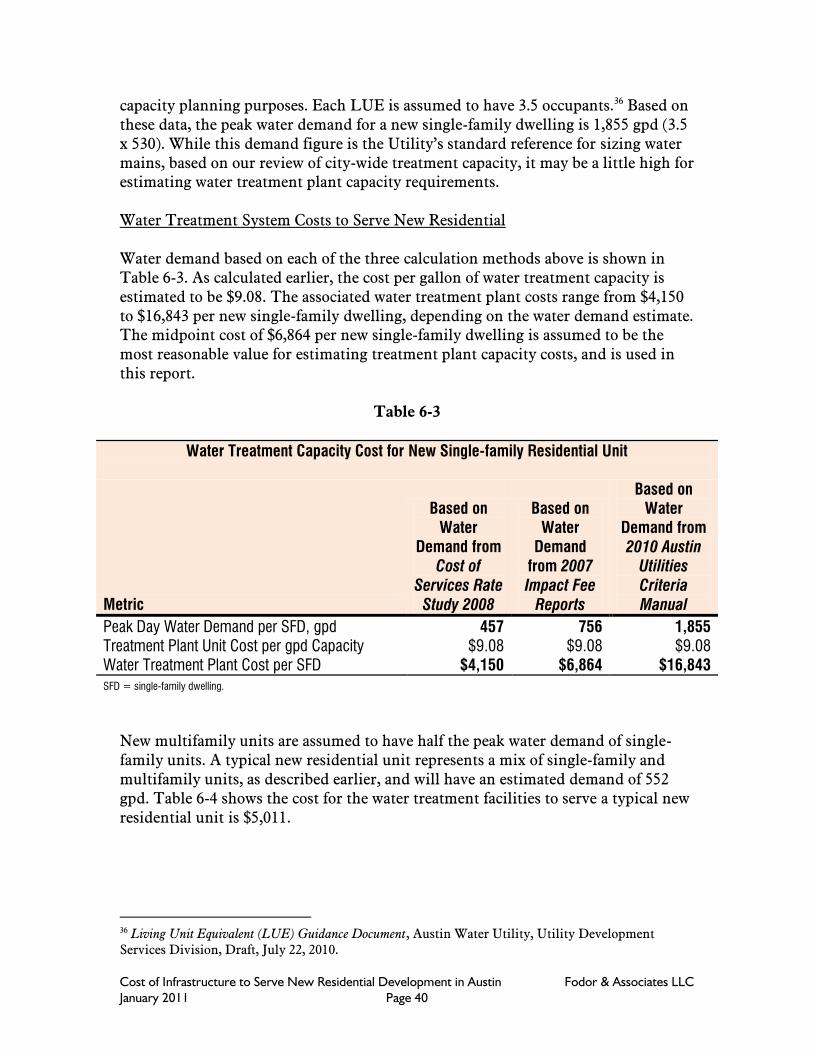
Cost of Infrastructure to Serve New Residential Development in Austin Fodor & Associates LLC January 2011 Page 40
capacity planning purposes. Each LUE is assumed to have 3.5 occupants.36 Based on these data, the peak water demand for a new single-family dwelling is 1,855 gpd (3.5 x 530). While this demand figure is the Utility’s standard reference for sizing water mains, based on our review of city-wide treatment capacity, it may be a little high for estimating water treatment plant capacity requirements. Water Treatment System Costs to Serve New Residential Water demand based on each of the three calculation methods above is shown in Table 6-3. As calculated earlier, the cost per gallon of water treatment capacity is estimated to be $9.08. The associated water treatment plant costs range from $4,150 to $16,843 per new single-family dwelling, depending on the water demand estimate. The midpoint cost of $6,864 per new single-family dwelling is assumed to be the most reasonable value for estimating treatment plant capacity costs, and is used in this report.
Table 6-3
Water Treatment Capacity Cost for New Single-family Residential Unit
Metric
Based on Water
Demand from Cost of
Services Rate Study 2008
Based on Water
Demand from 2007 Impact Fee
Reports
Based on Water
Demand from 2010 Austin
Utilities Criteria Manual
Peak Day Water Demand per SFD, gpd 457 756 1,855 Treatment Plant Unit Cost per gpd Capacity $9.08 $9.08 $9.08 Water Treatment Plant Cost per SFD $4,150 $6,864 $16,843 SFD = single-family dwelling.
New multifamily units are assumed to have half the peak water demand of single-family units. A typical new residential unit represents a mix of single-family and multifamily units, as described earlier, and will have an estimated demand of 552 gpd. Table 6-4 shows the cost for the water treatment facilities to serve a typical new residential unit is $5,011.
36 Living Unit Equivalent (LUE) Guidance Document, Austin Water Utility, Utility Development Services Division, Draft, July 22, 2010.

Cost of Infrastructure to Serve New Residential Development in Austin Fodor & Associates LLC January 2011 Page 41
Table 6-4
Water Treatment System Costs to Serve New Residential Development in Austin1
Housing Category
Peak Day Demand per
Unit, gpd WTP Cost in $/gpd
Cost per New Housing Unit
New Single Family Unit 756 $9.08 $6,864 New Multifamily Unit 378 $9.08 $3,432 Typical New Residential Unit (SF & MF)2 552 $9.08 $5,011 1) Costs are for water treatment facilities only. Water distribution system costs are not included in this table. 2) Weighted average based on expected mix of new housing types
Water Distribution System Costs Water distribution system costs include the water transmission mains, pumping stations and water reservoirs required to deliver water from the treatment plant to the end users. Recent data on water distribution system costs are available from a study of the water and wastewater system costs for serving Austin’s South I-35 Program area. The South I-35 Water/Wastewater Program represents the City of Austin’s plan to provide water and wastewater service to a large 15,740-acre undeveloped area Southeast of the City. As such, it provided a unique opportunity to examine growth-related costs to serve future development in Austin. The 2010 study, Review of Austin’s South I-35 Water & Wastewater Program Costs by Fodor & Associates,37 evaluated all current and future costs for the water distribution system to serve the equivalent of 45,489 single-family dwellings that are planned for the area at full buildout. Past costs for offsite water distribution mains that will serve the area are significant, but could not be included because there was no reasonable way to estimate and allocate the costs. As shown in Table 6-5, the water distribution system costs required to fully serve this area total approximately $103 million. For the equivalent of 45,489 single-family dwellings planned for this area, the cost per dwelling is $2,260 (Table 6-6).
37 Review of Austin’s South I-35 Water & Wastewater Program Costs, by Fodor & Associates LLC, November 2010, Table 13. See http://www.fodorandassociates.com/Reports/Austin_Water-Wastewater_Cost_Study-2010.pdf

Cost of Infrastructure to Serve New Residential Development in Austin Fodor & Associates LLC January 2011 Page 42
Table 6-5
Water Distribution System Costs South I-35 Water-Wastewater Program Area1
(Costs include: Construction, land, design and engineering costs.)
Category
Present Value of
Costs (2010)
Phase 1 Local Water Distribution System: Water Transmission Mains $37,886,871
Pilot Knob Pump Station, 20 MGD $8,695,295
Proposed Elevated Water Reservoir #1 $5,636,000 Future Water Mains Required to Serve South I-35 Program Area $43,733,812 Offsite Upstream Water Main Capacity Costs2 Unknown Cost of Future W/WW SER reimbursements by AWU2 Unknown Other Costs (land, const. mgmt., admin.)3 $6,867,898
Total Water Distribution System Costs $102,819,876 1) Source: Review of Austin’s South I-35 Water & Wastewater Program Costs, by Fodor & Associates LLC, September 2010, Tables 1 and 4. 2) These costs are unknown. The value of offsite capacity in existing water mains to serve area could not be determined. Costs for future Service Extension Request (SER) reimbursements by AWU could not be determined. 3) “Other” costs are distributed 50/50 between the water and wastewater system.
Table 6-6
Water Distribution System Cost per New SFD
Total Water Distribution System Costs $102,819,876 Total SFDs in South I-35 Planning Area1 45,489 Cost per New SFD $2,260
1) These are equivalent single-family dwellings (SFDs) for capacity planning purposes.
Assuming that new multifamily units have half the water demand of a new single-family dwelling, the water distribution system cost for multifamily units will be $1,130. The typical new residential unit, representing a mix of SF and MF housing, will cost $1,650, as shown in Table 6-7.

Cost of Infrastructure to Serve New Residential Development in Austin Fodor & Associates LLC January 2011 Page 43
Table 6-7
Water Distribution System Costs to Serve New Residential Development in Austin1
Housing Category
Cost per New Housing Unit
New Single-family Unit $2,260 New Multifamily Unit $1,130 Typical New Residential Unit (SF & MF)2 $1,650 1) Costs are for water distribution facilities only. Water treatment system costs are not included in this table. 2) Weighted average based on expected mix of new housing types
Total Water System Costs To reflect the costs for a typical new residential unit, the costs are based on the expected mix of single-family and multifamily units. Water treatment plant and distribution system costs are combined in Table 6-8. The total water system cost per new residential unit is $6,661. This figure does not include any of the interest or financing costs associated with the infrastructure.
Table 6-8
Total Water System Costs
System Cost Category New Single-family Unit
New Multifamily
Unit
New Typical Residential
Unit1
Water Treatment Plant Capacity $6,864 $3,432 $5,011 Distribution System Costs $2,260 $1,130 $1,650
Total Cost: $9,124 $4,562 $6,661
1) Weighted average based on expected mix of new housing types.
Water Facility Funding New water facilities are funded by water user fees and impact fees on new development. AWU charges a water system impact fee of $1000 per service unit for development inside city limits in the desired development zone. A “service unit” is based on the typical 5/8th-inch water meter commonly used by single-family units. Assuming the average new residential unit is 0.73 service units (for the expected mix of single- and multifamily units), the typical impact fee will be approximately $730,

Cost of Infrastructure to Serve New Residential Development in Austin Fodor & Associates LLC January 2011 Page 44
and is considerably lower than the water system cost of $6,661 calculated here. This impact fee amount is deducted from the total cost in the final cost summary. The balance of costs not recovered through the impact fee will be funded by all AWU ratepayers. For example, in the case of WTP #4, the cost of the new plant is expected to increase water rates to the average residential customer by 12 to 15 percent, or $38.40 to $48.00 per year.38 In this manner, all customers will pay through their water rates to fund new capacity needed to serve future growth.
38 Memo titled “WTP4 City Council Briefing” by Greg Meszaros, Director, Austin Water Utility, July 23, 2009.

Cost of Infrastructure to Serve New Residential Development in Austin Fodor & Associates LLC January 2011 Page 45
7. Wastewater System Costs Wastewater services in Austin are provided by the Austin Water Utility (AWU). The AWU wastewater system includes a collection system with 2,500 miles of sewer mains to collect effluent, pumping (or lift) stations, and two wastewater treatment plants with a combined total treatment capacity of 150 million gallons per day (MGD). AWU’s service boundaries extend beyond the City Limits and include some of the Extraterritorial Jurisdiction. Wastewater system costs include both the wastewater treatment plant and the wastewater collection system (mains that convey sewage to the treatment plant). Wastewater Treatment Plant Costs The City’s two large regional wastewater treatment plants (WWTPs) were recently expanded to increase capacity. As shown in Table 7-1, the combined additions to the two WWTPs were 40 million gallons per day (MGD) capacity. At current construction costs the value of the additions was approximately $187 million, or $4.67 per gallon per day (gpd) of treatment capacity. This estimate may not fully reflect the cost of treatment capacity, as plant expansions may not include the value of the land and may utilize some existing plant equipment. However, it is based on the best available cost data for central treatment facilities in Austin.
Table 7-1
Regional WWTP Expansion Costs1
Facility
Capacity Addition(MGD)2
Year Completed Cost to Build
Adjusted 2010 Cost
2010 Cost per gpd Capacity
Southern Austin Regional WWTP 25 2006 $97,612,000 $111,019,966 $4.44 Walnut Creek WWTP 15 2005 $65,499,000 $75,893,961 $5.06
Combined WWTPs 40
$163,111,000 $186,913,927 $4.67 1) Source: Impact Fee Report: Impact Fee Land Use Assumptions and Impact Fee Capital Improvements Plan, Year 2007 Update, Austin Water Utility, September 10, 2007, Table 13, page CIP-32. 2) MGD = million gallons per day.
Wastewater Demand from New Residential Units The wastewater system is designed to accommodate peak wastewater flows. The peak wastewater flows are based on the planning and engineering documents for the South I-35 Water/Wastewater Program. As described previously under the “Water Distribution System Costs” section, all the water and sewer system costs to serve this

Cost of Infrastructure to Serve New Residential Development in Austin Fodor & Associates LLC January 2011 Page 46
undeveloped 15,740-acre area South of Austin’s City Limits were evaluated in a recent study by Fodor & Associates.39 As shown in Table 7-2, The peak wastewater flow per new single-family dwelling unit is 710 gpd.
Table 7-2
South I-35 Program Area Peak Wastewater Flow at Full Development1
Metric Value
Total Acres in Program Area 15,740 Living Unit Equivalents (LUE) per Acre2 2.89 Total Living Units in Program Area 45,489 Average Daily Flow at 245 gpd/SFD 11,144,707 Peak Flow = Ave flow x peak factor (1.84) 20,506,261 I&I Flow at 750 gpd/acre3 11,805,000 Total Peak Flow, gpd 32,311,261 Peak Flow per SFD, gpd 710 1) Source: Review of Austin’s South I-35 Water & Wastewater Program Costs, by Fodor & Associates LLC, September 2010, Table 9. 2) Living Unit Equivalents (LUEs) are used for planning purposes and are a measure of the typical flow of water used or wastewater produced by a single family dwelling. 3) I&I = inflow and infiltration into wastewater system.
The peak wastewater flow for a new multifamily residential unit is estimated to be 50% of the peak flow from a single-family unit. Table 7-3 shows the peak wastewater flows for each category of residential and calculates the treatment plant capacity costs for each based on a unit cost of $4.67 per gpd of capacity (from Table 7-1).
Table 7-3
Wastewater Treatment System Costs to Serve New Residential Development in Austin1
Housing Category
Peak Day Demand per
Unit, gpd
WWTP Unit Cost,
$/gpd
WWTP Cost per New
Housing Unit
New Single Family Unit 710 $4.67 $3,316 New Multifamily Unit 355 $4.67 $1,658 Typical New Residential Unit (SF & MF)2 518 $4.67 $2,420 1) Costs are for wastewater treatment facilities only. Wastewater collection system costs are not included in this table. 2) Weighted average based on expected mix of new housing types.
39 Review of Austin’s South I-35 Water & Wastewater Program Costs, by Fodor & Associates LLC, September 2010. See http://www.fodorandassociates.com/Reports/Austin_Water-Wastewater_Cost_Study-2010.pdf

Cost of Infrastructure to Serve New Residential Development in Austin Fodor & Associates LLC January 2011 Page 47
Wastewater Collection System Costs The wastewater collection system includes the sewer mains and lift stations required to convey effluent to the treatment plant. Collection system cost figures were obtained from the study of costs to serve the South I-35 Water/Wastewater Program area.40 The wastewater collection system costs total $77 million, as shown in Table 7-4.
Table 7-4
Wastewater Collection System Costs South I-35 Water-Wastewater Program Costs1
(Costs include construction, land, design and engineering costs.)
Category
Present Value of Costs (2010)
Phase 1 Wastewater Interceptors $27,753,984 Zachary Scott WW Interceptor $8,263,816 Future WW Interceptors Required to Serve South I-35 Program Area $33,994,491 Offsite Downstream WW Main Capacity Costs2 Unknown Cost of Future W/WW SER reimbursements by AWU2 Unknown Other Costs (land, const. mgmt., admin.)3 $6,867,898
Total Wastewater Collection System Costs: $76,880,188 1) Source: Review of Austin’s South I-35 Water & Wastewater Program Costs, by Fodor & Associates LLC, November 2010, Tables 1 and 4. 2) These costs are unknown. The value of offsite capacity in existing water mains to serve area could not be determined. Costs for future Service Extension Request (SER) reimbursements by AWU could not be determined. 3) “Other” costs are distributed 50/50 between the water and wastewater system.
Based on serving the equivalent of 45,489 new single-family dwellings in the South I-35 Program area, the cost per SFD is $1,690 (Table 7-5).
Table 7-5
Wastewater Collection System Costs per SFD
Total Wastewater Collection System Costs: $76,880,188 Total SFDs in South I-35 Planning Area1 45,489 Cost per SFD $1,690
1) These are equivalent single-family dwellings (SFDs) for capacity planning purposes.
40 Review of Austin’s South I-35 Water & Wastewater Program Costs, by Fodor & Associates LLC, November 2010.

Cost of Infrastructure to Serve New Residential Development in Austin Fodor & Associates LLC January 2011 Page 48
Based on the assumption that the peak wastewater flow from new multifamily units is half that from a new single-family dwellings, the wastewater collection system costs for each category of housing are shown in Table 7-6.
Table 7-6
Wastewater Collection System Costs to Serve New Residential Development in Austin1
Housing Category Cost per New Housing Unit
New Single Family Unit $1,690 New Multifamily Unit $845 Typical New Residential Unit (SF & MF)2 $1,234 1) Costs are for wastewater collection facilities only. Wastewater treatment system costs are not included in this table. 2) Weighted average based on expected mix of new housing types.
Total Wastewater System Costs The combined cost of the WWTP and the wastewater collection system total $3,654 for a typical new residential unit, as shown in Table 7-7.
Table 7-7
Total Wastewater System Costs
System Cost Category New Single-family Unit
New Multifamily
Unit
New Typical Residential
Unit1
Wastewater Treatment Plant Capacity $3,316 $1,658 $2,420 WW Collection System Costs $1,690 $845 $1,234
Total Cost: $5,006 $2,503 $3,654
1) Weighted average based on expected mix of new housing types.
Wastewater System Funding Wastewater facilities are funded by user charges and impact fees on new development. AWU charges a wastewater system impact fee of $600 per service unit for development inside city limits in the desired development zone. A “service unit” is based on the typical 5/8th-inch water meter commonly used by single-family units.

Cost of Infrastructure to Serve New Residential Development in Austin Fodor & Associates LLC January 2011 Page 49
Assuming the average new residential unit (46% single-family and 54% multifamily) is 0.73 service units, the typical impact fee will be approximately $438. This impact fee amount is deducted from the total cost in the final cost summary. The impact fee is well below the system cost of $3,654 calculated here. The balance of costs will be paid through the service rates to all water/sewer customers.

Cost of Infrastructure to Serve New Residential Development in Austin Fodor & Associates LLC January 2011 Page 50
8. Stormwater System Costs The stormwater system is necessary to manage rainwater runoff from the impervious surfaces resulting from urban development. Impervious surfaces include roads, sidewalks, parking lots, and building roofs. These surfaces amplify stormwater flows. Stormwater management seeks to prevent or minimize flooding, avoid soil erosion and destruction of natural stream channels, and protect ground and surface water quality. Urban development also creates water pollution sources, including vehicle leaks, landscaping chemicals, and soil erosion from construction and runoff that affect water quality. Water quality protection is part of the stormwater management system in most major cities, including Austin. According to the Austin City Code,41 most large new developments are required to have certain stormwater management facilities constructed on site by the developer. These facilities may include drainage conveyance and detention basins. Off-site stormwater flows are addressed by a public system. According to the 2000 Watershed Protection Master Plan, this public system is in need of being upgraded and expanded.42 The Plan identifies $875 million in needed capital facilities to address creek flooding, storm drains, stream bank stabilization and detention ponds. It is not possible to determine how much of this capital cost is for addressing the needs of future development and how much is for fixing existing deficiencies. In order to estimate the cost of providing stormwater facilities for new development, the drainage costs calculated by the City for the proposed SH 130 District were used. Stormwater Costs in SH 130 Infrastructure District Report The SH 130 Infrastructure District Report was issued in 2006 and examined some of the infrastructure costs associated with the development of a proposed new urban district around State Highway 130. Since this area had no existing stormwater infrastructure, the cost estimates for drainage systems reflect those required to serve new development. The total estimated cost for drainage facilities associated with serving development in the district was $114.8 million. Operation and maintenance of the facilities was not included in this cost figure. The drainage projects in the report are based on estimates for building regional stormwater management ponds and nominal channel and low water crossing improvements. Flood control facility costs include the design and construction of regional detention facilities to mitigate flood hazards associated with increased
41 Austin City Code Chapter 25-7 addresses drainage requirements. 42 Watershed Protection Master Plan, Phase 1 Watersheds Report, 2000 (http://www.ci.austin.tx.us/watershed/rptmp14.htm).

Cost of Infrastructure to Serve New Residential Development in Austin Fodor & Associates LLC January 2011 Page 51
stormwater runoff rates from future development. Costs also include the design and construction of nominal channel conveyance/low water roadway crossing improvements to allow increased flows from future development to be safely transported to the regional detention facilities without increase in flood hazard. The projects did not include on-site drainage conveyance or water quality and erosion controls that would be required for each development and no off-site water quality or erosion control facilities were included in the facilities cost estimate. The report assumes that 32% of the land area will become residential, with the remainder being non-residential (commercial and industrial).43 Therefore, for the purposes of this study, it was assumed that 32% of the stormwater costs are attributable to residential development in the district, or $36.7 million, as shown in Table 8-1.
Table 8-1
Stormwater System Costs Based on 2006 SH 130 Infrastructure District Report(1)
Metric Values
SH130 District Stormwater Costs $114,767,171 Percent of Area Residential(2) 32% Stormwater Cost due to Residential $36,725,495 Number of Residential Units(3) 12,671 Cost per Unit (in 2006$) $2,898 1) Report issued January 26, 2006 by City of Austin. 2) Based on goal of the District to achieve a significantly higher percentage of non-residential land uses than has been achieved elsewhere in the City. See SH 130 Infrastructure District Report, page 1-6. 3) Number of residential units derived from assessed values and unit values from table in SH 130 Infrastructure District Report on page 1-6.
Based on the SH 130 Infrastructure District Report, 12,671 residential units are anticipated.44 Dividing the total residential stormwater system costs by the number of residential units yields a cost per unit of $2,898. Since the report was issued in 2006, this cost was adjusted to the 2010 value of $3,296 per residential unit.45
43 Note that this estimate of 32% residential is considerably different from the existing development pattern for Austin which is about 70% residential, as noted in the SH 130 Infrastructure District Report on page 1-6. 44 Numbers of residential units are calculated from the total assessed values and values per unit (see table in SH 130 Infrastructure District Report, page 1-6). 45 Using the ENR Construction Cost Index for Dallas.

Cost of Infrastructure to Serve New Residential Development in Austin Fodor & Associates LLC January 2011 Page 52
Stormwater System Funding The City funds the stormwater system by charging a “Comprehensive Drainage Fee” on its utility bill. This fee is paid by residents and property owners in the City. The City does not charge an impact fee for stormwater, though the State does authorize such a fee. As a result, all residents will pay through their utility bills for the stormwater facilities needed to serve new development.

Cost of Infrastructure to Serve New Residential Development in Austin Fodor & Associates LLC January 2011 Page 53
9. Park and Recreation System Costs The Austin Parks and Recreation Department (PARD) provides and maintains a system of parkland and recreational facilities for the City. According to the Draft Executive Summary of the Long Range Plan for Land, Facilities and Programs, 2010-2015 by the Austin Parks and Recreation Department:
“The City of Austin has over 17,000 acres of parks and preserves consisting of 13 district parks, 12 metropolitan parks, 74 neighborhood parks, 22 school parks, 19 pocket parks, 29 greenways, 5 golf courses, 20 recreation centers, 3 senior activity centers, 4 tennis centers, 50 aquatic facilities, 28 special parks, and 13 nature preserves.”
Austin has a current service standard of 24 acres of parkland per 1000 residents.46 It is unclear that the City will be able to maintain this excellent parkland standard in the future as land becomes more limited and prices increase. However, for the purposes of this study it was assumed that the current level of service would be maintained.
Table 9-1
Inventory of Austin Parks and Land Acreage
Park Type Number of Each Type Acres
Metropolitan Parks 12 8,898.92 Greenbelts 29 4,525.46 Nature Preserves 13 1,063.91 Golf Courses 5 839.17 Neighborhood Parks 74 794.39 District Parks 13 749.05 Special Parks 28 478.53 School Playgrounds 22 156.96 Tennis Centers 4 26.78 Pocket Parks 19 15.68 Senior Activity Centers 3 11.21
Total all Parks 222 17,560.06 Source: Austin PARD Land and Facility Inventory, October 2008, provided July 28, 2009 by the Parks and Recreation Department in response to a Public Information Request.
46 Austin PARD Land and Facility Inventory, October 2008.
Cost of Infrastructure to Serve New Residential Development in Austin Fodor & Associates LLC January 2011 Page 54
In order to expand the park system to accommodate new development, additional acres of parkland will need to be acquired. The average cost for vacant land in the City was estimated in the School System Costs section of this report to be $30,991 per acre. As shown in Table 9-2, each new housing unit will require on average 0.0624 acres of additional parkland at a cost of $1,934. In addition to the land there is the cost of park development with facilities such as recreation centers, pools, tennis courts, ball fields, golf courses, landscaping, gardens, paths and parking areas. A listing of park facilities was obtained from the City that included all buildings, building contents, and pools. The listing was created for insurance purposes and included the total 2008 insurance values for 1,351,000 square feet of buildings and all pools. Certain types of durable facilities were not included in this listing, presumably because they do not require insurance coverage. The costs for facilities such as ball fields, tennis courts, parking areas, golf courses, paths and landscaping were not included, so the full cost of park development would be somewhat higher than reported here. As shown in Table 9-2, the total value of the park facilities in the City listing was $174 million in 2008. The per-capita cost was adjusted to a 2010 value of $243 per person, or $633 per new housing unit. The total combined cost of park land ($1,934) and park facilities ($633) is $2,566 per new housing unit.

Cost of Infrastructure to Serve New Residential Development in Austin Fodor & Associates LLC January 2011 Page 55
Table 9-2
Park System Costs per New Housing Unit Park Land Austin Parkland Acres per 1000 People1 24 Acres per New Housing Unit (2.6 persons/unit) 0.0624 Parkland Cost per Acre2 $30,991 Parkland Cost per New Housing Unit $1,934 Park Facilities 2008 Park & Recreation Facilities3 $174,069,655 2008 Austin Population4 750,525 2008 Park & Recreation Facilities Cost per Person $232 Per Capita Cost Adjusted to 2010 Values5 $243 Austin Persons per New Housing Unit6 2.6 2010 Park Facilities Cost per Housing Unit $633 Total Cost of Park Land & Facilities per Housing Unit7 $2,566 Notes: 1) Current park system standard of service for park land area per 1000 population, based on response to Public Information Request on July 28, 2009 by Susan Delgado, Austin PARD. 2) Based on the average 2009 assessed market value of vacant land in Austin of $30,991 per acre. This figure includes only land categories D1 and D2 (qualified agricultural land and non-qualified land). Data for category C (vacant lots) was not available from TCAD. Category C land values are likely much higher per acre. 3) Total value for park buildings, building contents, and pools, based on PARD Facilities Listing values for 10/1/08 and listed as "Total Insurance Value 10/1/08" obtain from Richard Soliz, Division Manager, Park Planning & Design, Park and Recreation Dept. on 10/21/09. 4) Data from City of Austin Demographics, Ryan Robinson, City Demographer, Department of Planning, City of Austin, dated January 2009. The population data used in this report is provided in the Appendix. 5) Cost adjusted using ENR Construction Cost Index for nearest city (Dallas). 6) Persons-per-new-housing-unit from Austin Housing Characteristics section of this report. 7) Park costs are allocated entirely to residential development, as commercial and industrial development is generally not considered to create park system demand.
Park Funding Parkland acquisitions and facility development are funded through general obligation bonds. Voters approved $84 million in bonds for parks in 2006 and this money continues to be used for park expansion and improvements. Park bonds are funded by property taxes paid by all property owners. Under this funding mechanism, all property owners will pay for parks to serve new residential development. The City requires either a parkland dedication or a fee of $650/unit for all new residential units. This fee amount is deducted from the total cost in the final cost summary.

Cost of Infrastructure to Serve New Residential Development in Austin Fodor & Associates LLC January 2011 Page 56
10. Development Impact Fees in Austin An “impact fee” is a fee that is implemented by a local government on a new development to help offset a portion of the costs associated with expanding the capacity of public facilities to serve that development. Impact fees are widely used around the country to help fund the infrastructure new development requires. In Texas, impact fees were enabled statewide in 1987 by the 70th Legislature (SB 336). Texas Local Government Code, Chapter 395, authorizes cities to impose and collect impact fees and establishes guidelines.47 This statute also limits the types of facilities for which local government can charge impact fees to the following:
water facilities (supply, treatment and distribution);
wastewater facilities (sewage collection and treatment); stormwater facilities (drainage and flood control); and, roadway facilities.
In Austin, impact fees are charged only for water and wastewater systems by the Austin Water Utility. In addition, the Parks and Recreation Department charges a “parkland dedication fee” which functions in a similar manner to an impact fee and is treated as such in this study. Impact fees are based on the total cost of system-wide planned projects for the next ten years that are attributable to new growth. This cost is then divided by the number of new service units (such as standard housing units) anticipated over the same period (LGC Sec. 395.015). This results in the full system cost per service unit. However this is not the amount used in the fee. According to Texas Local Government Code, the city has two options in calculating the impact fee it charges. One is a “safe harbor” method of collecting only 50% of the full cost attributed to growth, which is the method used by Austin Water Utility. The other allows for 100% cost recovery but requires a full accounting of all future tax and service charge payments the development is likely to make towards the cost of infrastructure and deducts these from the full cost. Water and Wastewater Impact Fees The Austin Water Utility has an impact fee for both water and wastewater systems. The impact fees for a new housing unit are based on the number of service units, which is determined by the size of the water meter used. For example, a housing
47 Texas State Statutes - Local Government Code http://tlo2.tlc.state.tx.us/statutes/docs/LG/content/htm/lg.012.00.000395.00.htm
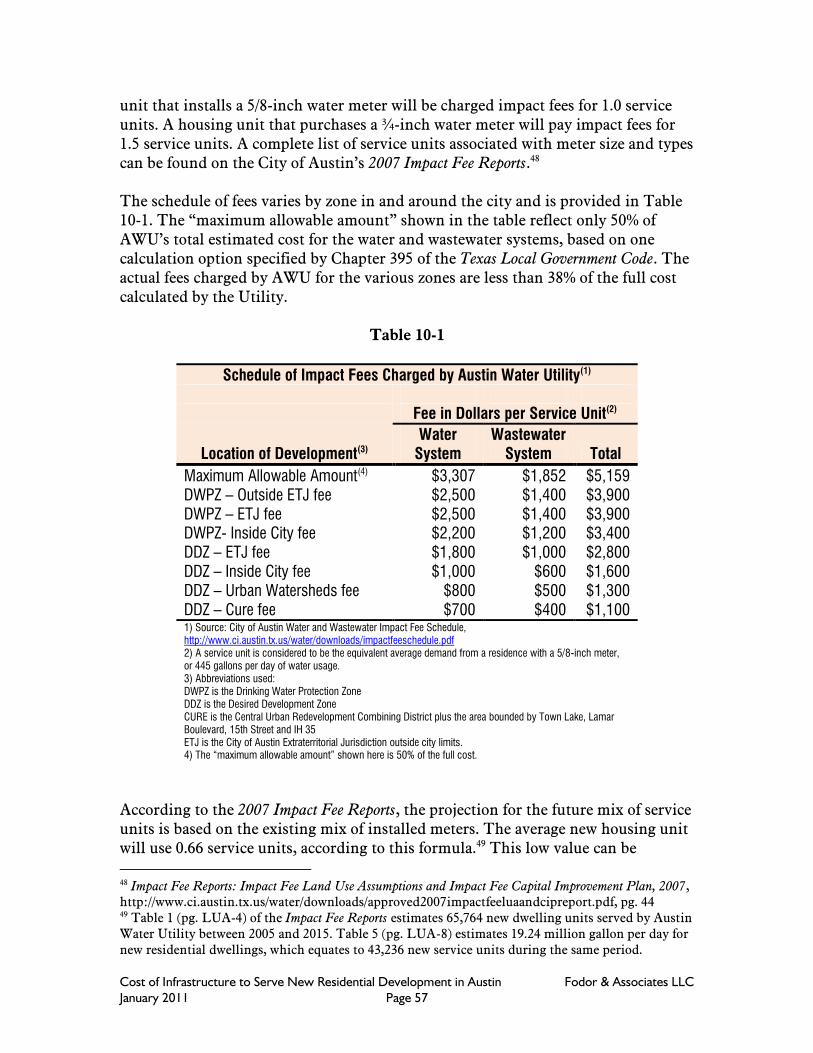
Cost of Infrastructure to Serve New Residential Development in Austin Fodor & Associates LLC January 2011 Page 57
unit that installs a 5/8-inch water meter will be charged impact fees for 1.0 service units. A housing unit that purchases a ¾-inch water meter will pay impact fees for 1.5 service units. A complete list of service units associated with meter size and types can be found on the City of Austin’s 2007 Impact Fee Reports.48 The schedule of fees varies by zone in and around the city and is provided in Table 10-1. The “maximum allowable amount” shown in the table reflect only 50% of AWU’s total estimated cost for the water and wastewater systems, based on one calculation option specified by Chapter 395 of the Texas Local Government Code. The actual fees charged by AWU for the various zones are less than 38% of the full cost calculated by the Utility.
Table 10-1
Schedule of Impact Fees Charged by Austin Water Utility(1) Fee in Dollars per Service Unit(2)
Location of Development(3) Water
System Wastewater
System Total
Maximum Allowable Amount(4) $3,307 $1,852 $5,159 DWPZ – Outside ETJ fee $2,500 $1,400 $3,900 DWPZ – ETJ fee $2,500 $1,400 $3,900 DWPZ- Inside City fee $2,200 $1,200 $3,400 DDZ – ETJ fee $1,800 $1,000 $2,800 DDZ – Inside City fee $1,000 $600 $1,600 DDZ – Urban Watersheds fee $800 $500 $1,300 DDZ – Cure fee $700 $400 $1,100 1) Source: City of Austin Water and Wastewater Impact Fee Schedule, http://www.ci.austin.tx.us/water/downloads/impactfeeschedule.pdf 2) A service unit is considered to be the equivalent average demand from a residence with a 5/8-inch meter, or 445 gallons per day of water usage. 3) Abbreviations used: DWPZ is the Drinking Water Protection Zone DDZ is the Desired Development Zone CURE is the Central Urban Redevelopment Combining District plus the area bounded by Town Lake, Lamar Boulevard, 15th Street and IH 35 ETJ is the City of Austin Extraterritorial Jurisdiction outside city limits. 4) The “maximum allowable amount” shown here is 50% of the full cost.
According to the 2007 Impact Fee Reports, the projection for the future mix of service units is based on the existing mix of installed meters. The average new housing unit will use 0.66 service units, according to this formula.49 This low value can be
48 Impact Fee Reports: Impact Fee Land Use Assumptions and Impact Fee Capital Improvement Plan, 2007, http://www.ci.austin.tx.us/water/downloads/approved2007impactfeeluaandcipreport.pdf, pg. 44 49 Table 1 (pg. LUA-4) of the Impact Fee Reports estimates 65,764 new dwelling units served by Austin Water Utility between 2005 and 2015. Table 5 (pg. LUA-8) estimates 19.24 million gallon per day for new residential dwellings, which equates to 43,236 new service units during the same period.
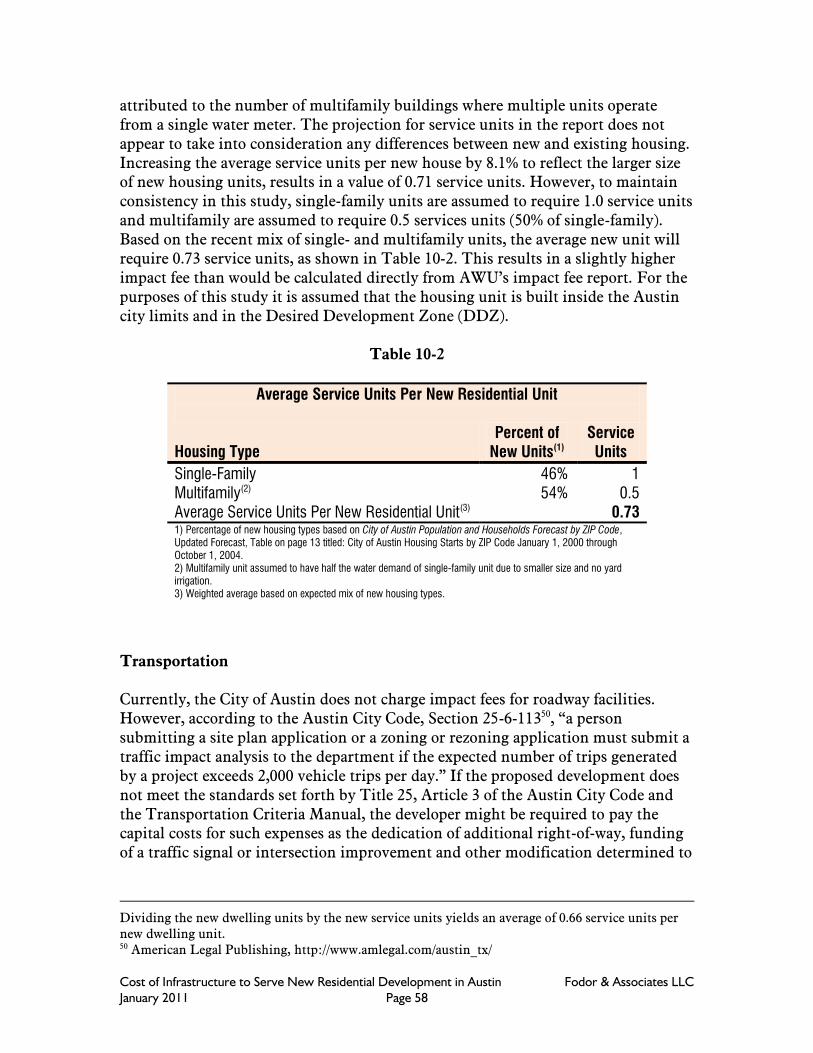
Cost of Infrastructure to Serve New Residential Development in Austin Fodor & Associates LLC January 2011 Page 58
attributed to the number of multifamily buildings where multiple units operate from a single water meter. The projection for service units in the report does not appear to take into consideration any differences between new and existing housing. Increasing the average service units per new house by 8.1% to reflect the larger size of new housing units, results in a value of 0.71 service units. However, to maintain consistency in this study, single-family units are assumed to require 1.0 service units and multifamily are assumed to require 0.5 services units (50% of single-family). Based on the recent mix of single- and multifamily units, the average new unit will require 0.73 service units, as shown in Table 10-2. This results in a slightly higher impact fee than would be calculated directly from AWU’s impact fee report. For the purposes of this study it is assumed that the housing unit is built inside the Austin city limits and in the Desired Development Zone (DDZ).
Table 10-2
Average Service Units Per New Residential Unit
Housing Type Percent of
New Units(1) Service Units
Single-Family 46% 1 Multifamily(2) 54% 0.5 Average Service Units Per New Residential Unit(3) 0.73 1) Percentage of new housing types based on City of Austin Population and Households Forecast by ZIP Code, Updated Forecast, Table on page 13 titled: City of Austin Housing Starts by ZIP Code January 1, 2000 through October 1, 2004. 2) Multifamily unit assumed to have half the water demand of single-family unit due to smaller size and no yard irrigation. 3) Weighted average based on expected mix of new housing types.
Transportation Currently, the City of Austin does not charge impact fees for roadway facilities. However, according to the Austin City Code, Section 25-6-11350, “a person submitting a site plan application or a zoning or rezoning application must submit a traffic impact analysis to the department if the expected number of trips generated by a project exceeds 2,000 vehicle trips per day.” If the proposed development does not meet the standards set forth by Title 25, Article 3 of the Austin City Code and the Transportation Criteria Manual, the developer might be required to pay the capital costs for such expenses as the dedication of additional right-of-way, funding of a traffic signal or intersection improvement and other modification determined to
Dividing the new dwelling units by the new service units yields an average of 0.66 service units per new dwelling unit. 50 American Legal Publishing, http://www.amlegal.com/austin_tx/

Cost of Infrastructure to Serve New Residential Development in Austin Fodor & Associates LLC January 2011 Page 59
be necessary. There is no specific guideline for these contributions, however, and any contribution by the developer is decided on a case by case basis. Stormwater Currently, the City of Austin does not charge impact fees for stormwater, drainage and flood control facilities. The City requires a certain amount of on-site mitigation of stormwater impacts for most new development. Parks The City first adopted an ordinance in 1985 requiring either park land dedication or fees for residential subdivisions. According to the current City Ordinance No. 20070621-027, adopted in June of 2007,51 the City of Austin requires that developers of residential subdivisions and site plans with three or more dwelling units dedicate five acres of parkland to the City of Austin per 1,000 residents. If less than six acres are required to be dedicated or the land available for dedication does not comply with the standards for dedication, the developer may instead be charged $650 for every dwelling unit. The fee is the same for all types and sizes of dwelling units. The payment is the most common option used.52 Total Impact Fees for a New Austin Housing Unit A typical new housing unit in Austin will pay a total of $1,818 in impact fees towards water system, sewer system and park system impacts, as shown in Table 10-3.
Table 10-3
Total Impact Fees for Typical Housing Unit in Austin(1)
Category Fee
Water $730 Sewerage $438 Parks $650
Total: $1,818 1) Typical housing unit is assumed to be 0.73 service units for purposes of water and sewerage impact fee calculation, as explained in the text.
51 City of Austin, Office of the City Clerk, http://www.cityofaustin.org/edims/document.cfm?id=104212 52 Parkland Dedication Presentation PowerPoint to Boards & Commissions, 2006-2007, by the Parks and Recreation Department.
Cost of Infrastructure to Serve New Residential Development in Austin Fodor & Associates LLC January 2011 Page 60
Austin’s impact fees are relatively low for a city charging such fees. The average among cities in the U.S. that collect impact fees was a total of $11,796 for a single-family house in 2007.53 By comparison, Austin charges from $2,250 to $4,050 in total impact fees for a single-family house within City Limits.54
53 National average impact fees are $11,796 per single-family unit, according to National Impact Fee Survey 2010, by Duncan Associates. 54 Fees are for a single-family house built within city limits. Fees vary depending on development zone. Total includes water, wastewater, and park dedication fees.

Cost of Infrastructure to Serve New Residential Development in Austin Fodor & Associates LLC January 2011 Page 61
11. Conclusions The gross costs for serving a typical residential unit in Austin with the six categories of infrastructure evaluated in this study total $28,882, as shown in first data column in Table 11-1. These costs represent the estimated expense the City incurs to build the infrastructure necessary to serve a typical residential unit in Austin in 2010. Note that a “typical residential unit” represents the expected mix of new single-family and multifamily housing. The costs are referred to here as gross costs because new residential development contributes a certain amount to offset these costs. To arrive at a net costs, or cost not paid by the new development, credits for impact fees and future tax contributions must be deducted from the gross costs. Impact fees paid by a typical new residential unit total $1,818 and future tax revenues and utility payments that will go towards bond repayments total $541.55 The total net cost for a typical new residential unit in Austin is $26,523, as shown in the last column of Table 11-1.
Table 11-1
Summary of Infrastructure Costs for Typical New Residential Unit
Categories
Gross Cost to Serve Typical New Housing
Unit
Credit for Impact Fees
or Other Payments1
Credit for Future
Contribution via Tax and
Utility Payments2
Net Cost to Serve
Typical New Housing Unit
School Facilities $9,325 $0 $187 $9,139 Road System $3,380 $0 $68 $3,312 Water Service Facilities3 $6,661 $730 $119 $5,812 Wastewater System3 $3,654 $438 $64 $3,152 Storm Drainage System $3,296 $0 $66 $3,230 Park Facilities $2,566 $650 $38 $1,878
Total Cost: $28,882 $1,818 $541 $26,523 1) Impact fees paid by new development are discussed in the section Impact Fees in Austin. 2) Crediting new development for future tax and utility payments that will go towards its infrastructure costs is addressed in the Methodology section. 3) The water and sewer system impact fees are based on the likely mix of single-family and multifamily housing constructed inside city limits in the desired development zone and reflect 0.73 service units each. See Housing Characteristics section for more information.
As shown graphically in Figure 11-1, school facilities are the most expensive of the six infrastructure categories evaluated in Austin. While these cost figures are the
55 These deductions are explained in the previous sections: Impact Fees in Austin and Methodology.

Cost of Infrastructure to Serve New Residential Development in Austin Fodor & Associates LLC January 2011 Page 62
most accurate estimate available, actual road system costs are likely to be higher than reported here. As explained in the Road System Costs section, this study was limited to the available data and reporting from local government.
Figure 11-1
The total net cost of $26,523 is the amount ultimately paid by the taxpayers and ratepayers of Austin and not by the new development itself. This amount can be viewed as a subsidy of new development by established residents and businesses of the City. The cost is effectively a one-time cost that is due when the development is completed. The City forecasts that Austin will grow at a rate of about 1.5% per year over the next decade. 56 This rate of growth would increase the current population by 12,000 people per year. Based on a housing occupancy level of 2.6 persons per unit, 4,615 additional housing units will be constructed each year to accommodate this growth. At an average net cost of $26,523 per unit, the total net cost for the facilities to serve this residential development will be $122 million each year. The forecasted population growth over the next 20 years will result in 103,824 new housing units, costing $2.75 billion in current dollars.57
56 Based on projections by the City Demographer, Department of Planning, City of Austin, dated January 2010. See Appendix A for data. 57 For forecast information see the section Characteristics of New Housing in Austin.
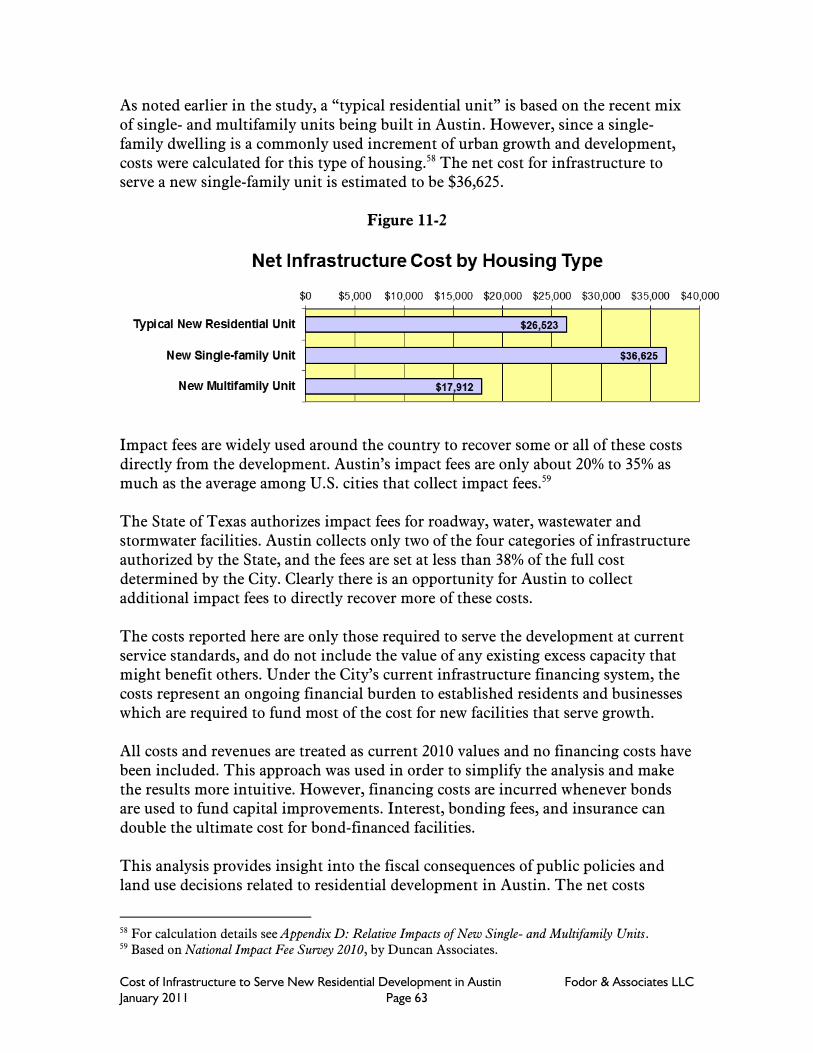
Cost of Infrastructure to Serve New Residential Development in Austin Fodor & Associates LLC January 2011 Page 63
As noted earlier in the study, a “typical residential unit” is based on the recent mix of single- and multifamily units being built in Austin. However, since a single-family dwelling is a commonly used increment of urban growth and development, costs were calculated for this type of housing.58 The net cost for infrastructure to serve a new single-family unit is estimated to be $36,625.
Figure 11-2
Impact fees are widely used around the country to recover some or all of these costs directly from the development. Austin’s impact fees are only about 20% to 35% as much as the average among U.S. cities that collect impact fees.59 The State of Texas authorizes impact fees for roadway, water, wastewater and stormwater facilities. Austin collects only two of the four categories of infrastructure authorized by the State, and the fees are set at less than 38% of the full cost determined by the City. Clearly there is an opportunity for Austin to collect additional impact fees to directly recover more of these costs. The costs reported here are only those required to serve the development at current service standards, and do not include the value of any existing excess capacity that might benefit others. Under the City’s current infrastructure financing system, the costs represent an ongoing financial burden to established residents and businesses which are required to fund most of the cost for new facilities that serve growth. All costs and revenues are treated as current 2010 values and no financing costs have been included. This approach was used in order to simplify the analysis and make the results more intuitive. However, financing costs are incurred whenever bonds are used to fund capital improvements. Interest, bonding fees, and insurance can double the ultimate cost for bond-financed facilities. This analysis provides insight into the fiscal consequences of public policies and land use decisions related to residential development in Austin. The net costs
58 For calculation details see Appendix D: Relative Impacts of New Single- and Multifamily Units. 59 Based on National Impact Fee Survey 2010, by Duncan Associates.

Cost of Infrastructure to Serve New Residential Development in Austin Fodor & Associates LLC January 2011 Page 64
identified for six of the twelve basic infrastructure categories required by new residential development show a significant negative fiscal impact. Additional research on the remaining six categories of infrastructure will yield a more-complete picture of development impacts in Austin.

Cost of Infrastructure to Serve New Residential Development in Austin Fodor & Associates LLC January 2011 Page 65
Appendices A. Population Projections for Austin B. Data on Student Generation C. Water and Wastewater System Cost Estimates from Other City Reports D. Relative Impacts of New Single- and Multifamily Units E. Notes on Data and Calculations Used in Study
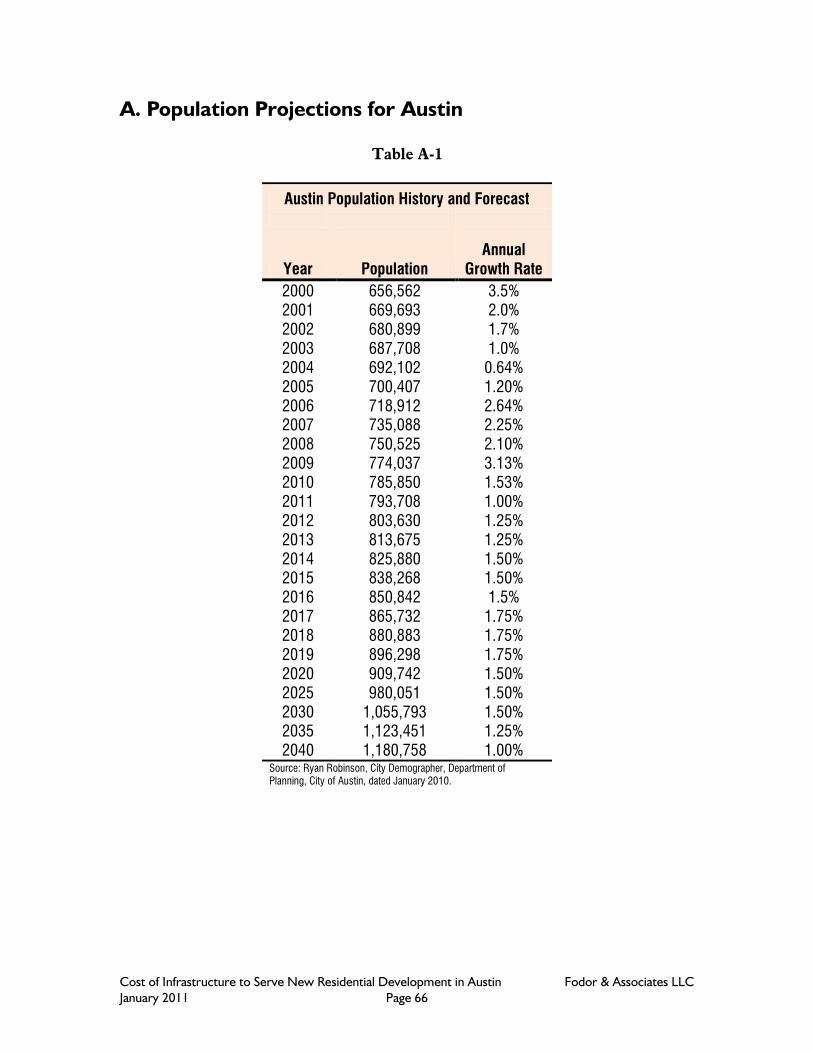
Cost of Infrastructure to Serve New Residential Development in Austin Fodor & Associates LLC January 2011 Page 66
A. Population Projections for Austin
Table A-1
Austin Population History and Forecast
Year Population Annual
Growth Rate
2000 656,562 3.5% 2001 669,693 2.0% 2002 680,899 1.7% 2003 687,708 1.0% 2004 692,102 0.64% 2005 700,407 1.20% 2006 718,912 2.64% 2007 735,088 2.25% 2008 750,525 2.10% 2009 774,037 3.13% 2010 785,850 1.53% 2011 793,708 1.00% 2012 803,630 1.25% 2013 813,675 1.25% 2014 825,880 1.50% 2015 838,268 1.50% 2016 850,842 1.5% 2017 865,732 1.75% 2018 880,883 1.75% 2019 896,298 1.75% 2020 909,742 1.50% 2025 980,051 1.50% 2030 1,055,793 1.50% 2035 1,123,451 1.25% 2040 1,180,758 1.00%
Source: Ryan Robinson, City Demographer, Department of Planning, City of Austin, dated January 2010.
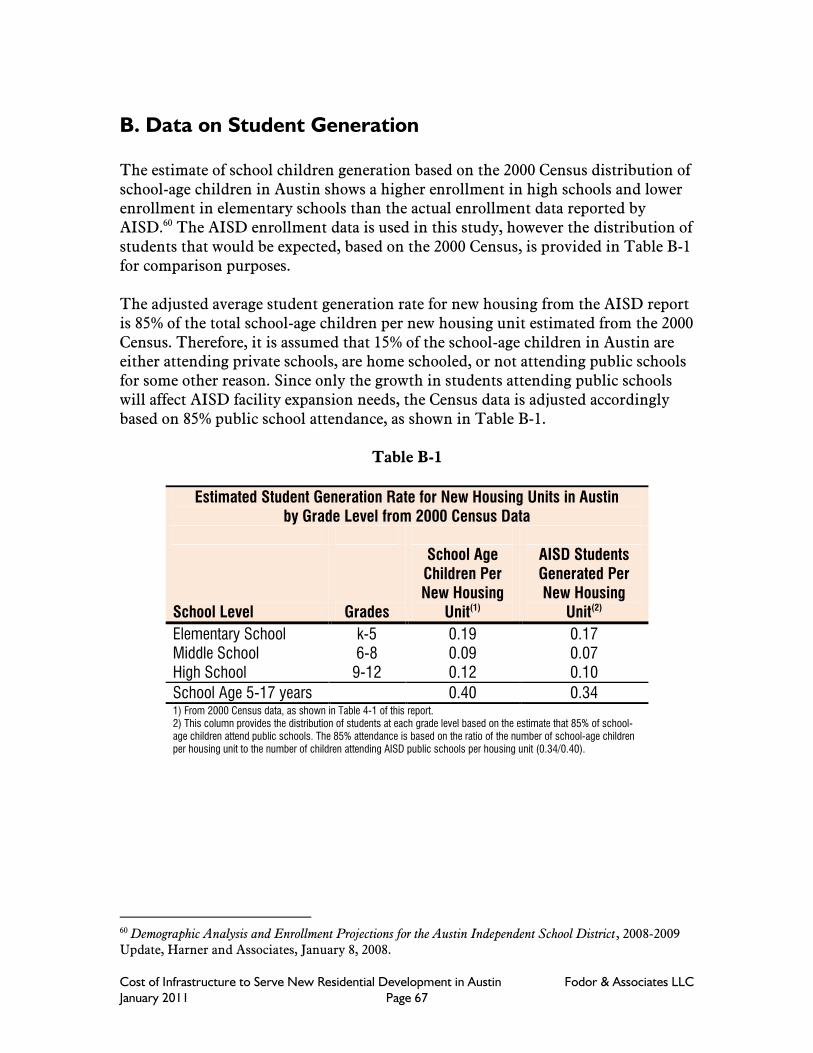
Cost of Infrastructure to Serve New Residential Development in Austin Fodor & Associates LLC January 2011 Page 67
B. Data on Student Generation The estimate of school children generation based on the 2000 Census distribution of school-age children in Austin shows a higher enrollment in high schools and lower enrollment in elementary schools than the actual enrollment data reported by AISD.60 The AISD enrollment data is used in this study, however the distribution of students that would be expected, based on the 2000 Census, is provided in Table B-1 for comparison purposes. The adjusted average student generation rate for new housing from the AISD report is 85% of the total school-age children per new housing unit estimated from the 2000 Census. Therefore, it is assumed that 15% of the school-age children in Austin are either attending private schools, are home schooled, or not attending public schools for some other reason. Since only the growth in students attending public schools will affect AISD facility expansion needs, the Census data is adjusted accordingly based on 85% public school attendance, as shown in Table B-1.
Table B-1
Estimated Student Generation Rate for New Housing Units in Austin by Grade Level from 2000 Census Data
School Level Grades
School Age Children Per New Housing
Unit(1)
AISD Students Generated Per New Housing
Unit(2)
Elementary School k-5 0.19 0.17 Middle School 6-8 0.09 0.07 High School 9-12 0.12 0.10
School Age 5-17 years 0.40 0.34 1) From 2000 Census data, as shown in Table 4-1 of this report. 2) This column provides the distribution of students at each grade level based on the estimate that 85% of school-age children attend public schools. The 85% attendance is based on the ratio of the number of school-age children per housing unit to the number of children attending AISD public schools per housing unit (0.34/0.40).
60 Demographic Analysis and Enrollment Projections for the Austin Independent School District, 2008-2009 Update, Harner and Associates, January 8, 2008.
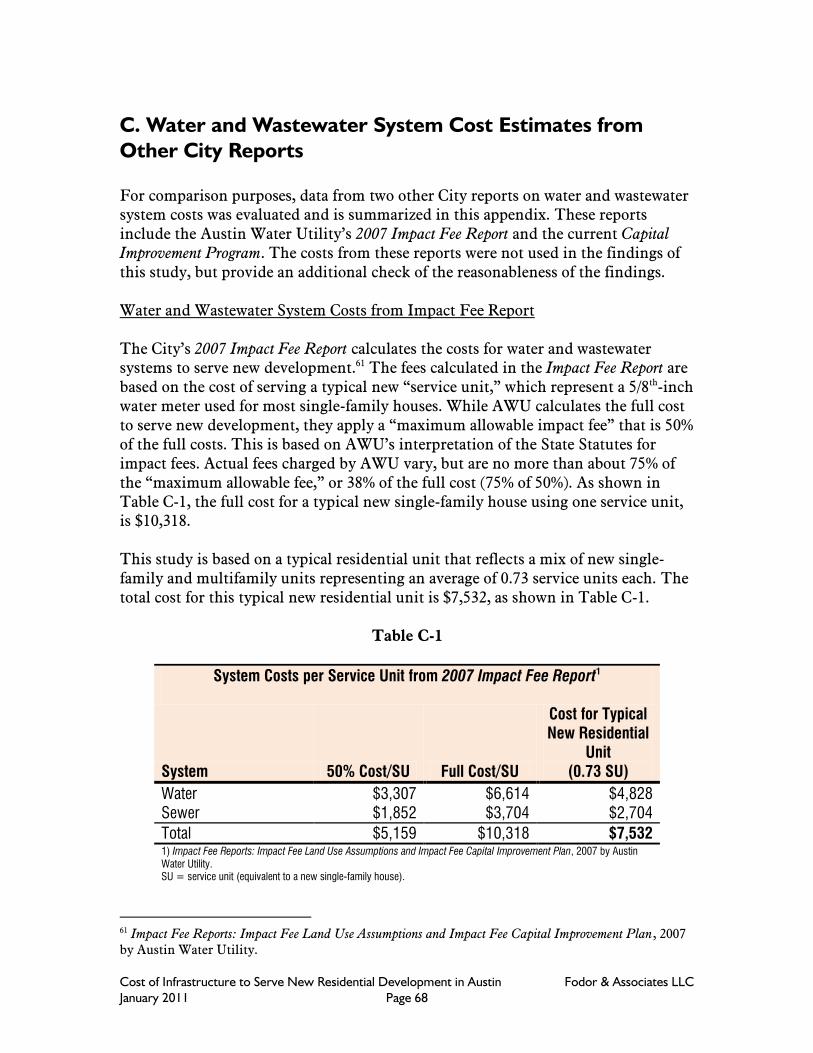
Cost of Infrastructure to Serve New Residential Development in Austin Fodor & Associates LLC January 2011 Page 68
C. Water and Wastewater System Cost Estimates from Other City Reports For comparison purposes, data from two other City reports on water and wastewater system costs was evaluated and is summarized in this appendix. These reports include the Austin Water Utility’s 2007 Impact Fee Report and the current Capital Improvement Program. The costs from these reports were not used in the findings of this study, but provide an additional check of the reasonableness of the findings. Water and Wastewater System Costs from Impact Fee Report The City’s 2007 Impact Fee Report calculates the costs for water and wastewater systems to serve new development.61 The fees calculated in the Impact Fee Report are based on the cost of serving a typical new “service unit,” which represent a 5/8th-inch water meter used for most single-family houses. While AWU calculates the full cost to serve new development, they apply a “maximum allowable impact fee” that is 50% of the full costs. This is based on AWU’s interpretation of the State Statutes for impact fees. Actual fees charged by AWU vary, but are no more than about 75% of the “maximum allowable fee,” or 38% of the full cost (75% of 50%). As shown in Table C-1, the full cost for a typical new single-family house using one service unit, is $10,318. This study is based on a typical residential unit that reflects a mix of new single-family and multifamily units representing an average of 0.73 service units each. The total cost for this typical new residential unit is $7,532, as shown in Table C-1.
Table C-1
System Costs per Service Unit from 2007 Impact Fee Report1
System 50% Cost/SU Full Cost/SU
Cost for Typical New Residential
Unit (0.73 SU)
Water $3,307 $6,614 $4,828 Sewer $1,852 $3,704 $2,704
Total $5,159 $10,318 $7,532 1) Impact Fee Reports: Impact Fee Land Use Assumptions and Impact Fee Capital Improvement Plan, 2007 by Austin Water Utility. SU = service unit (equivalent to a new single-family house).
61 Impact Fee Reports: Impact Fee Land Use Assumptions and Impact Fee Capital Improvement Plan, 2007 by Austin Water Utility.

Cost of Infrastructure to Serve New Residential Development in Austin Fodor & Associates LLC January 2011 Page 69
Water and Sewer System Growth Costs from CIP In order to examine the growth-related system costs from another perspective, AWU’s estimate of “system growth” costs for the water and sewer systems was used. The utility’s Capital Improvement Program (CIP) report for the 2010-2014 period groups projects by the category of expenditure.62 The System Growth category provides 5- and 10-year summaries of growth-related costs, as shown in Table C-2. Residential customers (single-family and multifamily) represent 58.7% of the total volume of water sales, and therefore are assumed to represent roughly 58.7% of the total water and sewer systems cost.63 The residential share of costs is divided by the estimated population growth over the period to obtain a per-capita cost. At 2.6 persons per new housing unit, the cost ranges from $11,179 to $13,971 per housing unit for water and sewer facilities, as shown in Table C-2.
Table C-2
Water and Sewer Growth Costs from CIP Report1 5 Years 10 Years Water and Sewer System Metric 2010-14 2010-19
System Growth Cost (water and sewer) $776,085,000 $1,224,961,000 Share of System Cost to Residential2 58.7% 58.7% Residential Cost $455,928,530 $719,630,799 Estimated Population Change for Period3 84,848 167,374 Residential Cost Per Capita $5,373 $4,300 Cost per New Housing Unit (at 2.6 pers/unit) $13,971 $11,179 1) “System Growth” category from Capital Improvement Program (CIP) report by AWU, Table on page 19/19, 2010-2014 Proposed Spending - Summary by Category. 2) Share of cost to residential based on water flow reported in Austin Water Utility’s Cost of Service Rate Study 2008, Report Vol. II, Red Oak Consulting, August 2009, Table B-1, page B-1. 3) Population projections were not available from AWU for the years reported in the CIP, so City population projections were used and the totals increased by 12% to 14% (based on AWU data for other years) to reflect larger service area for water and sewer.
Comparison of Alternative Estimates The costs derived from the Impact Fee Report and the CIP are compared with those used in this study in Table C-3. The total of costs from the Impact Fee Report is slightly lower, but would be very close if adjusted from 2007 to 2010 costs. However,
62 Capital Improvement Program, Austin Water Utility FY 2010-2014 Proposed Spending Plan v03, CIP Summary by Category, page 19. 63 Share of water flow based on Austin Water Utility Cost of Service Rate Study 2008, Report Vol. II, Red Oak Consulting, August 2009, Table B-1, page B-1.

Cost of Infrastructure to Serve New Residential Development in Austin Fodor & Associates LLC January 2011 Page 70
the cost from the CIP are significantly higher. Based on this, it is possible that the water and/or sewer system costs calculated in this study are too low and do not reflect the full cost of the infrastructure. An in-depth analysis of the CIP source data would be necessary to determine if this is the case.
Table C-3
Comparison of Water and Sewer System Costs Calculated in this Study with Alternative Sources
Cost per Typical New Housing Unit
Source Water Sewer Combined
Total
Costs Calculated in this Study (2010) $6,661 $3,654 $10,315 2007 Impact Fee Report (2007) $4,828 $2,704 $7,532 System Growth Costs from 5-Yr CIP (2009) Combined Combined $13,971 Note: these are full costs and do not include deductions for impact fees or other credits.

Cost of Infrastructure to Serve New Residential Development in Austin Fodor & Associates LLC January 2011 Page 71
D. Relative Impacts of New Single- and Multifamily Units The impacts estimated in this study are for average new housing units. However, it is possible to roughly estimate the relative share of impacts from single-family and multifamily units by assuming that the floor area of a housing unit correlates with the level of impact on public services and facilities. Housing units with more floor area are assumed to have more bedrooms on average, and therefore more occupants and more demand on public facilities. This relationship is fairly well established in the planning literature and is applied to impact fees in many areas.64 The City of Austin does not have data on average floor areas for new housing units. The City also does not have data on the number of occupants in new housing units. Instead, the national average floor area for new units of both types in built in 2008 was used, as shown in Table D-1. The percentage of each type of unit being built is reflected in the City’s housing starts data for 2000 to 2004. Based on this mix of housing types, it is possible to estimate the average floor area for all new units to be 1,846 square feet. Based on the differences in floor areas at the national level, new single-family units will have approximately 37% more impact, and multifamily units will have 32% less impact than the average for all new units, as shown in Table D-1. For comparison purposes, AISD data for school children generated by single-family and multifamily housing units was included in Table D-1. This data is for all existing housing, so does not reflect the increased size of new single-family housing relative to multifamily. As might be expected, the difference between the two housing categories is slightly less for existing housing, since older single-family units tend to be smaller. The AISD data tends to corroborate the difference in impacts estimated by floor area — at least as far as school system impacts. School system impacts were by far the most expensive infrastructure category included in this study.
64 For example, see Impact Fees: Equity And Housing Affordability, L. Bowles and A. Nelson, U.S. Department of Housing and Urban Development, April 2007, page 42.
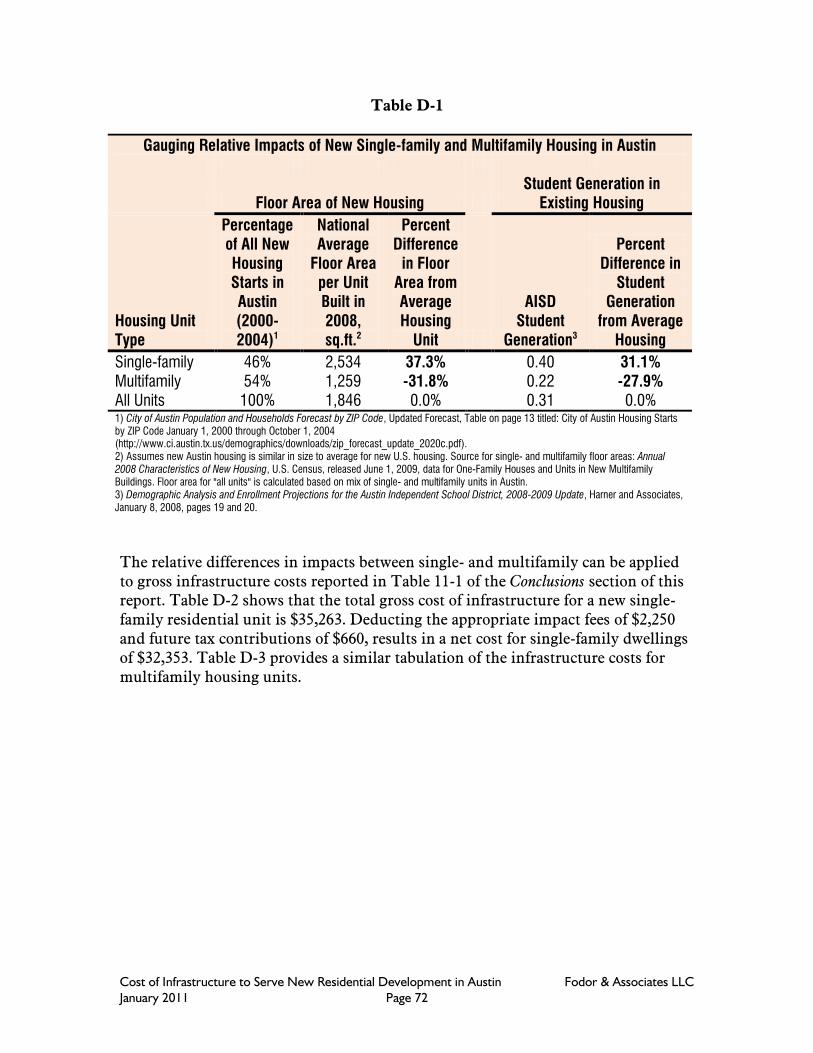
Cost of Infrastructure to Serve New Residential Development in Austin Fodor & Associates LLC January 2011 Page 72
Table D-1
Gauging Relative Impacts of New Single-family and Multifamily Housing in Austin
Floor Area of New Housing Student Generation in
Existing Housing
Housing Unit Type
Percentage of All New Housing Starts in Austin (2000-2004)1
National Average
Floor Area per Unit Built in 2008, sq.ft.2
Percent Difference
in Floor Area from Average Housing
Unit
AISD Student
Generation3
Percent Difference in
Student Generation
from Average Housing
Single-family 46% 2,534 37.3% 0.40 31.1% Multifamily 54% 1,259 -31.8% 0.22 -27.9% All Units 100% 1,846 0.0% 0.31 0.0% 1) City of Austin Population and Households Forecast by ZIP Code, Updated Forecast, Table on page 13 titled: City of Austin Housing Starts by ZIP Code January 1, 2000 through October 1, 2004 (http://www.ci.austin.tx.us/demographics/downloads/zip_forecast_update_2020c.pdf). 2) Assumes new Austin housing is similar in size to average for new U.S. housing. Source for single- and multifamily floor areas: Annual 2008 Characteristics of New Housing, U.S. Census, released June 1, 2009, data for One-Family Houses and Units in New Multifamily Buildings. Floor area for "all units" is calculated based on mix of single- and multifamily units in Austin. 3) Demographic Analysis and Enrollment Projections for the Austin Independent School District, 2008-2009 Update, Harner and Associates, January 8, 2008, pages 19 and 20. The relative differences in impacts between single- and multifamily can be applied to gross infrastructure costs reported in Table 11-1 of the Conclusions section of this report. Table D-2 shows that the total gross cost of infrastructure for a new single-family residential unit is $35,263. Deducting the appropriate impact fees of $2,250 and future tax contributions of $660, results in a net cost for single-family dwellings of $32,353. Table D-3 provides a similar tabulation of the infrastructure costs for multifamily housing units.

Cost of Infrastructure to Serve New Residential Development in Austin Fodor & Associates LLC January 2011 Page 73
Table D-2
Summary of Infrastructure Costs for New Single-family Residential Unit
Category
Gross Cost per New Single-
family Unit
Credit for Impact Fees or Other
Payments
Credit for Future
Contribution Through Tax and Utility Payments Net Cost
School Facilities $12,803 $0 $256 $12,547 Road System $4,641 $0 $93 $4,548 Water Service Facilities $9,124 $1,000 $162 $7,962 Wastewater System $5,006 $600 $88 $4,318 Storm Drainage System $4,526 $0 $91 $4,435 Park Facilities $3,523 $650 $57 $2,816
Total Cost: $39,623 $2,250 $747 $36,625
Figure D-1
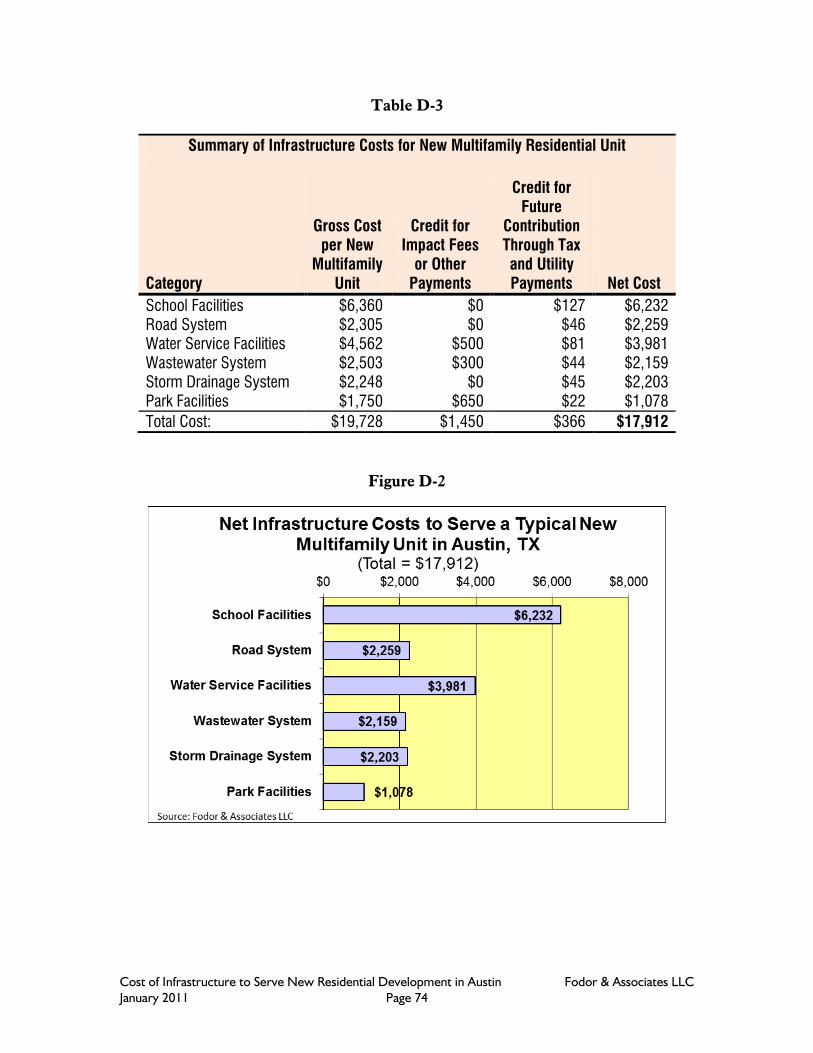
Cost of Infrastructure to Serve New Residential Development in Austin Fodor & Associates LLC January 2011 Page 74
Table D-3
Summary of Infrastructure Costs for New Multifamily Residential Unit
Category
Gross Cost per New
Multifamily Unit
Credit for Impact Fees
or Other Payments
Credit for Future
Contribution Through Tax and Utility Payments Net Cost
School Facilities $6,360 $0 $127 $6,232 Road System $2,305 $0 $46 $2,259 Water Service Facilities $4,562 $500 $81 $3,981 Wastewater System $2,503 $300 $44 $2,159 Storm Drainage System $2,248 $0 $45 $2,203 Park Facilities $1,750 $650 $22 $1,078
Total Cost: $19,728 $1,450 $366 $17,912
Figure D-2
Cost of Infrastructure to Serve New Residential Development in Austin Fodor & Associates LLC January 2011 Page 75
E. Notes on Data and Calculations Used in Study It is the intention of the author to use the most accurate data available throughout the study. Where accurate data was not available, reasonable estimates were necessary. Where a range of reasonable estimates existed, the more conservative estimates were used. By “conservative” it is meant that the figures used would tend to estimate lower costs from new development, or tend to err on the low side in the costs determined in this study. Below are some of the specific instances in which conservative, or lower-impact, values were used: New Housing Characteristics Limited data were available on the characteristics of new housing in Austin. As
noted in the text, the estimate of occupancy for new housing units used in this report of 2.6 persons per housing unit, is likely to be lower than the actual occupancy level in Austin due to the use of the 2000 Census base year. Lacking any clear method to estimate the increase in occupancy levels in Austin from 2000 to 2010, the change could not be included in the study. Since the occupancy rate used here is likely lower than actual rates, the impacts of new housing on demand for services and infrastructure will be understated somewhat.
Schools The values for vacant land used in this study are based on average assessed
market values for agricultural and non-qualified land (tax codes D1 and D2). Land values did not include land in tax code “C” (vacant lots), since TCAD had no data on total acreage in this category. Vacant lots are likely to have a higher value on a per-acre basis than agricultural or non-qualified land. Therefore land cost of $30,991 per acre used here for schools and parks is likely to be lower than actual. For example, the Leander ISD northwest of Austin paid $198,000 per acre for 126 acres of land purchased for two schools in 2006.
Data collected by the Council of Educational Facility Planners International
(CEFPI) for Texas high schools did not include the costs of equipping and furnishing the schools and therefore do not reflect the full facility costs.
Roads The cost for planning studies and corridor studies was not included in the
CAMPO figures for road costs. No toll roads are included in road costs. Road cost impacts based on the CAMPO 2030 Plan are likely to be low for
several reasons. First, CAMPO’s road costs are based on a fairly low planning estimate of $1,000,000 per lane mile for road construction. Other sources indicate

Cost of Infrastructure to Serve New Residential Development in Austin Fodor & Associates LLC January 2011 Page 76
this cost may be two to four times higher. Second, no value is included for the existing roadway system capacity (excess capacity) that will be consumed by new development. And third, the roads included in the CAMPO Project List are not adequate to maintain the current levels of service.
Road costs included in this study are City of Austin costs only. Most local road
costs are funded by state and federal government. Water System Water treatment plant costs for WTP #4 were reduced by 10% to reflect
investments related to future capacity increases. Water and Sewer System System growth costs reported in the Capital Improvement Program for future water
and sewer system expansion indicate that the full cost of these systems may be significantly higher than reported here (see Table C-3 in Appendix).
Stormwater System Stormwater system costs are based on an assumption in the SH 130 Infrastructure
District Report that only 32% of the land area would be used for residential purposes. If the proposed district ends up having a development pattern similar to the existing pattern in Austin, 70% of the land would be residential and the cost calculated in this study would likely increase.
The SH 130 Infrastructure District Report assumes that a larger percentage of new
residential units in the District will be multifamily than has been the case in the City’s recent development. Multifamily units are smaller and will require fewer services. Since multifamily units have less impervious surface and require less stormwater management per unit, the costs reported will be lower than for typical development in Austin.
Parks Certain types of durable park facilities were not included in the City’s facility
listing, presumably because they do not require insurance coverage. The costs for facilities such as ball fields, tennis courts, parking areas, golf courses, paths and landscaping were not included, so the full cost of park development would be somewhat higher than reported here.
Land costs were the principal expense association with expanding the park
system. The land cost used in this study for parks is the same as for schools and

Cost of Infrastructure to Serve New Residential Development in Austin Fodor & Associates LLC January 2011 Page 77
is likely to be lower than actual costs for the same reasons as described previously.
General Financing costs are not included in the costs presented in this report in order to
give a clear picture of the immediate, direct capital costs associated with new development. Since most capital facilities are bond financed, financing costs will be incurred (including interest, bonding fees, and insurance) that will increase the ultimate costs of these facilities.


