Cost of importing deep sandstone water to eliminate ... · PDF fileCost of Importing Deep...
21
ISWS-74-CIR120 Circular 120 STATE OF ILLINOIS DEPARTMENT OF REGISTRATION AND EDUCATION Cost of Importing Deep Sandstone Water to Eliminate Groundwater Deficits in Northeastern Illinois by D. W. BEAVER ILLINOIS STATE WATER SURVEY URBANA 1974
Transcript of Cost of importing deep sandstone water to eliminate ... · PDF fileCost of Importing Deep...
ISWS-74-CIR120
Circular 120 STATE OF ILLINOIS DEPARTMENT OF REGISTRATION AND EDUCATION
Cost of Importing Deep Sandstone Water to Eliminate Groundwater Deficits
in Northeastern Illinois by D. W. BEAVER
ILLINOIS STATE WATER SURVEY URBANA
1974
FOREWORD
Northeastern Illinois is facing water supply problems which may require reallocation of present supplies or shifting in part to new or unconventional sources. The State Water Survey, in a series of reports of which this is one, is evaluating the physical and economic aspects of numerous options. When the series is completed they will be brought together in alternative scenarios for public decision.
The present study involves the assumption of continued mining of the deep sandstone formations which are already greatly overpumped. This approach could meet short and mid-term requirements at the expense of future productivity of the deep aquifer. Whether this should be done will be a public decision which should consider physical and economic factors such as those contained in this report. However, other broad issues such as resource use and regional growth may be controlling. In that light this report is issued.
William C. Ackermann, Chief Illinois State Water Survey
CONTENTS
PAGE
Summary 1 Introduction 2 Component costs 4
Costs of groundwater production and treatment 4 Costs of importing water to eliminate deficits 5
Idealized transmission network 5 Transmission costs 6
Least cost computational procedure 8 Results and discussion 9
Unit costs to individual townships 9 Average unit costs 11 Transmission lines 12 Average water level decline 16
Conclusions 17 References 17
COST OF IMPORTING DEEP SANDSTONE WATER TO ELIMINATE GROUNDWATER DEFICITS IN NORTHEASTERN ILLINOIS
by D. W. Beaver
SUMMARY
The cost of importing groundwater to eliminate projected deficits was estimated for deficient townships within the six-county area of northeastern Illinois. The sole source of such imported water was assumed to be deep sandstone water from neighboring townships.
The total cost of water at a given deficient township consisted of the raw water cost and the treatment cost. (Treatment was required to make the water comparable in quality to treated Lake Michigan water.) The raw water cost consisted of the cost of locally produced raw water and the cost of imported raw water needed to satisfy the deficit. The cost of imported raw water consisted of the production cost at the source township and the transmission cost to bring the water from the source township to the deficient township.
Transmission costs were calculated from published data and formulas with the assumption that the water was transmitted along portions of an idealized network based on the existing system of highways, streets, and railways in the metropolitan Chicago area. Because of the economy of scale in transmission costs, the total deficit at a given township was assumed to be met with water imported from a single source township. The least expensive source of water for importation was determined separately for each deficient township. The total cost of both production at the source township and transmission to the deficient township was charged to the deficient township.
It was assumed that raw water would be imported, with treatment to take place at the deficient township. In this way, the added cost of importing raw water is partially offset by the economy of scale in treatment costs.
The treatment cost was found to be the most significant cost component, accounting for nearly 60 percent of the total cost. The transmission cost proved to be a relatively small cost component, accounting for 10 to 18 percent of the raw water cost and only 4 to 8 percent of the total cost.
It was concluded that the groundwater resources available in northeastern Illinois should be adequate to meet the demands of the area until 2020, if mining of water from the deep sandstone aquifers is continued. The importation of deep sandstone water significantly increases the cost of raw water to deficient townships, but, because of the economy of scale in treatment costs, produces relatively little increase in the cost of treated water.
1
INTRODUCTION
This report is the third phase of a systems analysis of water resources in northeastern Illinois (Cook, Du Page, Kane, Lake, McHenry, and Will Counties). The groundwater studies cover all of the six counties except those areas supplied by Lake Michigan water. Results showing projected groundwater deficiencies were summarized by Schicht and Moench (1971). Estimates of average costs of producing groundwater and treating it to make it comparable in quality with treated Lake Michigan water were reported by Moench and Visocky (1971), who also provided additional information on projected groundwater deficits in the region.
The purpose of the present report was to estimate the average cost of eliminating the groundwater deficits by importing water from neighboring townships. The sole source of such imported water was assumed to be the deep Cambrian-Ordovician sandstone aquifers. Thus, in a sense, this report represents an attempt to determine an optimal scheme of development of the Cambrian-Ordovician aquifers in order to meet the groundwater demands in northeastern Illinois until the year 2020.
This study is essentially a direct extension of the work done by Moench and Visocky (1971), so that the general assumptions made there also apply here:
". . . The groundwater resource was divided into three sources: 1) sands and gravels of the glacial till, 2) Silurian dolomite, and 3) deep sandstone Cambrian-Ordovician aquifers. Sources 1 and 2 are referred to in this report as the shallow aquifers and source 3 as the deep sandstone aquifers. The underlying Mt. Simon aquifer was not considered as a source in this study."
". . . The demand was to be satisfied by using the cheapest available groundwater within a township. Pumpage from the shallow aquifers was to be limited to their potential yield. Water could be continuously withdrawn (mined) from the deep sandstone aquifers until the pumping water level reached the top of the Ironton-Galesville Formation, the most productive portion of the deep sandstone aquifers. When this occurred the pumpage from the deep sandstone was reduced so the pumping water level remained at the top of the Ironton-Galesville Formation which lies at depths of 900 to 1300 feet below land surface. As pumpage is reduced any deficiency in meeting the demand must be satisfied by importation of water from Lake Michigan or by some other alternative source."
In the present case, the source of imported water is deep sandstone water supplied from neighboring townships.
In this report, as in the previous reports, the northeastern Illinois area was analyzed by townships (figure 1) and by 10-year time increments. The potential yields of the shallow aquifers and the groundwater demands by township were assumed to be the same as those reported by Moench and Visocky (1971). In addition, these quantities were estimated for the nine townships of Kendall County and the six northern townships of Grundy County from data available in the files and reports of the State Water Survey. During one phase of this study, the townships of Kendall and Grundy Counties were included as potential sources of water for transport to deficient townships in the basic study area. (Kendall and Grundy Counties lie south of Kane County and west of Will County.)
The costs (adjusted to 1970 dollars) of wells, pumps, and pumping were obtained on an annual basis for each source at each township. The cost of imported water was based on raw water cost at the supply township, plus the cost of overland transport to the deficient township. The costs included the necessary operation, maintenance, and repair expenditures and capital expenditures (amortized over the expected life of the particular component at an interest rate of 6 percent). Since future studies will compare costs of other alternative sources, costs which are common to all sources, such as storage and distribution facilities, were omitted from this analysis. Furthermore, costs of consultants' fees, taxes, and insurance were omitted because similar expenses might be expected for delivery of surface water.
2

Figure 1. Map of study area showing numbered townships and the area supplied by Lake Michigan water
3
The unit cost (cost per million gallons per day) of raw water produced from the shallow aquifers remains constant with time. However, the unit cost of water produced from the deep sandstone aquifers increases with time as the water levels decline. Pumping levels in the deep sandstone aquifers were obtained with the aid of a digital simulation model (Prickett and Lonnquist, 1971). For each township that required deep sandstone pumpage, a single pumping center at the center of the township was assumed. The water-level decline based on the digital simulation model was discretized in a step-wise manner so that the water levels in any 10-year period were constant. This simplified the analysis in that the costs which are dependent on lift are linearly related to demand for each 10-year period of interest.
The cost of treatment was considered separately from the other cost components. Although it was recognized that there are differences in the quality of groundwater depending on location, in this study it was assumed that the cost of treatment is the same everywhere. Imported water was assumed to be treated at the deficient location rather than the source location. Treatment costs for each year of interest included operation, maintenance, and repair expenditures based on the demand at the time increment of interest and capital expenditures based on the future demand of 20 years hence. The future demand was used to account for capacity expansion. For demands rounded to 1 million gallons per day (mgd) the township was assumed to have a single treatment plant. For demands greater than 1 mgd it was assumed to have two treatment plants.
This study was conducted under the general direction of Dr. William C. Ackermann, Chief of the Illinois State Water Survey, and John B. Stall, Head of the Hydrology Section. A number of Water Survey personnel have assisted in the preparation of this report. R. J. Schicht provided general guidance throughout this study. R. A. Sinclair helped to design the general computer program for the cost analysis. T. A. Prickett and C. G. Lonnquist developed the basic digital simulation program for the deep sandstone aquifers. Linda Riggin and John W. Brother, Jr., prepared the illustrations. Mrs. J. L. Ivens and Mrs. P. A. Motherway edited the manuscript. The author has benefited from useful discussions with many Survey personnel, in particular K. P. Singh and A. P. Visocky.
COMPONENT COSTS
Costs of Groundwater Production and Treatment Annual costs of groundwater production were determined for each source at each town
ship from a computer program developed by A. F. Moench (Moench and Visocky, 1971). Additional data were included to allow the calculation of costs for the townships of Kendall and Grundy Counties. Costs of storage and distribution facilities, consultants' fees, taxes, and insurance were omitted because similar expenses might be expected for any water-supply system in the area.
The cost of water from the deep sandstone aquifers depends upon the water levels in the aquifers. Pumping levels in the deep sandstone aquifers were obtained with the aid of a digital simulation model (Prickett and Lonnquist, 1971). For each township which required deep sandstone pumpage, a single pumping center was assumed at the center of the township. The water-level decline based on the digital simulation model was discretized in a step-wise manner so that the water levels in any 10-year period were constant.
4
The treatment costs were also calculated from relationships developed by Moench and Visocky (1971). Regardless of possible variations in groundwater quality with location, it was assumed that the cost of treatment was the same at each township. The costs included operation, maintenance, and repair expenditures based on demand at the year of interest, plus amortized capital expenditures based on the future demand of 20 years hence. It was assumed that raw water would be imported and treated at the deficient locations. Thus, at each year of interest, the treatment costs could be calculated entirely from the projected demands, rather than being based on only that part of the demand which could be produced locally, as was done by Moench and Visocky (1971).
Costs of Importing Water to Eliminate Deficits The cost of groundwater imported to eliminate a deficit at a given township has three
basic components: 1) cost of production at the source township, 2) cost of transmission to the deficient township, and 3) cost of treatment. As mentioned above, the treatment cost was based only on the total demand, regardless of source, and thus was not influenced by the necessity of groundwater importation. The cost of importing water, therefore, applies only to the total raw water cost. The annual unit cost, Ci, in dollars per million gallons per day, of raw water obtained from the deep sandstone aquifers at the source township i was given by the computer program developed by Moench (Moench and Visocky, 1971). Thus the total annual cost of producing water at township i to supply a deficit Dj to township j is given by
(1) To this cost must be added the total annual cost, Tij, of transmitting the quantity of water Dj from township i to township j by way of a pipeline. The total cost of imported raw water, Pij
+ Tij, is charged to the deficient township, j. The transmission cost, Tij, depends on a number of factors, including length and size of
the transmission line, quantity of water transported, and elevation difference between the ends of the line, as well as such things as interest and power rates. The transmission costs used in the present study were calculated by means of a computer program incorporating the appropriate cost functions.
Idealized Transmission Network. The cost of transmitting water between two points depends quite strongly on the distance between those points. In the present study, it was assumed that water would be transmitted between the centers of two different townships. In an urban and suburban area such as northeastern Illinois, it is probably most feasible to construct transmission mains along the existing rights-of-way of highways, streets, and railways.
For the purposes of this study, an idealized network of potential transmission paths was postulated on the basis of the pattern of existing streets and railways in the area. The net-work consisted of an east-west line and a north-south line passing through the center of each township, as well as a system of lines radiating out from a point in downtown Chicago to the center of each township. The potential transmission path between two townships was then chosen to be the shortest path which could be constructed along elements of this network.
In general, four paths are possible between the centers of two townships (figure 2). The coordinates (Xi, Yi) of the center of each township were determined in miles with reference to an origin located at the center of township 1. The coordinates of the point in downtown Chicago, designated as (Xc,Yc), were also determined in the same system. In terms of these
5
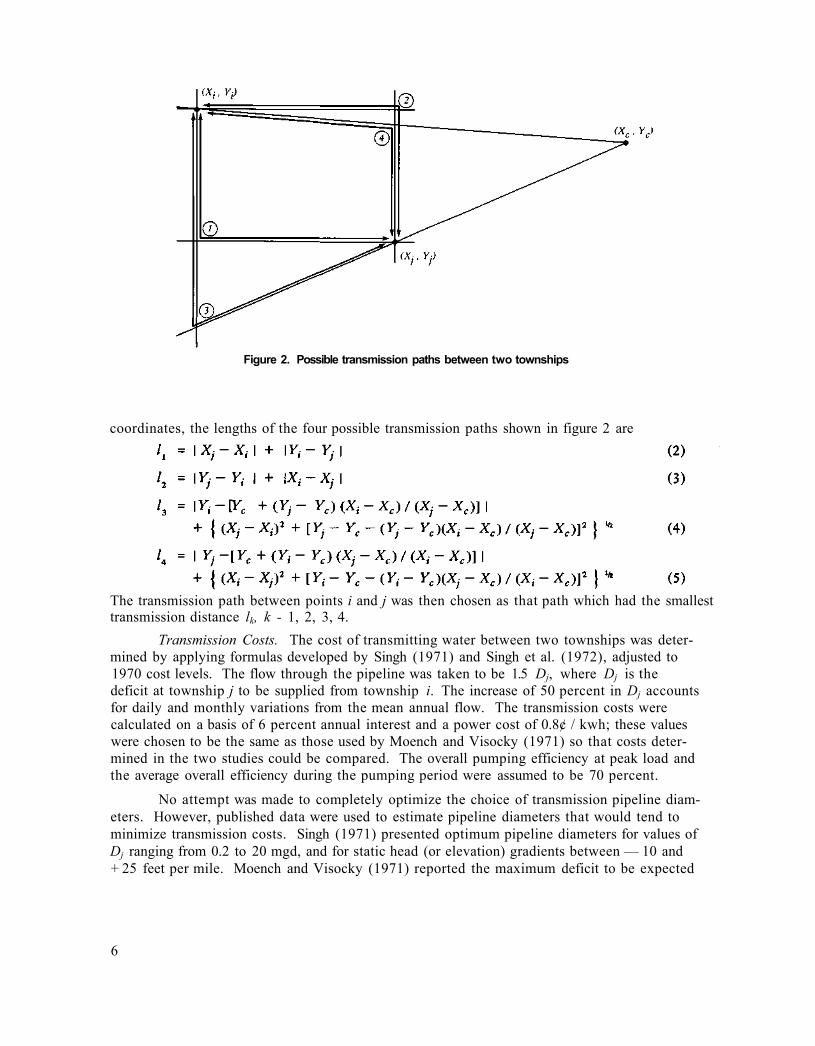
Figure 2. Possible transmission paths between two townships
coordinates, the lengths of the four possible transmission paths shown in figure 2 are
The transmission path between points i and j was then chosen as that path which had the smallest transmission distance lk, k - 1, 2, 3, 4.
Transmission Costs. The cost of transmitting water between two townships was determined by applying formulas developed by Singh (1971) and Singh et al. (1972), adjusted to 1970 cost levels. The flow through the pipeline was taken to be 1.5 Dj, where Dj is the deficit at township j to be supplied from township i. The increase of 50 percent in Dj accounts for daily and monthly variations from the mean annual flow. The transmission costs were calculated on a basis of 6 percent annual interest and a power cost of 0.8¢ / kwh; these values were chosen to be the same as those used by Moench and Visocky (1971) so that costs determined in the two studies could be compared. The overall pumping efficiency at peak load and the average overall efficiency during the pumping period were assumed to be 70 percent.
No attempt was made to completely optimize the choice of transmission pipeline diameters. However, published data were used to estimate pipeline diameters that would tend to minimize transmission costs. Singh (1971) presented optimum pipeline diameters for values of Dj ranging from 0.2 to 20 mgd, and for static head (or elevation) gradients between — 10 and + 25 feet per mile. Moench and Visocky (1971) reported the maximum deficit to be expected
6
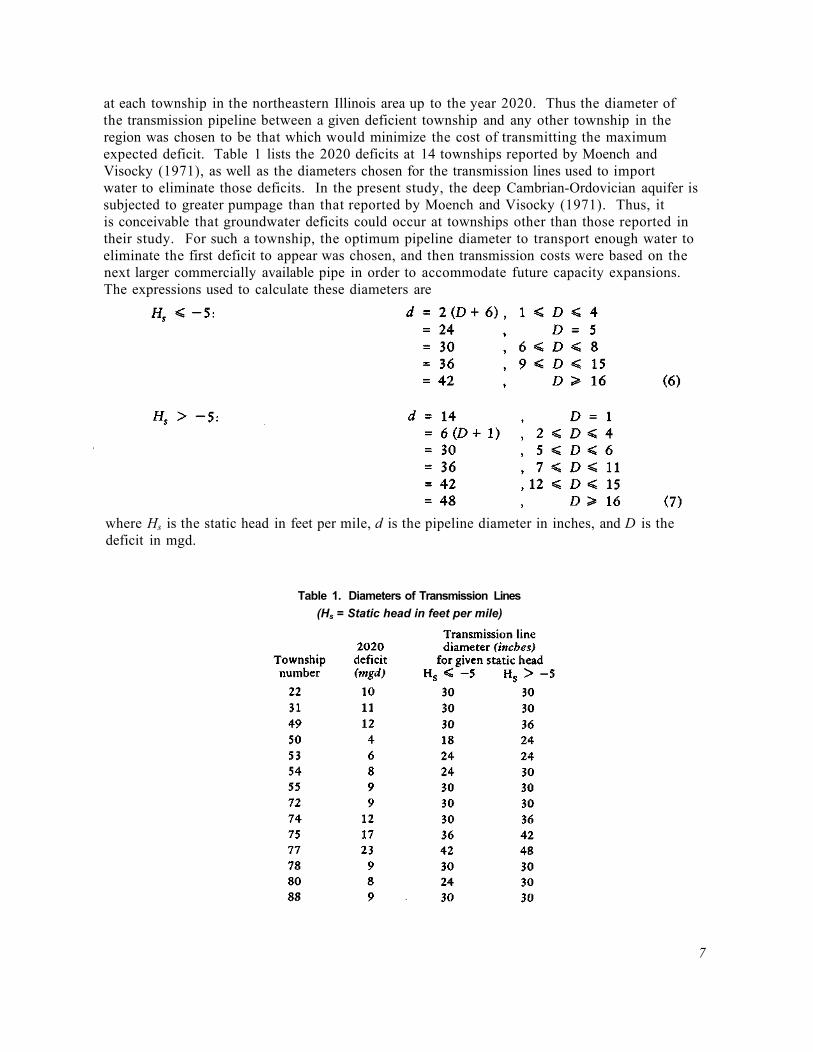
at each township in the northeastern Illinois area up to the year 2020. Thus the diameter of the transmission pipeline between a given deficient township and any other township in the region was chosen to be that which would minimize the cost of transmitting the maximum expected deficit. Table 1 lists the 2020 deficits at 14 townships reported by Moench and Visocky (1971), as well as the diameters chosen for the transmission lines used to import water to eliminate those deficits. In the present study, the deep Cambrian-Ordovician aquifer is subjected to greater pumpage than that reported by Moench and Visocky (1971). Thus, it is conceivable that groundwater deficits could occur at townships other than those reported in their study. For such a township, the optimum pipeline diameter to transport enough water to eliminate the first deficit to appear was chosen, and then transmission costs were based on the next larger commercially available pipe in order to accommodate future capacity expansions. The expressions used to calculate these diameters are
where Hs is the static head in feet per mile, d is the pipeline diameter in inches, and D is the deficit in mgd.
Table 1. Diameters of Transmission Lines (Hs = Static head in feet per mile)
7

LEAST COST COMPUTATIONAL PROCEDURE
The procedure used in the present study to determine the least expensive source of water for a given township was a direct extension of that used by Moench and Visocky (1971). The cost per million gallons per day of water from the sand and gravel, Silurian dolomite, and deep sandstone aquifers was first determined for each township. The least expensive source of water at a given township was used to its fullest potential, then the next least expensive, and so on. In general, the full potential yields of the shallow aquifers were used, and the remaining demand for a given township was supplied from the deep sandstone aquifers. When the water level in the deep sandstone aquifers declined to the top of the Ironton-Galesville Formation, the deep pumpage in that township was reduced so that the water level remained at the top of the Ironton-Galesville. The resulting groundwater deficit was eliminated by importation of deep sandstone water from neighboring townships.
The cost of eliminating the deficits was minimized separately for each deficient township. For a given deficient township, each other township in the study area, except those which had deficits themselves or were projected to develop deficits, was considered in turn. Because of the economy of scale in transmission costs, it was assumed that a single source would serve to eliminate the entire deficit. The source township was chosen as that which gave the lowest cost of importation (cost of production at the source plus cost of transmission). That is, the minimum cost, Mj, of supplying the deficit Dj is given by
(8) where Ci is the cost per mgd of deep sandstone water at the source township i, and Tij is the cost of transmitting the water from township i to township j.
When township i has been determined to be the least expensive source for township j, the total pumpage from the deep sandstone aquifer for the next 10-year period at township i is given by Qi + Dj, where Qi is the pumpage needed to supply the local demand at the source township i. At subsequent times, deficits at township j continue to be met by importation from township i, even though an alternate township might appear able to supply water for importation at less cost. This decision was based on an analysis of data presented by Singh (1971), with the use of typical values of quantity of flow and pipeline length and diameter from the present study. This analysis indicated that pipeline construction costs generally make up more than 60 percent of the total transmission cost for a given line. Since a water transmission pipe can have a useful life of 100 years or more, it was assumed to be uneconomical to abandon or replace a pipeline within 10 or 20 years of its construction.
Treatment of the imported water was assumed to take place at the deficient location rather than the supply location. This was done in order to take advantage of the economy of scale in treatment costs, thus partially offsetting the added raw water cost at the deficient location due to the need to import groundwater. This approach also allowed the treatment costs to be based entirely on the demand and the future demand at the deficient township.
8
RESULTS AND DISCUSSION
Two series of calculations were made, corresponding to two different plans of eliminating groundwater deficits. In the first plan it was assumed that deficits could be eliminated only by importing water from townships which themselves required pumpage from the deep sandstone aquifers, i.e., no deep wells would be drilled in one township expressly for the purpose of furnishing water to a second township.
In the second plan it was assumed that every township in the six-county northeastern Illinois region, as well as townships in Kendall County and the northern half of Grundy County, were potential sources of deep groundwater for importation to other townships with 2 exceptions. In both plans, the city of Chicago and those townships identified as deficient locations by Moench and Visocky (1971) were excluded as sources of deep sandstone water for importation.
Unit Costs to Individual Townships The unit costs (in cents per thousand gallons) of raw and treated water were calculated
at each township in the study area for each year of interest. The costs were compared with those reported by Moench and Visocky (1971), and it was found that in 75 townships there was no change in unit costs for either plan of development. In another 12 townships, there were some differences of 1¢/1000 gallons, although these differences were the result of rounding to the nearest cent per thousand gallons, and thus are not really significant. In the remaining 17 townships, significant changes in unit costs were noted.
Table 2 lists the unit costs for those townships at which the importation of groundwater resulted in significant changes in unit costs. For each year of interest, the table gives the unit costs reported by Moench and Visocky (1971) as well as the costs determined for the two plans of development in the present study. It is apparent that eliminating groundwater deficits by importing water from the deep sandstone aquifers produces relatively little increase in the unit costs, with a maximum increase in raw water cost of 4 ¢/1000 gallons (townships 75 and 78 in 2020), and a maximum increase in treated water cost of 2¢/1000 gallons (townships 74 and 77 in 2000, townships 54 and 55 in 2010, and township 30 in 2020). In fact, at some deficient townships, as the raw water cost increases because of the additional cost of importing water, the treated water cost actually decreases because of the economy of scale in water treatment costs. The costs reported by Moench and Visocky (1971) were based on treatment for only that portion of the groundwater demand which could be supplied locally, whereas in the present study, the costs were based on treatment of the entire groundwater demand.
Three of the townships listed in table 2 (townships 30, 73, and 76) were sources of groundwater supply to nearby deficient townships. These townships generally show slight increases of 1 or 2¢/1000 gallons in both raw and treated water costs. These increases can be attributed to increased pumping costs due to greater water level declines in the deep sandstone aquifers, caused by the increased pumpage needed to supply groundwater to neighboring deficient townships.
9
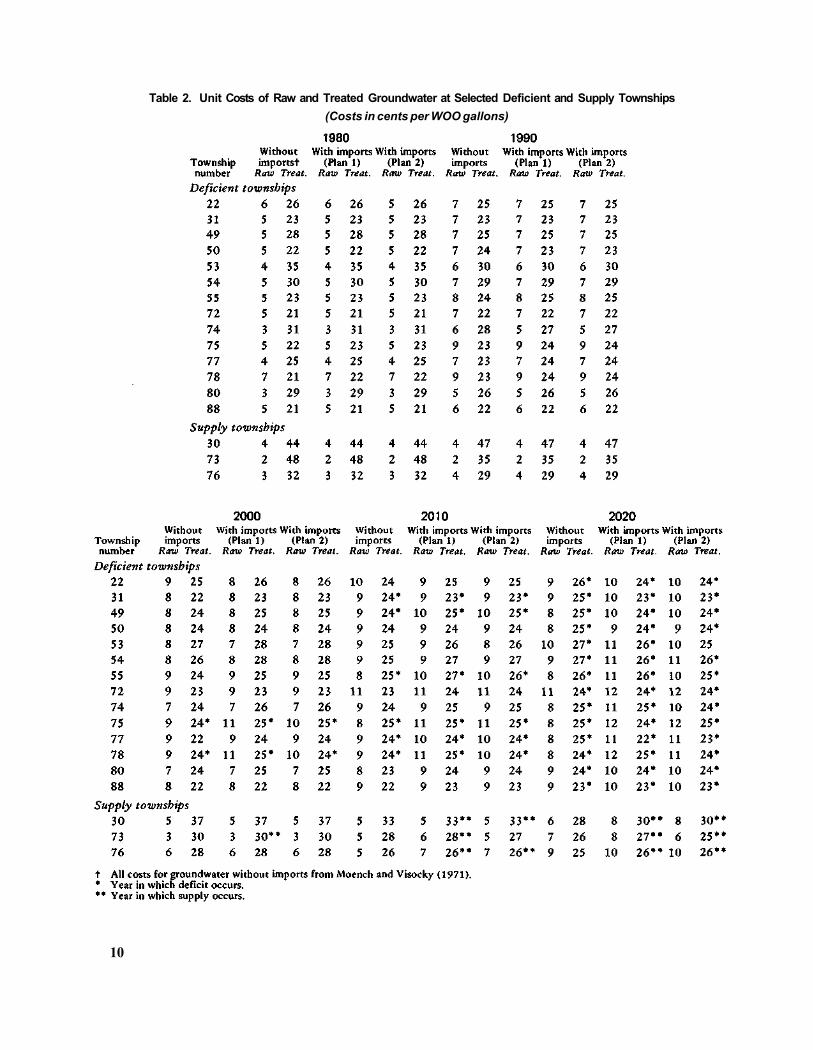
Table 2. Unit Costs of Raw and Treated Groundwater at Selected Deficient and Supply Townships (Costs in cents per WOO gallons)
10
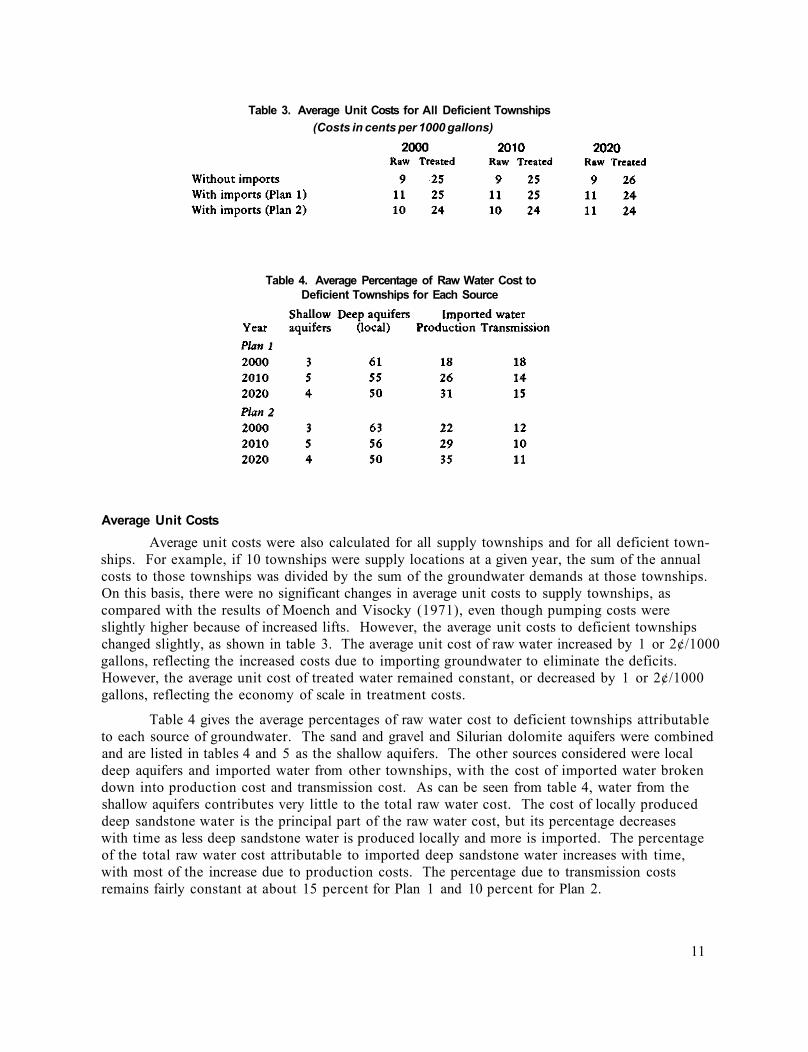
Table 3. Average Unit Costs for All Deficient Townships (Costs in cents per 1000 gallons)
Table 4. Average Percentage of Raw Water Cost to Deficient Townships for Each Source
Average Unit Costs Average unit costs were also calculated for all supply townships and for all deficient town
ships. For example, if 10 townships were supply locations at a given year, the sum of the annual costs to those townships was divided by the sum of the groundwater demands at those townships. On this basis, there were no significant changes in average unit costs to supply townships, as compared with the results of Moench and Visocky (1971), even though pumping costs were slightly higher because of increased lifts. However, the average unit costs to deficient townships changed slightly, as shown in table 3. The average unit cost of raw water increased by 1 or 2¢/1000 gallons, reflecting the increased costs due to importing groundwater to eliminate the deficits. However, the average unit cost of treated water remained constant, or decreased by 1 or 2¢/1000 gallons, reflecting the economy of scale in treatment costs.
Table 4 gives the average percentages of raw water cost to deficient townships attributable to each source of groundwater. The sand and gravel and Silurian dolomite aquifers were combined and are listed in tables 4 and 5 as the shallow aquifers. The other sources considered were local deep aquifers and imported water from other townships, with the cost of imported water broken down into production cost and transmission cost. As can be seen from table 4, water from the shallow aquifers contributes very little to the total raw water cost. The cost of locally produced deep sandstone water is the principal part of the raw water cost, but its percentage decreases with time as less deep sandstone water is produced locally and more is imported. The percentage of the total raw water cost attributable to imported deep sandstone water increases with time, with most of the increase due to production costs. The percentage due to transmission costs remains fairly constant at about 15 percent for Plan 1 and 10 percent for Plan 2.
11
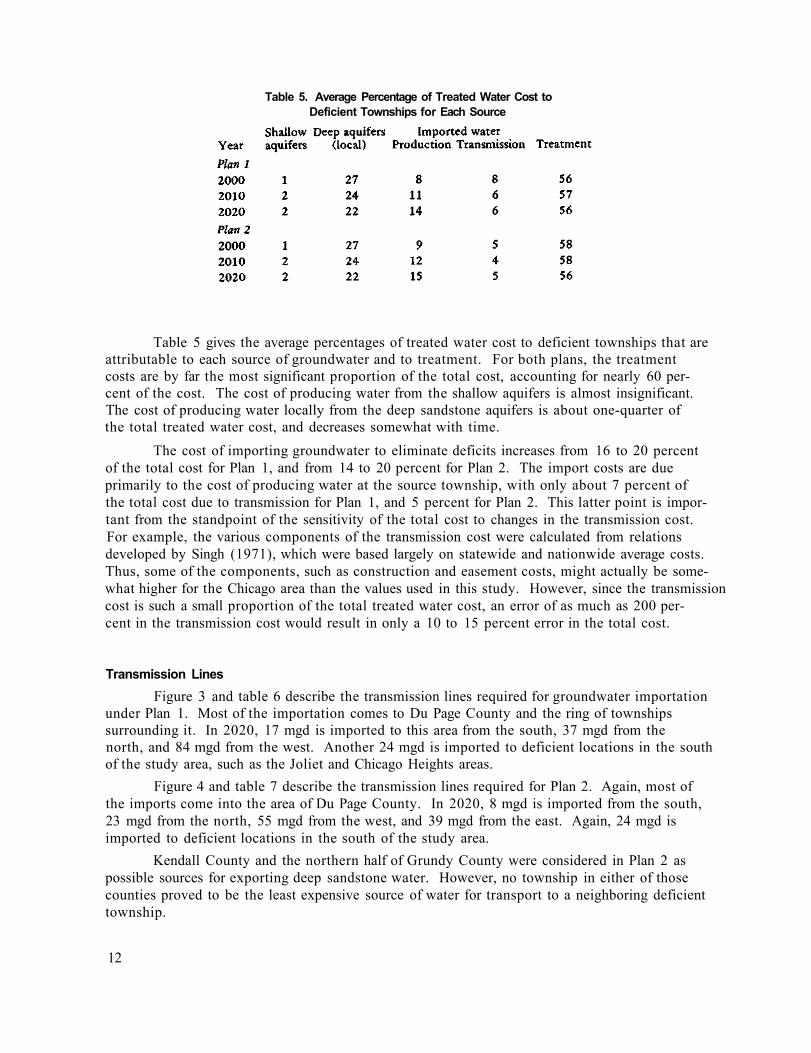
Table 5. Average Percentage of Treated Water Cost to Deficient Townships for Each Source
Table 5 gives the average percentages of treated water cost to deficient townships that are attributable to each source of groundwater and to treatment. For both plans, the treatment costs are by far the most significant proportion of the total cost, accounting for nearly 60 percent of the cost. The cost of producing water from the shallow aquifers is almost insignificant. The cost of producing water locally from the deep sandstone aquifers is about one-quarter of the total treated water cost, and decreases somewhat with time.
The cost of importing groundwater to eliminate deficits increases from 16 to 20 percent of the total cost for Plan 1, and from 14 to 20 percent for Plan 2. The import costs are due primarily to the cost of producing water at the source township, with only about 7 percent of the total cost due to transmission for Plan 1, and 5 percent for Plan 2. This latter point is important from the standpoint of the sensitivity of the total cost to changes in the transmission cost. For example, the various components of the transmission cost were calculated from relations developed by Singh (1971), which were based largely on statewide and nationwide average costs. Thus, some of the components, such as construction and easement costs, might actually be somewhat higher for the Chicago area than the values used in this study. However, since the transmission cost is such a small proportion of the total treated water cost, an error of as much as 200 percent in the transmission cost would result in only a 10 to 15 percent error in the total cost.
Transmission Lines Figure 3 and table 6 describe the transmission lines required for groundwater importation
under Plan 1. Most of the importation comes to Du Page County and the ring of townships surrounding it. In 2020, 17 mgd is imported to this area from the south, 37 mgd from the north, and 84 mgd from the west. Another 24 mgd is imported to deficient locations in the south of the study area, such as the Joliet and Chicago Heights areas.
Figure 4 and table 7 describe the transmission lines required for Plan 2. Again, most of the imports come into the area of Du Page County. In 2020, 8 mgd is imported from the south, 23 mgd from the north, 55 mgd from the west, and 39 mgd from the east. Again, 24 mgd is imported to deficient locations in the south of the study area.
Kendall County and the northern half of Grundy County were considered in Plan 2 as possible sources for exporting deep sandstone water. However, no township in either of those counties proved to be the least expensive source of water for transport to a neighboring deficient township.
12
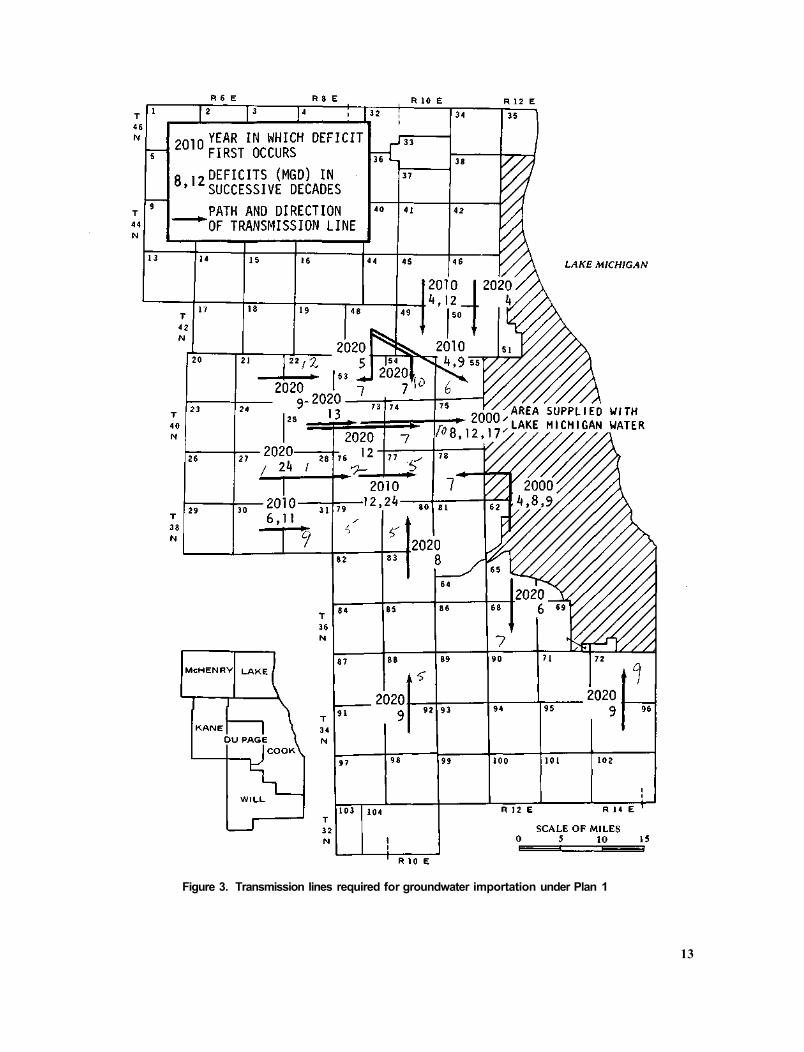
Figure 3. Transmission lines required for groundwater importation under Plan 1
13

Table 6. Transmission Lines Required for Groundwater Importation under Plan 1
Table 7. Transmission Lines Required for Groundwater Importation under Plan 2
14
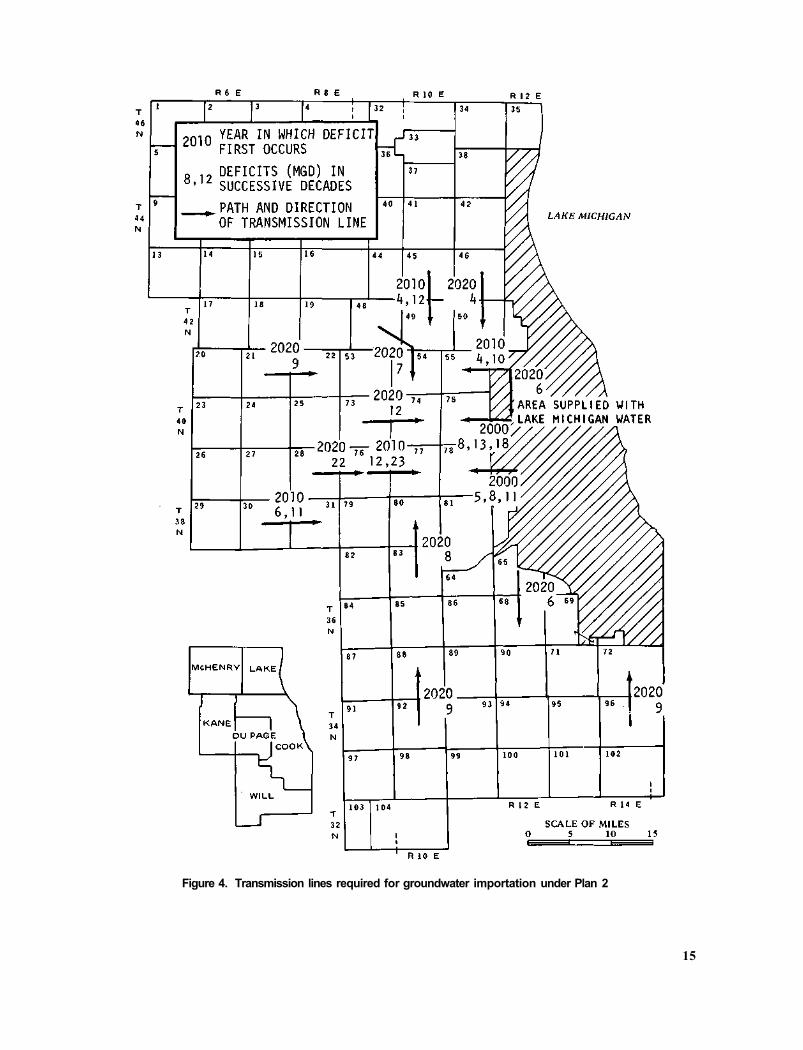
Figure 4. Transmission lines required for groundwater importation under Plan 2
15
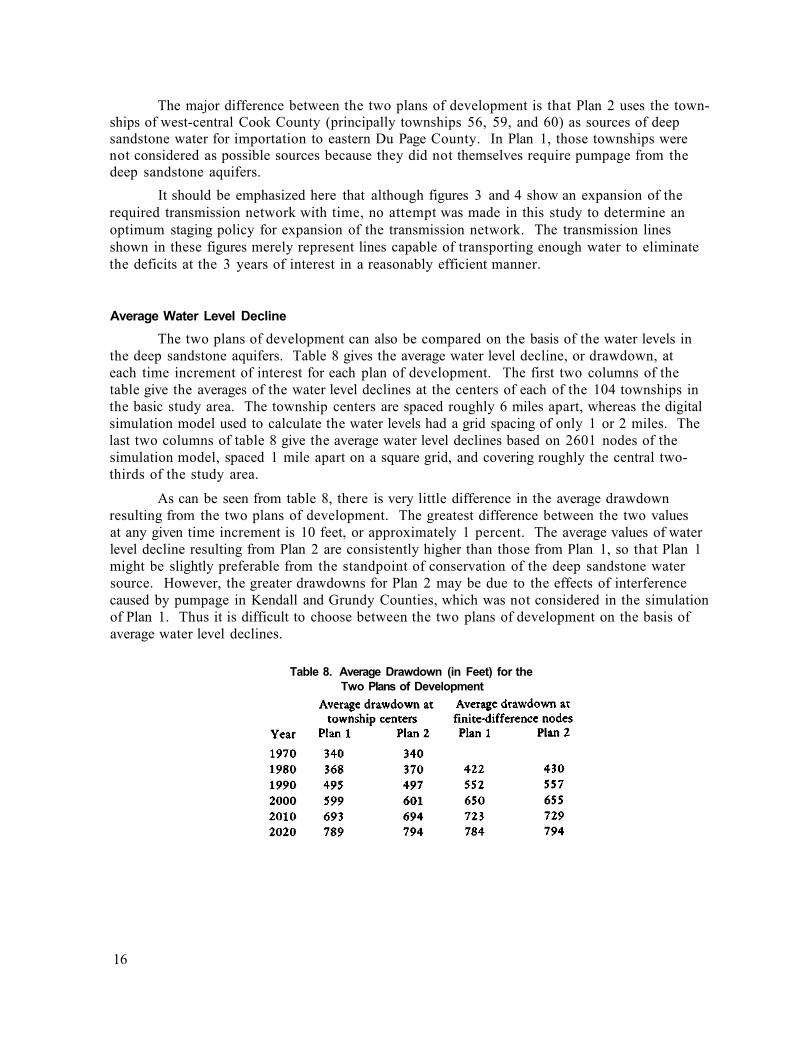
The major difference between the two plans of development is that Plan 2 uses the townships of west-central Cook County (principally townships 56, 59, and 60) as sources of deep sandstone water for importation to eastern Du Page County. In Plan 1, those townships were not considered as possible sources because they did not themselves require pumpage from the deep sandstone aquifers.
It should be emphasized here that although figures 3 and 4 show an expansion of the required transmission network with time, no attempt was made in this study to determine an optimum staging policy for expansion of the transmission network. The transmission lines shown in these figures merely represent lines capable of transporting enough water to eliminate the deficits at the 3 years of interest in a reasonably efficient manner.
Average Water Level Decline The two plans of development can also be compared on the basis of the water levels in
the deep sandstone aquifers. Table 8 gives the average water level decline, or drawdown, at each time increment of interest for each plan of development. The first two columns of the table give the averages of the water level declines at the centers of each of the 104 townships in the basic study area. The township centers are spaced roughly 6 miles apart, whereas the digital simulation model used to calculate the water levels had a grid spacing of only 1 or 2 miles. The last two columns of table 8 give the average water level declines based on 2601 nodes of the simulation model, spaced 1 mile apart on a square grid, and covering roughly the central two-thirds of the study area.
As can be seen from table 8, there is very little difference in the average drawdown resulting from the two plans of development. The greatest difference between the two values at any given time increment is 10 feet, or approximately 1 percent. The average values of water level decline resulting from Plan 2 are consistently higher than those from Plan 1, so that Plan 1 might be slightly preferable from the standpoint of conservation of the deep sandstone water source. However, the greater drawdowns for Plan 2 may be due to the effects of interference caused by pumpage in Kendall and Grundy Counties, which was not considered in the simulation of Plan 1. Thus it is difficult to choose between the two plans of development on the basis of average water level declines.
Table 8. Average Drawdown (in Feet) for the Two Plans of Development
16
CONCLUSIONS
This study has shown that the groundwater resources available in northeastern Illinois should be adequate to meet the demands of the area until 2020, if mining of water from the deep sandstone aquifers is continued. The importation of deep sandstone water from nearby townships can be used to eliminate groundwater deficits that result from limiting pumpage so that the water levels remain at or above the top of the Ironton-Galesville Formation. Such importation significantly increases the cost of raw water to deficient townships, but produces relatively little increase in the cost of treated water.
The results of this study are based on gross average figures for each township in the study area, and cannot be applied to specific schemes of development. However, by comparison with the study by Moench and Visocky (1971), the results presented here should give reasonably accurate estimates of the cost of eliminating groundwater deficits with imported deep sandstone water. It was found that the maximum increase in raw water cost to a deficient township was 4¢/1000 gallons, while the maximum increase in treated water cost was 20/1000 gallons. The average cost of imported water made up 3 5 to 45 percent of the raw water cost to deficient townships, but only 15 to 20 percent of the treated water cost.
The cost of imported raw water had two basic components, production of water at the source township and transmission from the source township to the deficient township. The production cost was generally the more significant component, ranging on the average from 50 to 75 percent of the cost of imported raw water. The transmission cost proved to be a relatively small cost component, ranging on the average from 10 to 18 percent of the total raw water cost, and from 4 to 8 percent of the total treated water cost. Because of the relatively low transmission cost, it is felt that the lack of a detailed staging policy for expansion of the transmission system does not seriously reduce the accuracy of the resulting unit costs of treated groundwater.
REFERENCES Moench, A. F., and A. P. Visocky. 1971. A preliminary 'least cost' study of future
groundwater development in northeastern Illinois. Illinois State Water Survey Circular 102.
Prickett, T. A., and C. G. Lonnquist. 1971. Selected digital computer techniques for groundwater resource evaluation. Illinois State Water Survey Bulletin 55.
Schicht, R. J., and A. F. Moench. 1971. Projected groundwater deficiencies in northeastern Illinois, 1980-2020. Illinois State Water Survey Circular 101.
Singh, K. P. 1971. Economic design of central water supply systems for medium sized towns. Illinois State Water Survey Reprint Series 170.
Singh, K. P., A. P. Visocky, and C. G. Lonnquist. 1972. Plans for meeting water requirements in the Kaskaskia River basin, 1970-2020. Illinois State Water Survey Report of Investigation 70.
Printed by authority of the State of Illinois — Ch. 127, IRS, Par. 58.29 (11-74-1500)
17
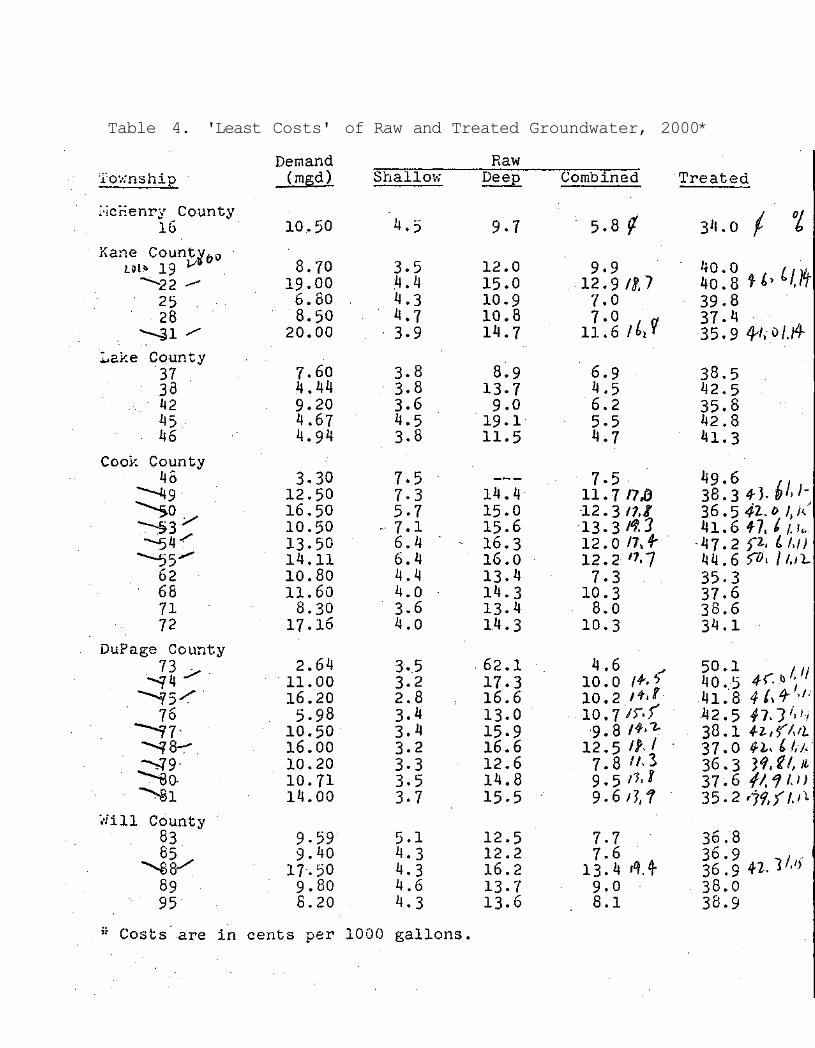
Table 4. 'Least Costs' of Raw and Treated Groundwater, 2000*