Cost of Capital 11 Chapter Copyright © 2011 by The McGraw-Hill Companies, Inc. All rights reserved....
40
Cost of Capital 11 Chapte r Copyright © 2011 by The McGraw-Hill Companies, Inc. All rights reserved. McGraw-Hill/Irwin
-
Upload
darcy-reynolds -
Category
Documents
-
view
216 -
download
3
Transcript of Cost of Capital 11 Chapter Copyright © 2011 by The McGraw-Hill Companies, Inc. All rights reserved....

Cost of Capital
11Chapter
Copyright © 2011 by The McGraw-Hill Companies, Inc. All rights reserved.McGraw-Hill/Irwin

11-2
Chapter Outline
• Cost of capital and its importance
• Discount rates used to analyze investments
• Valuation and application to bonds, preferred stock, and common stock
• Minimum cost of capital
• Increase in cost of capital with increase in utilization of finances
11-3
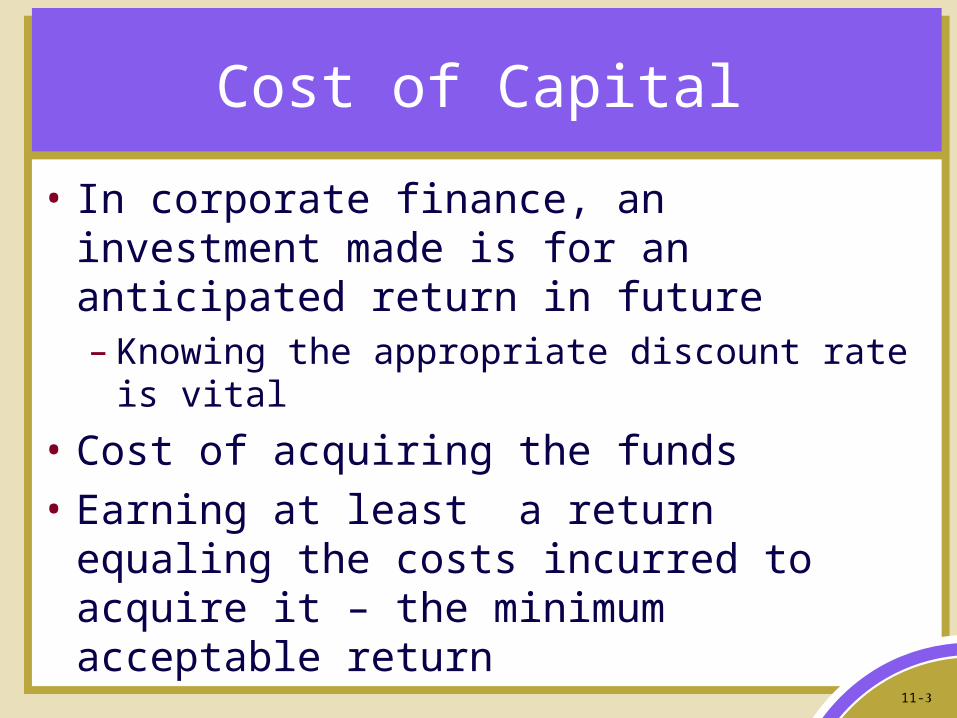
Cost of Capital
• In corporate finance, an investment made is for an anticipated return in future– Knowing the appropriate discount rate is vital
• Cost of acquiring the funds
• Earning at least a return equaling the costs incurred to acquire it – the minimum acceptable return

11-4
The Overall Concept
• An investment: – Should not be judged against the specific means
of financing used to implement it• This would make investment selection decisions
inconsistent
– With a low-cost debt must be chosen carefully• May result in increase of the overall risk• May make all eventual forms of financing more
expensive

11-5
Determination of Cost of Capital
• Best understood by capital structure of a firm• The after-tax costs of the individual sources of
financing are multiplied by the weights assigned to them
• Sum of all these gives the weighted average cost

11-6
Cost of Debt
• Measured by interest rate, or yield, paid to bondholders– Example: $1,000 bond paying $100 annual
interest – 10% yield– Calculation is complex if a bond is priced at
discount or premium from par value
• To determine the cost of a new debt in the marketplace:– The firm will compute the yield on its currently
outstanding debt

11-7
Approximate Yield to Maturity (Y')
Annual interest payment + Number of years to maturity 0.6 (Price of the bond) + 0.4 (Principal payment)• Assuming: Annual interest payment = $101.50; Principal payment =
$1,000; Price of the bond = $940; Number of years to maturity = 20
Y' = $101. 50 + 20 .6 ($940) + .4 ($1,000) = $101.50 + 20 $564 + $400 Y’ = $101.50 + 3 = $104.50 = 10.84% $964 $964
Principal payment – Price of the bond
$1,000 - $940
60
11-8
Adjusting Yield for Tax Considerations
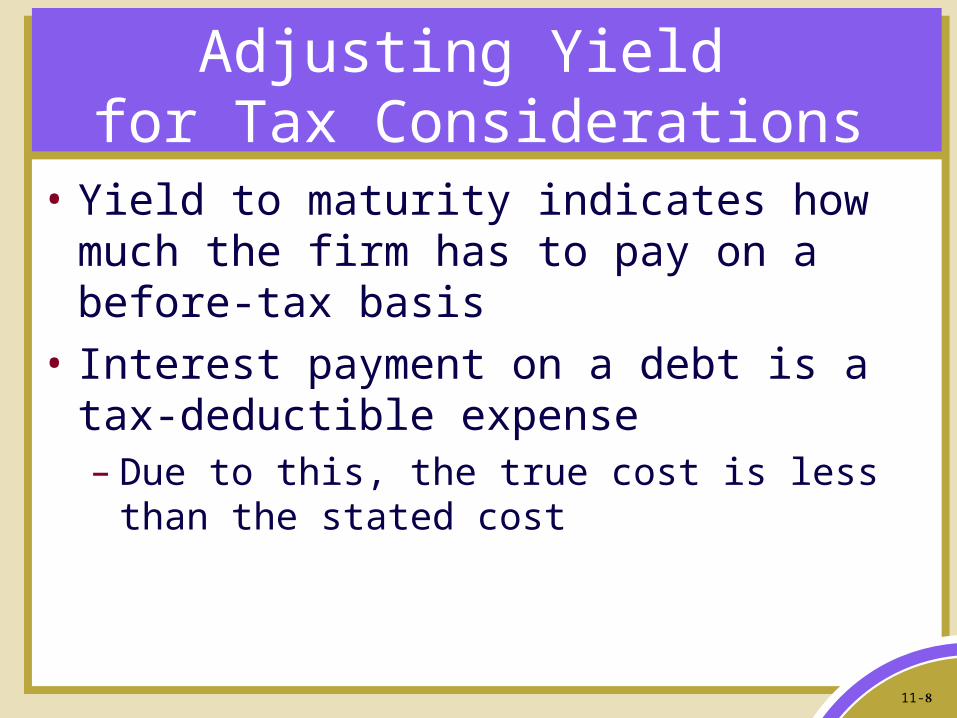
• Yield to maturity indicates how much the firm has to pay on a before-tax basis
• Interest payment on a debt is a tax-deductible expense– Due to this, the true cost is less than the stated
cost
11-9
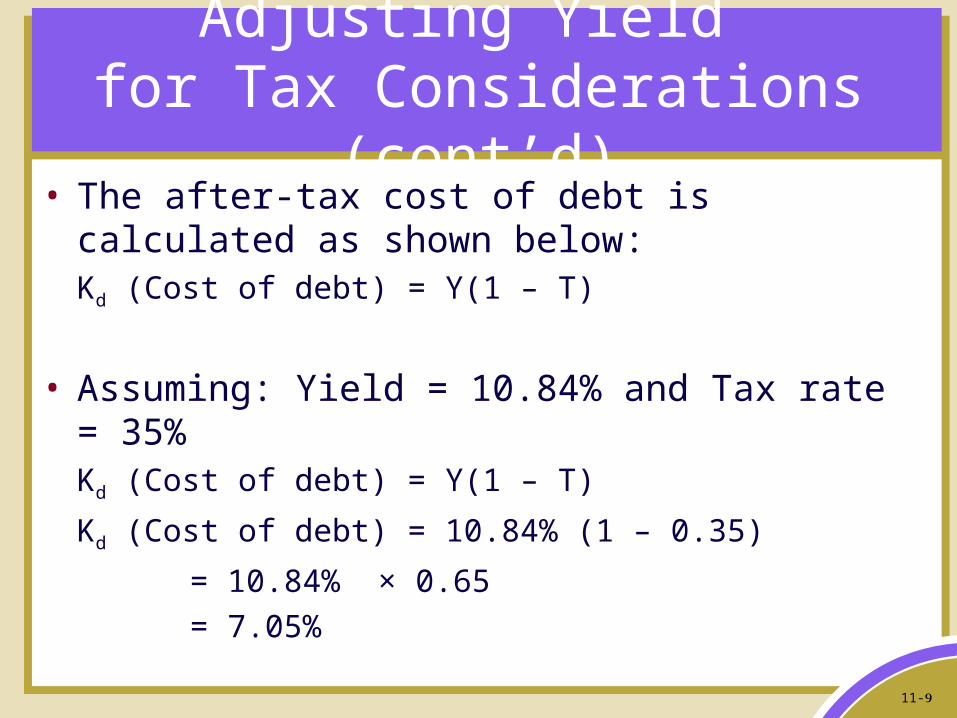
Adjusting Yield for Tax Considerations (cont’d)
• The after-tax cost of debt is calculated as shown below:
Kd (Cost of debt) = Y(1 – T)
• Assuming: Yield = 10.84% and Tax rate = 35%Kd (Cost of debt) = Y(1 – T)
Kd (Cost of debt) = 10.84% (1 – 0.35)
= 10.84% × 0.65
= 7.05%

11-10
Cost of Preferred Stock
• A constant annual payment with no maturity date for the principal payment– Computed by dividing dividend payment by net
price or proceeds received• Represents the rate of return to preferred
stockholders and annual cost to corporation for issue
– Preferred stock dividend is not a tax-deductible expense, with no downward tax adjustment
• The proceeds to the firm equals selling price in the market minus flotation cost
11-11
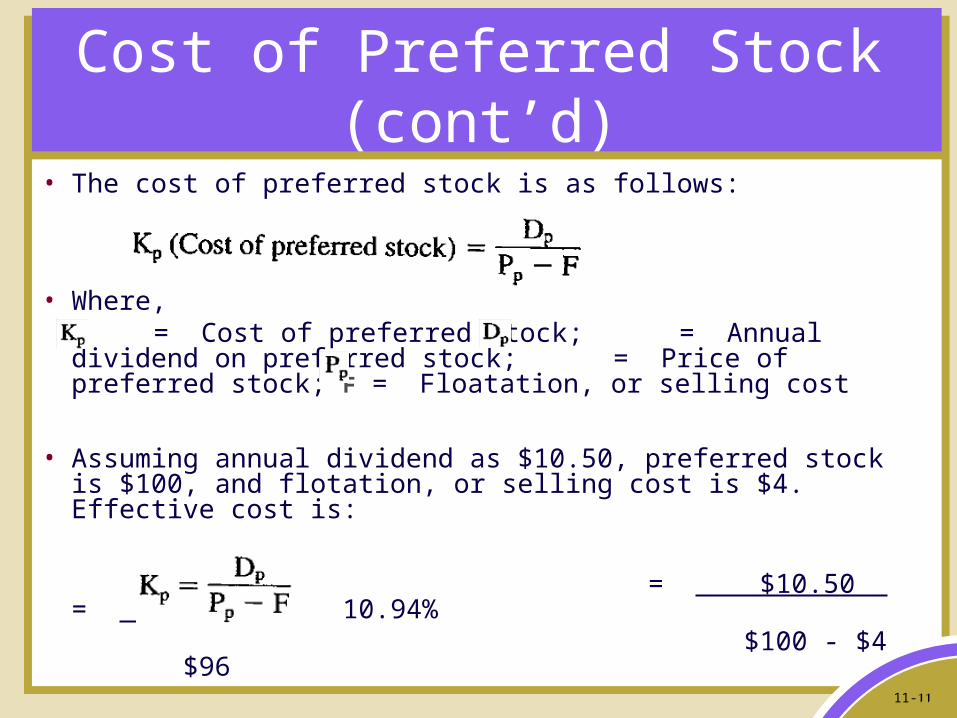
Cost of Preferred Stock (cont’d)
• The cost of preferred stock is as follows:
• Where, = Cost of preferred stock; = Annual dividend on
preferred stock; = Price of preferred stock; F = Floatation, or selling cost
• Assuming annual dividend as $10.50, preferred stock is $100, and flotation, or selling cost is $4. Effective cost is:
= $10.50 = $10.50 = 10.94% $100 - $4 $96

11-12
Cost of Common Equity – Valuation Approach
• In determining the cost of common stock, the firm must be sensitive to pricing and performance demands of current and future stockholders
• Dividend valuation model:
• Where,
= Price of the stock today; = Dividend at the end of the year (or period); = Required rate of return; g = Constant growth rate in dividends
• Assuming = $2; = $40 and g = 7%, equals 12 percent
= $2 + 7% = 5% + 7% = 12%
$40

11-13
Alternate Calculation of the Required Return on Common Stock
• Capital asset pricing model (CAPM)
• Where:
= Required return on common stock; = Risk-free rate of return, usually the current rate on Treasury bill securities; = Beta coefficient (measures the historical volatility of an individual stock’s return relative to a stock market index; = return in the market as measured by an approximate index
• Assuming = 5.5%, = 12%, = 1.0, would be:
= 5.5% + 1.0 (12% - 5.5%) = 5.5% + 1.0 (6.5%)
= 5.5% + 6.5% = 12%

11-14
Cost of Retained Earnings
• Sources of capital for common stock equity: – Purchaser of the new shares – external source– Retained earnings – internal source
• Represent the present and past earnings of the firm minus previously distributed dividends
• Belong to the current stockholders – may be paid in the form of dividends or reinvested in the firm
• Reinvestments represent a source of equity capital supplied by the current stockholders
• An opportunity cost is involved

11-15
Cost of Retained Earnings (cont’d)
• The cost of retained earnings is equivalent to the rate of return on the firm’s common cost representing the opportunity cost
• represents both the required rate of return on common stock, and the cost of equity in the form of retained earnings
• Assuming:
= Cost of common equity in the form of retained earnings
= Dividend at the end of the first year, $2
= Price of stock today, $40
g = Constant growth rate in dividends, 7%
= $2 + 7% = 5% + 7% = 12%
$40

11-16
Cost of New Common Stock
• A slightly higher return than , representing the required rate of return of present stockholders, is expected– Needed to cover the distribution costs of the
new securities
Cost of common equity in the form of retained earnings =
Cost of new common stock

11-17
Cost of New Common Stock (cont’d)
• Assuming = $2, = $40, F (Flotation or selling costs) = $4 and g = 7%;
= $2 + 7%
$40 - $4
= $2 + 7%
$36
= 5.6% + 7% = 12.6%

11-18
Optimal Capital Structure – Weighting Costs
• The desire to achieve a minimum overall cost of capital– Calculated decisions are required on the
appropriate weights for:• Debt• Preferred stock• Common stock financing
– Capital mix is determined by:• Considering the present capital structure• Ascertaining if the current position is optimal

11-19
Optimal Capital Structure – Weighting Costs (cont’d)
• Assessment of different plans:– Firm is able to initially reduce weighted average cost of capital with debt financing– Beyond Plan B, continued use of debt becomes unattractive and greatly increases
costs of sources of financing
Cost (After-tax) Weights Weighted CostFinancial Plan A:Debt………………………… 6.5% 20% 1.3%Equity………………………. 12.0 80 9.6 10.9%Financial Plan B:Debt………………………… 7.0% 40% 2.8%Equity………………………. 12.5 60 7.5 10.3%Financial Plan C:Debt………………………… 9.0% 60% 5.4%Equity………………………. 15.0 40 6.0 11.4%

11-20
Cost of Capital Curve
11-21
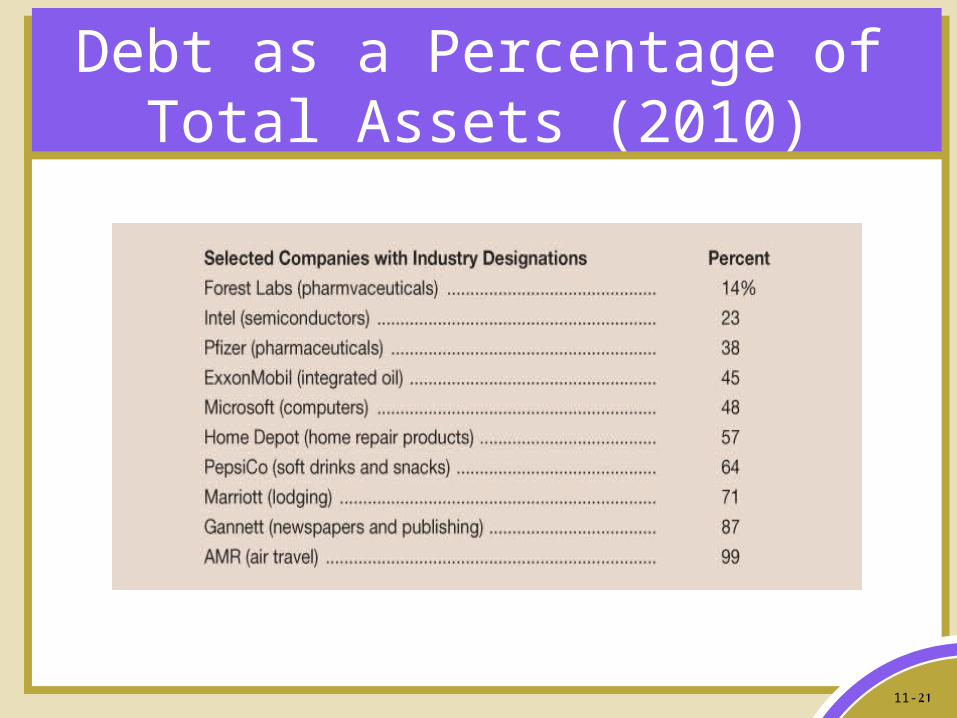
Debt as a Percentage of Total Assets (2010)

11-22
Capital Acquisition and Investment Decision Making
• Financial capital consists of bonds, preferred stock, and common equity– Money raised by sale of these securities and
retained earnings is invested in:• The real capital of the firm, the long-term productive
assets of plant and equipment
– To minimize cost of equity, a firm may sell common stock when prices are relatively high
– A balance between debt and equity is required to achieve minimum cost of capital

11-23
Cost of Capital Over Time

11-24
Cost of Capital in the Capital Budgeting Decision
• Current cost of capital for each source of funds is important for capital budgeting decision– The required rate of return will be the weighted
average cost of capital– The common stock value of the firm will be
maintained or will increase, as long as the firm earns its cost of capital
11-25
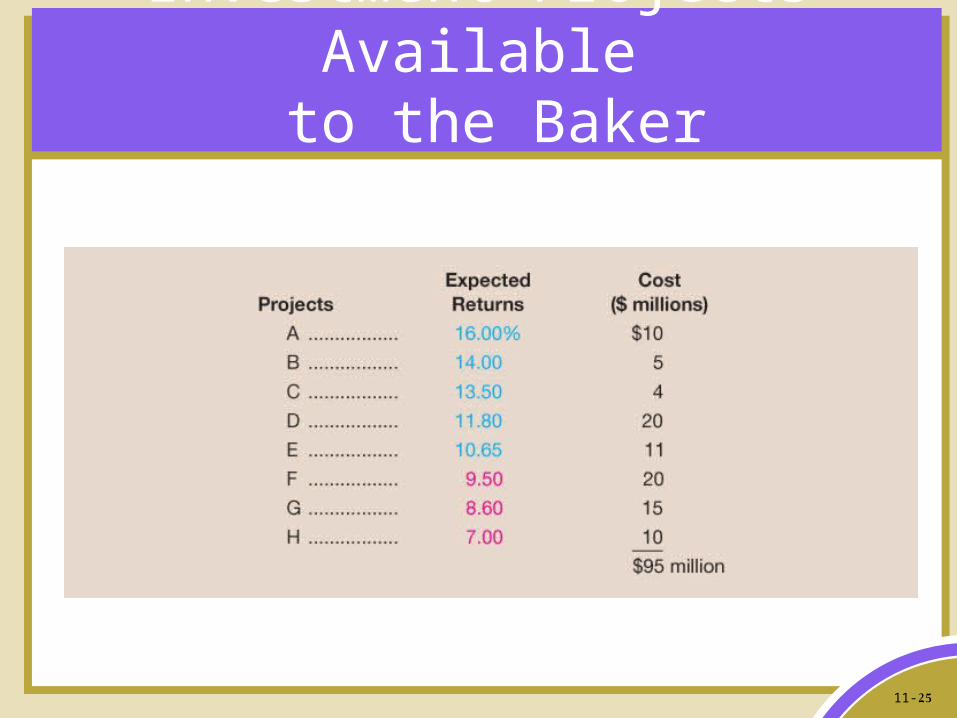
Investment Projects Available to the Baker Corporation
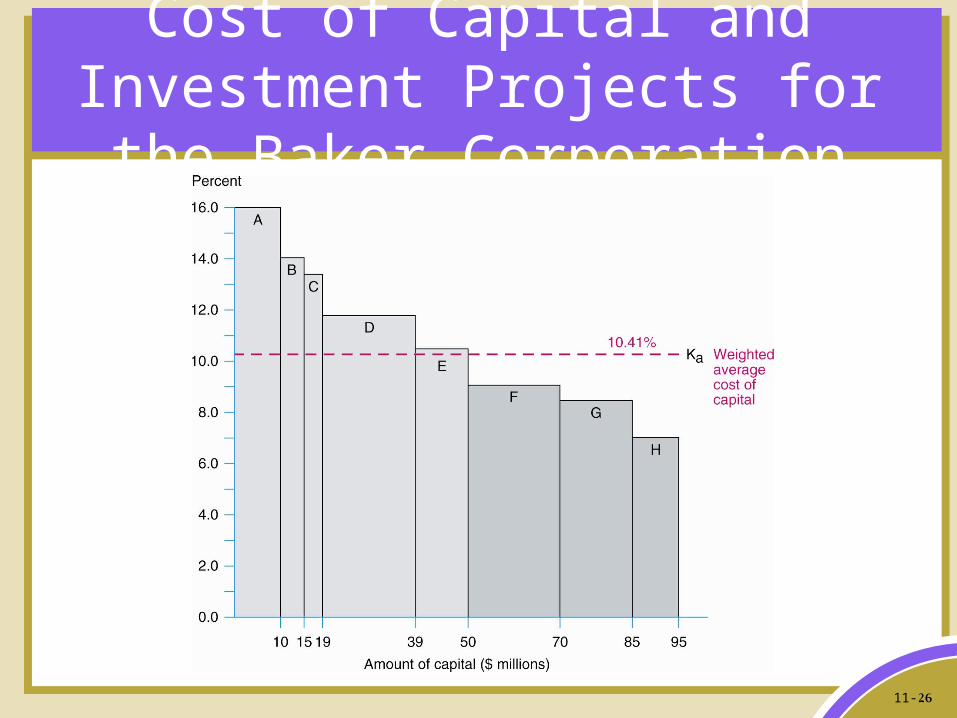
11-26
Cost of Capital and Investment Projects for the Baker Corporation

11-27
The Marginal Cost of Capital
• The market may demand a higher cost of capital for each amount of fund required if a large amount of financing is required– Equity (ownership) capital is represented by
retained earnings• Retained earnings cannot grow indefinitely as the
firm’s capital needs to expand• Retained earnings is limited to the amount of past and
present earnings that can be redeployed into investments

11-28
The Marginal Cost of Capital (cont’d)
• Assumptions:– 60% is the amount of equity capital a firm must maintain to keep a
balance between fixed income securities and ownership interest– The firm has $23.40 million of retained earning available for
investment• There is adequate retained earning to support the capital structure as
shown below:
• Assuming: X = Retained earnings ; Percent of retained earnings in the capital structure
• Where X represents the size of the capital structure that retained earnings will support
X = $23.40 million = $39 million .60
11-29
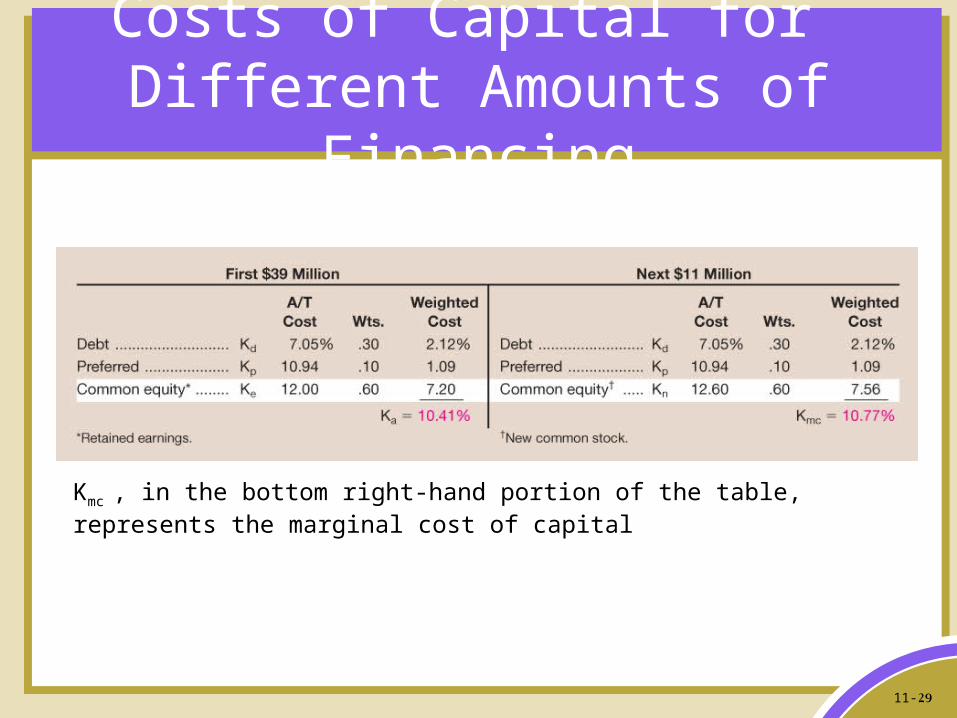
Costs of Capital for Different Amounts of Financing
Kmc , in the bottom right-hand portion of the table, represents the marginal cost of capital

11-30
Increasing Marginal Cost of Capital
• Both and represent the cost of capital– The mc subscript after K indicates the increase
in marginal cost of capital
• The increase is because common equity is now in the form of new common stock rather than retained earnings
• The after-tax cost of the new common stock is more expensive than retained earnings because of flotation costs

11-31
Increasing Marginal Cost of Capital (cont’d)
• Equation for the cost of new common stock:
= $2 + 7% = $2 + 7% = 5.6% + 7% = 12.6%
$40 - $4 $36
• The $50 million figure can be derived thus:
Z = Amount of lower-cost debt ; Percent of debt in the capital structure
Z = $15 million = $50 million .30• Where Z represents the size of the capital structure in which lower-cost
debt can be used

11-32
Cost of Capital for Increasing Amounts of Financing

11-33
Changes in the Marginal Costs of Capital

11-34
Marginal Cost of Capital and Baker Corporation Projects

11-35
Cost of Components in the Capital Structure
11-36
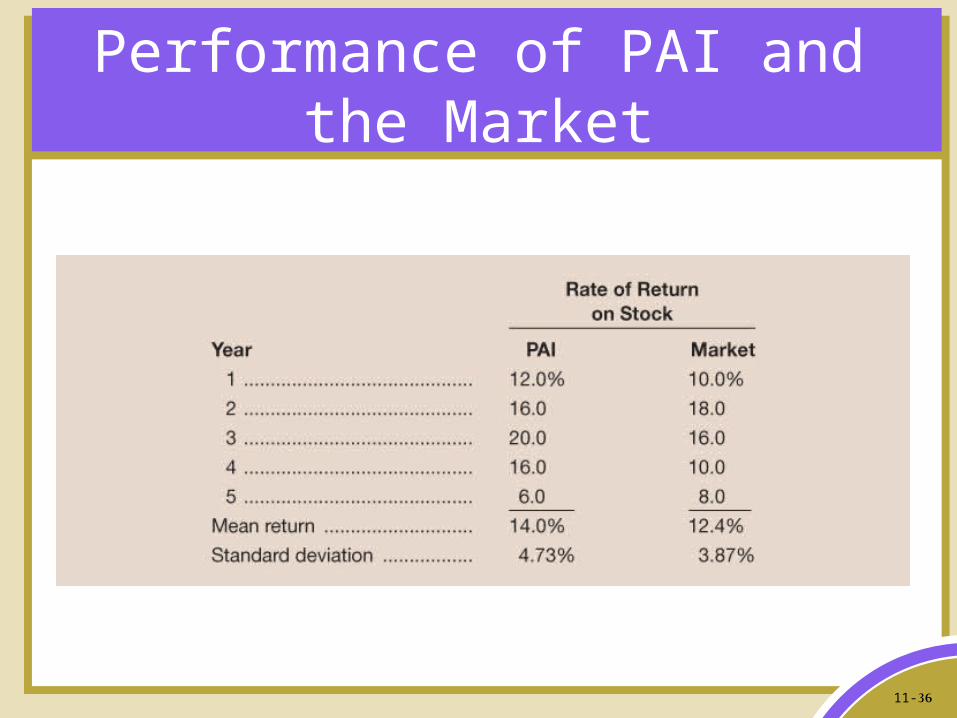
Performance of PAI and the Market

11-37
Linear Regression of Returns Between PAI and the Market
•The CAPM is an expectational (ex ante) model, and there is no guarantee historical data will reoccur
•One area of empirical testing involves the stability and predictability of the beta coefficient based on historical data

11-38
The Security Market Line (SML)• Under CAPM model, an investor is expected to achieve an extra return above that obtainable from a riskless asset in order to induce the assumption of more risk
• Security Market Line (SML) identifies the risk-return trade-off of any common stock (asset) relative to the company’s beta

11-39
The Security Market Line and Changing Interest Rates
• When interest rates increase from the initial period (R f1 versus R f0 ), the security market line in the next period is parallel to SML 0 , but higher. This indicates that required rates of return have risen for every level of risk, as investors desire to maintain their risk premium over the risk-free rate. An upward shift in the SML indicates that the prices of all assets will shift downward as interest rates move up.

11-40
The Security Market Line andChanging Investor Expectations
• As investors become more pessimistic about the economy, they require largerpremiums for assuming risks
•Rising interest rates and pessimistic investors go hand-in-hand, so the SML may change its slope and intercept at the same time. This combined effect would cause severe drops in the prices of risky assets and much larger required rates of return for such assets