Cost model to drive biosolids planning decisions - ghd.com · Why Class A does not always make...
48
Why Class A does not always make cents: Cost model to drive biosolids planning decisions Thor A. Young | Service Line Leader Sebastian E. Smoot | Engineer
Transcript of Cost model to drive biosolids planning decisions - ghd.com · Why Class A does not always make...

Why Class A does not always make cents: Cost model to drive biosolids planning decisions
Thor A. Young | Service Line Leader
Sebastian E. Smoot | Engineer

GHD @ WEFTEC 2015
Acknowledgements
Charles County Department of Public Works • Bill Shreve • Greg Boykin • Ed Gorham • Rea Schafer • Olin Straus • Sam Walter • Sam Simanovsky GHD • Kristi Perri • Brandon Gott

Context & objectives

GHD @ WEFTEC 2015
Context
Many municipal utilities considering upgrading their Class B biosolids operations to Class A Common project drivers: • Less restrictions than Class B • More outlets for distribution • “Hedging their bets” against
future Class B restrictions • Biosolids volume reduction • Increased biogas production • “Greener” process/product • Greater public acceptance Source: Scanlan et al. (2010). “Class A Digestion – What is its future in the US?” Proceedings of the Water Environment Federation. WEFTEC 2010.

GHD @ WEFTEC 2015
Solids Disposal, 37%
Labor, 21%
Energy, 18%
Misc, 11%
Maintenance, 7%
Chemicals, 6%
Typical operating costs for wastewater treatment
Source: U. Halbach (2003) Abwasserentsorgung in Brandenburg, Orientierungswerte Jahr 2003, Land Brandenburg, 2003. http://cgi.tu-harburg.de/~awwweb/wbt/emwater/documents/lesson_c2.pdf

GHD @ WEFTEC 2015
Image placeholder
Stock image of
scale balance with coins?
Cost considerations
In evaluation of future biosolids management options, utilities must consider the following for Class A alternatives vs. current operations: • Capital expenses (CAPEX) • Operation and maintenance expenses (OPEX) • Payback period • Impact on rate payers • Availability of funds for capital projects

Project background

GHD @ WEFTEC 2015
Mattawoman WWTP
• Located in Charles County, Maryland • Design capacity: 20 MGD • Current flow: 11 MGD (55%) • Upgraded for ENR in 2003 • Receives sludge from satellite facilities at the
headworks • A portion of plant effluent (5%) is reused
Image Source: Bing Maps

GHD @ WEFTEC 2015
25-yr projections of flows and solids production
2012 2017 2022 2027 2032 203702468
1012141618
Year
Flow
, mgd
; Sol
ids,
dry
tons
/day
WRF Influent Flow WRF Solids Production

GHD @ WEFTEC 2015
Primary Clarifiers
Secondary Clarifiers
Admin. Bldg
NORTH
Final Clarifiers
Aerobic Digesters
Dewatering Building
Gravity Thickeners
Septage Receiving
Reactors
Image Source: Bing Maps
Filters

GHD @ WEFTEC 2015
LEGEND Solids
Scum
Operated by Contractor
Simplified solids process flow schematic
Gravity Thickeners
Aerobic Digesters
3 & 4
Aerobic Digesters
6 - 11
Septage Receiving
Lime Stabilization
Belt Filter
Presses
Land Application
Thickening
Stabilization
Dewatering
Primary Clarifiers
Secondary Clarifiers
Final Clarifiers
Aerobic Digesters
1 & 5

GHD @ WEFTEC 2015
LEGEND Solids
Scum
Simplified solids process flow schematic
Gravity Thickeners
Aerobic Digesters
3 & 4
Aerobic Digesters
6 - 11
Septage Receiving
Thickening
Stabilization
Dewatering
Primary Clarifiers
Secondary Clarifiers
Final Clarifiers
Aerobic Digesters
1 & 5
Operated by Contractor
Mechanical Thickeners
Lime Stabilization
Belt Filter
Presses
Land Application
Thickened Combined Sludge to Stabilization and/or Dewatering
(Multiple Alternatives)
and other beneficial reuse

GHD @ WEFTEC 2015
0
10,000
20,000
30,000
40,000
50,000
60,000
70,000
0
20,000
40,000
60,000
80,000
100,000
120,000
140,000
160,000
Thickened PS(includes septage& 45% of WCS)
Thickened WAS(includes 55% of
WCS)
Total Sludge,Average
Conditions
Total Sludge,Maximum Month
Conditions
Solid
s, lb
/day
Flow
, gal
/day
Flow, gpd TSS, lb/d VSS, lb/d
Projection of solids flows at 20 MGD
19.3 Tons per day
29 Tons per day

GHD @ WEFTEC 2015
Existing Class B biosolids facility

Approach

GHD @ WEFTEC 2015
Technologies considered
Thermal Hydrolysis Thermal Dryer Anaerobic Digestion
Anaerobic Digestion Thermal Drying Thermal Hydrolysis

GHD @ WEFTEC 2015
Alternative 0 – status quo Class B lime stabilization
Thickened Primary Sludge
Thickened Secondary Sludge
Class B Biosolids
Dewatering (new centrifuges)
Lime Stabilization

GHD @ WEFTEC 2015
Alternative 1 – TPAD Temperature-Phased Anaerobic Digestion
Thickened Primary Sludge
Thickened Secondary Sludge
Class A Biosolids
Dewatering Mesophilic Anaerobic Digestion
(MAD)
Thermophilic Anaerobic Digestion
Cogeneration Electricity Natural Gas

GHD @ WEFTEC 2015
Alternative 2 – dryer Thermal dryer
Thickened Primary Sludge
Thickened Secondary Sludge
Class A Biosolids
Dewatering
Drum Dryer Hopper

GHD @ WEFTEC 2015
Alternative 3 – AD + dryer Mesophilic anaerobic digestion followed by thermal dryer
Thickened Primary Sludge
Thickened Secondary Sludge
Class A Biosolids
Dewatering
Drum Dryer
Boiler
MAD
Hopper
Natural Gas

GHD @ WEFTEC 2015
Alternative 4 – THP Thermal Hydrolysis Process and anaerobic digestion
Thickened Primary Sludge
Thickened Secondary Sludge
Class A Biosolids
MAD Dewatering
Thermal Hydrolysis
Process (THP)
Cogeneration
Hopper
Electricity Natural Gas

GHD @ WEFTEC 2015
Alternative 5 – THP + dryer THP and anaerobic digestion followed by thermal dryer
Thickened Primary Sludge
Thickened Secondary Sludge
Class A Biosolids
MAD Dewatering
Thermal Hydrolysis Process
Paddle Dryer
Boiler
Hopper Hopper
Natural Gas

GHD @ WEFTEC 2015
Summary of alternatives
LEGEND Thermophilic Digester
Mesophilic Digester
Thermal Dryer
Thermal Hydrolysis DW Dewatering
DW
DW
DW DW
Lime
Cogeneration
DW DW
DW DW
Cogeneration
Heat Recovery
Heat Recovery
Alt. 0 – Status Quo (Class B Lime Stabilization)
Alt. 1 – Temperature-Phased Anaerobic Digestion (TPAD)
Alt. 2 – Thermal Drying
Alt. 3 – Mesophilic Anaerobic Digestion and Thermal Drying
Alt. 4 – Thermal Hydrolysis and Anaerobic Digestion
Alt. 5 – Thermal Hydrolysis, Digestion, and Thermal Drying

Approach

GHD @ WEFTEC 2015
Assumptions
Land Application Unit Cost: Class A (90% solids): $25 per wet ton Class A (20-30% solids): $50 per wet ton Class B (20-30% solids): $75 per wet ton Contract Operations Unit Cost $100 per hour Regional Biosolids Revenue $70 per wet ton General Inflation Rate 3% Land Application Cost Inflation Rate 6% Nominal Discount Rate 1.8% Cost of Electricity $0.13 per kWh Cost of Natural Gas $8 per MMBTU Cost of Polymer $2 per pound Cost of Lime $180 per ton Annual Maintenance Cost 3% of equipment cost

GHD @ WEFTEC 2015
D&T D&T D&T D&T D&T D&T
THP THP AD
AD
AD AD
CHP CHP
Dryer
Dryer Dryer Site Site
Site
Site
EI&C EI&C
EI&C
EI&C EI&C
E&A E&A
E&A
E&A E&A
$0
$10
$20
$30
$40
$50
$60
$70
$80
ALT 0CLASS B
ALT 1TPAD
ALT 2DRY
ALT 3AD+DRY
ALT 4THP
ALT 5THP+DRY
Cap
ital C
ost,
2014
Milli
on U
SD
Dewatering andThickening (D&T)
LimeStabilization
Th. HydrolysisProcess (THP)
AnaerobicDigesters (AD)
Combined Heat& Power (CHP)
ThermalDRY
Site Work andYard Piping
Electrical &Controls (EI&C)
Engineering &Administration
Capital cost comparison

GHD @ WEFTEC 2015
E E E E E E NG
NG NG
NG
NG
P
P
P P
P
P
L CS
CS
CS
CS
EM
EM
EM
EM
EM
EM
LA
LA LA
LA LA LA
CL
CL CL
CL CL CL
$0
$10
$20
$30
$40
$50
$60
$70
$80
$90
$100
ALT 0CLASS B
ALT 1TPAD
ALT 2DRY
ALT 3AD+DRY
ALT 4THP
ALT 5THP+DRY
25-Y
ear N
PV
of O
&M
Cos
ts, 2
014
Milli
on U
SD
Electricity (E) Natural Gas (NG) Polymer (P) Lime (L)
County Staff (CS) Equipment Maintenance (EM) Land Application (LA) Contractor Labor (CL)
Net Cost Electricity Cost Offset (E-) Heat Cost Offset (H-) blank
O&M cost comparison

GHD @ WEFTEC 2015
E E E E E E NG
NG NG
NG
NG
P
P
P P
P
P
L CS
CS
CS
CS
EM
EM
EM
EM
EM
EM
LA
LA LA
LA LA LA
CL
CL CL
CL CL CL
H- H-
H-
$0
$10
$20
$30
$40
$50
$60
$70
$80
$90
$100
ALT 0CLASS B
ALT 1TPAD
ALT 2DRY
ALT 3AD+DRY
ALT 4THP
ALT 5THP+DRY
25-Y
ear N
PV
of O
&M
Cos
ts, 2
014
Milli
on U
SD
Electricity (E) Natural Gas (NG) Polymer (P) Lime (L)
County Staff (CS) Equipment Maintenance (EM) Land Application (LA) Contractor Labor (CL)
Net Cost Electricity Cost Offset (E-) Heat Cost Offset (H-) blank
O&M cost comparison

GHD @ WEFTEC 2015
E E E E E E NG
NG NG
NG
NG
P
P
P P
P
P
L CS
CS
CS
CS
EM
EM
EM
EM
EM
EM
LA
LA LA
LA LA LA
CL
CL CL
CL CL CL E- E-
H- H-
H-
$0
$10
$20
$30
$40
$50
$60
$70
$80
$90
$100
ALT 0CLASS B
ALT 1TPAD
ALT 2DRY
ALT 3AD+DRY
ALT 4THP
ALT 5THP+DRY
25-Y
ear N
PV
of O
&M
Cos
ts, 2
014
Milli
on U
SD
Electricity (E) Natural Gas (NG) Polymer (P) Lime (L)
County Staff (CS) Equipment Maintenance (EM) Land Application (LA) Contractor Labor (CL)
Net Cost Electricity Cost Offset (E-) Heat Cost Offset (H-) blank
O&M cost comparison

GHD @ WEFTEC 2015
CAPEX
CAPEX CAPEX CAPEX
CAPEX CAPEX
OPEX
OPEX OPEX
OPEX
OPEX OPEX
$0
$20
$40
$60
$80
$100
$120
$140
$160
ALT 0CLASS B
ALT 1TPAD
ALT 2DRY
ALT 3AD+DRY
ALT 4THP
ALT 5THP+DRY
25-Y
ear N
PV
of T
otal
Cos
ts, 2
014
Milli
on U
SD
Capital Costs O&M Costs RecoveredO&M Costs
Blank
Lifecycle cost comparison

GHD @ WEFTEC 2015
CAPEX
CAPEX CAPEX CAPEX
CAPEX CAPEX
LA
LA
LA
LA
LA LA
CL CL
CL
CL
CL CL
NG NG
NG
NG NG
Other Other Other
Other
Other
Other
$0
$20
$40
$60
$80
$100
$120
$140
$160
ALT 0CLASS B
ALT 1TPAD
ALT 2DRY
ALT 3AD+DRY
ALT 4THP
ALT 5THP+DRY
25-Y
ear N
PV
of T
otal
Cos
ts, 2
014
Milli
on U
SD
Capital Costs Land App. Contractor Labor Natural Gas Other O&MCosts
RecoveredO&M Costs
Blank
Lifecycle cost comparison

Results

GHD @ WEFTEC 2015
$0
$20
$40
$60
$80
$100
$120
$140
0 1 2 3 4 5 6 7 8 9 10 11 12 13 14 15 16 17 18 19 20 21 22 23 24 25
25-Y
ear N
PV
Life
cycl
e C
ost,
2014
Mil.
US
D (D
isco
unte
d)
Year
ALT 0 CLASS B ALT 1 TPAD ALT 2 DRYERALT 3 AD+DRYER ALT 4 THP ALT 5 THP+DRYER
Lifecycle cost comparison over time
AD+Dryer
Class B
THP+Dryer Dryer TPAD THP

Sensitivity Analysis

GHD @ WEFTEC 2015
Impact of increased cost of Class B land application
Baseline
Class A (90% solids)
$25 per wet ton
Class A (20-30% solids) $50 per wet ton
Class B (20-30% solids) $75 per wet ton
Adjusted inputs
Class A (90% solids)
$25 per wet ton
Class A (20-30% solids) $50 per wet ton
Class B (20-30% solids)
$85/95 per wet ton

GHD @ WEFTEC 2015
$0
$20
$40
$60
$80
$100
$120
$140
0 1 2 3 4 5 6 7 8 9 10 11 12 13 14 15 16 17 18 19 20 21 22 23 24 25
25-Y
ear N
PV
Life
cycl
e C
ost,
2014
Mil.
US
D (D
isco
unte
d)
Year
ALT 0 CLASS B ALT 1 TPAD ALT 2 DRYERALT 3 AD+DRYER ALT 4 THP ALT 5 THP+DRYER
Lifecycle costs at various Class B unit costs
AD+Dryer
Class B
THP+Dryer Dryer TPAD THP
$75/WT $85/WT $95/WT

GHD @ WEFTEC 2015
Impact of reduced costs of Class A land application
Land application fees Baseline values
Class A 90% solids
$25 per wet ton
Class A 20-30% solids
$50 per wet ton
Class B 20-30% solids
$75 per wet ton
Adjusted inputs
Class A 90% solids
$0 per wet ton
Class A 20-30% solids
$25 per wet ton
Class B 20-30% solids
$85/95 per wet ton
GHD @ WEFTEC 2015
$0
$20
$40
$60
$80
$100
$120
$140
0 1 2 3 4 5 6 7 8 9 10 11 12 13 14 15 16 17 18 19 20 21 22 23 24 25
25-Y
ear N
PV
Life
cycl
e C
ost,
2014
Mil.
US
D (D
isco
unte
d)
Year
ALT 0 CLASS B ALT 1 TPAD ALT 2 DRYERALT 3 AD+DRYER ALT 4 THP ALT 5 THP+DRYER
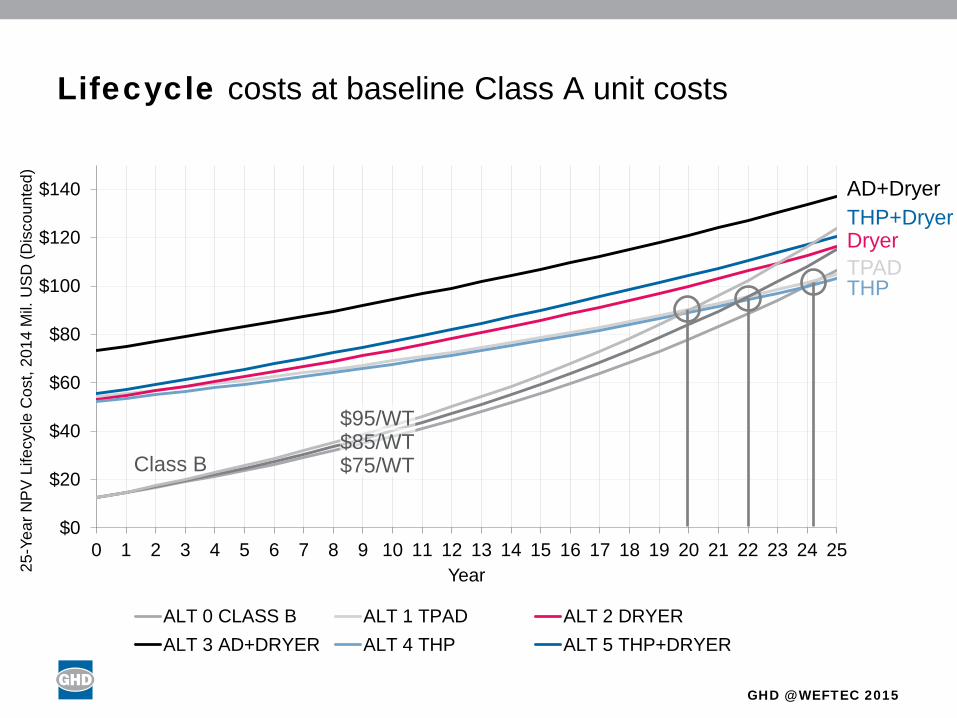
Lifecycle costs at baseline Class A unit costs
AD+Dryer
Class B
THP+Dryer Dryer TPAD THP
$75/WT $85/WT $95/WT

GHD @ WEFTEC 2015
$0
$20
$40
$60
$80
$100
$120
$140
0 1 2 3 4 5 6 7 8 9 10 11 12 13 14 15 16 17 18 19 20 21 22 23 24 25
25-Y
ear N
PV
Life
cycl
e C
ost,
2014
Mil.
US
D (D
isco
unte
d)
Year
ALT 0 CLASS B ALT 1 TPAD ALT 2 DRYERALT 3 AD+DRYER ALT 4 THP ALT 5 THP+DRYER
Lifecycle costs at reduced Class A unit costs
AD+Dryer
Class B
THP+Dryer Dryer TPAD THP
$75/WT $85/WT $95/WT

GHD @ WEFTEC 2015
E E E E E E NG
NG NG
NG
NG
P
P
P P
P
P
L CS
CS
CS
CS
EM
EM
EM
EM
EM
EM
LA
LA LA
LA LA LA
CL
CL CL
CL CL CL
$0
$10
$20
$30
$40
$50
$60
$70
$80
$90
$100
ALT 0CLASS B
ALT 1TPAD
ALT 2DRY
ALT 3AD+DRY
ALT 4THP
ALT 5THP+DRY
25-Y
ear N
PV
of O
&M
Cos
ts, 2
014
Milli
on U
SD
Electricity (E) Natural Gas (NG) Polymer (P) Lime (L)
County Staff (CS) Equipment Maintenance (EM) Land Application (LA) Contractor Labor (CL)
Net Cost blank
O&M cost comparison (baseline)

GHD @ WEFTEC 2015
E E E E E E NG
NG NG
NG
NG
P
P
P P
P
P
L CS
CS
CS
CS
EM
EM
EM
EM
EM
EM
LA
LA
LA
CL
CL CL
CL CL
CL
$0
$10
$20
$30
$40
$50
$60
$70
$80
$90
$100
ALT 0CLASS B
ALT 1TPAD
ALT 2DRY
ALT 3AD+DRY
ALT 4THP
ALT 5THP+DRY
25-Y
ear N
PV
of O
&M
Cos
ts, 2
014
Milli
on U
SD
Electricity (E) Natural Gas (NG) Polymer (P) Lime (L)
County Staff (CS) Equipment Maintenance (EM) Land Application (LA) Contractor Labor (CL)
Net Cost blank
O&M cost comparison (reduced Class A unit costs)
Baseline O&M Cost

GHD @ WEFTEC 2015
CAPEX
CAPEX CAPEX CAPEX
CAPEX CAPEX
LA
LA
LA
LA
LA LA
CL CL
CL
CL
CL CL
NG NG
NG
NG NG
Other Other Other
Other
Other
Other
$0
$20
$40
$60
$80
$100
$120
$140
$160
ALT 0CLASS B
ALT 1TPAD
ALT 2DRY
ALT 3AD+DRY
ALT 4THP
ALT 5THP+DRY
25-Y
ear N
PV
of T
otal
Cos
ts, 2
014
Milli
on U
SD
Capital Costs Land App. Contractor Labor Natural Gas Other O&MCosts
RecoveredO&M Costs
Blank
Lifecycle cost comparison (baseline)

GHD @ WEFTEC 2015
Lifecycle cost comparison (reduced Class A unit costs)
CAPEX
CAPEX CAPEX CAPEX
CAPEX CAPEX
LA
LA LA
CL
CL CL
CL
CL CL
NG NG
NG
NG NG
Other
Other
Other
Other
Other
Other
$0
$20
$40
$60
$80
$100
$120
$140
$160
ALT 0CLASS B
ALT 1TPAD
ALT 2DRY
ALT 3AD+DRY
ALT 4THP
ALT 5THP+DRY
25-Y
ear N
PV
of T
otal
Cos
ts, 2
014
Milli
on U
SD
Capital Costs Land App. Contractor Labor Natural Gas Other O&MCosts
RecoveredO&M Costs
Blank
Baseline Lifecycle Cost

Conclusions

GHD @ WEFTEC 2015
Image placeholder
Conclusions
• Charles County opted to maintain Class B system for foreseeable future until new regulations or technologies result in cost advantages for Class A
• The impact of sudden and severe restrictions on Class B land application is a manageable risk for Charles County
• Clarifications – Study limited to financial analysis – GHG or carbon footprint not monetized – Did not examine grants or other funding sources