
Cost Model Discussions with ACT Subgroup - … Cost Model Features • Timeframe: 2016 and 2040 •...
26
Draft Cost Model Discussion with ACT Cost Subgroup Mobile Source Control Division Air Resources Board August 23, 2016 1 Draft for Discussion August 23, 2016
Transcript of Cost Model Discussions with ACT Subgroup - … Cost Model Features • Timeframe: 2016 and 2040 •...
Draft Cost Model Discussion with
ACT Cost Subgroup
Mobile Source Control Division Air Resources Board
August 23, 2016
1
Draft for Discussion August 23, 2016
Agenda • Overview of ARB’s cost model: • Comparison to Steve’s model • Continued data needs • Cost assumptions • LA Metro’s presentation • August 29 workgroup meeting agenda
2
Draft for Discussion August 23, 2016
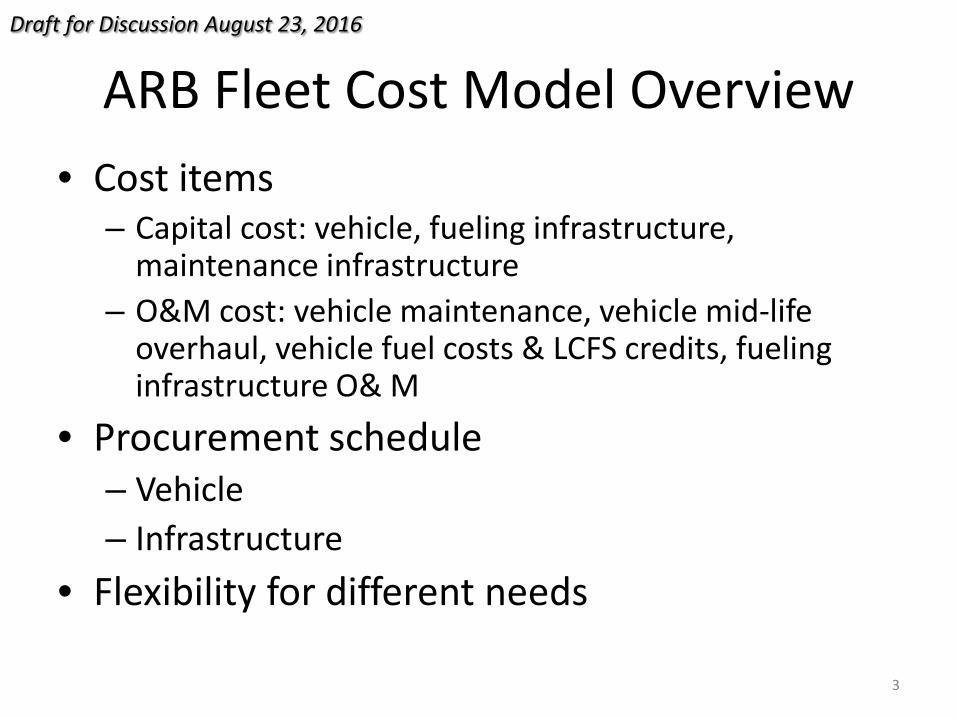
ARB Fleet Cost Model Overview • Cost items
– Capital cost: vehicle, fueling infrastructure, maintenance infrastructure
– O&M cost: vehicle maintenance, vehicle mid-life overhaul, vehicle fuel costs & LCFS credits, fueling infrastructure O& M
• Procurement schedule – Vehicle – Infrastructure
• Flexibility for different needs
3
Draft for Discussion August 23, 2016
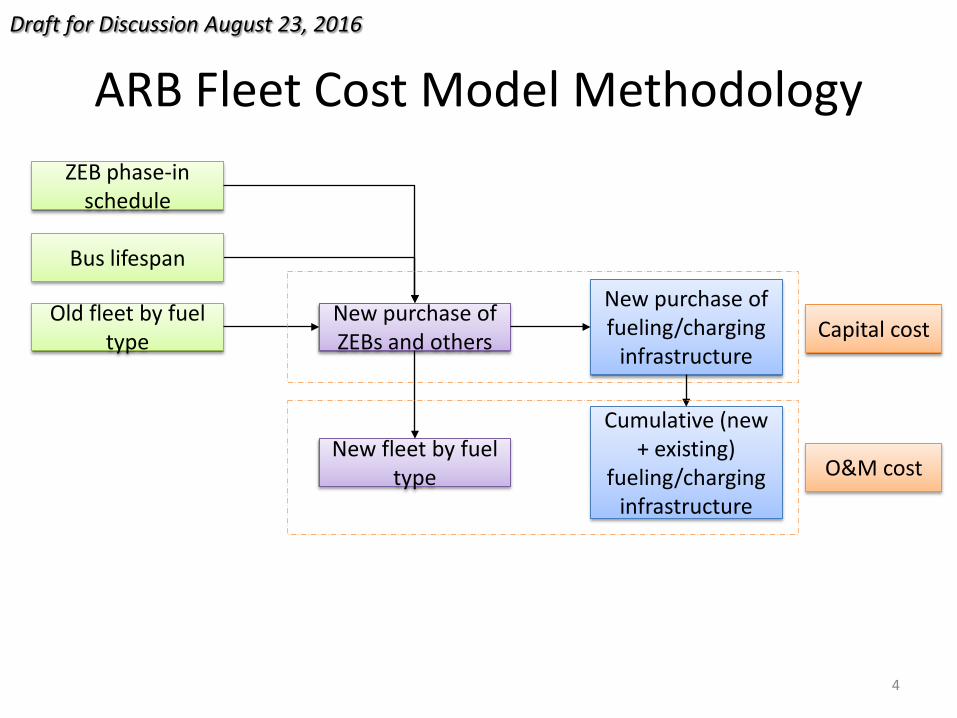
ARB Fleet Cost Model Methodology
4
Old fleet by fuel type
ZEB phase-in schedule
New purchase of ZEBs and others
New purchase of fueling/charging
infrastructure
Bus lifespan
New fleet by fuel type
Cumulative (new + existing)
fueling/charging infrastructure
Capital cost
O&M cost
Draft for Discussion August 23, 2016
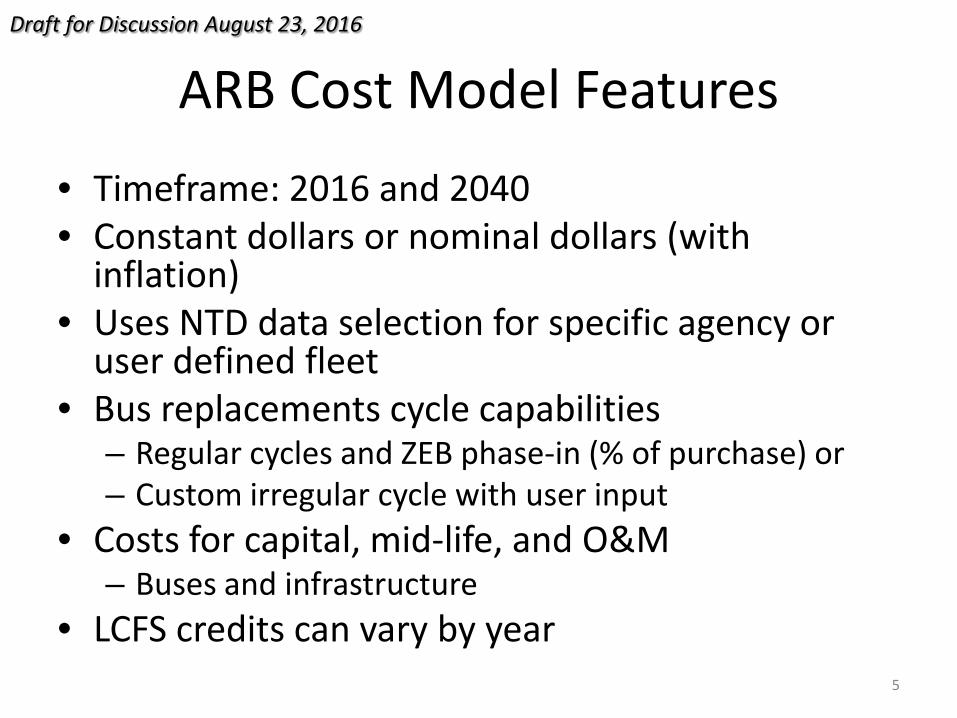
ARB Cost Model Features
• Timeframe: 2016 and 2040 • Constant dollars or nominal dollars (with
inflation) • Uses NTD data selection for specific agency or
user defined fleet • Bus replacements cycle capabilities
– Regular cycles and ZEB phase-in (% of purchase) or – Custom irregular cycle with user input
• Costs for capital, mid-life, and O&M – Buses and infrastructure
• LCFS credits can vary by year 5
Draft for Discussion August 23, 2016
Comparison to Steve’s Model
• Match inputs for capital and O&M costs • Same bus/charger purchase schedule (triennial) • Cash flow results essentially the same
– Difference occurs in years where Steve’s model does not retire ZEBs after end of useful life
• Questions about contract spare vehicles
6
Draft for Discussion August 23, 2016
Cost Inputs
• Bus prices • Maintenance and brake costs • Annual fuel costs
– Fuel consumption – Long term fuel price – LCFS credit value
• Infrastructure
7
Draft for Discussion August 23, 2016

Bus Price History from APTA
• 4.12% annual increase (nominal dollars)
8 * Bus costs converted to constant dollars by using the historical price growth rate of 4.12%
Bus Prices Draft for Discussion August 23, 2016

Proterra Bus Price Projection
• Proterra (08/10/2016-08/19/2016, discussions with Alan Westenskow, Director of Business Development)
9
$490,000
$749,000
$623,896
$861,758
$400,000
$450,000
$500,000
$550,000
$600,000
$650,000
$700,000
$750,000
$800,000
$850,000
$900,000
2016
2017
2018
2019
2020
2021
2022
2023
2024
2025
2026
2027
2028
2029
2030
Nom
inal
Dol
lars
CNG CNG (low NOx) Proterra Electric
Proterra: -3% for 2016 - 2022; 4.12% after 2022 to match CNG
CNG & Low NOx: 4.12% (APTA)
Proterra/Conventional Bus Cost Parity - 2022
$490,000
$400,000
$450,000
$500,000
$550,000
$600,000
$650,000
$700,000
$750,000
$800,000
$850,000
$900,000
2016
20
17
2018
20
19
2020
20
21
2022
20
23
2024
20
25
2026
20
27
2028
20
29
2030
*201
6 Co
nsta
nt D
olla
rs
CNG CNG (low NOx) Proterra Electric
* Bus costs converted to constant dollars by using the historical price growth rate of 4.12%
Bus Prices

480,000
770,000
675,000
1,295,110
$400,000
$500,000
$600,000
$700,000
$800,000
$900,000
$1,000,000
$1,100,000
$1,200,000
$1,300,000
$1,400,000
2015 2020 2025 2030 2035 2040
Nom
inal
Dol
lars
Diesel BYD BEB
BYD Bus Prices
• 08/22/2016, discussion with Vincent Wiraatmadja
10
480,000
$400,000
$450,000
$500,000
$550,000
$600,000
$650,000
$700,000
$750,000
$800,000
2015 2020 2025 2030 2035 2040
* 20
16 C
onst
ant D
olla
rs
Diesel BYD BEB
Diesel: 4.12%
BYD: $770k in 2016; $675k in 2025; 4.12% after 2022 to
match diesel
* Bus costs converted to constant dollars by using the historical price growth rate of 4.12%
Bus Prices Draft for Discussion August 23, 2016
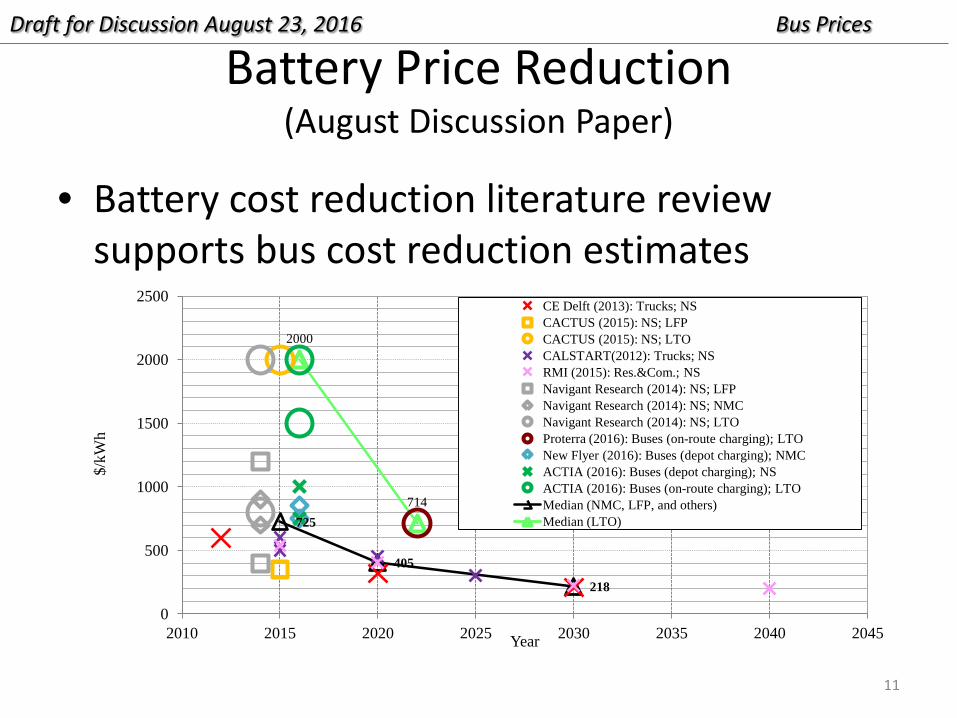
Battery Price Reduction (August Discussion Paper)
• Battery cost reduction literature review supports bus cost reduction estimates
11
725
405
218
2000
714
0
500
1000
1500
2000
2500
2010 2015 2020 2025 2030 2035 2040 2045
$/kW
h
Year
CE Delft (2013): Trucks; NS CACTUS (2015): NS; LFP CACTUS (2015): NS; LTO CALSTART(2012): Trucks; NS RMI (2015): Res.&Com.; NS Navigant Research (2014): NS; LFP Navigant Research (2014): NS; NMC Navigant Research (2014): NS; LTO Proterra (2016): Buses (on-route charging); LTO New Flyer (2016): Buses (depot charging); NMC ACTIA (2016): Buses (depot charging); NS ACTIA (2016): Buses (on-route charging); LTO Median (NMC, LFP, and others) Median (LTO)
Bus Prices Draft for Discussion August 23, 2016

Fuel Cell Electric Buses
• $1.2 million for single bus purchase 2016 • $900,000 for 40 bus purchase via New Flyer
letter • Additional cost reductions possible
12
Bus Prices Draft for Discussion August 23, 2016

Bus Prices (Constant Dollars)
$0
$100,000
$200,000
$300,000
$400,000
$500,000
$600,000
$700,000
$800,000
$900,000 20
16
2017
20
18
2019
20
20
2021
20
22
2023
20
24
2025
20
26
2027
20
28
2029
20
30
Diesel CNG Diesel Hybrid Proterra BYD
13
Bus Prices
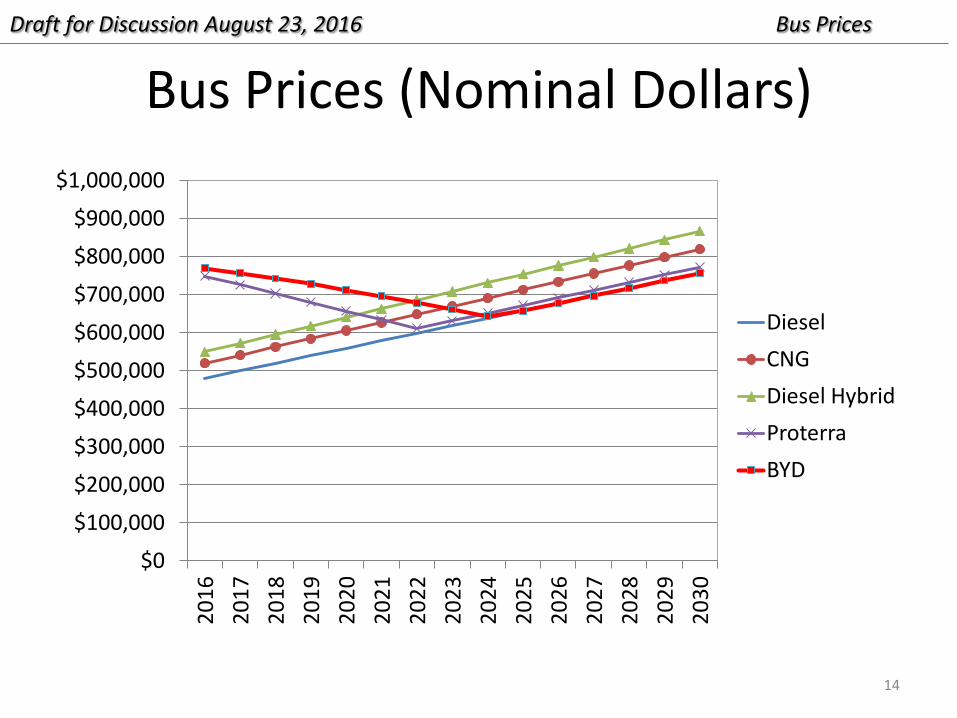
Bus Prices (Nominal Dollars)
$0
$100,000
$200,000
$300,000
$400,000
$500,000
$600,000
$700,000
$800,000
$900,000
$1,000,000 20
16
2017
20
18
2019
20
20
2021
20
22
2023
20
24
2025
20
26
2027
20
28
2029
20
30
Diesel CNG Diesel Hybrid Proterra BYD
14
Bus Prices Draft for Discussion August 23, 2016
Maintenance Cost Literature Review
• Available data supports minimum of $0.19 cost savings per mile – Brake cost savings and avoided regular
maintenance from Foothill study – No data to compare long term bus repairs
• Manufacturer lifecycle estimates reflect savings from avoided repairs at savings of about $0.25/mile
15
Maintenance and Brake Costs Draft for Discussion August 23, 2016

16
Maintenance Costs for Buses
Category Mid-Life Cost ($2016)*
Average Lifetime Maintenance** ($/mile)
CNG Bus $35,000 $0.85 Diesel Bus $35,000 $0.85 Low NOx CNG Bus $55,000 $0.85 Hybrid Bus $35,000 $0.80 BYD Slow Chg $0 $0.60 Proterra Fast Chg $75,000 $0.60 Proterra Slow Chg $75,000 $0.60 Fuel Cell $200,000 $1.00 * Mid-life rebuild of engine, transmission, or replacement of traction battery after 7 years. ** Excludes mid-life costs.
• FTA bus lifecycle cost report in 2007 identified higher mid-life cost for conventional bus propulsion system (including engine and transmission) for internal combustion engines for a large operator at around $47,000.
Maintenance and Brake Costs Draft for Discussion August 23, 2016
Vehicle/Fuel Efficiency
• Fuel consumption dependent on bus technology and route speed
• Real world NTD data for different bus categories – Limit to fleets with single fuel type for standard buses
• NREL reports capture real world fuel consumption for part of fleet that is evaluated
• Altoona emissions test cycle and fuel economy in controlled tests
• Real world fuel economy best estimate of annual fuel costs and much lower than Altoona tests
17
Annual Fuel Costs Draft for Discussion August 23, 2016
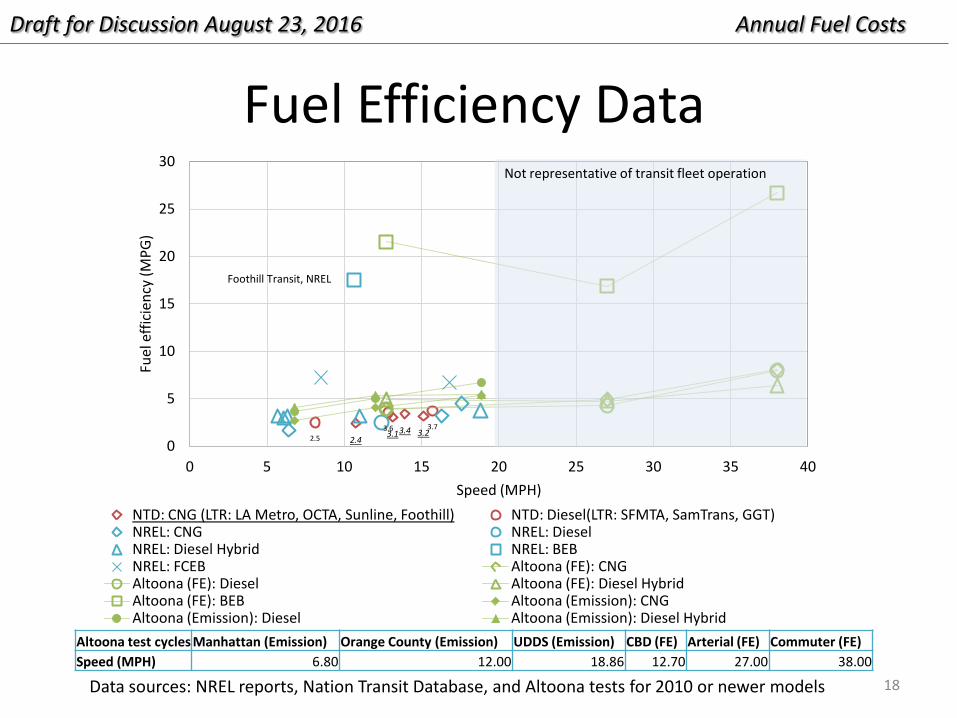
Fuel Efficiency Data
18
Annual Fuel Costs
Altoona test cycles Manhattan (Emission) Orange County (Emission) UDDS (Emission) CBD (FE) Arterial (FE) Commuter (FE) Speed (MPH) 6.80 12.00 18.86 12.70 27.00 38.00
2.4 3.1 3.4 3.2
2.5 3.6 3.7
0
5
10
15
20
25
30
0 5 10 15 20 25 30 35 40
Fuel
effi
cien
cy (M
PG)
Speed (MPH) NTD: CNG (LTR: LA Metro, OCTA, Sunline, Foothill) NTD: Diesel(LTR: SFMTA, SamTrans, GGT) NREL: CNG NREL: Diesel NREL: Diesel Hybrid NREL: BEB NREL: FCEB Altoona (FE): CNG Altoona (FE): Diesel Altoona (FE): Diesel Hybrid Altoona (FE): BEB Altoona (Emission): CNG Altoona (Emission): Diesel Altoona (Emission): Diesel Hybrid
Not representative of transit fleet operation
Foothill Transit, NREL
Data sources: NREL reports, Nation Transit Database, and Altoona tests for 2010 or newer models
Draft for Discussion August 23, 2016

Transit Fleet Fuel Efficiency
2.4 3.1 3.4 3.2 2.5 3.6 3.7
0
5
10
15
20
25
30
4 6 8 10 12 14 16 18 20
Fuel
effi
cien
cy (M
PG)
Speed (MPH) NTD: CNG (LTR: LA Metro, OCTA, Sunline, Foothill) NTD: Diesel(LTR: SFMTA, SamTrans, GGT) NREL: CNG NREL: Diesel NREL: Diesel Hybrid NREL: BEB NREL: FCEB Altoona (FE): CNG Altoona (FE): Diesel Altoona (FE): Diesel Hybrid Altoona (FE): BEB Altoona (Emission): CNG
Annual Fuel Costs
Foothill Transit, NREL
20
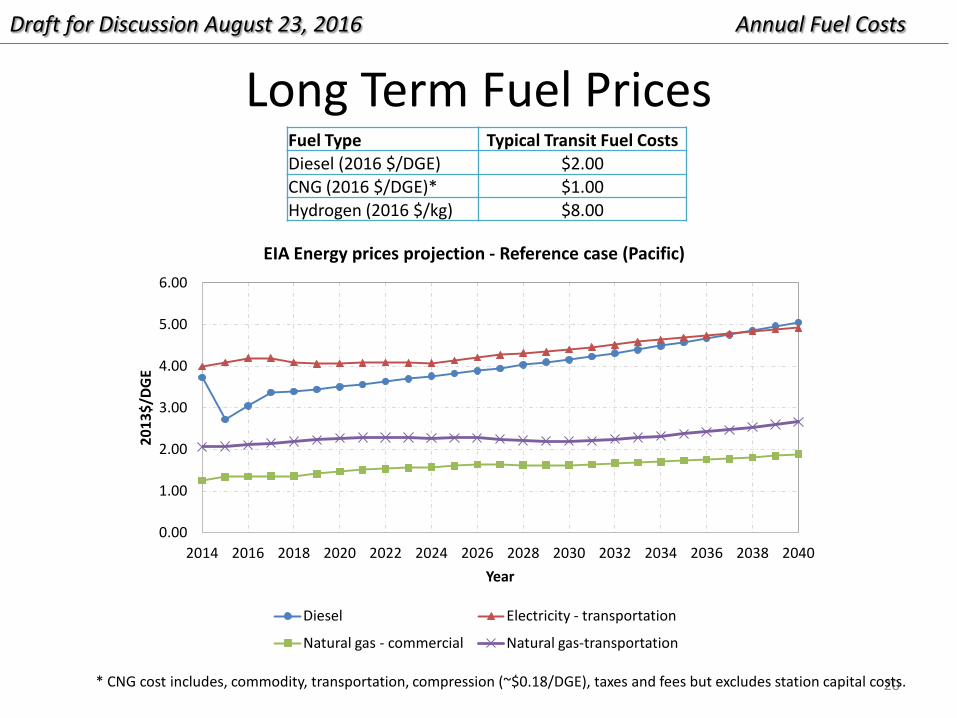
Long Term Fuel Prices Fuel Type Typical Transit Fuel Costs Diesel (2016 $/DGE) $2.00 CNG (2016 $/DGE)* $1.00 Hydrogen (2016 $/kg) $8.00
0.00
1.00
2.00
3.00
4.00
5.00
6.00
2014 2016 2018 2020 2022 2024 2026 2028 2030 2032 2034 2036 2038 2040
2013
$/DG
E
Year
EIA Energy prices projection - Reference case (Pacific)
Diesel Electricity - transportation
Natural gas - commercial Natural gas-transportation
Annual Fuel Costs
* CNG cost includes, commodity, transportation, compression (~$0.18/DGE), taxes and fees but excludes station capital costs.
Draft for Discussion August 23, 2016
21
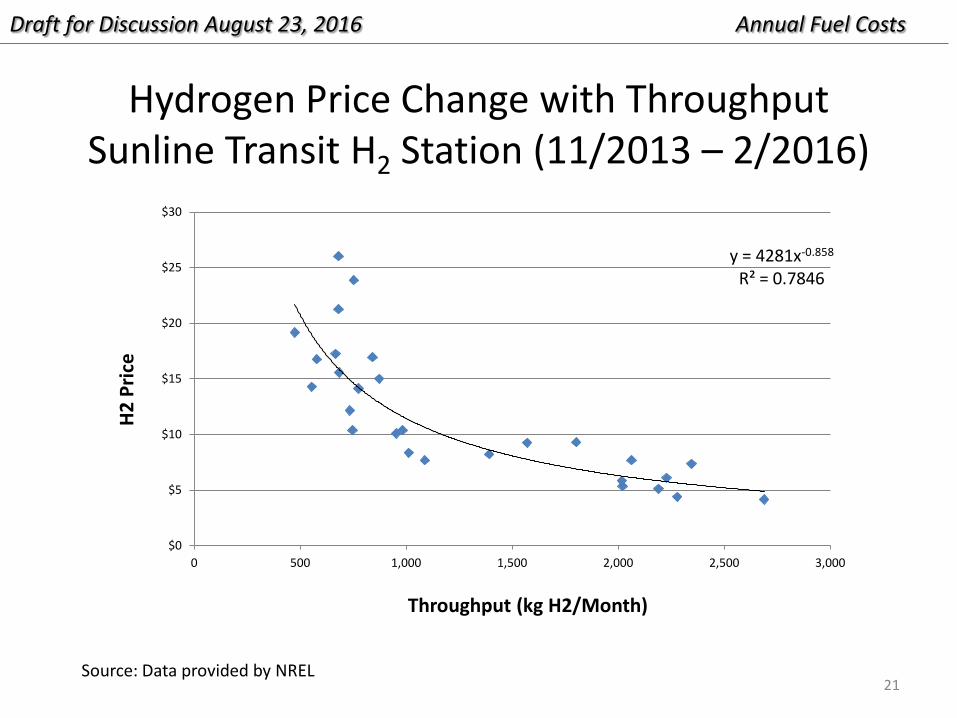
Hydrogen Price Change with Throughput Sunline Transit H2 Station (11/2013 – 2/2016)
Annual Fuel Costs Draft for Discussion August 23, 2016
y = 4281x-0.858 R² = 0.7846
$0
$5
$10
$15
$20
$25
$30
0 500 1,000 1,500 2,000 2,500 3,000
H2 P
rice
Throughput (kg H2/Month)
Source: Data provided by NREL
22
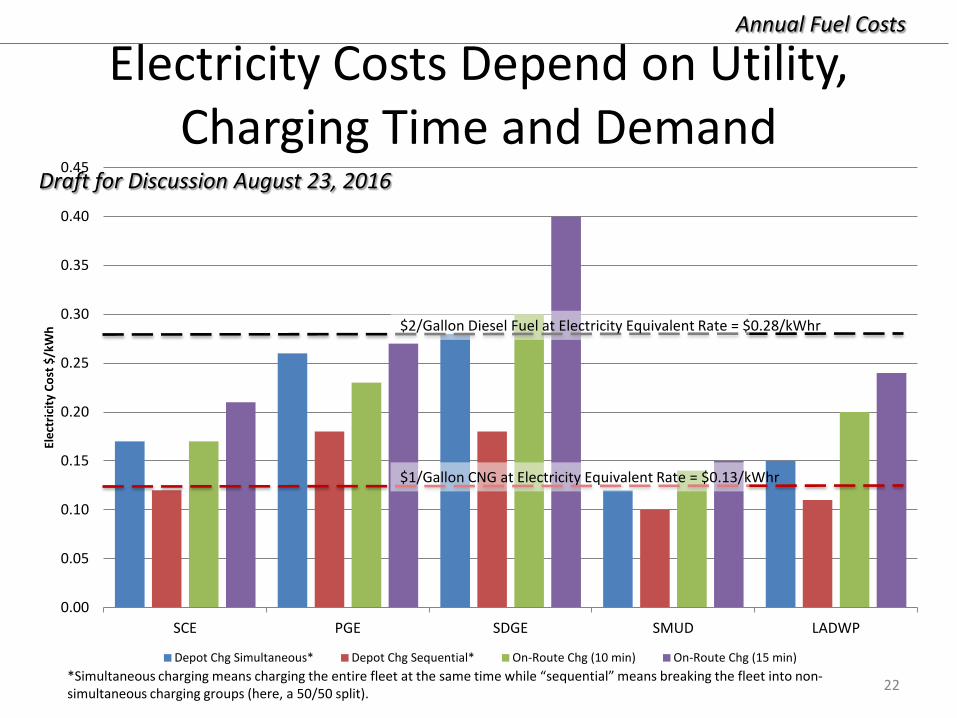
Electricity Costs Depend on Utility, Charging Time and Demand
*Simultaneous charging means charging the entire fleet at the same time while “sequential” means breaking the fleet into non-simultaneous charging groups (here, a 50/50 split).
0.00
0.05
0.10
0.15
0.20
0.25
0.30
0.35
0.40
0.45
SCE PGE SDGE SMUD LADWP
Elec
tric
ity C
ost $
/kW
h
Depot Chg Simultaneous* Depot Chg Sequential* On-Route Chg (10 min) On-Route Chg (15 min)
$2/Gallon Diesel Fuel at Electricity Equivalent Rate = $0.28/kWhr
$1/Gallon CNG at Electricity Equivalent Rate = $0.13/kWhr
Draft for Discussion August 23, 2016
Annual Fuel Costs

LCFS Credit Value Base on Fuel Use
23
Annual Fuel Costs Draft for Discussion August 23, 2016
24
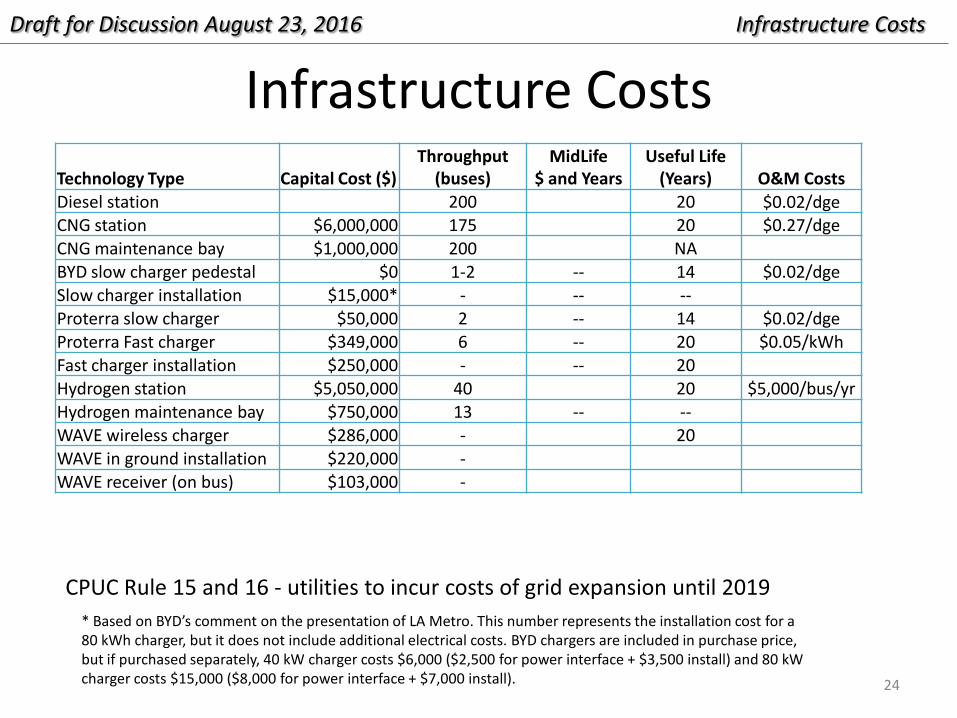
Infrastructure Costs Technology Type Capital Cost ($)
Throughput (buses)
MidLife $ and Years
Useful Life (Years) O&M Costs
Diesel station 200 20 $0.02/dge CNG station $6,000,000 175 20 $0.27/dge CNG maintenance bay $1,000,000 200 NA BYD slow charger pedestal $0 1-2 -- 14 $0.02/dge Slow charger installation $15,000* - -- -- Proterra slow charger $50,000 2 -- 14 $0.02/dge Proterra Fast charger $349,000 6 -- 20 $0.05/kWh Fast charger installation $250,000 - -- 20 Hydrogen station $5,050,000 40 20 $5,000/bus/yr Hydrogen maintenance bay $750,000 13 -- -- WAVE wireless charger $286,000 - 20 WAVE in ground installation $220,000 - WAVE receiver (on bus) $103,000 -
CPUC Rule 15 and 16 - utilities to incur costs of grid expansion until 2019 * Based on BYD’s comment on the presentation of LA Metro. This number represents the installation cost for a 80 kWh charger, but it does not include additional electrical costs. BYD chargers are included in purchase price, but if purchased separately, 40 kW charger costs $6,000 ($2,500 for power interface + $3,500 install) and 80 kW charger costs $15,000 ($8,000 for power interface + $7,000 install).
Infrastructure Costs Draft for Discussion August 23, 2016

LA Metro’s Analysis • 170 miles sufficient for all buses, electricity cost is $0.13/mile • Delay of ZEBs to 2025 creates bias in emissions analysis • High mid-life overhaul cost for BEBs should be zero with 12
year battery warranty – Could replace bus after 12 years or extend useful life to 18 years
• 1.35 electric buses to replace one CNG bus not warranted – Conflicts with prior statements about route length – Does not reflect longer bus range by 2025 – Ultra-conservative use of battery not needed with 12 year warranty
• Minimal maintenance cost savings inconsistent with manufacturer information and literature review
• Long-term CNG infrastructure costs not included • Land expansion questionable
25
Draft for Discussion August 23, 2016
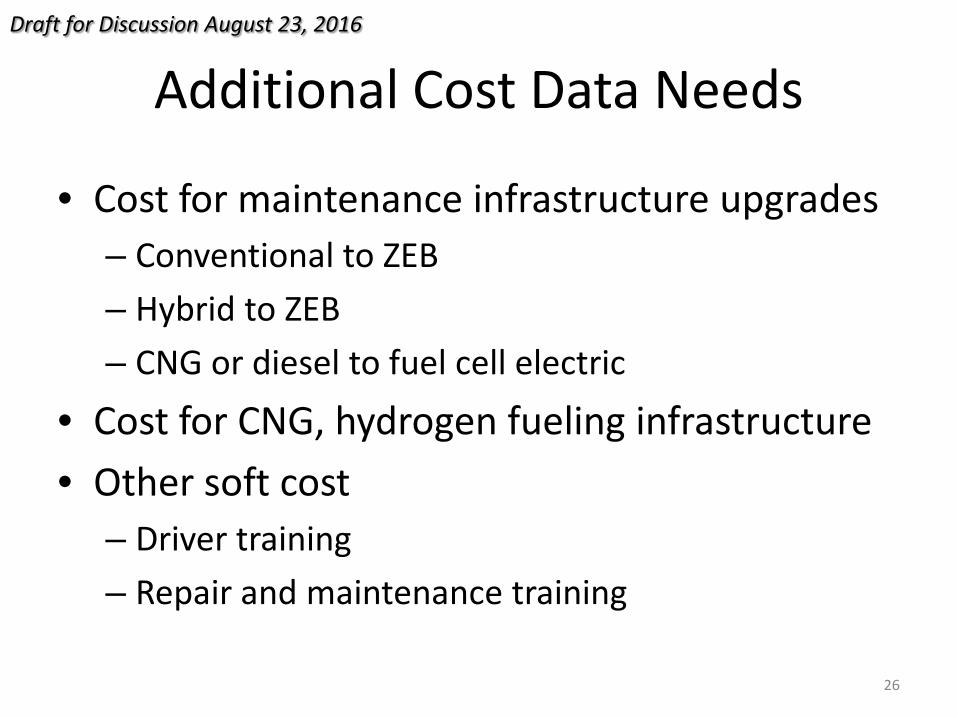
Additional Cost Data Needs
• Cost for maintenance infrastructure upgrades – Conventional to ZEB – Hybrid to ZEB – CNG or diesel to fuel cell electric
• Cost for CNG, hydrogen fueling infrastructure • Other soft cost
– Driver training – Repair and maintenance training
26
Draft for Discussion August 23, 2016


![NTD-XXXX[X] 900000024 REVE](https://static.fdocuments.us/doc/165x107/62e28b9eeda58f7f26611345/ntd-xxxxx-900000024-reve.jpg)