
Cost escalation forecasts - QCA - home page
64
www.pwc.com.au Cost escalation forecasts Final report Seqwater Supporting documentation for Seqwater’s QCA submission May 2014 CONFIDENTIAL
Transcript of Cost escalation forecasts - QCA - home page

www.pwc.com.au
CostescalationforecastsFinal report
Seqwater
Supporting
documentation for
Seqwater’s QCA
submission
May 2014
CONFIDENTIAL

Disclaimer
This Report has been prepared by PricewaterhouseCoopers Australia (PwC) for Seqwater inaccordance with the scope defined in our Proposal dated 28 March 2014.
The information, statements, statistics and commentary (together the ‘Information’) contained in thisreport have been prepared by PwC from publicly available material.
PwC has based this report on information received or obtained, on the basis that such information isaccurate. PwC makes no express or implied representation or warranty as the accuracy, reliability orcompleteness of the Information. The Information contained in this report has not been subject to anaudit or audit-standard review. The information must not be copied, reproduced, distributed, or used, inwhole or in part, for any purpose other than detailed in our Proposal and the conditions of Seqwater’sPanel Arrangement for Taxation, Accounting, Regulatory and Treasury Services without the writtenpermission of Seqwater and PwC.
Our responsibilities and liability are to Seqwater in the context of the use of our report for the purposesset out above. We do not accept any liability or responsibility in relation to the use of our report for anyother purpose.


Supporting documentation for Seqwater’s QCA submissionPwC i
Executive summary
OverviewThe QCA has been issued with a Referral Notice from the Treasurer to investigate andrecommend Bulk Water Prices for the 2015-16 to 2017-18 period. As part of this process,Seqwater has engaged PricewaterhouseCoopers (PwC) to determine appropriate escalationfactors for a range of cost categories, specifically:
employee and contract labour costs
contractors (service delivery)
electricity
chemicals
other materials and services
capital expenditure.
ApproachThis report identifies and analyses expected movements in the drivers of capital andoperating expenditure, and develops cost escalation factors for each of the cost categoriesspecified above. The analysis has drawn on financial data provided by Seqwater along withrelevant regulatory precedent and broader industry best-practice.
Key findingsTable 1 summarises the proposed escalation factors by cost category for the purposes ofinforming Seqwater’s regulatory submission to the Queensland Competition Authority (QCA)for the period covering 2014 to 2028.
Table 1: Proposed escalation factors by cost category
Cost Category Recommended escalation factor Source
Employee andcontract labourexpenses
Seqwater Certified Agreement (CA) to 2015/16
Queensland wage price index (WPI) forecastover remainder of the forecast period (to2027/28)
Seqwater CA (2013 to2016)
Queensland Treasury andTrade (WPI forecast to2016/17, extrapolatedover forecast period)
Contractors (servicedelivery)
Weighted index of the Queensland WPI forecast,CPI forecast and long run average of non-residential building construction index(Queensland).
Escalation factor = 0.38(WPI) + 0.15(CPI) +0.46(NRBCI)
Queensland Treasury andTrade (WPI forecast to2016/17, extrapolatedover forecast period)
Reserve Bank of Australia(CPI)
Australian Bureau ofStatistics (NRBCI)

Executive summary
Supporting documentation for Seqwater’s QCA submissionPwC ii
Cost Category Recommended escalation factor Source
Electricity
Estimate of actual price growth in 2013/14 and2014/15
Long run average annual growth in SKM MMAprice index for Queensland industrial customers,medium scenario, over remainder of forecastperiod
Seqwater largecontestable site contracts(growth in variable costs)
QCA (growth in fixednetwork costs)
SKM MMA (industrialelectricity price index,Queensland)
Chemicals CPIReserve Bank of Australia(CPI)
Other materials andservices
CPIReserve Bank of Australia(CPI)
Capital expenditure
Engineering Construction Price Index (to2022/23)
CPI over remainder of forecast period
Australian ConstructionIndustry Forum(ConstructionForecasting Council)
Reserve Bank of Australia(CPI)

Supporting documentation for Seqwater’s QCA submissionPwC i
Contents
Executive summary i
1 Project overview 1
2 Employee and contract labour costs 5
3 Contractors (service delivery) 16
4 Electricity 24
5 Chemicals 34
6 Other materials and services 39
7 Capital Expenditure 42
8 Summary 54


Confidential
Supporting documentation for Seqwater’s QCA submissionPwC 1
1 Project overview
1.1 BackgroundAs a regulated bulk water supplier in south east Queensland, Seqwater is required toprovide the Queensland Competition Authority (QCA) with expenditure forecasts, basedon reasonable and robust assumptions, which form an integral part of Seqwater’sregulatory submission. A key issue in determining the prudency and efficiency ofexpenditure is the application of escalation rates in forecasts.
The QCA has been issued with a Referral Notice from the Treasurer to investigate andrecommend Bulk Water Prices for the 2015-16 to 2017-18 period. Although this will entail alarge cost review component as per the previous Grid Service Provider (GSP) annual reviews,there is a longer term focus given the recovery horizon and mechanics of the Government’sBulk Water Price Path policy. This will require derivation of operating cost estimates to FY2028 as opposed to the prior annual regulatory submissions which were anchored to thefinancial year budget and covered only a shorter forecast period.
In addition to operating cost escalation factors, Seqwater also requires capital expenditureescalation rates. These will be used to rebase CAPEX estimates prior to FY 2014, as well asfuture capital expenditure to 2028.
Seqwater has engaged PricewaterhouseCoopers (PwC) to determine appropriate costescalation factors for the following expenditure items:
employee and contract labour costs
contractors (service delivery)
electricity
chemicals
other materials and services
capital expenditure.
1.2 Cost escalationCost escalation is an important feature in the estimation of a regulated business’ revenuerequirement over the regulatory period. It seeks to ensure that any input price movementsover the relevant period are captured accurately. Where revenue requirements and theassociated return on capital can be affected by unit prices movements it is important to selectcost escalation factors that reflect anticipated changes in input prices as closely as possible.
In determining an appropriate escalation factor for a particular cost item or set of cost items,there are a range of options.
Some costs may reasonably be assumed to move in line with a measure of underlyinginflation, such as the consumer price index (CPI). While this measure reflects a ‘basket ofgoods’ that may not be comparable to goods and services purchased by a business,particularly a bulk water entity, this index has been preferred by regulators in the past on thebasis that it is transparent, readily accessible and a familiar measure of inflation.

Project overview
Supporting documentation for Seqwater’s QCA submissionPwC 2
Other costs may more reasonably be expected to move in line with some composite index,reflecting the anticipated movement in relevant underlying (or related) cost categories. Forexample, movement in occupancy expenses can be assumed to move in line with a range offactors, including rents, utilities and maintenance costs.
Alternatively, for certain costs comprising a significant proportion of total expenses that areinfluenced by a range of specific factors, more ‘bespoke’ approaches may be warranted. Forexample, electricity costs form a significant proportion of overall operating expenditure forAustralia’s urban water sector. Accordingly, the Water Services Association of Australia(WSAA), which is the peak industry body for this industry, commissioned the development ofan electricity price index. This index, which is not publicly available, has been applied byurban water businesses in order to inform their regulatory proposals.
Yet regardless of the proposed index there should be a clear basis for its application,including detailed justification regarding how the measure will align with anticipatedchanges in input prices over time. Indeed, this justification is particularly important wherebusinesses choose to move away from specifically defined and universally accepted measuresof inflation such as CPI or other publicly available indices.
1.3 ApproachThis report identifies and analyses expected movements in Seqwater’s capital and operatingexpenditure, and develops costs escalation factors for each of the cost categories specifiedabove.
This assessment reviews each of the specified cost categories separately to determine anappropriate escalation factor. Each chapter:
Describes the nature of the cost category, including a review of Seqwater’s actual inputprice movements, where available and relevant to the assessment.
Reviews alternative escalation measures which could be applied to the specific costcategory (or cost sub-categories where relevant), including a review of precedent fromrecent determinations of regulated businesses by a range of Australian regulators.
Assesses broader market and economic trends which may influence future input pricemovements.
Determines an escalation factor (or factors) for the relevant cost category taking intoconsideration the extent to which any proposed escalation factor:
- is transparent, repeatable and the data readily accessible
- reflects the range of applicable cost pressures
- accounts for uncertainty, if appropriate.
In determining the most appropriate indexation factor for each cost category, we have drawnon relevant publicly available indices, such as the CPI and wage price index published by theAustralian Bureau of Statistics (ABS) along with related indices developed by other third-parties. Where appropriate, the construction of composite or weighted indices combiningpublicly available indices has also been considered.
Nominal and real forecasts for each escalation factor have been included for each costcategory. Nationwide forecasts of general inflation have been used to calculate the realescalation factors. For 2015/16, CPI estimates are based on forecasts published by theReserve Bank of Australia in the Statement of Monetary Policy (February 2014). Beyond2015/16, forecasts of CPI are based on the mid-point of the Reserve Bank of Australia’s(RBA) national inflation target range, described in Box 1.

Project overview
Supporting documentation for Seqwater’s QCA submissionPwC 3
We have applied forecasts of national, rather than Brisbane-specific, CPI as the measure ofinflation, as it is calculated from a larger sample and allows for consistent comparisons ofreal price increases nation-wide. In certain cases, we have presented movements in specificCPI series at a national level to movements in Brisbane general inflation for illustrativepurposes.
As presented below, movements in the CPI – All groups, Brisbane series have generally beenconsistent with the RBA’s target range, suggesting that the national inflation target rangealso provides a reasonable indication of general price movements in Brisbane.
Box 1: Forecasting using estimates of the consumer price index (CPI)
The consumer price index measures quarterly changes in the price of a ‘basket’ of goodsand services which account for a high proportion of expenditure by the CPI populationgroup (i.e. metropolitan households).1 CPI estimates are developed for Australia, andfor each of the eight state and territory capital cities.
The Reserve Bank of Australia (RBA) is responsible for Australia’s monetary policy. Indetermining monetary policy, the RBA has a duty to maintain a range of policyobjectives including price stability. To achieve these objectives, the RBA has an‘inflation target’ and seeks to keep CPI in the economy to 2 to 3 per cent, on average,over the medium term.
The graph below displays how annual changes (September to September) in theBrisbane All Groups CPI index (ABS) move within the RBA’s inflation target range.
Over the period from 1990 to 2013, Brisbane CPI fluctuated around a mean annualincrease of 2.9 percent. This result suggests that, although there were substantialvariations in annual price increases, on average, price increases in Brisbane aregenerally in line with the RBA’s target range.
For the purposes of forecasting CPI over the determination period, the mid-point of thisinflation target is proposed (2.5 per cent). While annual variations may be above orbelow this value, it is likely they will counteract each other when averaged over a longerperiod of time.
1 These goods and services include food and non-alcoholic beverages, alcohol and tobacco, clothing and footwear, housing,
furnishing, household equipment and services, health, transport, communication, recreation and culture, education andinsurance and financial services.
0.00%
1.00%
2.00%
3.00%
4.00%
5.00%
6.00%
7.00%
199
0
199
1
199
2
199
3
199
4
199
5
199
6
199
7
199
8
199
9
20
00
20
01
20
02
20
03
20
04
20
05
20
06
20
07
20
08
20
09
20
10
20
11
20
12
20
13

Project overview
Supporting documentation for Seqwater’s QCA submissionPwC 4
Recent developments regarding CPI forecasts
There are multiple factors which may affect future movements in inflation over theforward period. This includes:
movements in the exchange rate, which can impact prices for tradable items
a relatively subdued outlook for the labour market, which may exert downwardpressure on wages and therefore inflation
changes to the carbon price associated with its proposed repeal on 1 July 2014,which will affect electricity prices directly, and other good indirectly depending ontheir carbon intensity.
The RBA, however, has maintained that current inflation expectations remain withinthe 2 to 3 per cent target inflation band.2
1.3.1 Report structureThis report is structured as follows
Chapter 2 – Employee and contract labour costs
Chapter 3 – Contractors (service delivery)
Chapter 4 – Electricity
Chapter 5 - Chemicals
Chapter 6 – Other materials and services
Chapter 7 – Capital expenditure
Chapter 8 – Summary.
1.4 LimitationsGiven the significant organisational changes Seqwater has undergone in recent years(namely the merger with LinkWater and SEQ Water Grid Manager), historical cost data werenot readily available to form part of this review. This limited the extent to which historicalmovements in actual input costs could be compared with proposed escalation factors.
Seqwater’s forecast operating budget for 2014/15 has been analysed as part of this review,however data provided were not final and therefore subject to change. We do not expect thatany future revisions to these figures (unless significant) will have a material impact the costescalators recommended in this report.
Finally, the assessment does not evaluate the efficiency or prudency of Seqwater’s currentexpenditure levels.
2 Reserve Bank of Australia. 2014. Statement on Monetary Policy (February 2014). Available at:http://www.rba.gov.au/publications/smp/index.html.

Confidential
Supporting documentation for Seqwater’s QCA submissionPwC 5
2 Employee and contractlabour costs
We recommend that Seqwater escalate its annual employee and contract labourcosts in line with the current Certified Agreement to 2015/16 and the WPI over theremainder of the forecast period.
2.1 Overview
Seqwater employees, including permanent, fixed term and casual staff, are employed inaccordance with the Seqwater Certified Agreement (CA). The agreement governs a number ofemployment conditions including working hours, allowances, non-salary benefits and annualwage increases. The current agreement covers the period from July 2013 to June 2016.
2.1.1 Estimated employee and contract labour costsEmployee expenses are forecast to account for approximately 30 per cent of Seqwater’s totaloperating expenditure (estimated to be approximately $270 million) in 2014/15. The majorcomponents of employee expenses are summarised in Figure 1.
Salaries and wages comprise the majority of employee costs (72 per cent), followed bysuperannuation (9 per cent). The remainder of expenses are smaller items such asallowances and leave entitlements. Fixed term contract labour is estimated to account forless than 3 per cent of total employee costs.
Figure 1: Major cost components of employee and contract labour expenditure3
3 Seqwater data, PwC analysis
30%72%
9%3%
17%
Seqwater Operating Budget 2014-15
Employee and contract
labour costs
Salaries and wages
Superannuation
Contract labourOther
Employee and contract
labour costs
Employee and contract labour costs
Supporting documentation for Seqwater’s QCA submissionPwC 6
2.2 Alternative approaches for the escalation ofemployee and contract labour costs
2.2.1 Current indices and data sourcesThe ABS publishes indices and data sets which could be used to inform a forecast ofmovements in labour costs. These include:
average weekly ordinary time earnings
wage price index
compensation of employees.
Wage price index
The wage price index (WPI) measures the weighted average change in the labour cost perhour of the jobs that are performed in an industry. The weights in this calculation are thelabour hours required to perform each job.
The weights used in the WPI are held constant when calculating the time series. The mix oflabour hours in a particular year, ‘the base year’, is used as weights for the entire time series.The current base year for the series is 2008/09. As the weights of the WPI are held constant,the index measures the average magnitude of wage increases faced by an industry, assumingthat employers in the industry do not respond to changes in the relative wage by changingthe mix of workers they employ. That is, the wage increases are calculated based on theemployee composition observed in 2008/09.
The WPI includes only wage-related payments to employees. The Labour Price Index (LPI)combined wage and non-wage payments (leave, superannuation, payroll tax and workerscompensation) into a single measurement of total labour cost movements, though wasdiscontinued after the 2010/11 financial year.
Average weekly ordinary time earnings
The average weekly ordinary time earnings (AWOTE) data series is the sum of regular cashpayments made to employees divided by the number of employees. As a result, AWOTEmeasures the effect on total wages of changes in the mix of employees, and calculates wagegrowth after employers have responded to changes in relative wages by changing the mix oftheir employees.
Compensation of employees
Compensation of employees (COE) data is the comprehensive measure of income earned byemployees. Where the AWOTE data are simply the sum of regular cash payments toemployees, the COE data is the sum of regular and irregular (such as bonuses and paymentsfrom profit sharing schemes) payments to employees, plus employer superannuationcontributions.

Employee and contract labour costs
Supporting documentation for Seqwater’s QCA submissionPwC 7
2.2.2 Review of current regulatory precedentA range of alternative approaches have been proposed or applied by regulated businesses,including those in the electricity distribution sector, for the purposes of escalating labourcosts. These are summarised in Table 2.
Table 2: Application of alternative labour escalation factors, regulatory review
Business Regulator Proposed approach Approved approach
QueenslandUrbanUtilities
(2013/14 to2014/15regulatoryperiod)
QCA 3 per cent cost indexationapplied to labour.
This figure was calculatedbased on an internal analysisof industry trends, includingdirect labour costs, costsassociated withorganisational change, andany expected increases.
The analysis focused onCertified Agreements foremployees within Queenslandand comparable utilities
across Australia.4
The QCA appointed SKM toassist in its assessment ofoperating expenditure.
SKM concluded that the 3 percent increase was consistentwith that included in otherEnterprise BargainingAgreements either in place orunder negotiation. The QCAaccepted this finding.
The QCA also noted that theproposed escalation factorwas lower than long termaverage of the WPI as well asthe 3.5% WPI forecastreflected in the Queensland
budget for 2013-14.5
Unitywater
(2013/14 to2014/15regulatoryperiod)
QCA 4.05% over the regulatoryperiod.
Calculated based on thecurrent Certified Agreementwhich stipulated a 3.8%increase plus 0.25% for thefederal government’ssuperannuation guaranteeincrease.
The QCA appointed SKM toassist in its assessment ofoperating expenditure.
SKM concluded thatUnitywater’s wage increasewas high but consistent withother Enterprise BargainingAgreements where entitieshave had difficulty inattracting skilledtradespeople and engineers.
The QCA accepted SKM’s
assessment.6
4 Queensland Urban Utilities (2013) QCA Interim Price Monitoring, Information Return 2013-2015. Available at:http://www.qca.org.au/getattachment/74b33c76-c430-42da-83d8-c77dcd13a2d0/Queensland-Urban-Utilities-Submission-(Part-A).aspx
5 Queensland Competition Authority (2014) SEQ Price Monitoring for 2013-15 Part B – Queensland Urban Utilities. Available at:
http://www.qca.org.au/getattachment/f6955bad-060a-4027-a91d-6b13c4d9cb28/SEQ-Price-Monitoring-Final-Report-Part-B-QUU.aspx
6 Queensland Competition Authority (2014) SEQ Price Monitoring for 2013-15 Part B – Unitywater. Available at:http://www.qca.org.au/getattachment/fcd40f28-0919-4916-bc1a-ea7c7736b647/SEQ-Price-Monitoring-Final-Report-Part-B-Unitywate.aspx
Employee and contract labour costs
Supporting documentation for Seqwater’s QCA submissionPwC 8
Business Regulator Proposed approach Approved approach
Gold CoastWater
(2013/14 to2014/15regulatoryperiod)
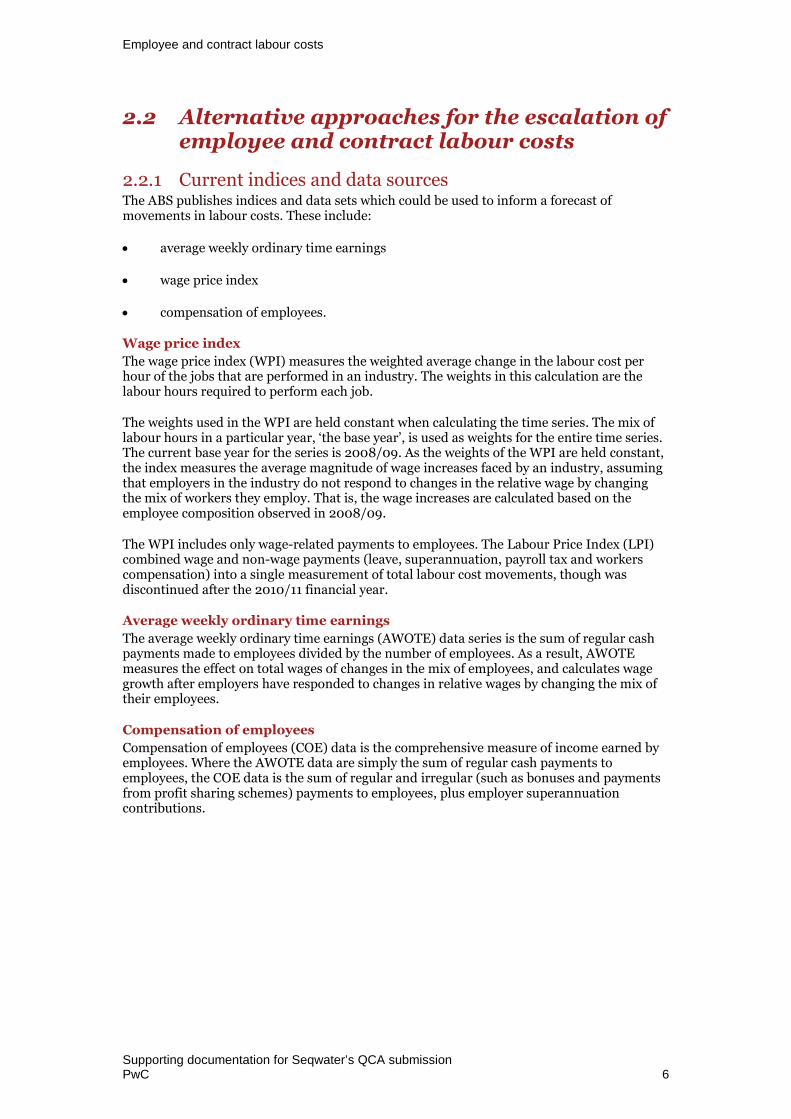
QCA 4 per cent over the regulatoryperiod.
This figure comprised alabour cost escalation of 3.5%in line with Deloitte AccessEconomics labour costforecasts, plus an additional0.5% escalation to account forthe impact of the wage rise onaccrued employee
entitlements.7
The QCA appointed SKM toassist in its assessment ofoperating expenditure.
Despite notinginconsistencies in Gold CoastWater’s calculations, SKMconsidered the 4 per centincrease was notunreasonable, reflectingAustralian marketconditions.
The QCA however did notaccept the additionalallowance for increasedemployee entitlements.
It determined theappropriate escalator was3.1%, in line with theCertified Agreement thatcovered the entire regulatory
period.8
MelbourneWater
(2013/14 to2017/18regulatoryperiod)
EssentialServices
Commission(Victoria)
2.5% per year over theregulatory period
Based on the VictorianGovernment’s wages policythat stipulates the total cost ofan agreement is no more than
2.5% annualised.9
This approach was acceptedby the ESC.
In its draft decision the ESCnoted that the approach toassessing wage rates wasgoverned by VictorianGovernment’s wages policy,which caps wage increases at
2.5% per annum.10
7 Gold Coast Water (2013) Gold Coast Water Price Monitoring Submission 2013-15. Available at:
http://www.qca.org.au/getattachment/37b1416e-3271-4d1e-af63-beb5ac3e4a97/Gold-Coast-Water-Submission.aspx
8 Queensland Competition Authority (2014) SEQ Price Monitoring for 2013-15 Part B –Gold Coast Water. Available at:
http://www.qca.org.au/getattachment/1d0f2252-c472-48b1-b3d1-940cd9df06fa/SEQ-Price-Monitoring-Final-Report-Part-B-Gold-Coas.aspx
9 Melbourne Water (2013) 2013 Water Plan. Available at:
http://www.melbournewater.com.au/aboutus/reportsandpublications/Documents/Melbourne_Water_2013_Water_Plan.pdf
10 Essential Services Commission (2013) Price Review 2013: Greater Metropolitan Water Businesses, Draft Decision. Available at:http://www.esc.vic.gov.au/getattachment/b1e2e093-1401-42eb-90d9-8cff7c760655/Executive-summary-(1).pdf

Employee and contract labour costs
Supporting documentation for Seqwater’s QCA submissionPwC 9
Business Regulator Proposed approach Approved approach
Energex
(2010/11 to2014/15regulatoryperiod)
AER Energex engaged a consultantto develop forecasts ofnominal wage increases,based on enterprisebargaining agreementnegotiations and analysis ofstatistical information. Theanalysis undertaken as part ofprocess is not publiclyavailable.
Energex proposed a constantnominal rate of 5.5%throughout the regulatoryperiod.
The AER did not accept theproposed rates, as it did notconsider Energex’s constantrate to accurately representthe volatility of the labourmarket.
The AER engaged AccessEconomics to develop agrowth forecast of overallQueensland LPI, and theelectricity, gas and water(EGW) industries for NSW,Queensland, Victoria, SouthAustralia, ACT and
Australia.11 This informationwas used to generate reallabour cost growth rates overthe five year regulatoryperiod.
Energex noted that it did notaccept the rationale behindall the adjustments made bythe AER, though applied theAER’s rates in its revised
proposal. 12
ErgonEnergy
(2010/11 to2014/15regulatoryperiod)
AER 4.4% in first year in line withthe existing Union CollectiveAgreement (UCA) escalationrate and 4.5% thereafter.
A single rate was applied forinternal and contractorlabour on the basis that itsUCA applied equally to bothcategories of labour.
The AER did not considerthese rates appropriate, as nodistinction was madebetween internal andcontract labour costs, andapplied the forecasts of LPIdeveloped by Access
Economics.13
While Ergon Energy disputedthe use of these rates in theirrevised regulatorysubmission, the AER upheldtheir draft decision in the
final determination.14
11 The escalation factors developed by Deloitte Access Economics are not publicly available, hence it is not possible to compare how
these escalation factors compared to that proposed by Energex or Ergon Energy.
12 Australian Energy Regulatory (2010) Queensland distribution determination, 2010-11 to 2014-15, Final Decision. Available at:
http://www.aer.gov.au/sites/default/files/Queensland%20distribution%20decision%20-%20May%202010.pdf .
13 The escalation factors developed by Deloitte Access Economics are not publicly available, hence it is not possible to compare how
these escalation factors compared to that proposed by Energex or Ergon Energy.
14 Australian Energy Regulatory (2010) Queensland distribution determination, 2010-11 to 2014-15, Final Decision. Available at:http://www.aer.gov.au/siteees/default/files/Queensland%20distribution%20decision%20-%20May%202010.pdf

Employee and contract labour costs
Supporting documentation for Seqwater’s QCA submissionPwC 10
2.2.3 Summary findingsThe ABS currently publishes three estimates of labour earnings, the WPI, AWOTE and COE.The WPI and AWOTE are published on a quarterly basis and are the two most popular datasets with which to develop forecasts of labour cost escalation rates, based on long runhistorical averages of these indices. There are a number of fundamental differences betweenthe series however, such that much debate has arisen as to which most accurately representsthe labour costs for which regulated businesses should be compensated.
In recent price monitoring reviews for south east Queensland retail water businesses, theQCA’s preference has been to escalate labour costs in line with current CAs. QueenslandUrban Utilities (QUU) escalated labour costs based on a review of CAs for comparableutilities across Queensland and Australia while Unitywater escalated labour costs in line withits current CA. Both approaches were accepted by the QCA.
Gold Coast Water on the other hand escalated expenses in line with a Deloitte AccessEconomics forecast of labour costs, plus an additional increase for associated increases inentitlements. This was rejected by the QCA, which instead applied the wage increasecontained in the Gold Coast Water CA.
In Victoria, the approach to escalating employee costs is tied to the Victorian Government’swages policy, which restricts increases to 2.5 per cent each year.
The AER consistently preferred the use of a forecast of the LPI in recent determinations, as itexcludes the compositional productivity effects present in the AWOTE series. Although anumber of electricity businesses have commissioned independent expert reports, eachsuggesting that the AWOTE is a more suitable index on which to base forecasts of labour costgrowth, the AER continued to uphold its preference for escalation forecasts to be based onthe LPI (while WPI includes wage-related payments, LPI also includes non-wage payments).Though, the LPI was no longer published by the ABS after the 2010/11 financial year.
More recently, in its Better Regulation Expenditure Forecast Assessment Guidelines forElectricity Distribution the AER stated that the WPI published by the Australian Bureau ofStatistics is its preferred index for assessing labour price changes over the forecast period.15
2.3 Market trends
2.3.1 Historical movements in wage price indicesFigure 2 compares movements in the wages of employees in the electricity, gas, water andwaste services (EGWWS) sector nationwide to those of Queensland employees across allindustries. Both groups have experienced real wage increases since 1999, averaging 1.25 percent and 0.73 per cent respectively (applying the annual increase in CPI - All Groups(Australia) as the measure of inflation). In nominal terms, the national EGWWS WPIaveraged 4.1 per cent growth annually, while the Queensland WPI averaged 3.6 per cent.
In general, the Queensland WPI has followed a similar trend to the nationwide EGWWS WPIover the past 15 years; the correlation of movements between the two series over this periodis equal to 0.64. Both series experienced a period of growth between 2002 and 2009, withgrowth slowing following the global financial crisis. While the annual wages growth withinthe nationwide EGWWS sector has been slightly higher than observed in the overallQueensland labour market, the general trends are relatively consistent between the twoseries.
15 Australian Energy Regulator (2013) Better Regulation Expenditure Forecast Assessment Guideline for Electricity Distribution.
Available at: http://www.aer.gov.au/sites/default/files/Expenditure%20Forecast%20Assessment%20Guideline%20-%20Distribution%20-%20FINAL.pdf.

Employee and contract labour costs
Supporting documentation for Seqwater’s QCA submissionPwC 11
Figure 2: Comparison of historic inflation to national EGWWS industry andQueensland WPI, June 1999 to 201316
2.3.2 Labour demandDemand for labour within the Queensland EGWWS industry grew steadily between May2007 and May 2012, with total employment more than doubling over the period. Inparticular, employment grew by 61.6 per cent between May 2010 and May 2012, an averagequarterly increase of 6.2 per cent. Total employment declined sharply between May 2012 andFebruary 2013 (by 42.8 per cent, or 18,966 employees), though has recently shown signs ofrecovery with employment increasing strongly over the year to February 2014 (Figure 3).
Figure 3: Queensland EGWWS industry employment, February 2007 toFebruary 201417
16 Australian Bureau of Statistics (2013) Wage Price Index – Decemberr 2013 Cat. No. 6345.0 Tables 8a and 9a. Available at
http://www.abs.gov.au/AUSSTATS/[email protected]/allprimarymainfeatures/3F85BC8B42C2D64ECA257B17000D36FC?opendocument
17 Department of Employment (2013) Labour Economics Office (LEO) Reports – Queensland. Available athttp://lmip.gov.au/default.aspx?LMIP/Publications/LabourEconomicsOfficeLEOReports/Queensland
0%
1%
2%
3%
4%
5%
6%
7%
1999 2000 2001 2002 2003 2004 2005 2006 2007 2008 2009 2010 2011 2012 2013
National EGWWS WPI Queensland WPI CPI - All groups, Australia
-
5,000
10,000
15,000
20,000
25,000
30,000
35,000
40,000
45,000
50,000
Feb-07 Feb-08 Feb-09 Feb-10 Feb-11 Feb-12 Feb-13 Feb-14

Employee and contract labour costs
Supporting documentation for Seqwater’s QCA submissionPwC 12
The number of vacant positions recorded within related occupations moved in line withindustry employment over the same period (Figure 4). The number of vacant Engineers,Automotive and Engineering Trades, and Electrotechnology and Telecommunications Tradespositions each at least doubled between May 2010 and November 2011, while the number ofvacant Engineering, ICT and Science Technicians, and Construction Trades positions alsogrew strongly.
From May 2012 however, the number of vacant positions in related occupations fellsignificantly, in line with the reduction in industry-wide employment presented in Figure 3.The total number of vacant positions across all related occupations halved from May 2012 toJuly 2013 (9,240 to 4,122). In particular, the number of vacant Engineers positions fell byover 70 per cent.
Unmet labour demand across all related occupations appears to have stabilised recently, asthe total number of vacant positions has remained relatively constant since July 2013,though engineer vacancies have continued to fall. The number of vacancies within theEngineering, ICT and Science Technicians; and Electrotechnology and TelecommunicationsTrades occupations have increased slightly since December 2013.
Figure 4: Growth in the number of Queensland EGWWS related vacancies,May 2010 to February 201418
Demand for labour is forecast to increase over the period 2012 to 2017 (Figure 5), withEGWWS employment projected to grow both in Brisbane and Queensland, though at lowerlevels than overall employment.19
18 Department of Employment (2014) Vacancy Report. Available at http://lmip.gov.au/default.aspx?LMIP/VacancyReport
19 Department of Employment (2013) Employment projections. Available at:http://lmip.gov.au/default.aspx?LMIP/EmploymentProjections
-
500
1,000
1,500
2,000
2,500
3,000
3,500
4,000
May-10 Nov-10 May-11 Nov-11 May-12 Nov-12 May-13 Nov-13
Engineers Engineering, ICT and Science Technicians
Automotive and Engineering Trades Construction Trades
Electrotechnology and Telecommunications Trades

Employee and contract labour costs
Supporting documentation for Seqwater’s QCA submissionPwC 13
Figure 5: Projected employment growth by industry, November 2012 toNovember 201720
2.3.3 Projections of the wage price indexQueensland Treasury and Trade (QTT) develops forecasts of the WPI as part of its annualbudgeting processes. The current forecasts, published in the 2013/14 Budget Strategy andOutlook budget paper, cover the period from 2013/14 to 2016/17 (see Table 3).
Table 3: QTT forecast movements in the Queensland WPI, 2013/14 to 2016/1721
2013/14 2014/15 2015/16 2016/17
Qld WPI (% change) 3.5% 3.5% 3.5% 3.5%
In the 2013/14 Economic Performance and Outlook, QTT notes the negative effects ofcurrent household caution and the high Australian dollar on Queensland employment.However, it expects state-wide employment to grow over the medium term, in response toincreased household spending driven by low interest rates, stronger income growth andfaster population growth thereby driving real wage increases throughout the state from2013/14 to 2016/17. 22
2.3.4 Current Seqwater Certified AgreementThe current Seqwater CA covers the three year period from July 2013 to June 2016. Theagreement includes both guaranteed and contingent increases, which are based on cashsavings being realised that are sufficient to fund the wage increase. Table 4 outlines thetiming of the guaranteed and contingent increases contained in the current agreement.
20 We note that November 2012 Queensland EGWWS employment levels do not align between the data sets used to develop Figure2 and Figure 4. While the 8.5 per cent growth between November 2012 and November 2017 in Figure 4 reflects an increase from32,800 employees to 35,600, actual employment in November 2012 as reported in Figure 2 was 28,700. This suggests state-widegrowth in EGWWS industry employment over the five year period could be up to 24.0 per cent (35,600/28,700).
21 Queensland Treasury and Trade (2013) Budget Strategy and Outlook (Section 2: Economic Performance and Outlook).
Available at http://budget.qld.gov.au/current-budget/budget-papers/bp2.php
22 Queensland Treasury and Trade (2013) Budget Strategy and Outlook (Section 2: Economic Performance and Outlook).Available at http://budget.qld.gov.au/current-budget/budget-papers/bp2.php
8.5%
10.0%
11.2%
10.0%
7.4%
15.2%
5.2%
11.4%
0% 2% 4% 6% 8% 10% 12% 14% 16%
Electricity, gas, water and waste services
Mining
Construction
All industries
Brisbane Queensland

Employee and contract labour costs
Supporting documentation for Seqwater’s QCA submissionPwC 14
Table 4: Wage increases stipulated in Seqwater's Certified Agreement
July2013
January2014
July2014
January2015
July2015
January2016
Guaranteed increase 2% - 1.50% - 1% -
Contingent increase - 0.50% 0.50% 0.50% 1% 0.50%
Total increase 2.0% 0.5% 2.0% 0.5% 2.0% 0.5%
Including contingency increases, the total annual increase set out in the CA equates to a 2.5per cent rise each year over the term of the agreement.23
2.4 Discussion
Overall our analysis suggests that moderate increases in real wages in the QueenslandEGWWS industry are likely to continue over the 2015/16 to 2017/18 regulatory period.
The wage price indices for both the national EGWWS industry and Queensland overall haveconsistently grown above general inflation in the past 15 years, though wage growth acrossQueensland appears to have moderated in recent years. Further, labour demand in theQueensland EGWWS sector appears to have recovered following a sharp decline in 2012,with four quarters of employment growth to February 2014.
The most recent Queensland WPI forecasts by QTT project growth of 3.5 per cent annually to2016/17, further supporting the view that real wages in Queensland will continue to grow inreal terms over the medium term.
In recent retail water price reviews, the QCA has accepted employee cost escalation in linewith current CAs. QUU analysed a range of CAs for comparable utilities across Queenslandand Australia in determining its escalation factor, while Unitywater applied the wageincreases contained in its current CA (in addition to a small increase related to changes to thefederal government superannuation guarantee). In contrast, Gold Coast Water’s approach toescalate employee costs in line with a Deloitte Access Economics labour cost forecast wasrejected and instead increases stipulated in its CA were applied by the QCA.
Our recommendation is to escalate contract labour at the same rate as salaried staff.Although there may be minor differences in growth rates over the medium term, contractlabour accounts for a negligible share of Seqwater’s total employee expenses (less than 3 percent) and as such applying a separate growth rate is not likely to have a material impact onoverall employee expenses. Further, fixed term staff are employed under the same CA aspermanent employees, suggesting both categories will follow a similar growth trend.
23 Given that wage increases are awarded every six months, the annual increase is in fact slightly higher at 2.51 per cent each year.This is rounded down to 2.5 per cent for simplicity.
Employee and contract labour costs
Supporting documentation for Seqwater’s QCA submissionPwC 15
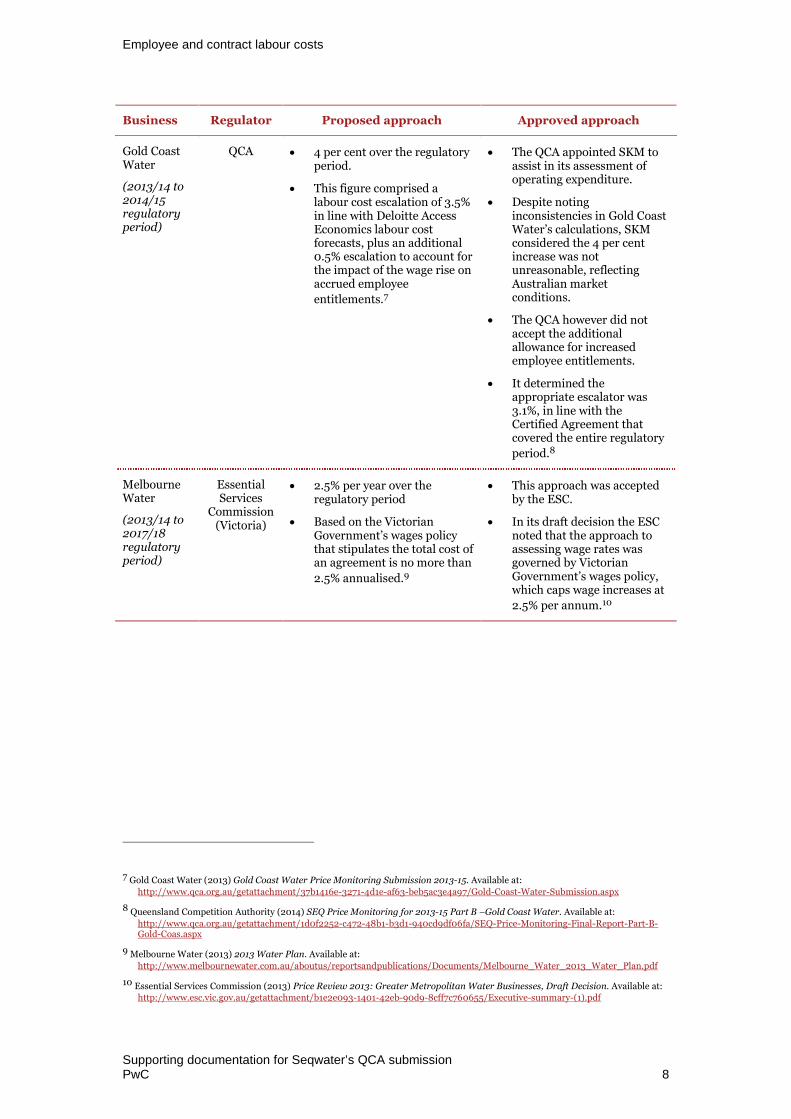
Based on this analysis, we recommend applying the following escalation rates for employeeand contract labour costs:
For the remainder of the current term of Seqwater’s CA (to June 2016), werecommend escalating employee costs in line with wage increases stipulated in the CA.Given the conservative nature of the wage rises, we recommend including contingencyincreases in the escalation rates.
For the remainder of the regulatory and forecast periods (to 2027/28) we recommendthe current QTT forecasts for growth in the Queensland WPI be applied. AlthoughQTT provides forecasts to 2016/17, we believe the WPI forecast provides a reasonablereflection of broader labour market tends over the medium term. This estimate alignsclosely with historical growth in the Queensland WPI, which has averaged 3.6 per centannually over the past 15 years (nominal), and is conservative compared withhistorical growth in the national EGWWS sector WPI, which has averaged 4.1 per centgrowth over the same period.
We do not consider that Seqwater is required to distinguish between permanent employeesand fixed term staff in its estimations of future labour cost escalation. We consider that thebroader labour market conditions which influence wages will apply equally to employees andfixed term contractors. We also note that the employment conditions of both groups aregoverned by the same CA.
2.4.1 Employee and contract labour escalation forecastThe following escalation factors are proposed for employee and fixed term contractors.Forecasts of CPI used to calculate real growth rates are based on current forecasts publishedby the RBA.24
Table 5: Forecast labour and fixed term contractor escalation rates
EscalationFactor
2013/14 2014/15 2015/16 2016/17 2017/182018/19 to
2027-28Nominal growthrate (%)
2.50% 2.50% 2.50% 3.50% 3.50% 3.50%
Real growth rate(%)
-0.49% -0.49% 0.00% 0.98% 0.98% 0.98%
24 The CPI estimate for 2014/15 is based on estimates published by the Reserve Bank of Australia (May 2014) for June 2014. TheRBA has estimated CPI for the year ending June 2015 to grow at between 2.5 and 3.5 per cent. For the purposes of developingreal estimates, the mid-point of this range has been applied. For all remaining years, the mid-point of the RBA inflation target (2to 3 per cent) has been applied. RBA estimates of inflation are published in its Statement on Monetary Policy, available athttp://www.rba.gov.au/publications/smp/index.html

Confidential
Supporting documentation for Seqwater’s QCA submissionPwC 16
3 Contractors (servicedelivery)
We recommend that Seqwater escalate its Contractor (service delivery) costs inline with a weighted index comprising WPI, CPI and the non-residential buildingconstruction index.
3.1 Overview
Seqwater outsources a number of services to third party providers on a contract basis,including civil, electrical and general maintenance, vegetation management and waterquality monitoring.
In order to develop an appropriate escalation factor for these operating items, Seqwater hasprovided a sample of service contracts, including the pricing variation methodology appliedto escalate costs. Expenditure items contained in the 2014/15 operating budget have beenmapped to specific contracts in order to develop a weighted escalation factor.
3.1.1 Estimated contractor (service delivery) costsContract services comprise the largest component of the Seqwater operating budget, totallingapproximately 36 per cent of total operating expenditure in 2014/15.
The largest components of expenses relate to operation and maintenance and consultancyexpenses, comprising 67 per cent and 25 per cent of contractor costs respectively (see Figure6).
Figure 6: Major cost components of contractors (service delivery) expenditure25
25 Seqwater data, PwC analysis
36%Contractors
(service delivery)
67%
25%
8%
Operation &maintenance
Consultancy expenses
Other
Contractors
(service delivery)
Seqwater Operating Budget 2014-15

Contractors (service delivery)
Supporting documentation for Seqwater’s QCA submissionPwC 17
3.1.2 Seqwater service contractsSeqwater outsources a number of services to third party providers on a contract basis,including civil, electrical and general maintenance, vegetation management and waterquality monitoring. Major service contracts include:
long-term operation and maintenance contracts for the Western Corridor RecycledWater Scheme and Gold Coast Desalination Plant
maintenance and minor works panel agreement consisting of multiple contracts with arange of service providers. Services relate to electrical, mechanical, building and civilmaintenance
general maintenance works not included in the panel agreement
water quality monitoring for Seqwater’s water treatment plants
other services including vegetation management and contractors not engaged inmaintenance provision.
In addition, Seqwater engages consultants to provide professional services across a range offields including engineering, water quality management, IT, and project management.
In general, movements in contracted prices are based on escalation clauses specified in legalagreements between Seqwater and the contractor. These escalation clauses seek to allow forvariations in the costs of inputs associated with delivering services. Generally the escalationclauses apply a relevant index to inputs associated with the service – including labour ornon-labour (such as energy, transportation, materials) inputs – and this is weighted in linewith each component’s contribution to the total contracted price.
Of the service contracts we have reviewed, two (representing 28 per cent of total contractorcosts) contain rise and fall provisions to escalate input costs over time. The indicesreferenced in these contracts include:
average weekly earnings, Queensland index (labour escalation)
WPI – professional, scientific and technical services (labour escalation)
CPI – Brisbane (general cost escalation).
In some cases, no rise and fall provisions are stipulated in pricing schedules. For example,contracts comprising the maintenance panel agreement do not include escalation clauses.The term of these contracts tends to be relatively short (usually two years) which may negatethe need to develop and apply escalation factors. Similarly, consultancy projects are oftenquoted on a project-by-project basis and run over shorter time periods, and therefore do notrequire costs to be escalated.

Contractors (service delivery)
Supporting documentation for Seqwater’s QCA submissionPwC 18
3.2 Alternative approaches for the escalation ofcontractor (service delivery) costs
3.2.1 Review of current regulatory precedentTable 6 summarises recent decisions of Australian regulators relating to the escalation ofcontractor (service delivery) costs.
Table 6: Application of alternative contractor escalation factors – regulatoryreview
Business Regulator Proposed approach Approved approach
Aurora Energy
(2012/13 to2016/17regulatoryperiod)
AER Aurora initially proposed toescalate its contractor costsaccording to CPI only.
AER was satisfied with thisin their draft determination.However, Aurora’s revisedproposal factored in real costescalation rates forcontractors in its operatingand capital expenditureforecasts.
AER considered this to be anunnecessary change, as therewas deemed to be norevision required based onthe results of the draftdetermination decision.
The AER decided thatcontractor costs would beescalated by CPI only, withno real cost increases,consistent with Aurora’sinitial submission.26
SunWater
(2012/13 to2016/17regulatoryperiod)
QCA SunWater proposed toescalate both materials andcontractor costs by 4 percent, based on forecastsproduced by Macromonitorand historical movements inthe Building Constructionand Non-ResidentialBuilding Constructionproducer price indices.
This method was proposedon the basis it provided thebest reflection of the types ofcontractor costs incurred.
Upon consultants’ review,ARUP and Aurecon bothconsidered SunWater’s 4 percent escalation factor to beappropriate, while Halcrowand GHD believed SunWaterhad not provided enoughrationale for this decision,and suggested thatcontractor costs be escalatedat the general rate ofinflation.
The QCA determined that4 per cent was a reasonableescalation rate for contractorcosts when compared againstconstruction cost index datafrom the short-to-mediumterm investment trend
analysis.27
26 Australian Energy Regulator (2012) Final Distribution Determination Aurora Energy Pty Ltd 2012–13 to 2016–17. Available athttp://www.qca.org.au/getattachment/5fad8dc9-2101-4097-bdc8-d90d25fbfbbb/SunWater-Irrigation-Price-Review-2012-17-Volum-(1).aspx
27 Queensland Competition Authority (2012) Sunwater Irrigation Price Review: 2012-17 (Volume 1): Final Report. Available at:
http://www.qca.org.au/getattachment/5fad8dc9-2101-4097-bdc8-d90d25fbfbbb/SunWater-Irrigation-Price-Review-2012-17-Volum-(1).aspx
Contractors (service delivery)
Supporting documentation for Seqwater’s QCA submissionPwC 19
Business Regulator Proposed approach Approved approach
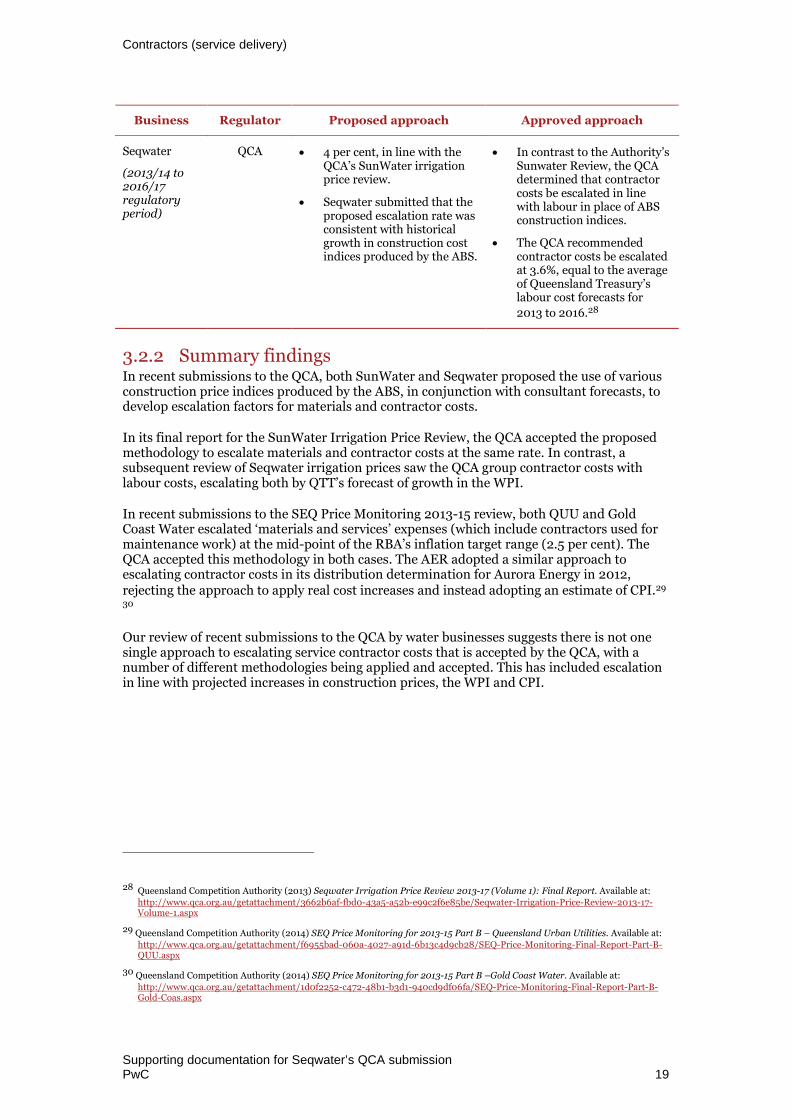
Seqwater
(2013/14 to2016/17regulatoryperiod)
QCA 4 per cent, in line with theQCA’s SunWater irrigationprice review.
Seqwater submitted that theproposed escalation rate wasconsistent with historicalgrowth in construction costindices produced by the ABS.
In contrast to the Authority’sSunwater Review, the QCAdetermined that contractorcosts be escalated in linewith labour in place of ABSconstruction indices.
The QCA recommendedcontractor costs be escalatedat 3.6%, equal to the averageof Queensland Treasury’slabour cost forecasts for
2013 to 2016.28
3.2.2 Summary findingsIn recent submissions to the QCA, both SunWater and Seqwater proposed the use of variousconstruction price indices produced by the ABS, in conjunction with consultant forecasts, todevelop escalation factors for materials and contractor costs.
In its final report for the SunWater Irrigation Price Review, the QCA accepted the proposedmethodology to escalate materials and contractor costs at the same rate. In contrast, asubsequent review of Seqwater irrigation prices saw the QCA group contractor costs withlabour costs, escalating both by QTT’s forecast of growth in the WPI.
In recent submissions to the SEQ Price Monitoring 2013-15 review, both QUU and GoldCoast Water escalated ‘materials and services’ expenses (which include contractors used formaintenance work) at the mid-point of the RBA’s inflation target range (2.5 per cent). TheQCA accepted this methodology in both cases. The AER adopted a similar approach toescalating contractor costs in its distribution determination for Aurora Energy in 2012,rejecting the approach to apply real cost increases and instead adopting an estimate of CPI.29
30
Our review of recent submissions to the QCA by water businesses suggests there is not onesingle approach to escalating service contractor costs that is accepted by the QCA, with anumber of different methodologies being applied and accepted. This has included escalationin line with projected increases in construction prices, the WPI and CPI.
28 Queensland Competition Authority (2013) Seqwater Irrigation Price Review 2013-17 (Volume 1): Final Report. Available at:http://www.qca.org.au/getattachment/3662b6af-fbd0-43a5-a52b-e99c2f6e85be/Seqwater-Irrigation-Price-Review-2013-17-Volume-1.aspx
29 Queensland Competition Authority (2014) SEQ Price Monitoring for 2013-15 Part B – Queensland Urban Utilities. Available at:http://www.qca.org.au/getattachment/f6955bad-060a-4027-a91d-6b13c4d9cb28/SEQ-Price-Monitoring-Final-Report-Part-B-QUU.aspx
30 Queensland Competition Authority (2014) SEQ Price Monitoring for 2013-15 Part B –Gold Coast Water. Available at:
http://www.qca.org.au/getattachment/1d0f2252-c472-48b1-b3d1-940cd9df06fa/SEQ-Price-Monitoring-Final-Report-Part-B-Gold-Coas.aspx

Contractors (service delivery)
Supporting documentation for Seqwater’s QCA submissionPwC 20
3.3 Market trends
Figure 7 presents historical movements in four price indices that have informed contractorcost escalation factors in regulatory recent reviews of Queensland water businesses, namely:
building construction index (Queensland)
non-residential building construction index (Queensland)
WPI (Queensland)
CPI (all groups, Australia).
Growth in the Queensland WPI has been relatively stable over the past decade, following asimilar trend to inflation albeit it at a higher growth rate of 3.9 per cent compared with 2.7per cent. Although the building construction and non-residential building constructionindices have been volatile in comparison, over the long term they have averaged similargrowth to the WPI. The building construction index for Queensland averaged 3.9 per centgrowth annually over the ten years to June 2013, while the non-residential index averaged3.6 per cent over the same period.
Figure 7: Comparison of service contract price indices to general inflation 31 32 33
Table 7 summarise average annual growth of the various price industries across various timeperiods. Price growth across all indices moderated between 2008 and 2013 compared withthe previous five years, particularly for the two construction series. Over the longer term,average growth has been similar for all three indices over ten years, between 3.6 per cent and3.9 per cent.
31 All figures are for June of the corresponding year
32 Australian Bureau of Statistics (2013) Producer Price Indexes – December 2013. Cat. No. 6427.0 Table 17. Available at:http://www.abs.gov.au/AUSSTATS/[email protected]/allprimarymainfeatures/6F15F0CA1F2C2EFECA25765800181C2B?opendocument
33 Australian Bureau of Statistics (2013) Wage Price Index – December 2013. Cat. No. 6345.0 Tables 8a and 9a. Available at
http://www.abs.gov.au/AUSSTATS/[email protected]/allprimarymainfeatures/3F85BC8B42C2D64ECA257B17000D36FC?opendocument
-5%
0%
5%
10%
15%
2003 2004 2005 2006 2007 2008 2009 2010 2011 2012 2013
PPI - Building Construction (Qld) PPI - Non-res building construction (Qld)WPI - Qld CPI, All groups - Australia

Contractors (service delivery)
Supporting documentation for Seqwater’s QCA submissionPwC 21
Table 7: Comparison of price growth in construction and wage price indices
Index
CAGR
2003-2008 2008 - 2013 2003 - 2013
PPI – Building Construction, Qld 7.9% 0.0% 3.9%
PPI – Non-residential building construction, Qld 9.0% -1.5% 3.6%
WPI, Qld 4.1% 3.6% 3.9%
CPI – All groups, Australia 3.1% 2.3% 2.7%
3.4 Discussion
In general, there is no single approach to escalating service contract costs that has beenadopted by regulated water businesses in Queensland.
Recent reviews by the QCA have seen a number of approaches applied and approved,including an estimate of general inflation, the Queensland WPI forecast and a long-runaverage of various construction-based price indices.
In instances where historical growth in construction based indices has been used to informescalation forecasts, the QCA has noted that these indices are at best an imperfect match ofwith a water business’s operating activities. In particular, building cost indices are moreclosely aligned to commercial, industrial and community service building activity than theyare to operating and maintaining civil engineering infrastructure associated with waterstorage and supply. Additionally, the underlying cost components of these indices do notnearly align with specific cost components of a water business.34
Despite these issues, the QCA considered the use of appropriate ABS labour and constructionindices was a reasonable approach to escalating contractor costs given the limitedinformation available on disaggregated cost indices.
Of the service contractor agreements we have reviewed, two agreements (representingapproximately 28 per cent of contractor costs) included rise and fall provisions, whichstipulated separate escalation factors for labour and general costs. The remaining contractorcosts not covered by these contracts (approximately 72 per cent of total contractor expenses)either did not contain specific rise and fall provisions, or were not available to review.
Given the varying availability of contract information available to determine underlying costcomponents of Seqwater’s contractor costs, we propose applying a weighted index to developan appropriate escalation factor.
34 See Queensland Competition Authority (2012) Sunwater Irrigation Price Review: 2012-17 (Volume 1): Final Report. Available
at: http://www.qca.org.au/getattachment/5fad8dc9-2101-4097-bdc8-d90d25fbfbbb/SunWater-Irrigation-Price-Review-2012-17-Volum-(1).aspx

Contractors (service delivery)
Supporting documentation for Seqwater’s QCA submissionPwC 22
3.4.1 Weighted index for contractor (service delivery) escalationThe proposed weighted index is based on the following three publicly available indices:
forecast of the Queensland WPI, produced by QTT35
forecast of CPI, based on Reserve Bank of Australia estimates36
10 year average to June 2013 of the non-residential building construction index,Queensland.37
We have made the following assumptions in applying the respective indices to contractorexpenses:
Where rise and fall provisions have been stipulated in a contract, we have applied WPIand CPI forecasts to labour and general costs respectively, based on weights providedin contract escalation clauses.38
For consultancy expenses, we have assumed that the major cost driver is labour andhave applied the WPI forecast to these costs.
In instances where no rise and fall provisions are included in contracts (such as themaintenance panel agreement) or contractor costs could not be linked to a specificcontract, we have escalated costs using the 10 year average growth rate of the non-residential building construction index. While this index may not perfectly align withSeqwater’s underlying cost components, regulatory precedent suggests this it is areasonable approach given the limited availability of disaggregated cost indices. 39 Inaddition, it provides a relatively conservative estimate compared with other commonlyreferenced historical indices such as the building construction index and WPI (seeTable 7).
Based on these assumptions, the weights applied to each index for total contractor (servicedelivery) costs are40:
WPI (Queensland)– 38 per cent
CPI – 15 per cent
non-residential building construction index (Queensland) – 46 per cent.
35 Queensland Treasury and Trade (2013) Budget Strategy and Outlook (Section 2: Economic Performance and Outlook). Availableat http://budget.qld.gov.au/current-budget/budget-papers/bp2.php
36 RBA estimates of inflation are published in its Statement on Monetary Policy (February 2014), available athttp://www.rba.gov.au/publications/smp/index.html
37 Australian Bureau of Statistics (2013) Producer Price Indexes – December 2013. Cat. No. 6427.0 Table 17. Available at:http://www.abs.gov.au/AUSSTATS/[email protected]/allprimarymainfeatures/6F15F0CA1F2C2EFECA25765800181C2B?opendocument
38 One contract includes the indices used to escalate labour and general costs, however does not state the weights applied to each
factor. We have reviewed Seqwater’s forecast operating expenditure for 2014/15 which provides a detailed breakdown of costcomponents relating to the contract and weighted labour and general costs based on projected expenditure.
39 See Queensland Competition Authority (2012) Sunwater Irrigation Price Review: 2012-17 (Volume 1): Final Report. Available
at: http://www.qca.org.au/getattachment/5fad8dc9-2101-4097-bdc8-d90d25fbfbbb/SunWater-Irrigation-Price-Review-2012-17-Volum-(1).aspx
40 Weights may not add due to rounding
Contractors (service delivery)
Supporting documentation for Seqwater’s QCA submissionPwC 23
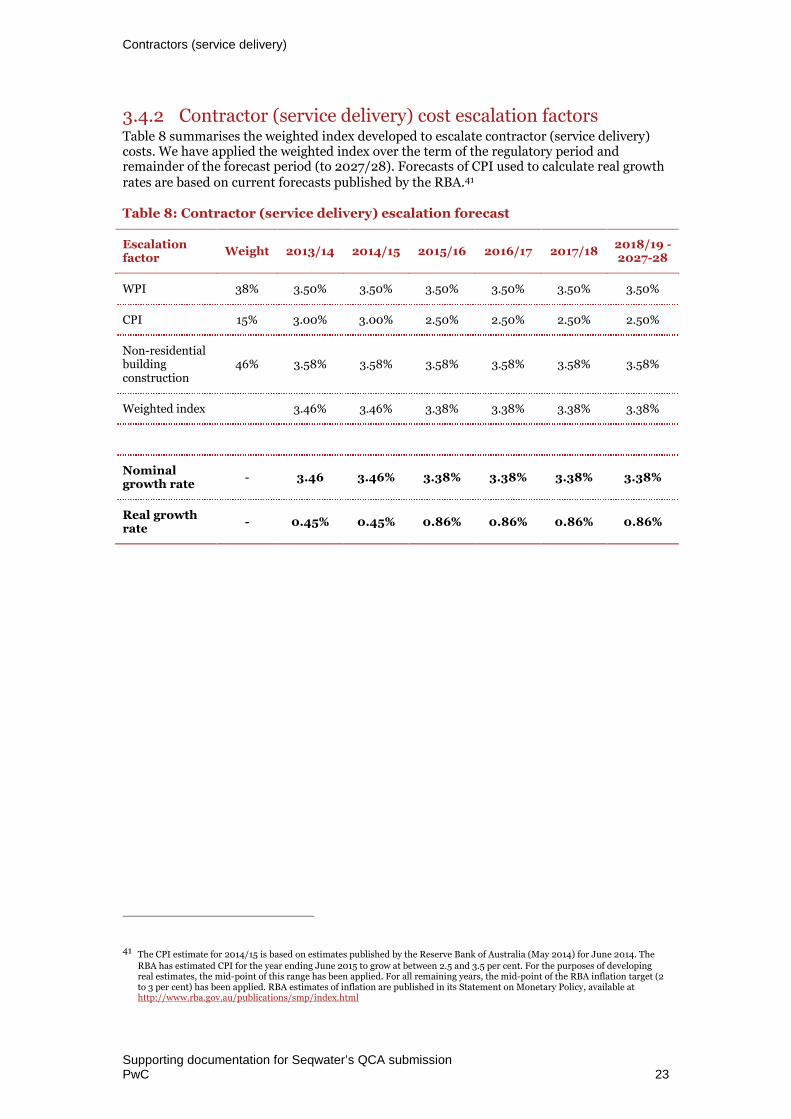
3.4.2 Contractor (service delivery) cost escalation factorsTable 8 summarises the weighted index developed to escalate contractor (service delivery)costs. We have applied the weighted index over the term of the regulatory period andremainder of the forecast period (to 2027/28). Forecasts of CPI used to calculate real growthrates are based on current forecasts published by the RBA.41
Table 8: Contractor (service delivery) escalation forecast
Escalationfactor
Weight 2013/14 2014/15 2015/16 2016/17 2017/182018/19 -2027-28
WPI 38% 3.50% 3.50% 3.50% 3.50% 3.50% 3.50%
CPI 15% 3.00% 3.00% 2.50% 2.50% 2.50% 2.50%
Non-residentialbuildingconstruction
46% 3.58% 3.58% 3.58% 3.58% 3.58% 3.58%
Weighted index 3.46% 3.46% 3.38% 3.38% 3.38% 3.38%
Nominalgrowth rate
- 3.46 3.46% 3.38% 3.38% 3.38% 3.38%
Real growthrate
- 0.45% 0.45% 0.86% 0.86% 0.86% 0.86%
41 The CPI estimate for 2014/15 is based on estimates published by the Reserve Bank of Australia (May 2014) for June 2014. TheRBA has estimated CPI for the year ending June 2015 to grow at between 2.5 and 3.5 per cent. For the purposes of developingreal estimates, the mid-point of this range has been applied. For all remaining years, the mid-point of the RBA inflation target (2to 3 per cent) has been applied. RBA estimates of inflation are published in its Statement on Monetary Policy, available athttp://www.rba.gov.au/publications/smp/index.html

Confidential
Supporting documentation for Seqwater’s QCA submissionPwC 24
4 Electricity
It is recommended that Seqwater escalate its electricity costs in line with estimatedgrowth in electricity costs for large contestable sites in 2013/14 and 2014/15, andthe long run average growth rate of SKM MMA’s electricity price index forecasts(medium scenario) for Queensland industrial customers over the remainder offorecast period.
4.1 Overview
Given the energy intensive nature of Seqwater’s operations (particularly its water treatmentplants, pump stations, the Gold Coast Desalination Plant and assets associated with theWestern Corridor Recycled Water Scheme), electricity costs form a major component of thebusiness’s operating budget.
Seqwater’s current retail electricity contract covers the 2014 and 2015 calendar years.Separate pricing schedules are negotiated for the Gold Coast Desalination Plant and MountCrosby Water Treatment Plants, with remaining treatment plants and pump stationsgrouped under a single schedule.
Considerable uncertainty currently exists around the likely price of carbon in 2014/15. Whilethe Federal Government has initiated the process of repealing the carbon tax, it remains tobe seen whether this will occur in 2014/15.42 This uncertainty further complicates anyforecasts of future electricity price movements.
Current forecasts of electricity price movements tend to be carbon-inclusive, and maytherefore not represent a likely growth path if the carbon price is repealed. Recent historicaldata (e.g. the CPI electricity indices) also are affected by the implementation of the carbontax in July 2012.
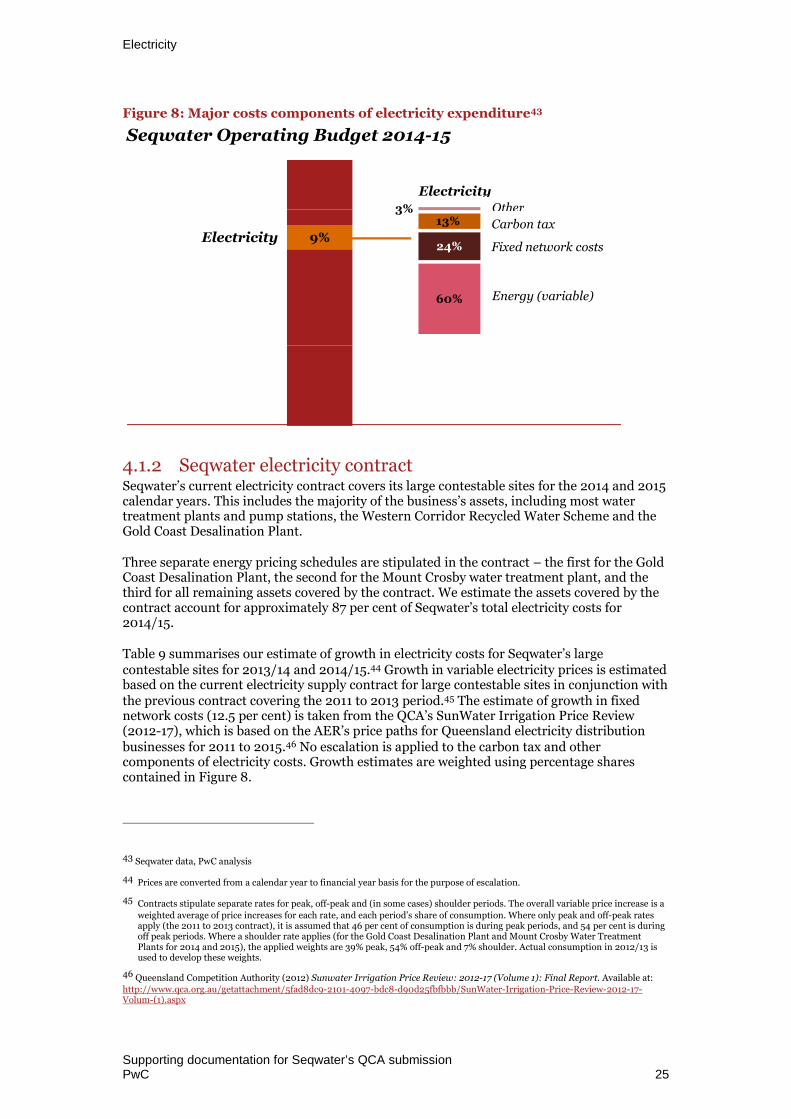
4.1.1 Estimated electricity costsSeqwater’s electricity costs are estimated to account for 9 per cent of total operatingexpenditure in 2014/15. Major cost components include variable energy costs (60 per cent ofelectricity expenditure), fixed network costs (24 per cent) and costs associated with thecarbon tax (13 per cent), as shown in Figure 8. Breaking cost components down further, thevariable energy category is comprised of wholesale, environmental and variable networkcomponents. The cost shares of these components were not provided by Seqwater.
42 Queensland Competition Authority (2013) Draft Determination Regulated Retail Electricity Prices 2014-15. Available at:http://www.qca.org.au/getattachment/3baf64ca-979f-4445-860c-b9f43716cc72/Draft-Determination.aspx
Electricity
Supporting documentation for Seqwater’s QCA submissionPwC 25
Figure 8: Major costs components of electricity expenditure43
4.1.2 Seqwater electricity contractSeqwater’s current electricity contract covers its large contestable sites for the 2014 and 2015calendar years. This includes the majority of the business’s assets, including most watertreatment plants and pump stations, the Western Corridor Recycled Water Scheme and theGold Coast Desalination Plant.
Three separate energy pricing schedules are stipulated in the contract – the first for the GoldCoast Desalination Plant, the second for the Mount Crosby water treatment plant, and thethird for all remaining assets covered by the contract. We estimate the assets covered by thecontract account for approximately 87 per cent of Seqwater’s total electricity costs for2014/15.
Table 9 summarises our estimate of growth in electricity costs for Seqwater’s largecontestable sites for 2013/14 and 2014/15.44 Growth in variable electricity prices is estimatedbased on the current electricity supply contract for large contestable sites in conjunction withthe previous contract covering the 2011 to 2013 period.45 The estimate of growth in fixednetwork costs (12.5 per cent) is taken from the QCA’s SunWater Irrigation Price Review(2012-17), which is based on the AER’s price paths for Queensland electricity distributionbusinesses for 2011 to 2015.46 No escalation is applied to the carbon tax and othercomponents of electricity costs. Growth estimates are weighted using percentage sharescontained in Figure 8.
43 Seqwater data, PwC analysis
44 Prices are converted from a calendar year to financial year basis for the purpose of escalation.
45 Contracts stipulate separate rates for peak, off-peak and (in some cases) shoulder periods. The overall variable price increase is a
weighted average of price increases for each rate, and each period’s share of consumption. Where only peak and off-peak ratesapply (the 2011 to 2013 contract), it is assumed that 46 per cent of consumption is during peak periods, and 54 per cent is duringoff peak periods. Where a shoulder rate applies (for the Gold Coast Desalination Plant and Mount Crosby Water TreatmentPlants for 2014 and 2015), the applied weights are 39% peak, 54% off-peak and 7% shoulder. Actual consumption in 2012/13 isused to develop these weights.
46 Queensland Competition Authority (2012) Sunwater Irrigation Price Review: 2012-17 (Volume 1): Final Report. Available at:http://www.qca.org.au/getattachment/5fad8dc9-2101-4097-bdc8-d90d25fbfbbb/SunWater-Irrigation-Price-Review-2012-17-Volum-(1).aspx
9%Electricity
60%
24%
13%3%
Energy (variable)
Fixed network costs
Other
Electricity
Seqwater Operating Budget 2014-15
Carbon tax

Electricity
Supporting documentation for Seqwater’s QCA submissionPwC 26
This methodology provides estimated increases of 17.46% and 5.71% for 2013/14 and2014/15 respectively.
Table 9: Estimated electricity prices increases, 2013/14 and 2014/15
Unweighted Weighted
Weight 2013/14 2014/15 2013/14 2014/15
Variable cost 60% 23.93% 4.49% 14.46% 2.71%
Fixed network cost 24% 12.50% 12.50% 3.00% 3.00%
Carbon tax and other 16% - - - -
Total 100% 17.46% 5.71%
4.2 Alternative approaches for the escalation ofelectricity costs
4.2.1 Review of current regulatory precedent
Table 10: Application of alternative electricity escalation factors – regulatoryreview
Business Regulator Proposed approach Approved approach
QueenslandUrbanUtilities
(2013/14 to2014/15regulatoryperiod)
QCA For its large contestablesites, QUU escalatedelectricity costs for the firsthalf of 2013/14 based oncontracts that ran toDecember 2013. For theremainder of the year QUUescalated prices based onforecasts developed bySKM.MMA for the WaterServices Association ofAustralia (WSAA), equal to2.3%.
For small contestable sites,QUU applied the SKM.MMAestimate for 2013/14.
For 2014/15, QUU appliedcost indexation of 10.3%based on the SKM.MMAmedium scenario for
commercial businesses.47
The QCA accepted QUU’sproposed price increased forits large sites were efficientas they were based oncontractual provisionsarising from competitivetender.
In line with previousreviews, the QCA consideredthe appropriate priceincrease to apply to smallsites is the QCA’s electricityretail tariff determinations,adjusted for the 19%discount that QUU receives.
The QCA accepted QUU’scost escalation estimate for2014/15 based on theSKM.MMA medium
scenario.48
47 Queensland Urban Utilities (2013) QCA Interim Price Monitoring, Information Return 2013-2015. Available at:
http://www.qca.org.au/getattachment/74b33c76-c430-42da-83d8-c77dcd13a2d0/Queensland-Urban-Utilities-Submission-(Part-A).aspx

Electricity
Supporting documentation for Seqwater’s QCA submissionPwC 27
Business Regulator Proposed approach Approved approach
Unitywater
(2013/14 to2014/15regulatoryperiod)
QCA Initial submission proposedprice escalation of 7.32% for2013/14 and 4.05% for2014/15, based on forecastincreases in electricity pricesfor Unitywater’s large sites.
The price escalation for2013/14 was based on adviceprovided to Unitywater byEnergetics, prior toelectricity contracts beingrenewed in May 2013.
Unitywater subsequentlyrevised its escalation forecastfor 2013/14 to 15.2 per centfollowing the renewal of itscontract rates.
The QCA accepted theenergy price increase for2013/14 as efficient as it isbased on contract rates forlarge contestable sites.
The QCA did however revisethe 2013/14 escalation factordown from 15.2% to 12.4%based on its 2013 retailelectricity determination,which contained a smallerincrease in regulatednetwork charges comparedwith Unitywater’s estimate.
The proposed priceescalation for 2014/15 wasaccepted by the QCA.
Gold CoastWater
(2013/14 to2014/15regulatoryperiod)
QCA Gold Coast Water (GCW)noted that small sitesaccount for approximately90 per cent of its electricitycosts.
For 2013/14 GCW proposedto escalate costs by 11.86%based on an AustralianEnergy Market Commission(AEMC) report thatestimated distribution costswould increase by 40 percent over the three years to2013/14. The estimate wasannualised to derive a2013/14 escalation factor.
4.5% in 2014/15, derived byannualising an AEMCforecast for Queenslandelectricity prices over two
years to 2014/15. 49
The QCA stated that theappropriate price increase toapply to small sites is theQCA’s electricity retail tariffdeterminations, adjusted forany discount.
The appropriate increase forlarge sites was deemed to bethe contract prices that cameinto effect on 1 January2014.
As GCW nominated a costescalator lower than theweighted QCA estimate, thiswas accepted as efficient.
GCW’s escalation rate of4.5% was accepted for
2014/15.50
48 Queensland Competition Authority (2014) SEQ Price Monitoring for 2013-15 Part B – Queensland Urban Utilities. Available at:http://www.qca.org.au/getattachment/f6955bad-060a-4027-a91d-6b13c4d9cb28/SEQ-Price-Monitoring-Final-Report-Part-B-QUU.aspx
49 Gold Coast Water (2013) Gold Coast Water Price Monitoring Submission 2013-15. Available at:
http://www.qca.org.au/getattachment/37b1416e-3271-4d1e-af63-beb5ac3e4a97/Gold-Coast-Water-Submission.aspx
50 Queensland Competition Authority (2014) SEQ Price Monitoring for 2013-15 Part B – Gold Coast Water. Available at:
http://www.qca.org.au/getattachment/1d0f2252-c472-48b1-b3d1-940cd9df06fa/SEQ-Price-Monitoring-Final-Report-Part-B-Gold-Coas.aspx

Electricity
Supporting documentation for Seqwater’s QCA submissionPwC 28
Business Regulator Proposed approach Approved approach
SunWater
(2012/13 to2016/17regulatoryperiod)
QCA In its initial submission,SunWater proposedescalating electricity costs atCPI, with annualadjustments during theregulatory period to accountfor differences betweenforecast and actual costs.
SunWater later revised itsmethodology to escalateprices by 10.5% per annumreflecting the averageBenchmark Retail Cost Index(BRCI) between 2008 and2012.
In addition, SunWaterproposed further escalationof 10 per cent in 2012/13 inline with the introduction ofa carbon price, and 1 per centin 2015-16 to reflect thecommencement of carbontrading.
For 2012-13, the QCArecommended an escalationfactor of 12.5 percent. Thisvalue reflected a 10 percentrise due to the AustralianGovernment’s carbon taxplus the QCA’s estimate ofinflation (2.5 percent).
For 2013-14 to 2016-17, theQCA reviewed the variousdrivers of electricity costs forthe balance of SunWater’sregulatory period anddetermined that a weightedannual increase of 6.6percent per annum, or forthe purposes of forecasting,rounded to 7.0 percent, wasappropriate.
An additional percentagepoint escalation wasincluded in 2015-16 toaccount for the introduction
of carbon trading. 51
4.2.2 Summary findingsIn its 2013-15 price monitoring review for south east Queensland water retailers, the QCAapplied separate methodologies for escalating electricity prices for small and large sites overthe first year of the regulatory period.
For small sites, the QCA stated that the appropriate increase is the Authority’s retailelectricity determinations, less any discount received by the business. For large sites, theQCA accepted the price increase contained in electricity contracts as being efficient, as theyare based on contractual provisions arising from competitive tender.
For the second year of the regulatory period, the proposed approach to escalation differedamongst businesses. QUU escalated prices for both small and large sites based onSKM.MMA’s electricity forecasts developed for WSAA. Unitywater’s escalation rate wasbased forecast price increases for its large sites, while Gold Coast Water escalated costs basedon an AEMC forecast of retail electricity price increases in Queensland. In all three cases theescalation rate was accepted by the QCA.
The escalation factors recommended by the QCA in its SunWater irrigation price review for2012-2017 involved a number of assumptions and calculations. For the first year of theregulatory period, the QCA recommended a 10 per cent increase to account for theintroduction of a carbon price, in addition to inflation. For the remainder of the regulatoryperiod, the Authority reviewed various cost drivers influencing SunWater’s electricity costsand produced a weighted average based on distribution, transmission, energy and retail costincreases. An additional increase was included in 2015/16 to account for the expectedcommencement of carbon trading.
51 Queensland Competition Authority (2012) SunWater Irrigation Price Review: 2012-17. Available at:
http://www.qca.org.au/getattachment/5fad8dc9-2101-4097-bdc8-d90d25fbfbbb/SunWater-Irrigation-Price-Review-2012-17-Volum-(1).aspx
Electricity
Supporting documentation for Seqwater’s QCA submissionPwC 29
4.3 Market Trends
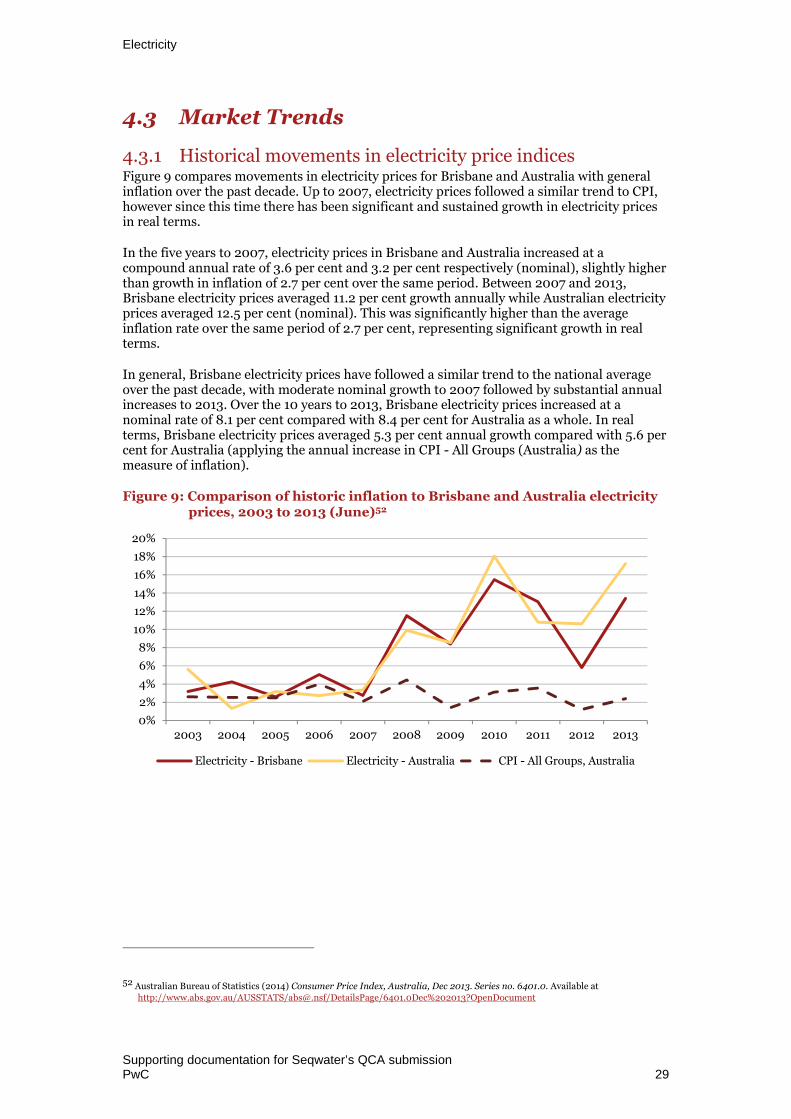
4.3.1 Historical movements in electricity price indicesFigure 9 compares movements in electricity prices for Brisbane and Australia with generalinflation over the past decade. Up to 2007, electricity prices followed a similar trend to CPI,however since this time there has been significant and sustained growth in electricity pricesin real terms.
In the five years to 2007, electricity prices in Brisbane and Australia increased at acompound annual rate of 3.6 per cent and 3.2 per cent respectively (nominal), slightly higherthan growth in inflation of 2.7 per cent over the same period. Between 2007 and 2013,Brisbane electricity prices averaged 11.2 per cent growth annually while Australian electricityprices averaged 12.5 per cent (nominal). This was significantly higher than the averageinflation rate over the same period of 2.7 per cent, representing significant growth in realterms.
In general, Brisbane electricity prices have followed a similar trend to the national averageover the past decade, with moderate nominal growth to 2007 followed by substantial annualincreases to 2013. Over the 10 years to 2013, Brisbane electricity prices increased at anominal rate of 8.1 per cent compared with 8.4 per cent for Australia as a whole. In realterms, Brisbane electricity prices averaged 5.3 per cent annual growth compared with 5.6 percent for Australia (applying the annual increase in CPI - All Groups (Australia) as themeasure of inflation).
Figure 9: Comparison of historic inflation to Brisbane and Australia electricityprices, 2003 to 2013 (June)52
52 Australian Bureau of Statistics (2014) Consumer Price Index, Australia, Dec 2013. Series no. 6401.0. Available athttp://www.abs.gov.au/AUSSTATS/[email protected]/DetailsPage/6401.0Dec%202013?OpenDocument
0%
2%
4%
6%
8%
10%
12%
14%
16%
18%
20%
2003 2004 2005 2006 2007 2008 2009 2010 2011 2012 2013
Electricity - Brisbane Electricity - Australia CPI - All Groups, Australia
Electricity
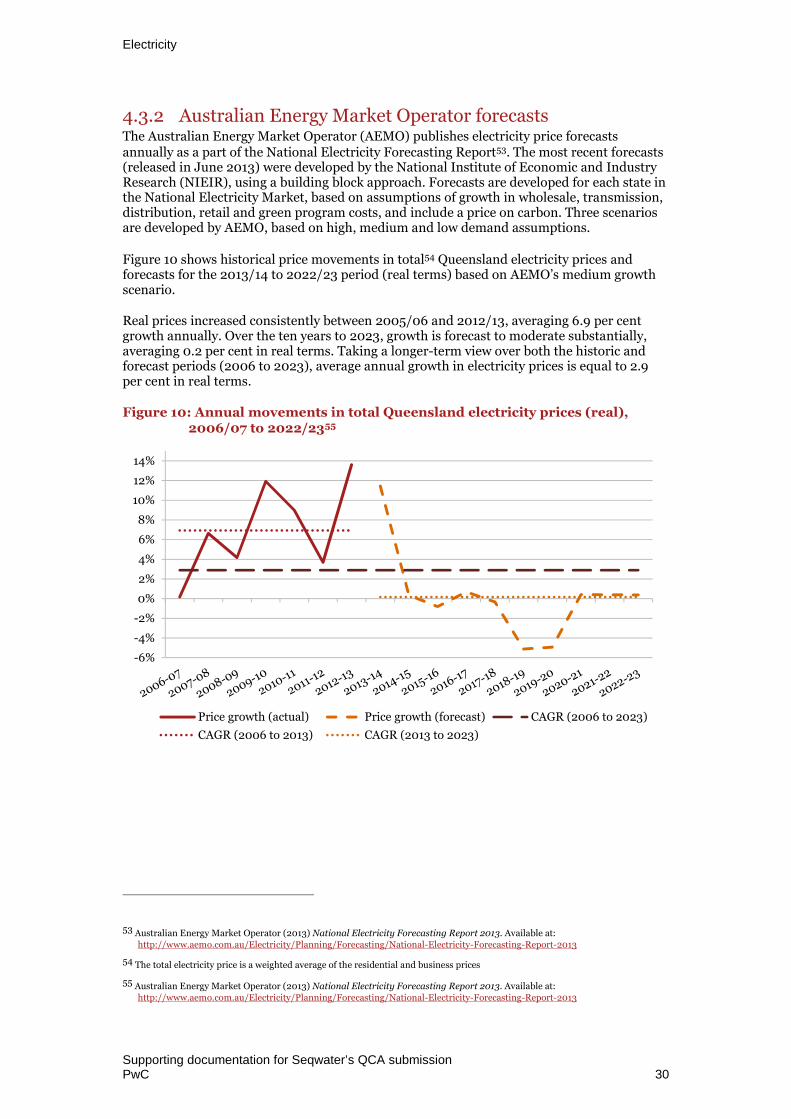
Supporting documentation for Seqwater’s QCA submissionPwC 30
4.3.2 Australian Energy Market Operator forecastsThe Australian Energy Market Operator (AEMO) publishes electricity price forecastsannually as a part of the National Electricity Forecasting Report53. The most recent forecasts(released in June 2013) were developed by the National Institute of Economic and IndustryResearch (NIEIR), using a building block approach. Forecasts are developed for each state inthe National Electricity Market, based on assumptions of growth in wholesale, transmission,distribution, retail and green program costs, and include a price on carbon. Three scenariosare developed by AEMO, based on high, medium and low demand assumptions.
Figure 10 shows historical price movements in total54 Queensland electricity prices andforecasts for the 2013/14 to 2022/23 period (real terms) based on AEMO’s medium growthscenario.
Real prices increased consistently between 2005/06 and 2012/13, averaging 6.9 per centgrowth annually. Over the ten years to 2023, growth is forecast to moderate substantially,averaging 0.2 per cent in real terms. Taking a longer-term view over both the historic andforecast periods (2006 to 2023), average annual growth in electricity prices is equal to 2.9per cent in real terms.
Figure 10: Annual movements in total Queensland electricity prices (real),2006/07 to 2022/2355
53 Australian Energy Market Operator (2013) National Electricity Forecasting Report 2013. Available at:http://www.aemo.com.au/Electricity/Planning/Forecasting/National-Electricity-Forecasting-Report-2013
54 The total electricity price is a weighted average of the residential and business prices
55 Australian Energy Market Operator (2013) National Electricity Forecasting Report 2013. Available at:http://www.aemo.com.au/Electricity/Planning/Forecasting/National-Electricity-Forecasting-Report-2013
-6%
-4%
-2%
0%
2%
4%
6%
8%
10%
12%
14%
Price growth (actual) Price growth (forecast) CAGR (2006 to 2023)
CAGR (2006 to 2013) CAGR (2013 to 2023)

Electricity
Supporting documentation for Seqwater’s QCA submissionPwC 31
4.3.3 SKM MMA forecastsIn 2012 the members of WSAA commissioned SKM MMA to develop electricity priceforecasts at the state level out to 2032. Price indices were developed for four customer classes- residential, commercial, industrial and energy intensive. Three scenarios were modelled(high, medium and low), differentiated primarily by the carbon price path assumption. Themedium scenario assumes a fixed carbon price to 2016, falling following the commencementof a floating price, and growing at 3.5 per cent annual in real terms thereafter. The highscenario emulates the Federal Treasury’s Core Policy scenario, designed to meet an emissionreduction target of a 5 per cent cut to 2000 emission levels by 2020. The low scenarioassumes the carbon price is abolished in 2016 and subsequently reinstated in 2020 in linewith international action, escalating at a rate of 2.5 per cent annually thereafter.
Figure 11 shows annual real price growth in Queensland retail electricity prices for industrialcustomers56 between 2014 and 2028 under SKM MMA’s low, medium and high scenarios.The low scenario displays a degree of volatility resulting from the repeal and subsequentreinstatement of a carbon price, while the medium and high scenarios display smoother pricegrowth paths.
Despite the large price movements in the low scenario in 2016 and 2020, average growth ismoderate over the forecast period (to 2028), at 3.0 per cent annually in real terms. Themedium and high scenarios produce higher annual growth estimates due to the continuationof the carbon price, and higher assumed carbon price growth, with average annual growth of3.4 per cent and 4.3 per cent respectively.
Figure 11: SKM MMA electricity price growth forecasts, Queensland, 2013/14 to2027/28 (real)57
56 According to SKM MMA, the industrial category comprises loads such as industrial processes, production and water pumping.This aligns most closely with Seqwater’s core activities as a bulk water supplier.
57 SKM MMA (November 2012), Energy Price Forecasts 2013 to 2032 (Final Draft). Not publicly available.
-30.0%
-20.0%
-10.0%
0.0%
10.0%
20.0%
30.0%
Industrial (Low) CAGR (Low)
Industrial (Medium) CAGR (Med)
Industrial (High) CAGR (High)

Electricity
Supporting documentation for Seqwater’s QCA submissionPwC 32
4.4 Discussion
Queensland electricity prices have increased significantly over the past six years, growing by59.6 per cent in real terms between 2006/07 and 2012/13.58 However, it is unclear whetherthis trend will continue over the medium term. Analysts have argued that electricity pricesare likely to increase over the coming period, driven by the rising costs of production andincreased adoption of more expensive renewable energy sources.59 The QCA’s draftdetermination for electricity prices in 2014/15 contains tariff increases in line with recenttrends, with most retail tariffs increasing by at least 10 per cent compared with the previousyear60.
In contrast, price forecasts released by AEMO indicate growth will be more moderate overthe coming decade, citing the decreased cost of electricity distribution.61 Over the 10 yearforecast period to 2022/23, AEMO estimate average annual growth of 0.2 per cent inelectricity prices in real terms. Electricity price forecasts produced by SKM MMA are alsorelatively moderate compared with recent trends, with Queensland electricity price growthfor industrial customers averaging 3.4 per cent annually to 2028 (real terms) under themedium scenario.
The already difficult task of developing reliable electricity price forecasts is furthercomplicated by the current uncertainty surrounding carbon pricing. While the FederalGovernment has initiated the process of repealing the carbon tax, it remains to be seen whenthis will be achieved.
In its recent review of SEQ retail water pricing, the QCA recommended escalating prices inthe first year using the most recent retail electricity determination for small sites, andescalation rates included in current contracts held with electricity providers for large sites.For subsequent years, a less uniform approach was adopted, with a range of methodologiesaccepted, including those based on estimates produced by consultants and regulatory bodies.
Given this variable precedent, we recommend escalating prices for 2013/14 and 2014/15based on the price schedules in Seqwater’s electricity contracts for large contestable sites(which cover 87 per cent of total electricity costs in 2014/15), in conjunction with an estimateof fixed network cost increases cited by the QCA in its SunWater Irrigation Pricing Review2012-17 (calculations presented in Table 9).
For the remainder of the forecast period, we recommend applying the average annual growthrate of SKM MMA’s electricity price index (between 2013 and 2028) for Queenslandindustrial customers under the medium scenario, equal to 3.4 per cent in real terms. Thisreflects our expectation that while future price growth is likely to moderate compared withrecent historical trends, it is unlikely that major cost drivers will dissipate to the point whereno real growth occurs. While the federal government has initiated the process of repealingthe carbon tax, the ultimate success of this initiative remains uncertain given the currentpolitical climate. We therefore believe it is prudent to apply a growth scenario that is carbonprice inclusive, with any future legislative changes likely to be taken into account by the QCAif and when they occur.
58 Australian Energy Market Operator (2013) National Electricity Forecasting Report 2013. Available at:
http://www.aemo.com.au/Electricity/Planning/Forecasting/National-Electricity-Forecasting-Report-2013
59 Ibisworld (2013) Business Environment Profiles: Electricity Service Price. Available at
http://clients1.ibisworld.com.au/reports/au/bed/default.aspx?entid=292
60 Queensland Competition Authority (2013) Draft Determination Regulated Retail Electricity Prices 2014-15. Available at:
http://www.qca.org.au/getattachment/3baf64ca-979f-4445-860c-b9f43716cc72/Draft-Determination.aspx
61 Australian Energy Market Operator (2013) Economic Outlook Information Paper 2013. Available athttp://www.aemo.com.au/~/media/Files/Other/planning/NEFR/2013/Economic_Outlook_Information_Paper_2013.pdf.ashx

Electricity
Supporting documentation for Seqwater’s QCA submissionPwC 33
Applying a long term average rather than specific annual estimates reflects the inherentcomplexity of forecasting electricity price movements, which is exacerbated by the currentuncertainty around carbon pricing. While this forecast is conservative compared with the tenyear average of growth in Brisbane electricity prices (as measured by the electricity CPIindex, equal to 5.3 per cent in real terms) we believe this is an appropriate approach givensignificant uncertainty around future electricity price movements.
4.4.1 Electricity cost escalation factorsTable 11 presents the proposed electricity escalation rates. Forecasts of CPI used to adjustnominal values to real values (for 2013/14 and 2014/15) and real values to nominal values(for remaining years) are based on current forecasts published by the RBA.62
Table 11: Forecast electricity escalation rates63
EscalationFactor
2013/14 2014/15 2015/16 2016/17 2017/182018/19 to
2027-28
Nominal growthrate (%)
17.46% 5.71% 6.03% 6.03% 6.03% 6.03%
Real growth rate(%)
14.04% 2.63% 3.44% 3.44% 3.44% 3.44%
62 The CPI estimate for 2014/15 is based on estimates published by the Reserve Bank of Australia (May 2014) for June 2014. TheRBA has estimated CPI for the year ending June 2015 to grow at between 2.5 and 3.5 per cent. For the purposes of developingreal estimates, the mid-point of this range has been applied. For all remaining years, the mid-point of the RBA inflation target (2to 3 per cent) has been applied. RBA estimates of inflation are published in its Statement on Monetary Policy, available athttp://www.rba.gov.au/publications/smp/index.html
63 2013/14 and 2014/15 values are calculated in nominal terms and converted to real values using CPI estimates. For remainingyears, forecasts are presented in real terms and adjusted to nominal values using a forecast of CPI.

Confidential
Supporting documentation for Seqwater’s QCA submissionPwC 34
5 Chemicals
It is recommended that Seqwater escalate its chemical costs in line with CPI.
5.1 Overview
Seqwater purchases chemicals primarily for use in its water treatment operations. Thebusiness manages close to 50 water treatment and advanced water treatment plants, as aresult chemical costs form a significant component of the operating budget.
5.1.1 Estimated chemical costsIn 2014/15, Seqwater forecasts chemicals expenditure to account for approximately 6.0 percent of total operating costs. Of total chemical costs, close to 70 per cent are comprised ofthree chemicals – alum, sodium hypochlorite and hydrated lime (see Figure 12).
Figure 12: Major cost components of chemicals expenditure64
5.2 Alternative approaches for the escalation ofchemicals costs
5.2.1 Review of current regulatory precedent
Queensland – Queensland Competition Authority
In its submission to the 2013-15 Interim Price Monitoring review, QUU proposed to escalatechemical costs using an estimate of inflation produced by the Reserve Bank of Australia. Thiswas based on advice from PwC that noted a lack of publicly available forecasts suitable forspecifically escalating chemical costs.
64 Seqwater data, PwC analysis
6%Chemicals
40%
18%
11%
31%
Alum
Sodium hypochlorite
Other
Chemicals
Seqwater Operating Budget 2014-15
Hydrated lime

Chemicals
Supporting documentation for Seqwater’s QCA submissionPwC 35
In submissions to the 2011-12 Interim Price Monitoring review, Unitywater and Allconnexalso proposed to escalate chemicals prices using different measures of inflation. WhileUnitywater applied RBA forecasts, equal to 3 percent in 2012-13 and 3.07 percent in 2013-14,Allconnex proposed to escalate its chemical costs in 2011-12 using the inflation forecastreported by Australian Government in July 2010, equal to 2.7 percent,65 and at 2.5 percentthereafter. The QCA accepted these cost escalation methodologies. 66
In its 2010 price review submission, GAWB considered that increases in its major chemicalexpenditure items have been greater than CPI, and proposed to escalate its chemicals costsaccording to the three year (2007 to 2009) average of the ABS Articles Produced byManufacturing Industries – Chemicals index, equal to 4.84 percent. 67 This indexsubsequently has been replaced by the Producer Price Index – Basic chemicals and chemicalsmanufacturing.
The QCA determined that indices based on three years observations at the peak of theconstruction cycle would not provide appropriate escalation factors for the period 2010 to2015. As GAWB did not propose an alternative approach, the QCA determined that CPIshould be applied to chemicals cost escalation over the period from 2010 to 2015. 68
5.2.2 Summary findingsRetail water businesses in south east Queensland have adopted a reasonably uniformapproach to escalating chemical costs in recent years, using an estimate of general inflation.This approach has the benefit of being transparent, repeatable and easily accessible and hasbeen accepted by the QCA in recent reviews.
In contrast, GAWB’s proposal to escalate costs according to a chemical specific index wasrejected by the QCA, on the basis that it was based on short term historical price movementsthat did not necessarily provide an indication of future price movements.
5.3 Market trends
5.3.1 Historical movements in chemical price indicesOne means by which to examine historical movements in chemical prices is to use producerprice indices (PPI) developed by the ABS. Detailed manufacturing PPIs are produced at thenational level, including a basic chemical manufacturing index. This group is broken downfurther into industrial gas manufacturing, basic organic chemical manufacturing and basicinorganic chemical manufacturing.
Given the majority of Seqwater’s chemical expenditure relates to inorganic chemicals, thebasic inorganic chemical manufacturing series is likely to provide a more accuraterepresentation of historical input price movements experienced by Seqwater. Figure 13compares changes in general inflation with both the basic chemical manufacturing series andthe more specific basic inorganic chemical manufacturing series.
65 Commonwealth of Australia (2010) Economic Statement July 2010. Accessed online at http://www.budget.gov.au/2010-11/content/economic_statement/download/ES_Consolidated.pdf
66 Queensland Competition Authority (2012) Final Report. SEQ Interim Price Monitoring for 2011-12. Part B Detailed Assessment.Accessed online at http://www.qca.org.au/getattachment/c618d45b-ecc7-4aad-a49d-ff184e3d263f/SEQ-Interim-Price-Monitoring-for-2011-12-Final-(1).aspx
67 Gladstone Area Water Board (2010) Expenditure proposals for the 2010 price review. Accessed online at
http://www.qca.org.au/getattachment/50efda4f-8b93-4006-ba7e-978302642d1c/Submission-2-Expenditure-Proposals.aspx
68 Queensland Competition Authority (2010) Gladstone Area Water Board: Investigation of Pricing Practices. Accessed online at
http://www.qca.org.au/getattachment/478dc5a6-4981-459d-800f-018003607aa4/Final-Report-Gladstone-Area-Water-Board-Investigat.aspx

Chemicals
Supporting documentation for Seqwater’s QCA submissionPwC 36
Figure 13 indicates that chemical prices have been more volatile than general inflation overthe past 15 years, particularly since 2008. A temporary price spike in 2009 is largelyresponsible for recent volatility, the result of a salt shortage in the United States in early2009, combined with an increase in transportation costs.69 By mid-2011 the index was atroughly the same level as late 2008, and has remained relatively stable since. Data for thebasic chemical series indicate the index has followed a similar trend to the inorganicchemical series since 2003, albeit a less volatile one.
Figure 13: Comparison of chemical price movements with general inflation70
Table 12 summarises price movements in chemicals and general inflation over the pastfifteen, ten and five year periods. Taking a long term view (15 years), growth in inorganicchemical prices has been modest at 1.9 per cent in nominal terms. Examining pricemovements over shorter time frames reveals a trend of increasing growth rates in both thebasic chemical and basic inorganic chemical index.
Table 12: Comparison of chemical price growth and general inflation71
Index
CAGR
1998 - 2013 2003 - 2013 2008 - 2013
PPI – Basic chemical manufacturing,Australia
n/a 6.4% 8.3%
PPI – Basic inorganic chemicalmanufacturing, Australia
1.9% 3.8% 5.2%
CPI – All groups, Australia 2.9% 2.7% 2.3%
69Analysis based on advice provided by the ABS in May 2014.
70 Australian Bureau of Statistics (2013) Producer Price Indexes – December 2013. Cat. No. 6427.0 Table 12. Data are only available
for the PPI – Basic Chemical index from September 2001 onwards. Available at:http://www.abs.gov.au/AUSSTATS/[email protected]/allprimarymainfeatures/6F15F0CA1F2C2EFECA25765800181C2B?opendocument
71 Australian Bureau of Statistics (2013) Producer Price Indexes – December 2013. Cat. No. 6427.0 Table 12. Data are only availablefor the PPI – Basic Chemical index from September 2001 onwards. Available at:http://www.abs.gov.au/AUSSTATS/[email protected]/allprimarymainfeatures/6F15F0CA1F2C2EFECA25765800181C2B?opendocument
-30%
-20%
-10%
0%
10%
20%
30%
40%
50%
60%
70%
1999 2000 2001 2002 2003 2004 2005 2006 2007 2008 2009 2010 2011 2012 2013
PPI - Basic Chemical PPI - Basic inorganic chemicalCPI - All Groups, Australia
Chemicals
Supporting documentation for Seqwater’s QCA submissionPwC 37
5.4 Discussion
Analysis of ABS data suggests that volatility in manufactured chemical prices has increasedsubstantially in recent years, particularly since 2009. While chemical prices have grownabove CPI over the past five and ten year periods, taking a fifteen year view produces a moremodest average annual increase of 1.9 per cent in nominal terms. Given significant pricevolatility in recent years, basing an escalation factor for chemicals on historical ABS data maynot be appropriate.
Further limiting the applicability of the ABS series is the use of national data in developingthe chemical price indices, resulting in the inclusion of geographical areas that are notdirectly relevant to Seqwater’s water business. In addition, only three chemicals (alum,sodium hypochlorite and hydrated lime) comprise the majority of Seqwater’s total chemicalcosts (approximately 70 per cent). As a result, price movements in the ABS chemical indicesmay not be representative of price movements for these three chemicals.
An alternative approach to escalate chemical costs is to create a composite index based onescalation clauses contained in Seqwater’s chemical supply contracts. We have reviewed therise and fall provision included in a sample of contracts covering the majority of Seqwater’schemical expenditure, noting the following major drivers of price increases:
raw inputs (i.e. the compounds used to synthesise chemicals), which on averageaccount for approximately 45 per cent of total chemical escalation weighting.
general costs (usually linked to CPI), which account for around 40 per cent of theescalation weighting, and;
labour and fixed components, which together comprise around 15 per cent of theescalation weighting.
A composite index would apply a specific growth forecast to each component, and thenweight these by the share each component contributes to overall price escalation. Growthfactors for general costs and labour components could be approximated by applying CPI andWPI forecasts respectively, however the appropriate factor to apply to raw inputs is lessclear. Historical data relating to bulk costs of individual chemical compounds are not readilyavailable, nor are forecasts of future price movements. Further, the marginal improvement ofadopting a relatively complex composite index approach compared with a more transparentmeasure such as CPI needs to be considered.
Regulatory precedent indicates a preference to apply CPI to escalate chemical costs. with anumber of south east Queensland water retailers applying an estimate of inflation in recentregulatory submissions. This approach has the benefit of being transparent, repeatable andeasily accessible and as such has been accepted by the QCA in its reviews.
Given recent volatility in the relevant ABS producer price indices, and the uncertain marginalbenefit of applying a more complicated composite index approach, we propose that CPI beused for the purposes of forecasting price movements in chemicals over the regulatory periodand out to 2027/28.

Chemicals
Supporting documentation for Seqwater’s QCA submissionPwC 38
5.4.1 Chemical escalation forecastThe following escalation factors are proposed for chemical costs. Forecasts of CPI for2013/14 and 2014/15 are based on current forecasts published by the RBA.72
Table 13: Forecast chemical escalation rates
EscalationFactor
2013/14 2014/15 2015/16 2016/17 2017/182018/19 to
2027-28
Nominal growthrate (%)
3.00% 3.00% 2.50% 2.50% 2.50% 2.50%
Real growth rate(%)
0.00% 0.00% 0.00% 0.00% 0.00% 0.00%
72 The CPI estimate for 2014/15 is based on estimates published by the Reserve Bank of Australia (May 2014) for June 2014. TheRBA has estimated CPI for the year ending June 2015 to grow at between 2.5 and 3.5 per cent. For the purposes of developingreal estimates, the mid-point of this range has been applied. For all remaining years, the mid-point of the RBA inflation target (2to 3 per cent) has been applied. RBA estimates of inflation are published in its Statement on Monetary Policy, available athttp://www.rba.gov.au/publications/smp/index.html
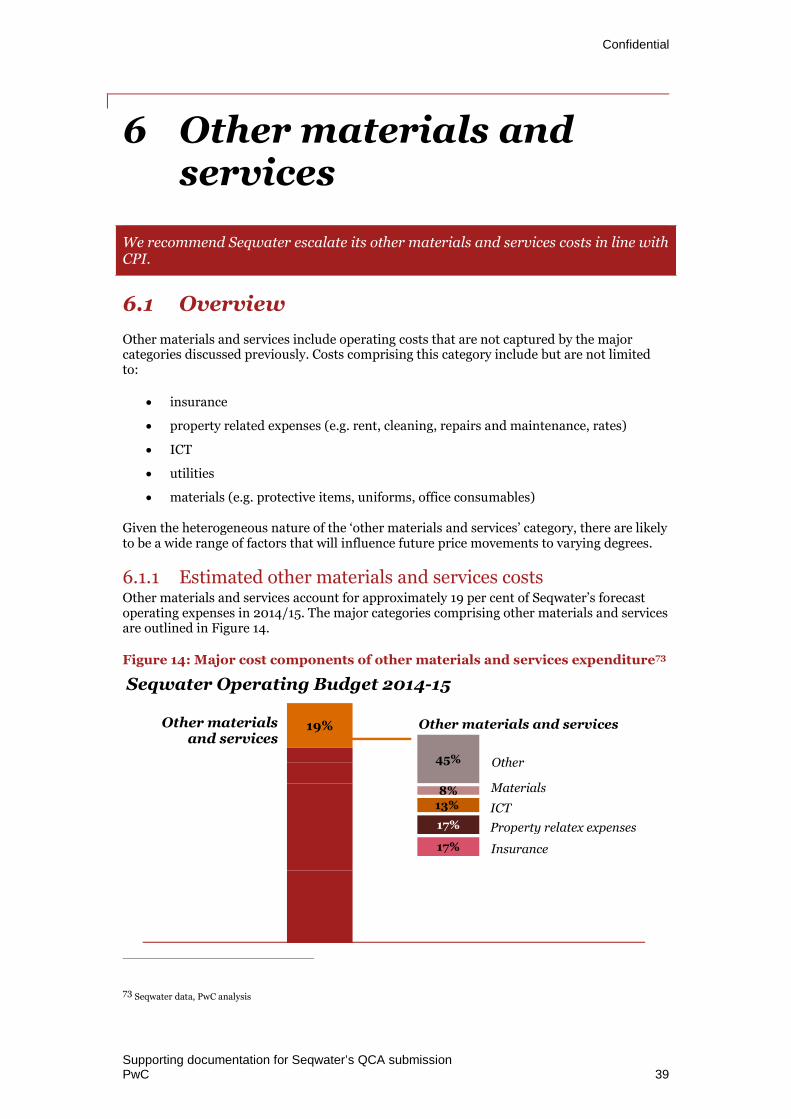
Confidential
Supporting documentation for Seqwater’s QCA submissionPwC 39
6 Other materials andservices
We recommend Seqwater escalate its other materials and services costs in line withCPI.
6.1 Overview
Other materials and services include operating costs that are not captured by the majorcategories discussed previously. Costs comprising this category include but are not limitedto:
insurance
property related expenses (e.g. rent, cleaning, repairs and maintenance, rates)
ICT
utilities
materials (e.g. protective items, uniforms, office consumables)
Given the heterogeneous nature of the ‘other materials and services’ category, there are likelyto be a wide range of factors that will influence future price movements to varying degrees.
6.1.1 Estimated other materials and services costsOther materials and services account for approximately 19 per cent of Seqwater’s forecastoperating expenses in 2014/15. The major categories comprising other materials and servicesare outlined in Figure 14.
Figure 14: Major cost components of other materials and services expenditure73
73 Seqwater data, PwC analysis
19%Other materialsand services
17%
17%
13%8%
45%
Insurance
Property relatex expenses
Materials
Other materials and services
Seqwater Operating Budget 2014-15
ICT
Other

Other materials and services
Supporting documentation for Seqwater’s QCA submissionPwC 40
6.2 Alternative approaches for the escalation ofmaterials and services costs
6.2.1 Review of current regulatory precedentTable 14 summarises recent decisions of Australian regulators relating to the escalation ofmaterials and services costs.
Table 14: Application of alternative materials and services escalation factors –regulatory review
Business Regulator Proposed approach Approved approach
QueenslandUrbanUtilities
(2013/14 to2014/15regulatoryperiod)
QCA QUU’s escalated costsassociated with sludgehandling, chemicals andother materials and servicesat the rate of generalinflation.
This was based on advicefrom PwC that noted nosuitable industry forecastswere available to escalatethese expenditure items.
The QCA accepted andapplied QUU’s suggestedcost escalation factors in itsfinal report.
Gold CoastWater
(2013/14 to2014/15regulatoryperiod)
QCA Gold Coast Water proposedescalating materials andservices costs at 2.5%, beingthe mid-point of the RBAmedium-term inflationtarget range.
This category includedcontractors used formaintenance and materialsused by internal and externalstaff.
The QCA accepted thematerials and servicesbudget submitted by GoldCoast Water, including thesuggested escalation factors.
SunWater
(2012/13 to2016/17regulatoryperiod)
QCA SunWater escalated otherdirect costs (such asinsurance, rates, land taxetc) at the general rate ofinflation, equal to 2.5%.
Non-direct and overheadcosts were also escalated inline with inflation.
In conducting its review forthe QCA, Deloitte noted thatSunWater’s approach toescalating non-direct costswas conservative given theexpected upward pressure oncosts from a rapidlyexpanding resources sector.
In accepting SunWater’sapproach, the Authoritynoted that the nature of thecosts is primarily generatedby administrative andmanagement functions.
Seqwater
(2013/14 to2016/17regulatoryperiod)
QCA Seqwater proposed toescalate other direct costs(i.e. direct costs notclassified as labour orcontractors and materials)and non-direct costs at thegeneral rate of inflation,equal to 2.5%.
The QCA consideredSeqwater’s approach to bereasonable, noting that costsare primarily generated byadministrative andmanagement functions,which are likely to berestrained over theregulatory period.

Other materials and services
Supporting documentation for Seqwater’s QCA submissionPwC 41
6.2.2 Summary findingsIn the absence of a specific industry index suitable for escalating other materials and servicescosts, Queensland water businesses have opted to use expected growth in the CPI as anescalation factor.
This approach has been accepted by the QCA in its price reviews, with the Authority noting inthe cases of SunWater and Seqwater that costs are primarily generated by administrative andmanagement functions, which are likely to be restrained out to 2016/17.
6.3 DiscussionItems classified in the other materials and services category reflect a variety of goods andservices that support Seqwater’s operating activities. This includes insurance costs, propertyrelated expenses, ICT expenses, fleet maintenance, utilities and general materials.
Items are allocated to the other materials and services category on the basis that they do notform part of the major cost categories (e.g. employee expenses, electricity etc.), and do notcomprise a large enough share of total operating costs to warrant being placed in a separatecategory. As a result, this category tends to include expenses that are not necessarily closelyrelated in terms of the underlying drivers of price movements.
Given the heterogeneous nature of the category, it is inherently difficult to apply anescalation factor based on a specific index that aligns with actual price increases in any givenyear. While a weighted average comprising multiple indices may be developed in certaincases, it is less suitable in instances where there are a large number of items included in acategory, and no single item captures a significant share of total expenditure.
While CPI and the basket of goods which it represents may not, in a given year, align directlywith Seqwater’s other materials and services expenses, it is likely to provide the mostaccurate forecast given the lack of suitable alternatives. This approach has been accepted bythe QCA in a number of recent reviews.
Accordingly, we propose that CPI be used for the purposes of forecasting unit pricemovements in general materials over the regulatory period and out to 2027/28.
6.3.1 Other materials and services escalation factorsThe following escalation factors are proposed for other materials and services costs.Forecasts of CPI for 2013/14 and 2014/15 are based on current forecasts published by theRBA.74
Table 15: Forecast other materials and services escalation rates
EscalationFactor
2013/14 2014/15 2015/16 2016/17 2017/182018/19 to
2027-28
Nominal growthrate (%)
3.00% 3.00% 2.50% 2.50% 2.50% 2.50%
Real growth rate(%)
0.00% 0.00% 0.00% 0.00% 0.00% 0.00%
74 The CPI estimate for 2014/15 is based on estimates published by the Reserve Bank of Australia (May 2014) for June 2014. TheRBA has estimated CPI for the year ending June 2015 to grow at between 2.5 and 3.5 per cent. For the purposes of developingreal estimates, the mid-point of this range has been applied. For all remaining years, the mid-point of the RBA inflation target (2to 3 per cent) has been applied. RBA estimates of inflation are published in its Statement on Monetary Policy, available athttp://www.rba.gov.au/publications/smp/index.html
Confidential
Supporting documentation for Seqwater’s QCA submissionPwC 42
7 Capital Expenditure
We recommend that Seqwater escalate its capital expenditure in line with theAustralian Construction Industry Forum’s Engineering Construction Price Index to2022/23, and in line with CPI over the remainder of the forecast period.
7.1 Overview
Seqwater is currently in the process of developing its capital program as part of itssubmission to the QCA for the 2015/16 to 2017/18 regulatory review. Capital projectappraisals have been carried out over a number of preceding years and as such cost estimatesneed to be rebased to 2013/14 dollars. Future capital expenditure will also require escalationfactors to be developed out to 2027/28.
This section examines the different approaches that have been adopted in recent regulatorysubmissions for capital expenditure with a view to recommending an appropriate escalationfactor for Seqwater’s capital program.
7.2 Alternative approaches for the escalation ofcapital expenditure
7.2.1 Current indices and data sourcesA number of industry price indices have been used by regulated entities to escalate capitalexpenditure forecasts. These include:
producer price indices for the construction sector
engineering construction activity implicit price deflator
Construction Forecasting Council Engineering Construction Price Index
Construction sector producer price indices
The ABS produces a number of producer price indices for the construction sector, including:
building construction
house construction
other residential building construction
non-residential building construction
road and bridge construction.
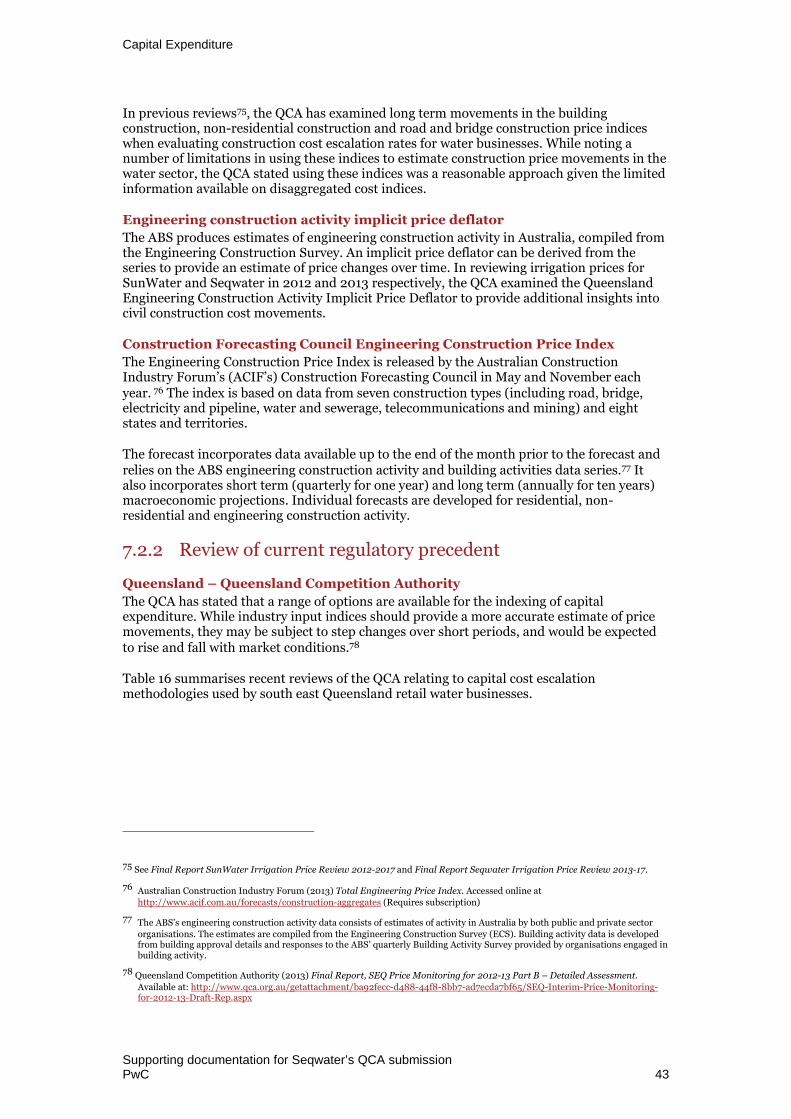
Capital Expenditure
Supporting documentation for Seqwater’s QCA submissionPwC 43
In previous reviews75, the QCA has examined long term movements in the buildingconstruction, non-residential construction and road and bridge construction price indiceswhen evaluating construction cost escalation rates for water businesses. While noting anumber of limitations in using these indices to estimate construction price movements in thewater sector, the QCA stated using these indices was a reasonable approach given the limitedinformation available on disaggregated cost indices.
Engineering construction activity implicit price deflator
The ABS produces estimates of engineering construction activity in Australia, compiled fromthe Engineering Construction Survey. An implicit price deflator can be derived from theseries to provide an estimate of price changes over time. In reviewing irrigation prices forSunWater and Seqwater in 2012 and 2013 respectively, the QCA examined the QueenslandEngineering Construction Activity Implicit Price Deflator to provide additional insights intocivil construction cost movements.
Construction Forecasting Council Engineering Construction Price Index
The Engineering Construction Price Index is released by the Australian ConstructionIndustry Forum’s (ACIF’s) Construction Forecasting Council in May and November eachyear. 76 The index is based on data from seven construction types (including road, bridge,electricity and pipeline, water and sewerage, telecommunications and mining) and eightstates and territories.
The forecast incorporates data available up to the end of the month prior to the forecast andrelies on the ABS engineering construction activity and building activities data series.77 Italso incorporates short term (quarterly for one year) and long term (annually for ten years)macroeconomic projections. Individual forecasts are developed for residential, non-residential and engineering construction activity.
7.2.2 Review of current regulatory precedent
Queensland – Queensland Competition Authority
The QCA has stated that a range of options are available for the indexing of capitalexpenditure. While industry input indices should provide a more accurate estimate of pricemovements, they may be subject to step changes over short periods, and would be expectedto rise and fall with market conditions.78
Table 16 summarises recent reviews of the QCA relating to capital cost escalationmethodologies used by south east Queensland retail water businesses.
75 See Final Report SunWater Irrigation Price Review 2012-2017 and Final Report Seqwater Irrigation Price Review 2013-17.
76 Australian Construction Industry Forum (2013) Total Engineering Price Index. Accessed online athttp://www.acif.com.au/forecasts/construction-aggregates (Requires subscription)
77 The ABS’s engineering construction activity data consists of estimates of activity in Australia by both public and private sectororganisations. The estimates are compiled from the Engineering Construction Survey (ECS). Building activity data is developedfrom building approval details and responses to the ABS’ quarterly Building Activity Survey provided by organisations engaged inbuilding activity.
78 Queensland Competition Authority (2013) Final Report, SEQ Price Monitoring for 2012-13 Part B – Detailed Assessment.
Available at: http://www.qca.org.au/getattachment/ba92fecc-d488-44f8-8bb7-ad7ecda7bf65/SEQ-Interim-Price-Monitoring-for-2012-13-Draft-Rep.aspx

Capital Expenditure
Supporting documentation for Seqwater’s QCA submissionPwC 44
Table 16: Application of alternative capital expenditure escalation factors –regulatory review (QCA)
Business Regulator Proposed approach Approved approach
QueenslandUrbanUtilities
(2012/13reviewperiod)
QCA QUU indexed capital costs byapplying the ConstructionForecasting CouncilEngineering ConstructionPrice Index for Australia.
Escalation factors appliedwere 0.86%, 0.89% and2.49% for 2012/13, 2013/14and 2014/15 respectively.
The QCA noted that theindex includes data fromconstruction types andgeographic areas that are notdirectly relevant to QUU’swater and seweragebusiness.
Given the conservativenature of the estimates, theQCA accepted the escalationfactors, noting that anysubsequent variationsbetween forecast and actualcosts can be taken into
account in future reviews.79
Unitywater
(2011/12reviewperiod)
QCA Unitywater80 escalated itscapital expenditure costsaccording to data sourcedfrom the Producer PriceIndex Road and Bridgeseries for Queensland,published by the AustralianBureau of Statistics (ABS).
It applied the 10 year to June2011 compound growth rate,equal to 5.20%.
The Authority noted thathistorical price pressureswould not necessarily besustained over the long term,and the index used byUnitywater may be affectedby market conditions in thetypes of construction notdirectly relevant to thebusiness’s water andsewerage operations.
However the QCA referred toa previous Access Economicsreview into infrastructurecharges that noted escalationrates for construction costsshould be based on long runtrends, rather than short runaverages.
Based on this, the QCAconsidered the proposedindexation rate of 5.2% to bereasonable, though on the
high side.81
79 Queensland Competition Authority (2013) Final Report, SEQ Price Monitoring for 2012-13 Part B – Detailed Assessment.Available at: http://www.qca.org.au/getattachment/ba92fecc-d488-44f8-8bb7-ad7ecda7bf65/SEQ-Interim-Price-Monitoring-for-2012-13-Draft-Rep.aspx
80 Queensland Competition Authority (2012) Final Report. SEQ Interim Price Monitoring for 2011-12. Part B Detailed Assessment.Available at: http://www.qca.org.au/getattachment/c618d45b-ecc7-4aad-a49d-ff184e3d263f/SEQ-Interim-Price-Monitoring-for-2011-12-Final-(1).aspx
81 Queensland Competition Authority (2012) Final Report. SEQ Interim Price Monitoring for 2011-12. Part B Detailed Assessment.
Available at: http://www.qca.org.au/getattachment/c618d45b-ecc7-4aad-a49d-ff184e3d263f/SEQ-Interim-Price-Monitoring-for-2011-12-Final-(1).aspx

Capital Expenditure
Supporting documentation for Seqwater’s QCA submissionPwC 45
Business Regulator Proposed approach Approved approach
Allconnex
(2011/12reviewperiod)
QCA Similar to Unitywater,Allconnex escalated itscapital expenditureaccording to the QueenslandRoad and BridgeConstruction Index.
It applied the annual averageincrease over the periodfrom December 1999 toDecember 2010, equal to4.75 percent.82
The Authority noted similarissues to the Unitywatermethodology (discussedabove).
However Allconnex’sindexation was considered tobe reasonable, with anyvariations between forecastand actual costs to be takeninto account in futurereviews.
In addition to the SEQ water businesses, the QCA is also responsible for the review of pricingpractices undertaken by the Gladstone Area Water Board (GAWB). In GAWB’s 2010 pricereview, GAWB proposed to escalate its capital expenditure according to the three year (2007to 2009) average of the general Queensland construction industry index.83 GAWB did notprovide details of the publishers of this data.
In contrast to its determination for the SEQ water businesses, the QCA determined thatGAWB’s application of the construction index was not appropriate. The QCA considered thata three year average of construction price increases would not provide a reliable indication ofcost escalation over the period 2012 to 2015. It noted that market conditions may now bemarkedly different from those in the period 2007 to 2009, and therefore proposed that theCPI be applied over the regulatory period. 84
Victoria – Essential Services Commission
The Essential Services Commission (ESC) reviews water prices set by the three metropolitanretail water businesses in Melbourne (City West Water, South East Water and Yarra ValleyWater) and Melbourne Water. In the 2009 Metropolitan Melbourne Water Price Review, theESC determined that capital expenditure be escalated according to the CPI rather than acapital expenditure specific forecast of price escalation.85 The ESC considered that while CPIand a construction index will diverge over the short term, over the medium to longer termCPI would provide the best measure of changes in input costs.
The ESC also noted that the use of CPI has the advantage of simplicity. If capital expenditurespecific indices were used to escalate input prices, it would be necessary to identify escalatorsfor different services and materials. CPI, however, represents a bundle of goods and servicesand is easily accessible.
82 Allconnex (2011) Allconnex Water Price Monitoring Submission 2011-12. Available at:http://www.qca.org.au/getattachment/92467ed8-8125-4496-9ce5-8a4e88989b91/Allconnex-Water-Submission-1.aspx
83 Gladstone Area Water Board (2010) Expenditure proposals for the 2010 price review. Accessed online athttp://www.qca.org.au/getattachment/50efda4f-8b93-4006-ba7e-978302642d1c/Submission-2-Expenditure-Proposals.aspx
84 Queensland Competition Authority (2010) Gladstone Area Water Board: Investigation of Pricing Practices. Accessed online athttp://www.qca.org.au/getattachment/478dc5a6-4981-459d-800f-018003607aa4/Final-Report-Gladstone-Area-Water-Board-Investigat.aspx
85 Essential Services Commission (2009) Metropolitan Melbourne Water Price Review- Final Decision 2009. Accessed online at
http://www.esc.vic.gov.au/getattachment/f3f8deaa-d639-45e3-a5ec-af64c9654434/Final-Decision-Metropolitan-Water-Price-Review-200.pdf

Capital Expenditure
Supporting documentation for Seqwater’s QCA submissionPwC 46
New South Wales – Independent Pricing and Regulatory Tribunal
Under Section 12 of the Independent Pricing and Regulatory Tribunal Act 1992 (IPARTAct), IPART is required to review the determination of pricing for a number of waterbusinesses, including Sydney Water and Hunter Water.
For the 2008 determination period, both Sydney Water and Hunter Water proposed twodifferent approaches for escalating capital costs, as described below.
Table 17: NSW capital expenditure escalation methodologies
Regulator Determination
Hunter Water In Hunter Water’s 2008 submission to IPART it proposed to escalate itscapital expenditure using the Engineering Construction Cost ImplicitDeflator forecast (4.8 percent for the period from 2009-10 to 2012-13),rather than inflation.86
Hunter Water’s proposed escalation rate was based on analysis undertakenby external consultants which found that construction costs hadconsistently been above CPI.
Sydney Water In Sydney Water’s 2008 submission to IPART it proposed to escalate itscapital costs by 5 percent.87 The request was based on an average annualincrease in the construction cost index from 2002-03 to 2006-07 of 5.8percent compared with CPI of 2.7 percent.
IPART undertook its own analysis of construction cost changes relative to CPI as part of itsassessment of an appropriate index for capital costs. Its assessment concluded that althoughshort term changes between movements in capital costs relative to CPI were considerable,the long term averages were similar. It also noted uncertainties in the domestic and globalcapital markets which could have negative impacts on construction activity. As a result,IPART did not support the use of the construction cost index, and determined that capitalexpenditure forecasts should be escalated using CPI.
Other regulated sectors – electricity
In previous regulatory determinations, including those for Energex and Ergon Energy intheir 2010/11 to 2014/15 regulatory period, the AER indicated its preference for the use ofthe engineering construction price index based on the fact that forecasts are derived fromABS data and that they incorporate long-term macroeconomic forecasts (further detail isprovided in Table 18).
86 Hunter Water Corporation (2008) Submission to IPART on prices to apply from 1 July 2009. Accessed online athttp://www.ipart.nsw.gov.au/files/d4497a00-cada-42d3-b14a-9f240108cdf8/Revised_Submission_-_HWC_Price_Review_2008-2009_-_Hunter_Water_Corporation_-_John_OHearn_-_22_October_2008_-_WEBSITE_SUBMISSION.pdf
87 Independent Pricing and Regulatory Tribunal (2008) Review of prices for Sydney Water Corporation’s water, sewerage,
stormwater and other services. Accessed online athttp://www.ipart.nsw.gov.au/Home/Industries/Water/Reviews/Metro_Pricing/Investigation_into_Prices_for_Water_Sewerage_and_Stormwater_services_provided_by_Sydney_Water_Corporation_-_From_1_July_2008/16_Jun_2008_-_Final_Determination_and_Report/Final_Report_and_Determination_-_Review_of_prices_for_Sydney_Water_Corporations_water_sewerage_stormwater_and_other_services_-_June_2008

Capital Expenditure
Supporting documentation for Seqwater’s QCA submissionPwC 47
Table 18: Previous AER determinations for Energex and Ergon Energy
Business Regulator Proposed approach Approved approach
ErgonEnergy
(2010/11to 2014/15regulatoryperiod)
AER For Ergon Energy’s 2010/11 to2014/15 regulatory period, itsought advice from SKM todevelop forecast building costsescalators. SKM analysed ABSdata and sought additionalinformation from a range oforganisations to determine aforecast for building costs.
SKM considered that insufficientpublicly available historical orforecast data existed to derive arelevant escalator. In the absenceof a reputable building costescalation forecast, SKMconsidered it reasonable toassume that building costs willescalate at least in line with therate of growth in constructioncosts as based on the ACIFengineering construction price
index.88
In the AER’s draft determinationit considered Ergon Energy’sapproach to apply the ACIFengineering construction priceindex forecasts as a proxy for abuilding cost escalator to bereasonable, particularly as theconstruction cost forecasts arederived from the ABS data.
In its final determination, the AERmaintained its decision that use ofthe ACIF engineering constructionprice forecasts were appropriate,however updated these values toreflect the most recent nominalforecasts, which were thendeflated using the AustraliaNational State and IndustryOutlook (ANSIO) CPI forecasts. 89
Energex
(2010/11to 2014/15regulatoryperiod)
AER Energex proposed to applyconstruction cost escalation ratesdeveloped by KPMG and basedupon ABS data to account formovements in building costs in itsproposal for the 2010/11 to2014/15 regulatory period. 90
KPMG developed the rates basedon ABS engineering constructionactivity data91 over the period1998 to 2008. It considered this tobe an appropriate data source as itwas also applied by Econtech todevelop its construction costforecasts for the ACIFConstruction Forecasting Council,approved by the AER in its recentACT and NSW final electricitydistribution determinations.92 93
In considering Energex’s proposedapproach the AER noted that theACIF forecasts also consider ABSbuilding activity data94 andmacroeconomic projections whendetermining its construction costforecasts. The AER thereforeconsidered that the ACIF forecastswould more accurately reflect thevolatility and uncertainty ofeconomic conditions as itincorporates more historical dataand macroeconomic projections.
The AER did not consider KPMG’sconstruction cost escalationforecast to be reasonable, anddetermined that Energex shouldapply the construction cost indexdeveloped by the ACIF. 95
88 Australian Energy Regulator. 2009. Queensland Draft Determination Decision – Appendices – 2010-15. Available at:
http://www.aer.gov.au/sites/default/files/QLD%20draft%20decision%20-%20appendices.pdf.
89 Australian Energy Regulator (2012) Final Distribution Determination Aurora Energy Pty Ltd 2012–13 to 2016–17. Available at
http://www.aer.gov.au/sites/default/files/Final%20distribution%20determination%20for%20Aurora%20Energy.pdf
90 Energex (2009), Regulatory proposal, Accessed online at
https://www.energex.com.au/__data/assets/pdf_file/0020/26705/ENERGEX_s_Regulatory_Proposal_2010-2015.pdf
91 ABS, Engineering Construction Activity, Cat No. 8762.0. Available at: http://www.abs.gov.au/ausstats/[email protected]/mf/8762.0
92 AER (2009) Australian Capital Territory distribution determination 2009-10 to 2013-14. Accessed online at
http://www.aer.gov.au/sites/default/files/AER%20Final%20decision%20-%20ACT%20determination%202009-10%20to%202013-14%20-%20April%202009.pdf
93 AER (2009) New South Wales distribution determination 2009-10 to 2013-14. Accessed online athttp://www.aer.gov.au/sites/default/files/NSW%20DNSPs%20final%20decision%2028%20April%202009_1.pdf

Capital Expenditure
Supporting documentation for Seqwater’s QCA submissionPwC 48
7.2.3 Summary findingsThere have been a number of different approaches proposed by regulated entities inAustralia to escalate capital expenditure, with no single approach universally accepted byAustralian regulators.
In recent south east Queensland water retail price reviews, entities have escalated capitalexpenditure based on ACIF engineering construction price index forecasts, as well ashistorical averages of the Queensland road and bridge index. Where ACIF forecasts havebeen applied, the QCA has noted that data is based on geographies and construction typesthat are not necessarily relevant to the business, however the approach was accepted givenestimates were conservative.
The AER has also indicated its preference for the use of ACIF forecasts, as they are derivedfrom ABS data and incorporate long-term macroeconomic forecasts.
Where historical movements in the road and bridge index have been applied, the QCA hasnoted that historical price pressures may not be sustained over the long term, and the indexmay be affected by market conditions not relevant to the capital costs incurred by a waterand sewerage business. Nonetheless the methodology was still accepted, with the Authoritynoting that any variations between forecasted and actual costs would be taken into accountin future reviews.
Regulators in Victoria and New South Wales have elected to apply CPI when escalatingcapital costs in recent reviews, noting that although there are short term deviations betweeninflation and construction costs, over the medium to longer term averages are similar.
7.3 Market trends
7.3.1 Historical movements in construction price indicesFigure 15 compares movements in the building construction, non-residential buildingconstruction and road and bridge price indices for Queensland. The three indices havefollowed a similar trend over the past decade, growing at over 5 per cent a year to 2008before moderating following the global financial crisis.
All three groups experienced growth well above inflation between 2003 and 2008. Thebuilding construction index averaged 7.9 per cent growth over this period, while the non-residential index averaged 9.0 per cent and the road and bridge index 6.9 per cent. Pricegrowth moderated from 2008 onwards, with the building construction index remaining flatand the non-residential construction index falling. The road and bridge index grewmoderately between 2008 and 2013, averaging 2.6 per cent annually.
94 ABS, Building Activity, Cat No. 8762.0
95 Australian Energy Regulator (2012) Final Distribution Determination Aurora Energy Pty Ltd 2012–13 to 2016–17. Available athttp://www.aer.gov.au/sites/default/files/Final%20distribution%20determination%20for%20Aurora%20Energy.pdf

Capital Expenditure
Supporting documentation for Seqwater’s QCA submissionPwC 49
Figure 15: Comparison of historical inflation to construction price indices, 2003to 2013 (year to June)96
Figure 16 compares movements in the engineering construction activity implicit pricedeflator (IPD) with general inflation. Similar to the construction producer price indices, theengineering construction activity IPD grew well above inflation over the first half of thedecade, before moderating substantially from 2008 onwards.
Figure 16: Comparison of historical inflation to Queensland engineeringconstruction activity implicit price deflator, 2003 to 2013 (year toJune)97
Table 19 summarises recent price movements in the construction producer price indices andengineering construction activity IPD.
96 Australian Bureau of Statistics (2013) Producer Price Indexes – December 2013. Cat. No. 6427.0 Table 17
97 Australian Bureau of Statistics (2013) Engineering Construction Activity, Australia, Dec 2013. Cat. No. 8762.0, Tables 2 and 4
-5%
0%
5%
10%
15%
2003 2004 2005 2006 2007 2008 2009 2010 2011 2012 2013
Building Construction Index (Qld) Non-res Building Construction Index (Qld)
Road and Bridge Index (Qld) CPI - All groups, Australia
-5%
0%
5%
10%
15%
2003 2004 2005 2006 2007 2008 2009 2010 2011 2012 2013
QECAIPD CPI - All groups, Australia
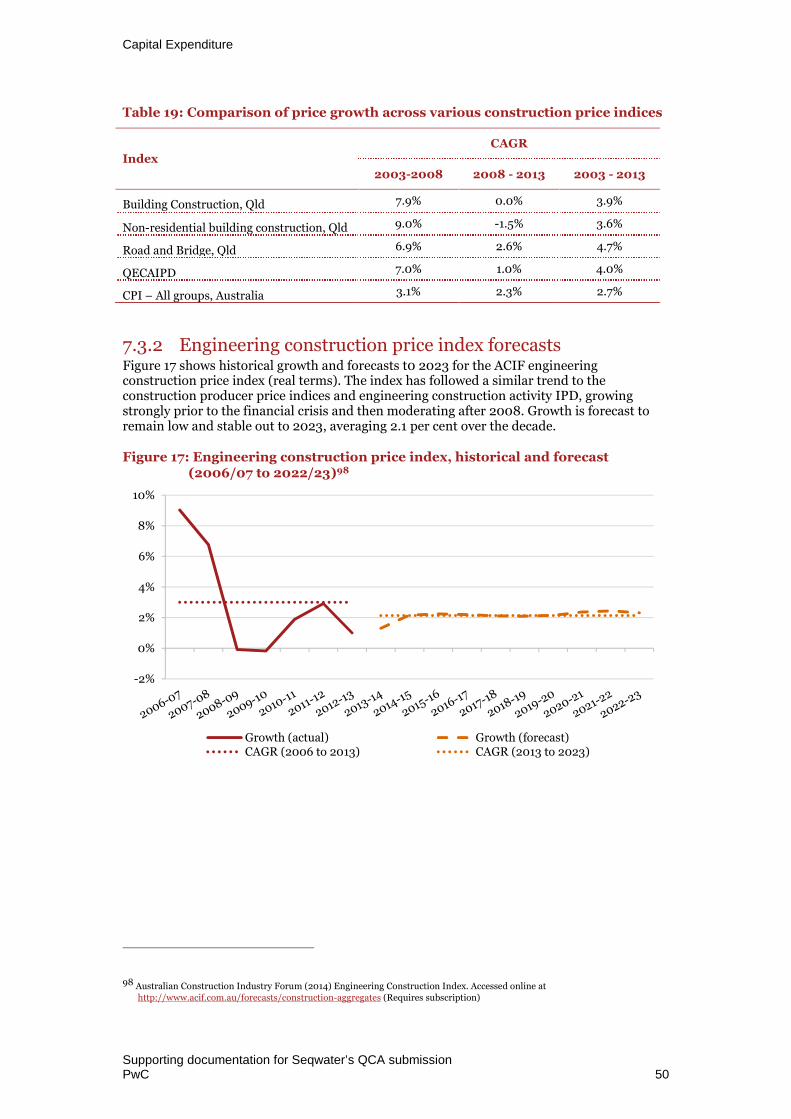
Capital Expenditure
Supporting documentation for Seqwater’s QCA submissionPwC 50
Table 19: Comparison of price growth across various construction price indices
Index
CAGR
2003-2008 2008 - 2013 2003 - 2013
Building Construction, Qld 7.9% 0.0% 3.9%
Non-residential building construction, Qld 9.0% -1.5% 3.6%
Road and Bridge, Qld 6.9% 2.6% 4.7%
QECAIPD 7.0% 1.0% 4.0%
CPI – All groups, Australia 3.1% 2.3% 2.7%
7.3.2 Engineering construction price index forecastsFigure 17 shows historical growth and forecasts t0 2023 for the ACIF engineeringconstruction price index (real terms). The index has followed a similar trend to theconstruction producer price indices and engineering construction activity IPD, growingstrongly prior to the financial crisis and then moderating after 2008. Growth is forecast toremain low and stable out to 2023, averaging 2.1 per cent over the decade.
Figure 17: Engineering construction price index, historical and forecast(2006/07 to 2022/23)98
98 Australian Construction Industry Forum (2014) Engineering Construction Index. Accessed online athttp://www.acif.com.au/forecasts/construction-aggregates (Requires subscription)
-2%
0%
2%
4%
6%
8%
10%
Growth (actual) Growth (forecast)CAGR (2006 to 2013) CAGR (2013 to 2023)

Capital Expenditure
Supporting documentation for Seqwater’s QCA submissionPwC 51
7.4 Discussion
In general, there is no universal approach to escalating capital costs which is consistentlyapplied to regulated water businesses in Australia.
For example, in Victoria and New South Wales, while some water businesses have proposedto apply a construction specific escalation rate to their capital expenditure, both the ESC andIPART have determined that CPI is a more appropriate measure of capital expenditureescalation. These determinations were based on the ease of applying CPI, together with thesimilarities between CPI and capital escalation rates over the long term.
By comparison, while the QCA recommended that GAWB apply CPI for escalating capitalrelated costs, more recently it has tacitly accepted the use of capital specific escalation factorsfor Queensland water businesses. In accepting the use of a capital specific escalation factorby the SEQ water retailers, as well as SunWater and Seqwater, the QCA acknowledged thatindices may be affected by market conditions that are not directly relevant to the waterindustry. However, the Authority considered it to be appropriate as any variations observedbetween forecast and actual cost increases could be taken into account in future reviews.
The QCA acknowledged that the Engineering Construction Price Index is based on data fromseven construction types (including road, bridge, electricity and pipeline, water andsewerage, telecommunications and mining) and eight states and territories, so to someextent may reflect factors which are not directly relevant to water businesses. However, weconsider that this issue would be magnified by the application of CPI, which specificallymonitors movements in household expenditure. Indeed, the QCA accepted the use of theEngineering Construction Price Index in its 2011/12 and 2012/13 Interim Price Monitoringdeterminations for QUU.
In addition, the ACIF index is a measure which has been developed based on ABSconstruction data and incorporates macroeconomic forecasts. The measure is regularlyreviewed to reflect recent developments. This, along with its general acceptance by both theQCA and the AER, indicates that it would provide an appropriate escalation factor for thepurpose of forecasting building capital expenditure over the forecast regulatory period, aswell as rebasing capital expenditure estimates developed in previous years.
We note that given its broad nature, there may be some inconsistencies between pricechanges forecast by the Engineering Construction Price Index and costs incurred bySeqwater, however these are not expected to be material in nature.

Capital Expenditure
Supporting documentation for Seqwater’s QCA submissionPwC 52
7.4.1 Capital expenditure escalation factorsThe following escalation factors are proposed for capital expenditure (Table 20). Historicaldata and forecasts are based off the most recent ACIF release (November 2013), whichprovides data in real terms only. Historical CPI data are used to convert historical real datato nominal values (based on the CPI – All Groups, Australia series). For future years,forecasts of CPI are used to calculate nominal growth rates. These estimates are based oncurrent forecasts published by the RBA.99
The engineering price index is also included, which we have rebased to 2013/14. Werecommend this be used to rebase capital expenditure forecasts from prior years into2013/14 dollars. As current forecasts are available to 2022/23, we recommend applying CPIover the remainder of the forecast period (2023/24 to 2027/28).
Table 20: Historical data and forecasts of the ACIF engineering constructionprice index100
Nominal growth rate (%) Real growth rate (%)Price index
(real)
2006/07 11.31% 9.02% 0.88
2007/08 11.51% 6.76% 0.93
2008/09 1.34% -0.08% 0.93
2009/10 2.94% -0.17% 0.93
2010/11 5.51% 1.89% 0.95
2011/12 4.17% 2.92% 0.98
2012/13 3.42% 1.00% 0.99
2013/14 4.34% 1.30% 1.00
2014/15 5.24% 2.17% 1.02
2015/16 4.80% 2.25% 1.04
2016/17 4.75% 2.20% 1.07
2017/18 4.67% 2.12% 1.09
2018/19 4.65% 2.10% 1.11
2019/20 4.70% 2.15% 1.14
2020/21 4.92% 2.36% 1.16
2021/22 5.01% 2.45% 1.19
2022/23 4.88% 2.32% 1.22
2023/24 - 2027/28 2.50% 0.00% -
99 The CPI estimate for 2014/15 is based on estimates published by the Reserve Bank of Australia (May 2014) for June 2014. TheRBA has estimated CPI for the year ending June 2015 to grow at between 2.5 and 3.5 per cent. For the purposes of developingreal estimates, the mid-point of this range has been applied. For all remaining years, the mid-point of the RBA inflation target (2to 3 per cent) has been applied. RBA estimates of inflation are published in its Statement on Monetary Policy, available athttp://www.rba.gov.au/publications/smp/index.html
100 Australian Construction Industry Forum (2014) Engineering Construction Index. Accessed online athttp://www.acif.com.au/forecasts/construction-aggregates (Requires subscription)

Capital Expenditure
Supporting documentation for Seqwater’s QCA submissionPwC 53
In addition to financial year escalators, Seqwater has requested that the ACIF index and costescalators be reproduced for calendar years (see Table 21). The mid-point of each financialyear data point has been used as a proxy for the index value at December of each year. Asabove, historical inflation data are used to convert real values to nominal values to 2013. Forfuture years, estimates of forecasts of CPI produced by the RBA are used to convert realgrowth to nominal values.
Table 21: Estimated ACIF engineering construction price index growth(calendar years)101
Nominal growth rate (%) Real growth rate (%)Price index
(real)
2007 10.96% 7.84% 0.89
2008 7.05% 3.23% 0.92
2009 1.93% -0.13% 0.92
2010 3.64% 0.86% 0.93
2011 5.48% 2.41% 0.95
2012 4.20% 1.95% 0.97
2013 3.93% 1.15% 0.98
2014 4.54% 1.74% 1.00
2015 5.02% 2.21% 1.02
2016 4.78% 2.22% 1.04
2017 4.71% 2.16% 1.07
2018 4.66% 2.11% 1.09
2019 4.68% 2.12% 1.11
2020 4.81% 2.26% 1.14
2021 4.96% 2.40% 1.17
2022 4.94% 2.38% 1.19
2023-2028 2.50% 0.00% -
101 PwC analysis based on Australian Construction Industry Forum (2014) Engineering Construction Index. Accessed online athttp://www.acif.com.au/forecasts/construction-aggregates (Requires subscription)

Summary
Supporting documentation for Seqwater’s QCA submissionPwC 54
8 Summary
Seqwater has engaged PwC to develop cost escalation factors by cost category for thepurposes of informing Seqwater’s regulatory submission to the Queensland CompetitionAuthority (QCA) for the period covering 2014 to 2028. This report has presented PwC’srecommended escalation rates for each cost category, as summarised below.
Table 22: Proposed escalation factors by cost category
Cost Category Recommended escalation factor Source
Employee and contractlabour expenses
Seqwater Certified Agreement (CA) to 2015/16
Queensland wage price index (WPI) forecastover remainder of the forecast period (to2027/28)
Seqwater CA (2013 to2016)
Queensland Treasury andTrade (WPI forecast to2016/17, extrapolatedover forecast period)
Contractors (servicedelivery)
Weighted index of the Queensland WPIforecast, CPI forecast and long run average ofnon-residential building construction index(Queensland).
Escalation factor = 0.38(WPI) + 0.15(CPI) +0.46(NRBCI)
Queensland Treasury andTrade (WPI forecast to2016/17, extrapolatedover forecast period)
Reserve Bank of Australia(CPI)
Australian Bureau ofStatistics (NRBCI)
Electricity
Estimate of actual price growth in 2013/14 and2014/15
Long run average annual growth in SKM MMAprice index for Queensland industrialcustomers, medium scenario, over remainder offorecast period
Seqwater largecontestable site contracts(growth in variable costs)
QCA (growth in fixednetwork costs)
SKM MMA (industrialelectricity price index,Queensland)
Chemicals CPIReserve Bank of Australia(CPI)
Other materials andservices
CPIReserve Bank of Australia(CPI)
Capital expenditure
Engineering Construction Price Index to2022/23
CPI over remainder of forecast period
Australian ConstructionIndustry Forum(Construction ForecastingCouncil)
Reserve Bank of Australia(CPI)
To ensure the ongoing applicability of the specific indices and escalation methodologiesoutlined in this report, we recommend that Seqwater continue to monitor actual pricemovements compared to those forecast, to determine if the methodologies recommendedprovide accurate forecasts of cost movements.

Summary
Supporting documentation for Seqwater’s QCA submissionPwC 55
Accounting for uncertaintyBeyond the selection of an escalation factor, it is worthwhile acknowledging that a forecastprovides an estimate of likely price movements, based on the best available data at a point intime. Accordingly, any forecast may not accurately predict unexpected macroeconomic ormarket trends which significantly alter movements in key inputs (e.g. significant fluctuationsin exchange rates, interest rates, or changes in labour market dynamics).
There is, therefore, a degree of risk for business applying escalation factors in thatunanticipated developments, which result in higher or lower unit price movement, can affectrevenue outcomes.

www.pwc.com.au
© 2014 PricewaterhouseCoopers. All rights reserved.PwC refers to the Australian member firm, and may sometimes refer to the PwC network.Each member firm is a separate legal entity. Please see www.pwc.com/structure for further details.
Liability limited by a scheme approved under Professional Standards Legislation


![0 0-------. I:0 0-------. .-------0lent/pdf/nd/ElectronicQCA.pdf · clocked QCA cells, a QCA shift register, and power gain in QCA cells [14, IS]. At an early stage of QCA development](https://static.fdocuments.us/doc/165x107/6145851207bb162e665fbe8b/0-0-i0-0-0-lentpdfnd-clocked-qca-cells-a-qca-shift.jpg)


