Cost Effectiveness of Support for People Starting a New ... · Conclusions Our study suggests that...
19
ORIGINAL RESEARCH ARTICLE Cost Effectiveness of Support for People Starting a New Medication for a Long-Term Condition Through Community Pharmacies: An Economic Evaluation of the New Medicine Service (NMS) Compared with Normal Practice Rachel A. Elliott 1 • Lukasz Tanajewski 2 • Georgios Gkountouras 2 • Anthony J. Avery 3 • Nick Barber 4 • Rajnikant Mehta 5 • Matthew J. Boyd 2 • Asam Latif 6 • Antony Chuter 7 • Justin Waring 8 Published online: 3 August 2017 Ó The Author(s) 2017. This article is an open access publication Abstract Background The English community pharmacy New Medicine Service (NMS) significantly increases patient adherence to medicines, compared with normal practice. We examined the cost effectiveness of NMS compared with normal practice by combining adherence improve- ment and intervention costs with the effect of increased adherence on patient outcomes and healthcare costs. Methods We developed Markov models for diseases tar- geted by the NMS (hypertension, type 2 diabetes mellitus, chronic obstructive pulmonary disease, asthma and anti- platelet regimens) to assess the impact of patients’ non- adherence. Clinical event probability, treatment pathway, resource use and costs were extracted from literature and costing tariffs. Incremental costs and outcomes associated with each disease were incorporated additively into a composite probabilistic model and combined with adher- ence rates and intervention costs from the trial. Costs per extra quality-adjusted life-year (QALY) were calculated from the perspective of NHS England, using a lifetime horizon. Results NMS generated a mean of 0.05 (95% CI 0.00–0.13) more QALYs per patient, at a mean reduced cost of -£144 (95% CI -769 to 73). The NMS dominates normal practice with a probability of 0.78 [incremental cost-effectiveness ratio (ICER) -£3166 per QALY]. NMS has a 96.7% probability of cost effectiveness compared with normal practice at a willingness to pay of £20,000 per QALY. Sensitivity analysis demonstrated that targeting each disease with NMS has a probability over 0.90 of cost effectiveness compared with normal practice at a willing- ness to pay of £20,000 per QALY. Electronic supplementary material The online version of this article (doi:10.1007/s40273-017-0554-9) contains supplementary material, which is available to authorized users. & Rachel A. Elliott [email protected] 1 Manchester Centre for Health Economics, Room 4.318, 4th floor, Jean Mcfarlane Building, Division of Population Health, Health Services Research and Primary Care, School of Health Sciences, Faculty of Biology, Medicine and Health, The University of Manchester, Oxford Road, Manchester M13 9PL, UK 2 Division of Pharmacy Practice and Policy, The School of Pharmacy, University of Nottingham, University Park, Nottingham NG7 2RD, UK 3 Primary Care Research, Division of Primary Care, School of Medicine, Queen’s Medical Centre, University of Nottingham, Nottingham NG7 2UH, UK 4 Emeritus Professor of Pharmacy, UCL School of Pharmacy, 29-39 Brunswick Square, London WC1N 1AX, UK 5 Research Design Service, East Midlands (RDS EM), School of Medicine, Queen’s Medical Centre, University of Nottingham, Nottingham NG7 2UH, UK 6 School of Health Sciences, Faculty of Medicine and Health Sciences, Queen’s Medical Centre, University of Nottingham, Nottingham NG7 2UH, UK 7 Patient and Public Representative, 68 Brighton Cottages, Copyhold Lane, Lindfield, Haywards Heath RH16 1XT, UK 8 Organisational Sociology and Improvement Science, Centre for Health Innovation, Leadership and Learning, Nottingham University Business School, Jubilee Campus, University of Nottingham, Nottingham NG8 2BB, UK PharmacoEconomics (2017) 35:1237–1255 DOI 10.1007/s40273-017-0554-9
Transcript of Cost Effectiveness of Support for People Starting a New ... · Conclusions Our study suggests that...

ORIGINAL RESEARCH ARTICLE
Cost Effectiveness of Support for People Starting a NewMedication for a Long-Term Condition Through CommunityPharmacies: An Economic Evaluation of the New MedicineService (NMS) Compared with Normal Practice
Rachel A. Elliott1 • Lukasz Tanajewski2 • Georgios Gkountouras2 •
Anthony J. Avery3 • Nick Barber4 • Rajnikant Mehta5 • Matthew J. Boyd2 •
Asam Latif6 • Antony Chuter7 • Justin Waring8
Published online: 3 August 2017
� The Author(s) 2017. This article is an open access publication
Abstract
Background The English community pharmacy New
Medicine Service (NMS) significantly increases patient
adherence to medicines, compared with normal practice.
We examined the cost effectiveness of NMS compared
with normal practice by combining adherence improve-
ment and intervention costs with the effect of increased
adherence on patient outcomes and healthcare costs.
Methods We developed Markov models for diseases tar-
geted by the NMS (hypertension, type 2 diabetes mellitus,
chronic obstructive pulmonary disease, asthma and anti-
platelet regimens) to assess the impact of patients’ non-
adherence. Clinical event probability, treatment pathway,
resource use and costs were extracted from literature and
costing tariffs. Incremental costs and outcomes associated
with each disease were incorporated additively into a
composite probabilistic model and combined with adher-
ence rates and intervention costs from the trial. Costs per
extra quality-adjusted life-year (QALY) were calculated
from the perspective of NHS England, using a lifetime
horizon.
Results NMS generated a mean of 0.05 (95% CI
0.00–0.13) more QALYs per patient, at a mean reduced
cost of -£144 (95% CI -769 to 73). The NMS dominates
normal practice with a probability of 0.78 [incremental
cost-effectiveness ratio (ICER) -£3166 per QALY]. NMS
has a 96.7% probability of cost effectiveness compared
with normal practice at a willingness to pay of £20,000 per
QALY. Sensitivity analysis demonstrated that targeting
each disease with NMS has a probability over 0.90 of cost
effectiveness compared with normal practice at a willing-
ness to pay of £20,000 per QALY.Electronic supplementary material The online version of thisarticle (doi:10.1007/s40273-017-0554-9) contains supplementarymaterial, which is available to authorized users.
& Rachel A. Elliott
1 Manchester Centre for Health Economics, Room 4.318, 4th
floor, Jean Mcfarlane Building, Division of Population
Health, Health Services Research and Primary Care, School
of Health Sciences, Faculty of Biology, Medicine and Health,
The University of Manchester, Oxford Road, Manchester
M13 9PL, UK
2 Division of Pharmacy Practice and Policy, The School of
Pharmacy, University of Nottingham, University Park,
Nottingham NG7 2RD, UK
3 Primary Care Research, Division of Primary Care, School of
Medicine, Queen’s Medical Centre, University of
Nottingham, Nottingham NG7 2UH, UK
4 Emeritus Professor of Pharmacy, UCL School of Pharmacy,
29-39 Brunswick Square, London WC1N 1AX, UK
5 Research Design Service, East Midlands (RDS EM), School
of Medicine, Queen’s Medical Centre, University of
Nottingham, Nottingham NG7 2UH, UK
6 School of Health Sciences, Faculty of Medicine and Health
Sciences, Queen’s Medical Centre, University of
Nottingham, Nottingham NG7 2UH, UK
7 Patient and Public Representative, 68 Brighton Cottages,
Copyhold Lane, Lindfield, Haywards Heath RH16 1XT, UK
8 Organisational Sociology and Improvement Science, Centre
for Health Innovation, Leadership and Learning, Nottingham
University Business School, Jubilee Campus, University of
Nottingham, Nottingham NG8 2BB, UK
PharmacoEconomics (2017) 35:1237–1255
DOI 10.1007/s40273-017-0554-9

Conclusions Our study suggests that the NMS increased
patient medicine adherence compared with normal prac-
tice, which translated into increased health gain at reduced
overall cost.
Trial Registration ClinicalTrials.gov Trial reference
number NCT01635361 (http://clinicaltrials.gov/ct2/show/
NCT01635361). Current Controlled trials: Trial reference
number ISRCTN 23560818 (http://www.controlled-trials.
com/ISRCTN23560818/; DOI 10.1186/ISRCTN23560818).
UK Clinical Research Network (UKCRN) study 12494
(http://public.ukcrn.org.uk/Search/StudyDetail.aspx?Study
ID=12494).
Funding Department of Health Policy Research
Programme.
Key Points for Decision Makers
The New Medicine Service (NMS) appears effective
and cost effective compared with normal practice.
Increased patient adherence to their new medicine
translated into increased health gain at reduced
overall cost that is well below most accepted
thresholds for technology implementation.
This is a simple intervention which has been popular
with community pharmacists and patients, and is
transferable into most therapeutic areas.
Consideration should be given to extending and
evaluating the NMS in other potentially beneficial
areas, and these results are likely to be transferable
into health systems less integrated than the UK NHS.
1 Introduction
Adherence to medication is defined as the extent to which
individuals take their medication as prescribed [1]. Non-
adherence is commonly reported in key prevalent diseases
such as chronic obstructive pulmonary disease (COPD):
33% [2]; schizophrenia: 52% [3]; asthma: 67% [4]; and
diabetes mellitus: 78% [5]. Non-adherence causes reduced
quality of life, increased hospitalisations and premature
deaths [5–7]. A recent estimate sets the global economic
impact at US $285 billion, 57% of the economic impact of
suboptimal medicines use [8]. Estimated opportunity cost
to the English National Health Service (NHS England) of
health gains foregone because of non-adherence is over
£930 million per annum in just five diseases [9]: asthma,
type 2 diabetes, high cholesterol/coronary heart disease,
hypertension and schizophrenia. Improving adherence
from current levels to 80% across these five areas would
save the NHS £500 million per annum [9].
One effective way to improve adherence focuses on
patients who receive a new medicine for a long-term con-
dition, as they often experience problems that can quickly
lead to a proportion becoming non-adherent over time
[10, 11]. Barber et al. developed an intervention with a the-
oretical basis in the self-regulatory model (SRM) [10, 12],
designed to elicit patients’ experiences with, and concerns
about, their new medicine. This intervention significantly
reduced non-adherence and was cost effective [13, 14]. Its
approach was adopted as government policy [15] and in
adapted form was launched as the national New Medicine
Service (NMS) in 2011 [15] for people starting a new med-
icine for asthma/COPD, type 2 diabetes, hypertension or
antiplatelet/anticoagulant treatment [16]. The design differs
from the original intervention as there are four specified
patient groups associated with high rates of avoidable hos-
pital admissions. The original intervention was delivered via
a centralised telephone service,whereasNMS is delivered by
community pharmacists providing the medicine, either face-
to-face or over the telephone. Accredited pharmacies pro-
videNMS, are remunerated for each episode of care and have
guidance on how to conduct the intervention [16]. Of 11,495
community pharmacies in England, 10,553 (91.2%) had
delivered the NMS to at least one patient betweenNovember
2011 and January 2014 [17].
The aim of this study was to evaluate the cost effec-
tiveness of the NMS compared with normal practice in
changing medicine-taking behaviour, following published
reporting criteria [18]. The incremental cost per extra
quality-adjusted-life-year (QALY) generated was deter-
mined from the perspective of the funder (NHS England).
2 Methods
A randomised controlled trial (RCT) has assessed NMS
effectiveness [19]. At 10 weeks, NMS significantly
increased the proportion of patient-reported adherence by
10.2–70.7%, compared with normal practice of 60.5%
[20, 21]. Trial design precluded observation of long-term
outcomes and costs from changes in adherence. Many
benefits of improved adherence are delivered well into the
future. Here, we simulated the effect of observed adherence
increases on patient outcomes and NHS costs by designing
economic models for each drug–disease pair. We devel-
oped this method previously in a cross-therapeutic inter-
vention focused on medication errors [22]. Here, we
combine the results from the NMS trial with projected
harm from non-adherence to generate estimates of patient
outcomes and NHS costs (Fig. 1).
1238 R. A. Elliott et al.

2.1 Intervention and Comparators, Patient
Characteristics and Outcomes
2.1.1 New Medicine Service (NMS) Intervention
NMS begins with the patient’s initial presentation with a
prescription for a medicine that is new to them in a com-
munity pharmacy. Patients can be referred by their pre-
scriber, self-refer, or the pharmacist can invite the patient
to use the service. The intervention consists of a one-to-one
consultation 7–14 days later, with a follow-up 14–21 days
after that, the whole episode lasting 5 weeks. These are the
points where the pharmacist asks about adherence. Out-
comes were collected by researchers at 10 weeks.
The primary aim of the intervention, which can be face-
to-face or telephone-based (in this study, all follow-up was
via telephone) is the patient-centred identification of any
problems with the treatment and provision of appropriate
support or action [23]. Action may include referring the
patient back to their prescriber (Fig. 2).
2.1.2 Normal Practice
Normal practice was the pharmacist’s usual advice. There
was no planned follow-up.
2.1.3 Study Outcomes
The RCT primary outcome was self-reported adherence at
10 weeks, considered the minimum time required to
demonstrate behavioural change [13].
Patients were contacted by telephone by a researcher
and asked about adherence behaviour using the question:
‘‘People often miss taking doses of their medicines, for a
wide range of reasons. Have you missed any doses of your
new medicine, or changed when you take it? (Prompt:
when did you last miss a dose?)’’ [24]. This is the adher-
ence question asked by pharmacists during the NMS
intervention and follow-up. The patient was defined as non-
adherent if any doses were missed without the advice of a
medical professional in the previous 7 days.
Little validation has been carried out for most self-report
adherence measures [25]. An existing scale, the Morisky
Eight Item Medication Adherence Scale (MMAS-8), vali-
dated in hypertension, was used to support our primary
outcome measure, and collected via self-completion postal
questionnaire [26]. These results are available in [20].
Sample size was determined according to the primary
outcome at 10 weeks (see electronic supplementary mate-
rial and [19–21]). Sample characteristics and study out-
comes are reported in Tables 1 and 2. The characteristics
Fig. 1 Overview of economic model developed to combine New Medicine Service (NMS) trial results with estimates of harm caused by non-
adherence
Economic Evaluation of the New Medicine Service (NMS) 1239

(age, sex, ethnicity, disease area) of the RCT cohort were
very similar to the population accessed from the national
PharmOutcomes records of 451,222 NMS consultations
recorded from October 2011 to 2 December 2013 [20].
With regards to economic deprivation, the median Index of
Multiple Deprivation (IMD) rank for England is 16,241,
indicating that our study population is slightly more
deprived than average.
2.1.4 Intervention and Within-Trial Costs
Costs comprised patient-level intervention costs and
healthcare contact over the 10-week follow-up period.
Subsequent resource use at follow-up was obtained from
patient diaries, 116 normal practice and 122 NMS, con-
sisting of NHS (primary care, secondary care, allied health
professionals) and non-NHS costs (community-based
Fig. 2 New Medicine Service
intervention
Table 1 Patient and pharmacy
characteristics by treatment armPatient characteristics Normal practice New Medicine Service
Total 253 251
Antiplatelet/anticoagulant (n = 43, 8.5%) 19 (7.5) 24 (9.6)
Asthma/COPD (n = 117, 23.2%) 58 (22.9) 59 (23.5)
Hypertension (n = 249, 49.4%) 128 (50.6) 121 (48.2)
Type 2 diabetes (n = 95, 18.8%) 48 (19.0) 47 (18.7)
Female (n = 260, 51.6%) 135 (53.4) 125 (49.8)
Age of total cohort (year) n; mean (SD) 253; 59.3 (15.0) 251; 59.5 (15.3)
Total withdrawals by week 10; n (%) 37 (14.6) 16 (6.4)
Economic deprivation based on IMD ranka; mean (SD)
Pharmacy study sites 10,241.5 (8117.2) 9880.0 (7723.0)
Study patients 13,708.3 (8546.4) 14,325.5 (8906.8)
COPD chronic obstructive pulmonary disease, n number, SD standard deviationa IMD: Index of Multiple Deprivation (rank)—each area of England is ranked based on its economic
deprivation score. The most deprived area of England is ranked 1. The rank only indicates relative position
and does not provide a quantifiable comparison. An area ranked 50 is not twice as deprived as the area
ranked 100 (English deprivation rank scores range from 1 to 32482)
1240 R. A. Elliott et al.

practitioners and allied health professionals including
community pharmacists). These data were combined with
NHS reference costs [27] and Personal Social Services
Research Unit (PSSRU) costs [28] (see electronic supple-
mentary material) to derive patient-level total costs.
Comparison between treatment arms at patient level was
made using a two-sample t-test on the original dataset, or
on a bootstrapped dataset, depending on the normality of
the distribution of costs [29]. Mean (median, range) total
NHS costs for patients in normal practice and NMS are
£261 (£121, 0–1669), and £239 (£135, 25–1483), respec-
tively. There was a general trend to reduced NHS costs,
statistically non-significant, for the NMS intervention:
-£21 (95% CI -59 to 150; p = 0.1281).
2.2 Clinical and Economic Impact of Non-
adherence
Six Markov models were developed in TreeAge Pro
(TreeAge Software Inc, One Bank Street, Williamstown,
MA, 01267, USA). The most commonly prescribed medi-
cine within the four NMS areas was used to inform a model
representative of that disease group. Asthma and COPD
were modelled separately due to the different natural his-
tory of the disease and impact of non-adherence. As
hypertension represented over 50% of the cohort, two
models were built to reflect the two most common medi-
cation groups prescribed: calcium channel blockers and
angiotensin-converting enzyme (ACE) inhibitors—index
NMS drugs for 34.4 and 24.1% of hypertensive patients,
respectively.
The models were hypertension–amlodipine; hyperten-
sion–ramipril; asthma-inhaled corticosteroid (ICS)–be-
clometasone; COPD–tiotropium; diabetes–metformin;
anticoagulants–aspirin. Each model had a lifetime horizon
(until the age of 100), an annual (hypertension, diabetes,
anticoagulant), monthly (COPD), or weekly (asthma) cycle
length with half-cycle correction and the UK treasury
recommended 3.5% discount rate for both costs and out-
comes. Age-related mortality was included in each model.
Each model described the consequences of being
adherent to the medicine, compared with non-adherence.
Entry age, disease severity, drug prescribed and health
status in the models were those in the RCT cohort.
2.2.1 Sources of Data and Model Design
Each model is described in detail in the electronic sup-
plementary material. For all models apart from aspirin we
utilised and adapted existing published models to optimise
design (amlodipine [30], ramipril [31], beclometasone [32],
tiotropium [33], metformin [34]). We derived the aspirin
model structure from case–control studies analysing out-
comes in large UK cohorts of patients with a first pre-
scription of aspirin [35, 36].
2.2.2 Literature Searches
A literature search was conducted through Medline,
Embase and Web of Science using treatment pathway-
specific search terms. Databases were searched to the end
of 2013. References in English and limited to humans were
Table 2 Adherence results for NMS and normal practice measured using NMS question and MMAS-8 at 10 weeks
ITTa at 10 weeks Unadjusted probability
(95% CI)bUnadjusted odds ratiob
(95% CI)
Adjusted probability
(95% CI)cAdjusted odds ratioc
(95% CI)
Adherence NMS (N = 378)
Normal practice 0.61 (0.54–0.67) 1.58 (1.03–2.42); p = 0.037 0.63 (0.55–0.70) 1.67 (1.06–2.62); p = 0.027
1.62 (1.04–2.53)d; p = 0.032NMS 0.71 (0.64–0.77) 0.74 (0.67–0.81)
Adherence MMAS-8 (N = 267)
Normal practice 0.59 (0.51–0.67) 1.74 (1.04–2.90); p = 0.036 0.65 (0.56–0.75) 1.88 (1.06–3.34); p = 0.030
1.77 (0.96–3.28)d; p = 0.068NMS 0.72 (0.64–0.80) 0.78 (0.70–0.86)
CI confidence intervals, ITT intention to treat, MMAS-8 Morisky eight-item Medication Adherence Scale, NMS New Medicine Servicea The ITT cohort was defined as all patients within a randomisation arm with measured outcomes, or who were followed up to the end of the
studyb Simple logistic regression modelc Multi-level logistic regression model adjusted for recruiting pharmacy, disease, age, sex and medication count (level 1: patient, level 2:
pharmacy)d Model accounting for multiple imputation of missing data
Economic Evaluation of the New Medicine Service (NMS) 1241
included. After excluding duplicate records, studies were
included if they examined issues on the incidence, preva-
lence, treatment or resource use of the consequences of
non-adherence. Reference lists of the retrieved references
were hand-searched.
2.2.3 Transition Probabilities
Data came preferentially from up-to-date UK sources that
reflected the NMS trial patient characteristics. The quality
of evidence varied for the different models. Data were
taken from RCTs such as effect of calcium channel
blockers [37] or ACE inhibitors [31] on major cardiovas-
cular consequences in hypertension, and effects of inhaled
steroids on asthma control [38]. Observational data were
available to populate parts of the metformin and aspirin
models. In the metformin model, transition probabilities
are based on UKPDS68 equations [34], using data on 3642
(type 2 diabetes) patients from UKPDS (United Kingdom
Prospective Diabetes Study) for whom annual data on
potential risk factors were available [39]. In the aspirin
model, data were taken from case–control studies analysing
outcomes in large UK cohorts of patients with a first pre-
scription of aspirin [35, 36]. Where no other primary
sources were available, transition probabilities estimated in
published models were used, such as transition probabili-
ties for exacerbations in COPD [40].
2.2.4 Identifying the Effect of Non-adherence on Outcomes
Quality of evidence for the effect of non-adherence on
outcomes varied widely. Where possible, data on the
impact of non-adherence were taken from large long-term
cohort studies, such as the impact of non-adherence to
antihypertensive treatment on long-term cardiovascular
outcomes for the amlodipine [41] and ramipril models [42],
and for myocardial infarction/chronic heart disease death
[35] and for stroke/transient ischemic attack [36] in the
aspirin model. The effect of non-adherence in the met-
formin model was modelled via a higher level of HbA1c
[43], which resulted in estimated higher probabilities of
diabetes complications. We used data from a study ana-
lysing non-adherence to antidiabetic medications (using
MMAS-8 [26]) and HbA1c level in 301 patients with
diagnosed type 2 diabetes in the US [43], good adherence
(MMAS-8 score C3) was associated with 10% lower
HbA1c (p = 0.0003).
Little data on the effect of non-adherence on asthma or
COPD control was available. We derived the effect of non-
adherence on asthma control from baseline data of the
SIMPLE study (observational trial of community pharmacy
intervention for asthma management), combining
adherence to ICS assessed using prescription refill data in
the previous 6 months and Asthma Control Test [44] (ACT,
0 B ACT B 25) results [45]. The most relevant results
about adherence in COPD were available from Vestbo
et al. [7]. Based on the Toward a Revolution in COPD
Health (TORCH) study [46], they reported that adherent
patients had a 60% [hazard ratio (HR) 0.4; 95% CI
0.35–0.46] lower risk of death and a 44% [relative risk
(RR) 0.56; 95% CI 0.48–0.65] lower rate of severe exac-
erbations [7]. We found no data to inform the effect of
adherence on frequency of non-severe exacerbations, so
assumed that the HR was equivalent to severe
exacerbations.
2.2.5 Health Status
For the amlodipine, ramipril, metformin and aspirin mod-
els, utilities were based on EQ-5D data from the Health
Survey for England (2003, 2006), adjusted for age, sex and
disease status [47]. Asthma utilities were taken from an
RCT of ICS, using the Asthma Quality of Life Question-
naire (AQLQ [48]) scores [49]. Utilities for the COPD
model were derived from an RCT of tiotropium [33, 50].
2.2.6 Resource Use and Unit Costs
Resource-use data came preferentially from up-to-date UK
sources of observation of clinical practice, with disaggre-
gated resource-use data, to allow attachment of current unit
prices. If possible, individual patient data were used, with
associated measures of mean and variation. If these were
not available, point estimates were used, with carefully
specified deterministic ranges, and standard methods for
allocating distributions to these data were used.
The probability, cost and utility data were assigned beta,
gamma and beta distributions, respectively, and are sum-
marised in Tables 3, 4 and 5. Costs are given in year 2014
values.
2.3 Incremental Analysis
In the base case, we applied probabilities of adherence to
each model, estimated from 10-week trial results, for the
primary adherence outcome measure (Table 2). Adjusted
probability of adherence in the NMS group was 74%,
probability of adherence in normal practice was 63%, and
the odds ratio (OR) (NMS vs normal practice) was 1.67
(1.06–2.62; p = 0.027). Adherence was assumed to stay
the same in both arms over the time horizon of the model.
Each model was populated with probability, cost and
health status data. This allowed the generation of the out-
comes and costs in a cohort who were adherent, and in a
1242 R. A. Elliott et al.

cohort who were non-adherent to the medicine. The
adherence for each drug–disease pair at 10-week follow-up
in the NMS and normal practice arms were combined with
the appropriate disease-drug-specific model. Using these
models, we generated the difference in patient outcome and
costs between NMS and normal practice for each disease–
drug pair. Probabilistic estimates of costs and outcomes
were derived, the analysis generating 5000 iterations, using
Monte Carlo simulation for each disease–drug pair.
The incremental costs and outcomes associated with
each disease–drug pair were incorporated additively into
the economic model to allow derivation of the total
incremental impact of the NMS intervention costs and
outcomes for all six disease–drug pairs. At this point the
NMS intervention costs were added.
Deterministic and probabilistic incremental economic
analyses were carried out. The incremental cost-per-QALY
generated by NMS over normal practice was calculated
using the following equation:
ðCostNMS�CostNormalpracticeÞ=ðQALYNMS�QALYNormalpracticeÞ:
Utilising Microsoft Excel, we used 5000 Monte Carlo
simulations to obtain the incremental cost-effectiveness
Table 3 NHS and non-NHS
costs for normal practice and
NMS intervention
Cost category Normal practice (n = 116)
Mean cost/£ (n, SE)
NMS (n = 122)
Mean cost/£ (n, SE)
Primary care total 81.6 (111, 5.76) 72.18 (115, 4.99)
GP total 67.7 (100, 5.26) 60.94 (105, 4.34)
GP contact 59.21 (95, 4.35) 57.13 (98, 4.36)
GP home visit 3.66 (2, 3.02) 0.7 (1, 0.7)
GP phone call 4.83 (19, 1.11) 3.11 (13, 0.93)
Nursing total 13.9 (79, 1.53) 11.24 (73, 1.56)
Nurse contact 12.49 (73, 1.46) 10.73 (72, 1.51)
Nurse home visit 0.92 (3, 0.60) 0.38 (2, 0.28)
Nurse phone call 0.49 (7, 0.29) 0.13 (3, 0.08)
Secondary care total 175.54 (53, 28.76) 141.23 (52, 25.79)
Outpatient 98.85 (47, 16.42) 91.2 (46, 16.19)
Accident and emergency 2.02 (2, 1.42) 0.96 (1, 0.96)
Day case 63.01 (17, 16.00) 49.08 (13, 16.62)
Inpatient 11.66 (1, 11.66) 0 (0, 0)
Allied HCPs (NHS) totala 3.73 (19, 1.13) 1.75 (16, 0.48)
Allied HCP contact 2.37 (16, 0.66) 1.48 (13, 0.43)
Allied HCP home visit 1.27 (3, 0.77) 0.15 (1, 0.15)
Allied HCP phone call 0.08 (2, 0.06) 0.12 (3, 0.07)
NMS intervention 0 24.60
Total NHS cost 260.87 (114, 30.23)* 239.66 (121, 26.61)
Community-based practitioner totalb 4.81 (5, 2.66) 4.71 (2, 4.44)
Community-based practitioner phone call 0.08 (2, 0.06) 0.08 (1, 0.08)
Community-based practitioner contact 0.14 (1, 0.14) 0.27 (1, 0.27)
Community-based practitioner home visit 4.58 (4, 2.54) 4.36 (1, 4.36)
Allied HCPs non-NHS total 7.4 (54, 0.99) 8.69 (64, 1.04)
Community pharmacist 6.31 (48, 0.93) 7.57 (61, 0.91)
Other associated HCPs non-NHSc 1.1 (10, 0.35) 1.13 (11, 0.34)
Total non-NHS cost 12.21 (56, 2.86) 13.4 (65, 4.5)
GP general practitioner, HCP healthcare practitioner, NHS National Health Service, NMS New Medicine
Service, SE standard error
* Mean difference in costs: £21.11 (95% CI -59.01 to 100.24; p = 0.1281)a Allied HCPs (NHS) include podiatrists, phlebotomistsb Community-based practitioners include social workersc Allied HCPs (non-NHS) include dentists, opticians, chiropractors
Economic Evaluation of the New Medicine Service (NMS) 1243
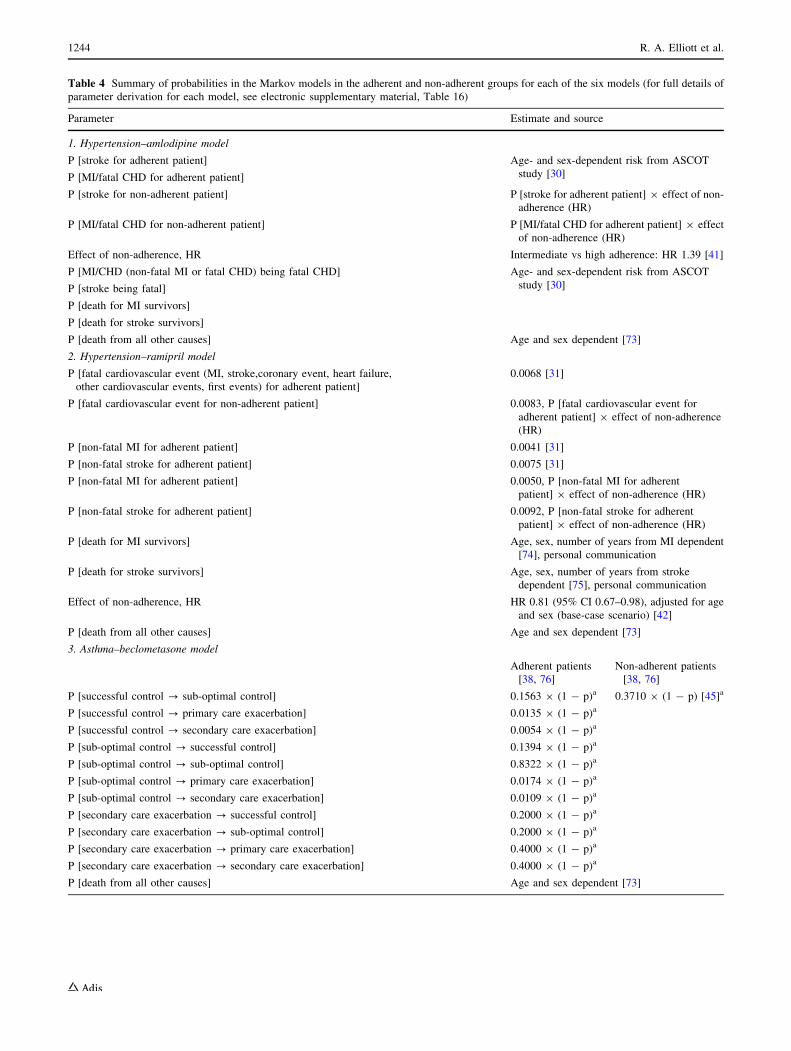
Table 4 Summary of probabilities in the Markov models in the adherent and non-adherent groups for each of the six models (for full details of
parameter derivation for each model, see electronic supplementary material, Table 16)
Parameter Estimate and source
1. Hypertension–amlodipine model
P [stroke for adherent patient] Age- and sex-dependent risk from ASCOT
study [30]P [MI/fatal CHD for adherent patient]
P [stroke for non-adherent patient] P [stroke for adherent patient] 9 effect of non-
adherence (HR)
P [MI/fatal CHD for non-adherent patient] P [MI/fatal CHD for adherent patient] 9 effect
of non-adherence (HR)
Effect of non-adherence, HR Intermediate vs high adherence: HR 1.39 [41]
P [MI/CHD (non-fatal MI or fatal CHD) being fatal CHD] Age- and sex-dependent risk from ASCOT
study [30]P [stroke being fatal]
P [death for MI survivors]
P [death for stroke survivors]
P [death from all other causes] Age and sex dependent [73]
2. Hypertension–ramipril model
P [fatal cardiovascular event (MI, stroke,coronary event, heart failure,
other cardiovascular events, first events) for adherent patient]
0.0068 [31]
P [fatal cardiovascular event for non-adherent patient] 0.0083, P [fatal cardiovascular event for
adherent patient] 9 effect of non-adherence
(HR)
P [non-fatal MI for adherent patient] 0.0041 [31]
P [non-fatal stroke for adherent patient] 0.0075 [31]
P [non-fatal MI for adherent patient] 0.0050, P [non-fatal MI for adherent
patient] 9 effect of non-adherence (HR)
P [non-fatal stroke for adherent patient] 0.0092, P [non-fatal stroke for adherent
patient] 9 effect of non-adherence (HR)
P [death for MI survivors] Age, sex, number of years from MI dependent
[74], personal communication
P [death for stroke survivors] Age, sex, number of years from stroke
dependent [75], personal communication
Effect of non-adherence, HR HR 0.81 (95% CI 0.67–0.98), adjusted for age
and sex (base-case scenario) [42]
P [death from all other causes] Age and sex dependent [73]
3. Asthma–beclometasone model
Adherent patients
[38, 76]
Non-adherent patients
[38, 76]
P [successful control ? sub-optimal control] 0.1563 9 (1 - p)a 0.3710 9 (1 - p) [45]a
P [successful control ? primary care exacerbation] 0.0135 9 (1 - p)a
P [successful control ? secondary care exacerbation] 0.0054 9 (1 - p)a
P [sub-optimal control ? successful control] 0.1394 9 (1 - p)a
P [sub-optimal control ? sub-optimal control] 0.8322 9 (1 - p)a
P [sub-optimal control ? primary care exacerbation] 0.0174 9 (1 - p)a
P [sub-optimal control ? secondary care exacerbation] 0.0109 9 (1 - p)a
P [secondary care exacerbation ? successful control] 0.2000 9 (1 - p)a
P [secondary care exacerbation ? sub-optimal control] 0.2000 9 (1 - p)a
P [secondary care exacerbation ? primary care exacerbation] 0.4000 9 (1 - p)a
P [secondary care exacerbation ? secondary care exacerbation] 0.4000 9 (1 - p)a
P [death from all other causes] Age and sex dependent [73]
1244 R. A. Elliott et al.
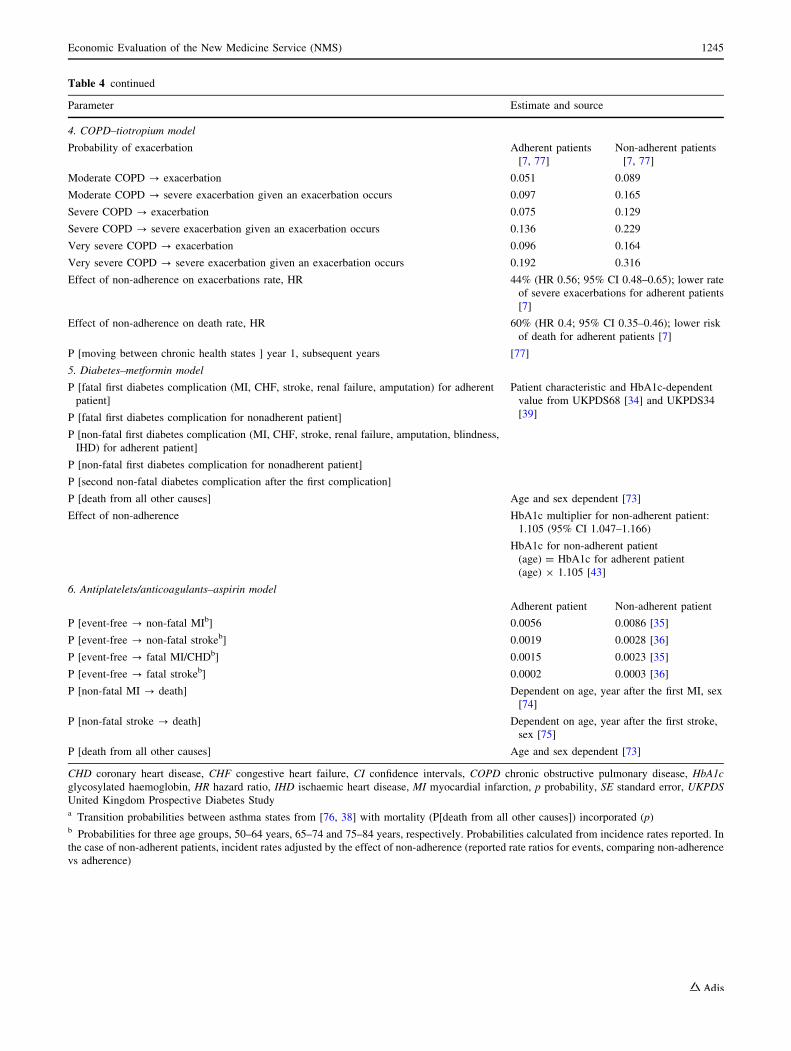
Table 4 continued
Parameter Estimate and source
4. COPD–tiotropium model
Probability of exacerbation Adherent patients
[7, 77]
Non-adherent patients
[7, 77]
Moderate COPD ? exacerbation 0.051 0.089
Moderate COPD ? severe exacerbation given an exacerbation occurs 0.097 0.165
Severe COPD ? exacerbation 0.075 0.129
Severe COPD ? severe exacerbation given an exacerbation occurs 0.136 0.229
Very severe COPD ? exacerbation 0.096 0.164
Very severe COPD ? severe exacerbation given an exacerbation occurs 0.192 0.316
Effect of non-adherence on exacerbations rate, HR 44% (HR 0.56; 95% CI 0.48–0.65); lower rate
of severe exacerbations for adherent patients
[7]
Effect of non-adherence on death rate, HR 60% (HR 0.4; 95% CI 0.35–0.46); lower risk
of death for adherent patients [7]
P [moving between chronic health states ] year 1, subsequent years [77]
5. Diabetes–metformin model
P [fatal first diabetes complication (MI, CHF, stroke, renal failure, amputation) for adherent
patient]
Patient characteristic and HbA1c-dependent
value from UKPDS68 [34] and UKPDS34
[39]P [fatal first diabetes complication for nonadherent patient]
P [non-fatal first diabetes complication (MI, CHF, stroke, renal failure, amputation, blindness,
IHD) for adherent patient]
P [non-fatal first diabetes complication for nonadherent patient]
P [second non-fatal diabetes complication after the first complication]
P [death from all other causes] Age and sex dependent [73]
Effect of non-adherence HbA1c multiplier for non-adherent patient:
1.105 (95% CI 1.047–1.166)
HbA1c for non-adherent patient
(age) = HbA1c for adherent patient
(age) 9 1.105 [43]
6. Antiplatelets/anticoagulants–aspirin model
Adherent patient Non-adherent patient
P [event-free ? non-fatal MIb] 0.0056 0.0086 [35]
P [event-free ? non-fatal strokeb] 0.0019 0.0028 [36]
P [event-free ? fatal MI/CHDb] 0.0015 0.0023 [35]
P [event-free ? fatal strokeb] 0.0002 0.0003 [36]
P [non-fatal MI ? death] Dependent on age, year after the first MI, sex
[74]
P [non-fatal stroke ? death] Dependent on age, year after the first stroke,
sex [75]
P [death from all other causes] Age and sex dependent [73]
CHD coronary heart disease, CHF congestive heart failure, CI confidence intervals, COPD chronic obstructive pulmonary disease, HbA1c
glycosylated haemoglobin, HR hazard ratio, IHD ischaemic heart disease, MI myocardial infarction, p probability, SE standard error, UKPDS
United Kingdom Prospective Diabetes Studya Transition probabilities between asthma states from [76, 38] with mortality (P[death from all other causes]) incorporated (p)b Probabilities for three age groups, 50–64 years, 65–74 and 75–84 years, respectively. Probabilities calculated from incidence rates reported. In
the case of non-adherent patients, incident rates adjusted by the effect of non-adherence (reported rate ratios for events, comparing non-adherence
vs adherence)
Economic Evaluation of the New Medicine Service (NMS) 1245
ratio (ICER) distribution. Negative ICERs are difficult to
interpret and often arise when one of the interventions is
either ‘dominant’ (more effective, less costly) or
‘dominated’ (less effective, more costly). It is not
possible to tell this from the ICER itself. We report the
proportion of ICER estimates in each of the four quadrants
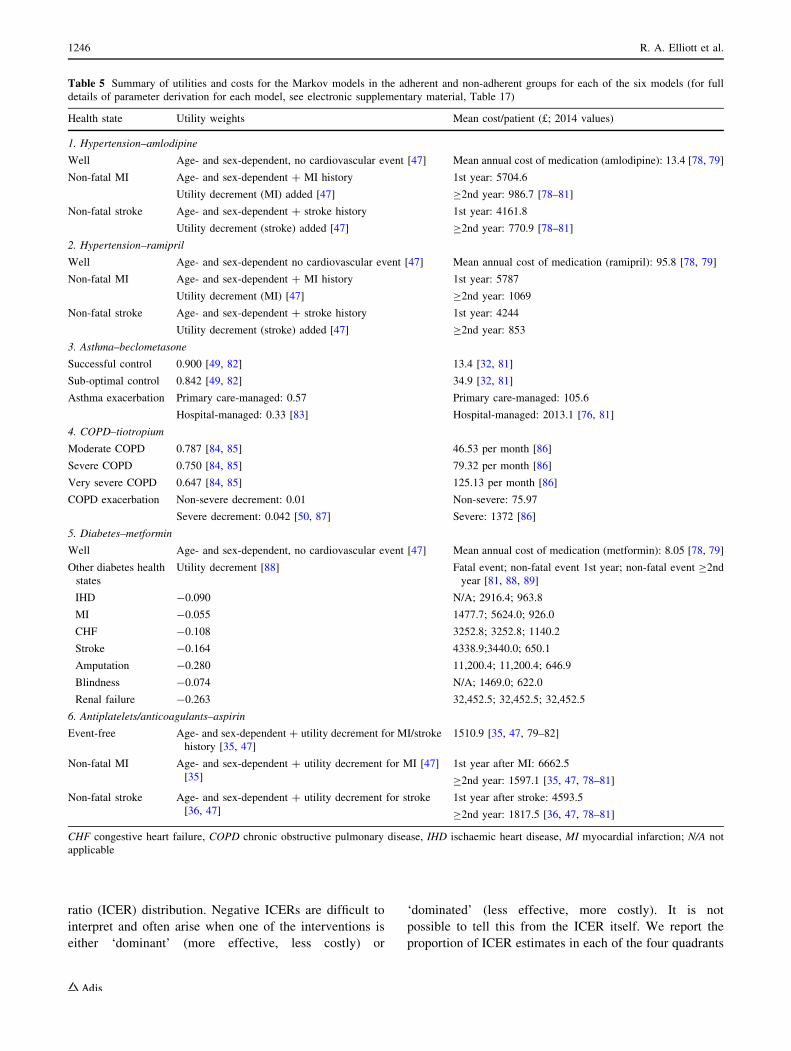
Table 5 Summary of utilities and costs for the Markov models in the adherent and non-adherent groups for each of the six models (for full
details of parameter derivation for each model, see electronic supplementary material, Table 17)
Health state Utility weights Mean cost/patient (£; 2014 values)
1. Hypertension–amlodipine
Well Age- and sex-dependent, no cardiovascular event [47] Mean annual cost of medication (amlodipine): 13.4 [78, 79]
Non-fatal MI Age- and sex-dependent ? MI history
Utility decrement (MI) added [47]
1st year: 5704.6
C2nd year: 986.7 [78–81]
Non-fatal stroke Age- and sex-dependent ? stroke history
Utility decrement (stroke) added [47]
1st year: 4161.8
C2nd year: 770.9 [78–81]
2. Hypertension–ramipril
Well Age- and sex-dependent no cardiovascular event [47] Mean annual cost of medication (ramipril): 95.8 [78, 79]
Non-fatal MI Age- and sex-dependent ? MI history
Utility decrement (MI) [47]
1st year: 5787
C2nd year: 1069
Non-fatal stroke Age- and sex-dependent ? stroke history
Utility decrement (stroke) added [47]
1st year: 4244
C2nd year: 853
3. Asthma–beclometasone
Successful control 0.900 [49, 82] 13.4 [32, 81]
Sub-optimal control 0.842 [49, 82] 34.9 [32, 81]
Asthma exacerbation Primary care-managed: 0.57
Hospital-managed: 0.33 [83]
Primary care-managed: 105.6
Hospital-managed: 2013.1 [76, 81]
4. COPD–tiotropium
Moderate COPD 0.787 [84, 85] 46.53 per month [86]
Severe COPD 0.750 [84, 85] 79.32 per month [86]
Very severe COPD 0.647 [84, 85] 125.13 per month [86]
COPD exacerbation Non-severe decrement: 0.01
Severe decrement: 0.042 [50, 87]
Non-severe: 75.97
Severe: 1372 [86]
5. Diabetes–metformin
Well Age- and sex-dependent, no cardiovascular event [47] Mean annual cost of medication (metformin): 8.05 [78, 79]
Other diabetes health
states
Utility decrement [88] Fatal event; non-fatal event 1st year; non-fatal event C2nd
year [81, 88, 89]
IHD -0.090 N/A; 2916.4; 963.8
MI -0.055 1477.7; 5624.0; 926.0
CHF -0.108 3252.8; 3252.8; 1140.2
Stroke -0.164 4338.9;3440.0; 650.1
Amputation -0.280 11,200.4; 11,200.4; 646.9
Blindness -0.074 N/A; 1469.0; 622.0
Renal failure -0.263 32,452.5; 32,452.5; 32,452.5
6. Antiplatelets/anticoagulants–aspirin
Event-free Age- and sex-dependent ? utility decrement for MI/stroke
history [35, 47]
1510.9 [35, 47, 79–82]
Non-fatal MI Age- and sex-dependent ? utility decrement for MI [47]
[35]
1st year after MI: 6662.5
C2nd year: 1597.1 [35, 47, 78–81]
Non-fatal stroke Age- and sex-dependent ? utility decrement for stroke
[36, 47]
1st year after stroke: 4593.5
C2nd year: 1817.5 [36, 47, 78–81]
CHF congestive heart failure, COPD chronic obstructive pulmonary disease, IHD ischaemic heart disease, MI myocardial infarction; N/A not
applicable
1246 R. A. Elliott et al.

of the cost-effectiveness plane. We present mean ICERs for
all results, indicating for negative ICERs whether the
intervention is dominant or dominated.
Cost-effectiveness acceptability curves (CEACs) [51]
were constructed to express the probability that NMS is
cost effective as a function of the decision maker’s ceiling
cost-effectiveness ratio (k) [52].
2.4 Sensitivity Analysis
Deterministic analysis was conducted using the MMAS-8
adherence measure, for which probabilities of adherence
were 78 and 65% in the NMS and normal practice groups,
respectively, with OR of 1.88 (1.06–3.34), (Table 2).
The deterministic analysis was repeated to determine the
effect of reducing the effect size, by reducing the adher-
ence in the NMS arm, keeping the probability of adherence
in the current practice arm unchanged. The difference in
adherence between NMS and normal practice that would
be required to attain an ICER of £20,000 per QALY was
determined.
The probabilistic analysis was repeated in the disease-
specific subgroups.
2.5 Model Validation
Validity testing (conceptual model, input data, assump-
tions, model outcomes) was carried out iteratively as part
of the development of the model throughout the project,
with general practice, clinical pharmacy and health eco-
nomics experts on the project team and the independent
advisory panel [53]. This was carried out as multiple ‘walk-
throughs’ and review of specific written summaries of
model structure, inputs and outcomes. There is no com-
parable model of a cross-therapeutic intervention to assess
adherence. However, cross validity of individual models
was maximised by using published models to derive a
model for each disease where possible. The computerised
individual and composite models were developed by LT
and GG and examined by RAE, who has built a composite
model in a previous study. Models were only accepted if
there were no illogical or illegal inputs or outputs.
3 Results
3.1 Incremental Analysis
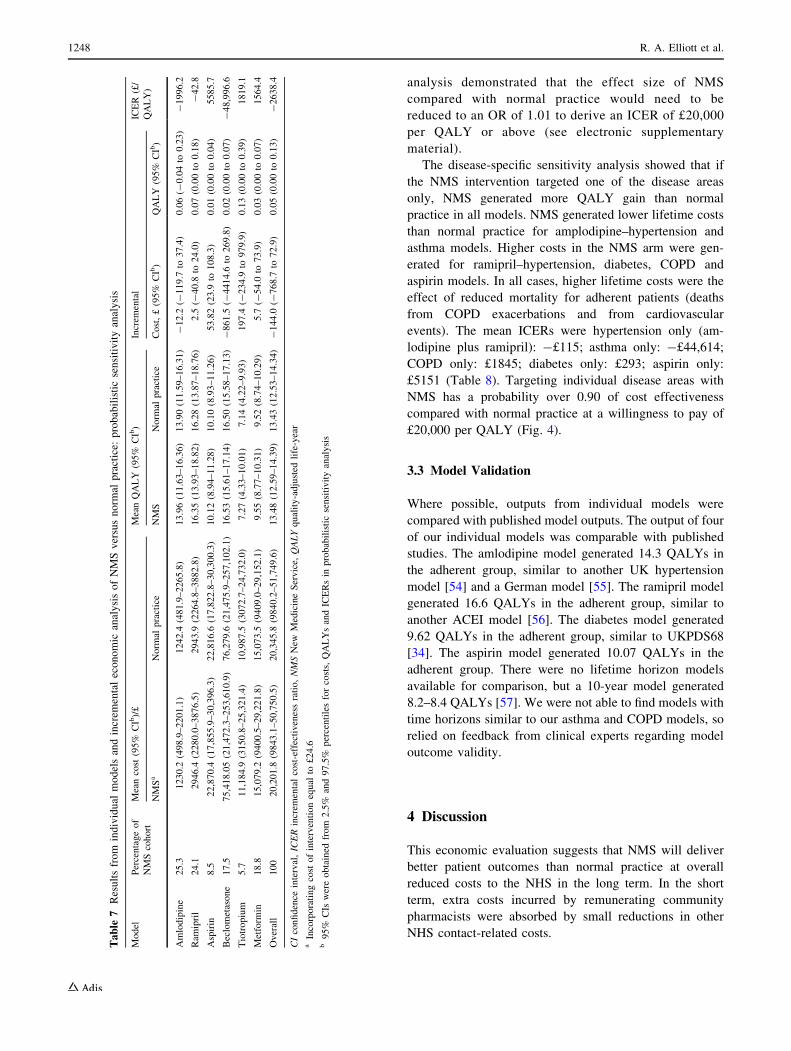
Tables 6 and 7 summarise the lifetime costs and outcomes
derived from each disease-drug-specific model, their rela-
tive contribution to the economic model, and the overall
results for the incremental analysis of NMS versus normal
practice.
NMS generated a mean of 0.04 more QALYs per patient
than normal practice, at a mean reduced cost of-£139, with
probabilistic means of 0.05 (95% CI 0.00–0.13) and -£144
(95% CI -769 to 73). Therefore, NMS dominates normal
practice, with an ICER of –£3166 (probabilistic mean -
£2638). The probability that NMS dominates normal prac-
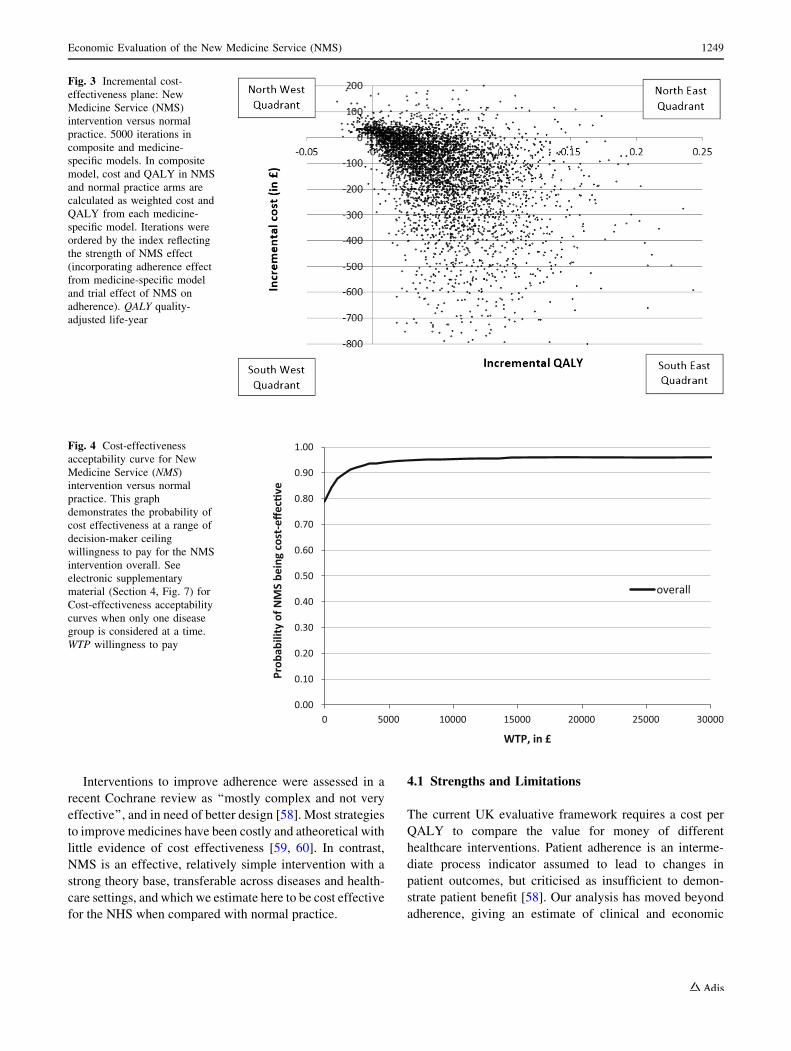
tice is 0.78. NMS has a high probability (0.96) of cost
effectiveness comparedwith normal practice at awillingness
to pay of £20,000 for one QALY (see Figs. 3, 4).
3.2 Sensitivity Analysis
The results were robust to changing adherence outcome.
When MMAS-8 was used to estimate changes in
adherence, the incremental QALY was 0.06, incremen-
tal cost was -£164, with an ICER of -£2953 (see
electronic supplementary material). The threshold
Table 6 Results from individual models and incremental economic analysis of NMS versus normal practice: deterministic analysis
Model Percentage of NMS cohort Mean cost (£) Mean QALY Incremental ICER (£/QALY)
NMSa Normal practice NMS Normal practice Cost (£) QALY
Amlodipine 25.3 1496.9 1512.0 14.22 14.17 -15.1 0.04 -338.0
Ramipril 24.1 2925.4 2922.9 16.37 16.30 2.6 0.07 37.9
Aspirin 8.5 22,881.6 22,830.1 10.04 10.03 51.5 0.01 5151.0
Beclometasone 17.5 71,539.9 72,432.2 16.56 16.54 -892.3 0.02 -44,614.0
Tiotropium 5.7 10,508.6 10,250.3 6.99 6.85 258.3 0.14 1845.2
Metformin 18.8 15,285.7 15,279.8 9.55 9.53 5.9 0.02 293.0
Overall 100 19,013.2 19,151.8 13.49 13.45 -138.6 0.04 -3166.1
ICER incremental cost-effectiveness ratio, NMS New Medicine Service, QALY quality-adjusted life-yeara Incorporating cost of intervention equal to £24.6
Economic Evaluation of the New Medicine Service (NMS) 1247
analysis demonstrated that the effect size of NMS
compared with normal practice would need to be
reduced to an OR of 1.01 to derive an ICER of £20,000
per QALY or above (see electronic supplementary
material).
The disease-specific sensitivity analysis showed that if
the NMS intervention targeted one of the disease areas
only, NMS generated more QALY gain than normal
practice in all models. NMS generated lower lifetime costs
than normal practice for amplodipine–hypertension and
asthma models. Higher costs in the NMS arm were gen-
erated for ramipril–hypertension, diabetes, COPD and
aspirin models. In all cases, higher lifetime costs were the
effect of reduced mortality for adherent patients (deaths
from COPD exacerbations and from cardiovascular
events). The mean ICERs were hypertension only (am-
lodipine plus ramipril): -£115; asthma only: -£44,614;
COPD only: £1845; diabetes only: £293; aspirin only:
£5151 (Table 8). Targeting individual disease areas with
NMS has a probability over 0.90 of cost effectiveness
compared with normal practice at a willingness to pay of
£20,000 per QALY (Fig. 4).
3.3 Model Validation
Where possible, outputs from individual models were
compared with published model outputs. The output of four
of our individual models was comparable with published
studies. The amlodipine model generated 14.3 QALYs in
the adherent group, similar to another UK hypertension
model [54] and a German model [55]. The ramipril model
generated 16.6 QALYs in the adherent group, similar to
another ACEI model [56]. The diabetes model generated
9.62 QALYs in the adherent group, similar to UKPDS68
[34]. The aspirin model generated 10.07 QALYs in the
adherent group. There were no lifetime horizon models
available for comparison, but a 10-year model generated
8.2–8.4 QALYs [57]. We were not able to find models with
time horizons similar to our asthma and COPD models, so
relied on feedback from clinical experts regarding model
outcome validity.
4 Discussion
This economic evaluation suggests that NMS will deliver
better patient outcomes than normal practice at overall
reduced costs to the NHS in the long term. In the short
term, extra costs incurred by remunerating community
pharmacists were absorbed by small reductions in other
NHS contact-related costs.
Table
7Resultsfrom
individual
modelsandincrem
entaleconomic
analysisofNMSversusnorm
alpractice:
probabilisticsensitivityanalysis
Model
Percentageof
NMScohort
Meancost
(95%
CIb)/£
MeanQALY
(95%
CIb)
Increm
ental
ICER
(£/
QALY)
NMSa
Norm
alpractice
NMS
Norm
alpractice
Cost,£(95%
CIb)
QALY
(95%
CIb)
Amlodipine
25.3
1230.2
(498.9–2201.1)
1242.4
(481.9–2265.8)
13.96(11.63–16.36)
13.90(11.59–16.31)
-12.2
(-119.7
to37.4)
0.06(-
0.04to
0.23)
-1996.2
Ram
ipril
24.1
2946.4
(2280.0–3876.5)
2943.9
(2264.8–3882.8)
16.35(13.93–18.82)
16.28(13.87–18.76)
2.5
(-40.8
to24.0)
0.07(0.00to
0.18)
-42.8
Aspirin
8.5
22,870.4
(17,855.9–30,396.3)
22,816.6
(17,822.8–30,300.3)
10.12(8.94–11.28)
10.10(8.93–11.26)
53.82(23.9
to108.3)
0.01(0.00to
0.04)
5585.7
Beclometasone
17.5
75,418.05(21,472.3–253,610.9)
76,279.6
(21,475.9–257,102.1)
16.53(15.61–17.14)
16.50(15.58–17.13)
-861.5
(-4414.6
to269.8)
0.02(0.00to
0.07)
-48,996.6
Tiotropium
5.7
11,184.9
(3150.8–25,321.4)
10,987.5
(3072.7–24,732.0)
7.27(4.33–10.01)
7.14(4.22–9.93)
197.4
(-234.9
to979.9)
0.13(0.00to
0.39)
1819.1
Metform
in18.8
15,079.2
(9400.5–29,221.8)
15,073.5
(9409.0–29,152.1)
9.55(8.77–10.31)
9.52(8.74–10.29)
5.7
(-54.0
to73.9)
0.03(0.00to
0.07)
1564.4
Overall
100
20,201.8
(9843.1–50,750.5)
20,345.8
(9840.2–51,749.6)
13.48(12.59–14.39)
13.43(12.53–14.34)
-144.0
(-768.7
to72.9)
0.05(0.00to
0.13)
-2638.4
CIconfidence
interval,ICERincrem
entalcost-effectivenessratio,NMSNew
MedicineService,
QALYquality-adjusted
life-year
aIncorporatingcost
ofinterventionequal
to£24.6
b95%
CIs
wereobtained
from
2.5%
and97.5%
percentilesforcosts,QALYsandICERsin
probabilisticsensitivityanalysis
1248 R. A. Elliott et al.
Interventions to improve adherence were assessed in a
recent Cochrane review as ‘‘mostly complex and not very
effective’’, and in need of better design [58]. Most strategies
to improve medicines have been costly and atheoretical with
little evidence of cost effectiveness [59, 60]. In contrast,
NMS is an effective, relatively simple intervention with a
strong theory base, transferable across diseases and health-
care settings, and which we estimate here to be cost effective
for the NHS when compared with normal practice.
4.1 Strengths and Limitations
The current UK evaluative framework requires a cost per
QALY to compare the value for money of different
healthcare interventions. Patient adherence is an interme-
diate process indicator assumed to lead to changes in
patient outcomes, but criticised as insufficient to demon-
strate patient benefit [58]. Our analysis has moved beyond
adherence, giving an estimate of clinical and economic
Fig. 3 Incremental cost-
effectiveness plane: New
Medicine Service (NMS)
intervention versus normal
practice. 5000 iterations in
composite and medicine-
specific models. In composite
model, cost and QALY in NMS
and normal practice arms are
calculated as weighted cost and
QALY from each medicine-
specific model. Iterations were
ordered by the index reflecting
the strength of NMS effect
(incorporating adherence effect
from medicine-specific model
and trial effect of NMS on
adherence). QALY quality-
adjusted life-year
0.00
0.10
0.20
0.30
0.40
0.50
0.60
0.70
0.80
0.90
1.00
0 5000 10000 15000 20000 25000 30000
overall
WTP, in £
Prob
abili
ty o
f NM
S be
ing
cost
-effe
c�ve
Fig. 4 Cost-effectiveness
acceptability curve for New
Medicine Service (NMS)
intervention versus normal
practice. This graph
demonstrates the probability of
cost effectiveness at a range of
decision-maker ceiling
willingness to pay for the NMS
intervention overall. See
electronic supplementary
material (Section 4, Fig. 7) for
Cost-effectiveness acceptability
curves when only one disease
group is considered at a time.
WTP willingness to pay
Economic Evaluation of the New Medicine Service (NMS) 1249
impact of the intervention, and is an important
development.
Pharmacist-led interventions often reflect their cross-
therapeutic role around prescribing safety and patient
adherence, bringing a significant challenge to the evalua-
tive framework, which is historically disease-specific.
Evaluations of pharmacist-led interventions often rely on
generic process measures such as errors [61, 62], medica-
tion changes [63] or patient adherence [14], and tend to
report ICERs such as cost per adherent patient or cost per
error avoided [14, 61]; or utilise assumptions about the
level of disutility incurred [64]. In a previous study
examining the economic impact of a pharmacist-led
information technology-based intervention (PINCER) to
reduce medication errors in general practices, we devel-
oped a novel approach where economic models were
developed for each of six errors, and generated a cost per
QALY [22]. We applied this method in the economic
evaluation of NMS. Therefore, this study differs from most
other economic evaluations in this area, and we have been
able to generate cost-per-QALY statistics to inform deci-
sion making.
The effect size of an absolute 10% improvement in
adherence from normal practice to NMS is similar to that
reported in the original work by Clifford [65]. Although the
effect sizes here might initially be considered small, we
anticipate significant benefits for two reasons. First, large
numbers of patients have experienced the service. Second,
we suggest that this is a conservative effect size, given
probable patient recruitment bias, use of self-report of
adherence, and the assumption that all the patients in the
intervention arm actually received the NMS.
There is no gold standard for measuring patients’
medicines adherence. Each approach has limitations. More
than one adherence measure should be used to provide an
internal check on validity [1]. In this study, we chose two
self-report measures. Prescription filling was not an option
for routine adherence monitoring in England due to lack of
interoperability between community pharmacy and general
practice systems. Although self-report tends to return a
higher rate of medication adherence (?15%) than some
objective measures, it correlates with objective clinical
measures [66]. It is possible to minimise biases through
confidential interview [67], as is carried out as part of
NMS; normalising non-adherence by recognising the
challenges of taking regular medications; avoiding nega-
tive or positive questions which may encourage a biased
response; and asking about a missed dose in the few days
or a week prior to data collection rather than months or
years [68].
A key limitation is the paucity of data upon which to
base the estimates of economic impact of adherence in the
individual disease–drug pairs, particularly the link between
adherence and outcome. The wide range around the point
estimates of cost effectiveness reflects the uncertainty in
some of the individual adherence models.
Weaknesses in the models centre on assumptions made.
It is assumed that the incremental effect of NMS compared
with normal practice on adherence is the same over a
patient’s lifetime. Published estimates of persistence to
new hypertension medicines at 1 year are around 48%
[69, 70] and 51% [71] dropping from 6-month rates of
65–68%. This suggests that adherence is likely to drop in
the cohort not having NMS at the beginning of their
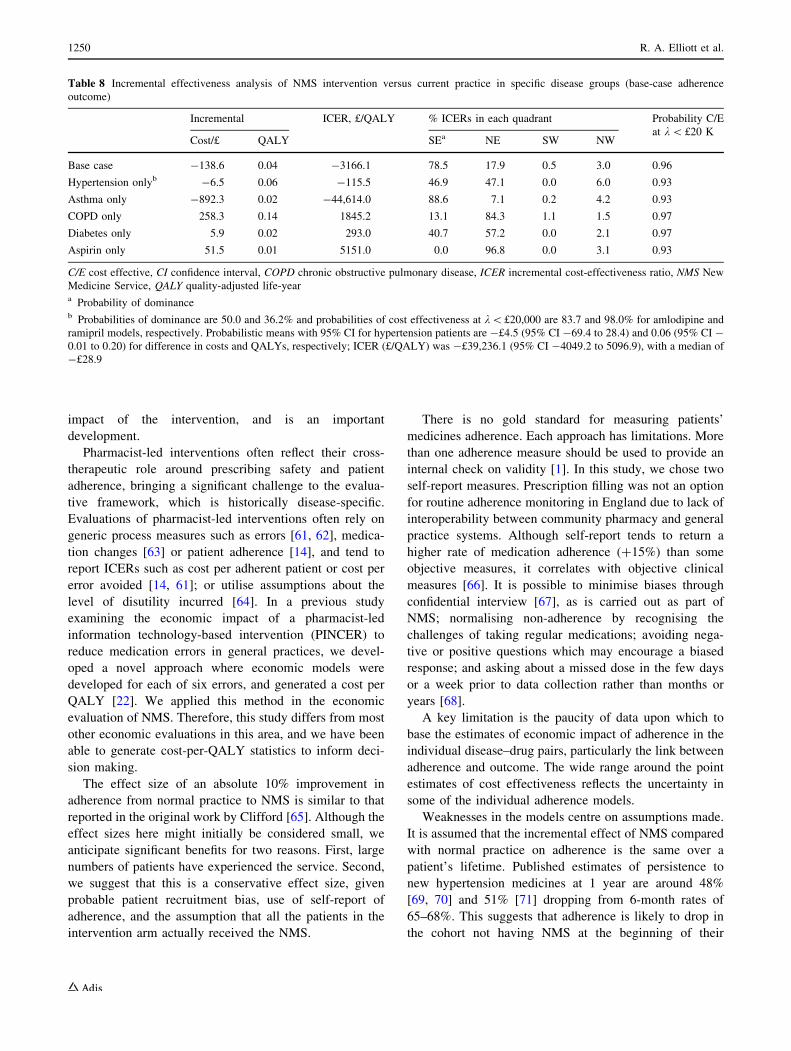
Table 8 Incremental effectiveness analysis of NMS intervention versus current practice in specific disease groups (base-case adherence
outcome)
Incremental ICER, £/QALY % ICERs in each quadrant Probability C/E
at k\ £20 KCost/£ QALY SEa NE SW NW
Base case -138.6 0.04 -3166.1 78.5 17.9 0.5 3.0 0.96
Hypertension onlyb -6.5 0.06 -115.5 46.9 47.1 0.0 6.0 0.93
Asthma only -892.3 0.02 -44,614.0 88.6 7.1 0.2 4.2 0.93
COPD only 258.3 0.14 1845.2 13.1 84.3 1.1 1.5 0.97
Diabetes only 5.9 0.02 293.0 40.7 57.2 0.0 2.1 0.97
Aspirin only 51.5 0.01 5151.0 0.0 96.8 0.0 3.1 0.93
C/E cost effective, CI confidence interval, COPD chronic obstructive pulmonary disease, ICER incremental cost-effectiveness ratio, NMS New
Medicine Service, QALY quality-adjusted life-yeara Probability of dominanceb Probabilities of dominance are 50.0 and 36.2% and probabilities of cost effectiveness at k\£20,000 are 83.7 and 98.0% for amlodipine and
ramipril models, respectively. Probabilistic means with 95% CI for hypertension patients are -£4.5 (95% CI -69.4 to 28.4) and 0.06 (95% CI -
0.01 to 0.20) for difference in costs and QALYs, respectively; ICER (£/QALY) was -£39,236.1 (95% CI -4049.2 to 5096.9), with a median of
-£28.9
1250 R. A. Elliott et al.
treatment. Our study suggests that the effect of NMS
appears to be an absolute increase in adherence of 10% at
10 weeks post-initiation of the new medicine. It is not clear
whether this effect will:
(a) disappear, such that there is no difference in adher-
ence at 6 or 12 months;
(b) be maintained, such that adherence in both the NMS
and control groups drops over time at the same rate,
so the current benefit is maintained; or
(c) initiate a change in the patient’s motivation or ability
to adhere that leads to sustained adherence to the
medicine such that the usual drop in adherence over
time is prevented.
In the absence of any evidence to support which of these
scenarios reflects reality, the economic analysis assumes
scenario (b) for the basis of extrapolation of effect size.
Sensitivity analysis suggested that the OR had to be
reduced from 1.67 to 1.01 for NMS to stop being cost
effective at a ceiling willingness to pay of £20,000 per
QALY.
Apart from general limitations associated with the use of
modelling, specific model limitations in our study include
the use of the same effect of NMS on adherence for each
disease-specific model since the trial was powered to
analyse the effect of NMS in the entire NMS trial popu-
lation. However, the effect of NMS on adherence may
differ between disease groups and, in this case, the results
of disease-specific models would be different than those
assuming the same effect of NMS on adherence. The
effects of adherence incorporated in the models were
observed in the studies with different time horizons, from 1
year to longer (with maximal follow-up 4–5 years), while
in the model we assume that effect of adherence is kept
over a lifetime. We did not incorporate adverse event states
in the models that may affect cost effectiveness (e.g. in
older people, antihypertensive drugs may increase the risks
of falls).
4.2 Implications for Policy and Practice
From inception of the NMS to the end of August 2016,
3.59 million consultations have been claimed for with over
820,000 in the year 2015/16 [90]. From the results of this
economic evaluation, this suggests £75.4 million short-
term savings to the NHS, £517.6 million long-term cost
savings to the NHS and 179,500 QALYs gained.
The research presented above suggests that the NMS is
cost effective for each disease population than normal
practice, with high (above 97%) probability of cost effec-
tiveness at a willingness to pay set at £20,000. On the basis
of this evidence, it is recommended that this service con-
tinue to be commissioned in the future.
Where there is evidence suggesting therapeutic areas
with significantly poor adherence, especially when non-
adherence has significant effect on outcomes, consideration
should be given to expanding the NMS. Potential areas
might include conditions where medicines can have early
adverse effects that subside over time such as anti-
depressants.
5 Conclusions
This study suggests increased health gain with NMS over
normal practice at a cost per QALY well below most
accepted thresholds for technology implementation [72].
This intervention could be extended to other groups of
medicines. The findings are likely to have applicability to
other healthcare systems, including those based on
insurance.
5.1 Data Availability Statement
Several datasets were used for this analysis: (1) efficacy,
patient-reported outcomes and healthcare resource utilisa-
tion data collected in the NMS randomised controlled trial
(RCT). The patient-level data are not publicly available,
but the results of the trials have been presented in several
publications. The trial results supporting the findings of this
analysis are available within the article and its electronic
supplementary material. (2) The six individual models use
RCT, observational data and estimation tools from multiple
sources, for which references are provided in the article. (3)
Cost data used in the model were obtained from referenced
publicly available sources. (4) The model was developed in
Data TreeAge and is not publicly available, but is available
from the authors upon request.
Acknowledgements This study was commissioned and financed by
the Department of Health. In addition, financial support was received
from the Comprehensive Local Research Networks (CLRNs) to allow
sites to receive service support costs as a result of participation in the
study. The CLRNs involved included Trent, South Yorkshire,
Leicester, Northamptonshire and Rutland (LNR) and the North
Central London Research Consortium. Assistance with operational-
ising the study was provided by the Primary Care Research Networks.
The study team expresses its gratitude to all of the study participants,
the patients, the pharmacists and pharmacy companies and GPs,
without whose participation this study would not have been possible.
The study was monitored and supported by the independent NMS
Evaluation Advisory Group (NEAG) chaired by Prof. Nick Mays,
LSHTM. The study design and delivery was assisted by Dr. Tracey
Thornley, Richard Harris, and Sara Garfield. Pharmacy recruitment
was assisted by Dr. Tracey Thornley, Richard Harris, Mimi Lau
(Numark), and Alistair Buxton (PSNC). Additional patient perspec-
tives and review were provided by Ember Vincent and Clancy Wil-
liams. The study delivery was supported by Angela Wu, Rory
Constable, Beatrice Odugbemi, Chris Macleod, Edward Lees-Man-
ning, Julia Graichen, Katharine Wells, Lina Bader, Linda van
Economic Evaluation of the New Medicine Service (NMS) 1251
Eikenhorst, Melanie Lynn, Oluwagbemileke Ojeleye, Stefanie Sick-
inger, Xiao-Jun Xu and Zoe Lim. Advice and support with data
analysis was provided by Dr. Sarah Armstrong, Dr. Sarah Rodgers,
Dr. Koen Putman, Dr. Anna Murphy and Dr. Amanj Baker. We would
like to thank the following researchers for providing data used in the
economic evaluation: Ramon Luengo-Fernandez, University
Research Lecturer, Health Economics Research Centre, University of
Oxford; Dr. Anna Murphy, Consultant Respiratory Pharmacist at
University Hospitals of Leicester NHS Trust; Luis Alberto Garcıa
Rodrıguez, Director, CEIFE—Centro Espanol de Investigacion Far-
macoepidemiologica Madrid, Spain; Kate Smolina, Unit of Health-
care Epidemiology and British Heart Foundation Health Promotion
Research Group, University of Oxford. Loraine Buck has been the
NMS study administrator and has contributed significantly to the
execution of all aspects of the research programme. Commissioned
assistance was provided by Alison Taylor (transcriber), Alphagraph-
ics—Peter Johnson (production of study diaries), Ambrow Ltd (study
website), Graham Watson (database design), Marita Smith (tran-
scriber), Kath’s Keying Services Limited (transcriber) Petrina Salema
(study logo design and web graphics). National data relating to NMS
service provision was provided by Health Information Exchange (to
March 2013) and by myhealthplace (from April 2013). The team are
grateful to Prof. Donald E. Morisky, Department of Community
Health Sciences, UCLA School of Public Health, for granting copy-
right permission to use the MMAS-8 adherence tool for this research.
The University of Nottingham acted as the study sponsor and
indemnifies the study. The team specifically wish to acknowledge the
advice and support of Paul Cartledge, Angela Shone, Samantha
Bateman and Kristy Angell.
Author contributions RAE designed and led the economic analysis,
led drafting of the manuscript, was study principal investigator and
contributed to the analysis of the RCT. LT designed and built the
economic models, including collection of input data on transition
probabilities, utilities and costs; carried out the economic analysis
(including method and estimation of overall cost effectiveness);
contributed to leading and design of the economic analysis; con-
tributed to the COPD model; and contributed to the analysis of the
RCT. GG designed and built the COPD model, including collection of
input data on transition probabilities, utilities and costs; contributed to
the economic analysis and carried out intervention and within-trial
costing; and contributed to the analysis of the RCT. MJB led the
delivery of the RCT including design of data collection tools and
oversight of data collection. AJA contributed to model design and
reviewed all models for clinical face validity. NB was involved in
intervention design and costing and informed and reviewed the eco-
nomic analysis for practice face validity. AL was involved in the
delivery of the RCT and informed and reviewed the economic anal-
ysis for practice face validity. RM led the statistical design and
analysis of the RCT and derived the estimates of effect for the eco-
nomic evaluation. AC provided patient and public input to the project
and interpretation of the economic evaluation. JW led the process
evaluation of NMS and informed and reviewed the economic analysis
for practice and policy relevance. All authors were involved in the
drafting of the manuscript. Prof. RE is the guarantor and affirms that
the manuscript is an honest, accurate and transparent account of the
study being reported; that no important aspects of the study have been
omitted; and that any discrepancies from the study as planned (and, if
relevant, registered) have been explained.
Compliance with Ethical Standards
Ethical approval This report is independent research commissioned
and funded by the Department of Health Policy Research Programme
(Grant no. PR-IC-0711-10010) (‘Understanding and Appraising the
New Medicines Service in the NHS in England’–PRP 029/0124). The
views expressed in this publication are those of the authors and not
necessarily those of the Department of Health. The RCT (Clini-
calTrials.gov Trial reference number NCT01635361; http://
clinicaltrials.gov/ct2/show/NCT01635361) had full ethical approval.
Conflict of interest Rachel A. Elliott, Lukasz Tanajewski, Georgios
Gkountouras, Anthony J. Avery, Nick Barber, Rajnikant Mehta,
Matthew J. Boyd, Asam Latif, Antony Chuter and Justin Waring have
completed the Unified Competing Interest form at http://www.icmje.
org/coi_disclosure.pdf (available on request from the corresponding
author) and declare no support from any organisation for the sub-
mitted work; no financial relationships with any organisations that
might have an interest in the submitted work in the previous 3 years;
and no other relationships or activities that could appear to have
influenced the submitted work.
Open Access This article is distributed under the terms of the
Creative Commons Attribution-NonCommercial 4.0 International
License (http://creativecommons.org/licenses/by-nc/4.0/), which per-
mits any noncommercial use, distribution, and reproduction in any
medium, provided you give appropriate credit to the original
author(s) and the source, provide a link to the Creative Commons
license, and indicate if changes were made.
References
1. Horne R, Barber N, Weinman J, Elliott RA, Morgan M, Cribb A.
Concordance, adherence and compliance in medicine taking: a
scoping exercise. Report for the National Co-ordinating Centre
for NHS Service Delivery and Organisation. London: R & D;
2006. http://www.netscc.ac.uk/hsdr/files/project/SDO_FR_08-
1412-076_V01.pdf. Accessed 10 June 2015.
2. Marsden E, Cubbin I, McAlavey A. An investigation into how
poor compliance traditionally associated with corticosteroid
therapy in asthma and chronic obstructive pulmonary disease can
be improved to enhance long-term management and patient care.
Int J Pharm Pract. 2009;17(S2):B55–6.
3. Llorca PM. Patient compliance in schizophrenia and the impact
on patient outcome. Psychiatr Res. 2008;161:235–47.
4. Cerveri I, Locatelli F, Zoia MC, Corsico A, Accordini S, Marco
R. International variations in asthma treatment compliance. Eur
Respir J. 1999;14:288–94.
5. Ho PM, Rumsfeld JS, Masoudi FA, McClure DL, Plomondon
ME, Steiner JF, et al. Effect of medication nonadherence on
hospitalization and mortality among patients with diabetes mel-
litus. Arch Intern Med. 2006;166(17):1836–41.
6. Ho PM, Spertus JA, Masoudi FA, Reid KJ, Peterson ED, Magid
DJ, et al. Impact of medication therapy discontinuation on mor-
tality after myocardial infarction. Arch Intern Med.
2006;166(17):1842–7.
7. Vestbo J, Anderson JA, Calverley PM, Celli B, Ferguson GT,
Jenkins C, et al. Adherence to inhaled therapy, mortality and
hospital admission in COPD. Thorax. 2009;64(11):939–43.
doi:10.1136/thx.2009.113662.
8. IMS Institute for Healthcare Informatics. Advancing the
responsible use of medicines: applying levers for change. USA:
Parsipanny; 2012.
9. Trueman P, LowsonK, BligheA,Meszaros A,Wright D, Glanville
J, et al. Evaluation of the scale, causes and costs ofwastemedicines.
YHEC/London School of Pharmacy: London; 2010. https://core.
ac.uk/download/pdf/111804.pdf. Accessed 10 June 2015.
1252 R. A. Elliott et al.

10. Barber N, Parsons J, Clifford S, Darracott R, Horne R. Patients’
problems with new medication for chronic conditions. Qual Saf
Health Care. 2004;13(3):172–5.
11. Ereshefsky L, Saragoussi D, Despiegel N, Hansen K, Francois C,
Maman K. The 6-month persistence on SSRIs and associated
economic burden. J Med Econ. 2010;13(3):527–36. doi:10.3111/
13696998.2010.511050.
12. Leventhal H, Cameron LD. Behavioral theories and the problem
of compliance. Patient Educ Couns. 1987;10:117–38.
13. Clifford S, Barber N, Elliott R, Hartley E, Horne R. Patient-
centred advice is effective in improving adherence to medicines.
Pharm World Sci. 2006;28(3):165–70.
14. Elliott RA, Clifford S, Barber N, Hartley E, Horne R. The cost
effectiveness of a pharmacy advisory service to improve adher-
ence to medicines. Pharm World Sci. 2008;30:17–23.
15. Department of Health. Pharmacy in England: Building on
strengths—delivering the future http://www.dh.gov.uk/en/
Publicationsandstatistics/Publications/PublicationsPolicyAndGui-
dance/DH_083815. 2008. Accessed 12 Aug 2011.
16. Pharmaceutical Services Negotiating Committee. New Medicines
Service. 2011. http://www.psnc.org.uk/pages/nms.html. Accessed
12 Aug 2011.
17. NHS Business Services Authority. Complete new medicines
service (NMS) data. London. 2014. http://psnc.org.uk/services-
commissioning/advanced-services/nms/service-evaluation-nms-
statistics-andpharmoutcomes-data/. Accessed 10 June 2015.
18. Husereau D, Drummond M, Petrou S, Carswell C, Moher D,
Greenberg D, et al. Consolidated health economic evaluation
reporting standards (CHEERS) statement. Pharmacoeconomics.
2013;31(5):361–7. doi:10.1007/s40273-013-0032-y.
19. Boyd M, Waring J, Barber N, Mehta R, Chuter A, Avery A, et al.
Protocol for the New Medicine Service Study: a randomized
controlled trial and economic evaluation with qualitative
appraisal comparing the effectiveness and cost effectiveness of
the New Medicine Service in community pharmacies in England.
Trials. 2013;14(1):411.
20. Elliott RA, Boyd M, Waring J, Barber ND, Mehta R, Chuter A
et al. Understanding and Appraising the New Medicines Service
in the NHS in England (029/0124)’ A randomised controlled trial
and economic evaluation with qualitative appraisal comparing the
effectiveness and cost effectiveness of the New Medicine Service
in community pharmacies in England. University of Nottingham.
2014.
21. Elliott RA, Boyd MJ, Salema N-E, Davies J, Barber N, Mehta
RL, et al. Supporting adherence for people starting a new med-
ication for a long-term condition through community pharmacies:
a pragmatic randomised controlled trial of the New Medicine
Service. BMJ Qual Saf. 2015;. doi:10.1136/bmjqs-2015-004400.
22. Elliott RA, Putman KD, Franklin M, Annemans L, Verhaeghe N,
Eden M, et al. Cost effectiveness of a pharmacist-led information
technology intervention for reducing rates of clinically important
errors in medicines management in general practices (PINCER).
Pharmacoeconomics. 2014;. doi:10.1007/s40273-014-0148-8.
23. Avery AJ, Rodgers S, Cantrill JA, Armstrong S, Cresswell K,
Eden M, et al. A pharmacist-led information technology inter-
vention for medication errors (PINCER): a multicentre, cluster
randomised, controlled trial and cost-effectiveness analysis.
Lancet. 2012;379:1310–9. doi:10.1016/S0140-6736(11)61817-5.
24. Pharmaceutical Services Negotiating Committee, NHS Employ-
ers. NHS community pharmacy contractual framework 2011/12
service developments—latest information. August 2011.
25. Garfield S, Clifford S, Eliasson L, Barber N, Willson A.
Suitability of measures of self-reported medication adherence for
routine clinical use: a systematic review. BMC Med Res Meth-
odol. 2011;11:149. doi:10.1186/1471-2288-11-149.
26. Morisky DE, Ang A, Krousel-Wood M, Ward HJ. Predictive
validity of a medication adherence measure in an outpatient
setting. J Clin Hypertens. 2008;10:348–54.
27. National Health Service Executive. NHS reference costs
2012–13. 2013. https://www.gov.uk/government/publications/
nhs-reference-costs-2012-to-2013. Accessed 20 June 2014.
28. Personal Social Services Research Unit (PSSRU). Unit Costs of
Health and Social Care. 2012. http://www.pssru.ac.uk/project-
pages/unit-costs/2012/. Accessed 20 June 2014.
29. Briggs A, Gray A. The distribution of health care costs and their
statistical analysis for economic evaluation. J Health Serv Res
Policy. 1998;3(4):233–45.
30. Lindgren P, Buxton M, Kahan T, Poulter NR, Br DahlAf, Sever
PS, et al. The lifetime cost effectiveness of amlodipine-based
therapy plus atorvastatin compared with atenolol plus atorvas-
tatin, amlodipine-based therapy alone and atenolol-based therapy
alone: results from ASCOT1. Pharmacoeconomics.
2009;27(3):221–30.
31. Wing LMH, Reid CM, Ryan P, Beilin LJ, Brown MA, Jennings
GLR, et al. A comparison of outcomes with angiotensin-convert-
ing—enzyme inhibitors and diuretics for hypertension in the elderly.
N Engl J Med. 2003;348(7):583–92. doi:10.1056/NEJMoa021716.
32. Steuten L, Palmer S, Vrijhoef B, Van Merode F, Spreeuwenberg
C, Severens H. Cost-utility of a disease management program for
patients with asthma. Int J Technol Assess Health Care.
2007;23(2):184–91.
33. Price D, Asukai Y, Ananthapavan J, Malcolm B, Radwan A,
Keyzor I. A UK-based cost-utility analysis of indacaterol, a once-
daily maintenance bronchodilator for patients with COPD, using
real world evidence on resource use. Appl Health Econ Health
Policy. 2013;11(3):259–74. doi:10.1007/s40258-013-0021-5.
34. Clarke PM, Gray AM, Briggs A, Farmer AJ, Fenn P, Stevens RJ,
et al. A model to estimate the lifetime health outcomes of patients
with Type 2 diabetes: the United Kingdom prospective diabetes
study (UKPDS) outcomes Model (UKPDS no. 68). Diabetologia.
2004;47(10):1747–59. doi:10.1007/s00125-004-1527-z.
35. Rodrıguez LAG, Cea-Soriano L, Martın-Merino E, Johansson S.
Discontinuation of low dose aspirin and risk of myocardial
infarction: case-control study in UK primary care. BMJ. 2011;.
doi:10.1136/bmj.d4094.
36. Garcia Rodriguez LA, Cea Soriano L, Hill C, Johansson S.
Increased risk of stroke after discontinuation of acetylsalicylic
acid: A UK primary care study. Neurology. 2011;76(8):740–6.
37. Dahlof B, Sever PS, Poulter NR, Wedel H, Beevers DG, Caulfield
M, et al. Prevention of cardiovascular events with an antihyper-
tensive regimen of amlodipine adding perindopril as required
versus atenolol adding bendroflumethiazide as required, in the
Anglo-Scandinavian Cardiac Outcomes Trial-Blood Pressure
Lowering Arm (ASCOT-BPLA): a multicentre randomised con-
trolled trial. Lancet. 2005;366(9489):895–906. doi:10.1016/
S0140-6736(05)67185-1.
38. Kavuru M, Melamed J, Gross G, Laforce C, House K, Prillaman
B, et al. Salmeterol and fluticasone propionate combined in a new
powder inhalation device for the treatment of asthma: a ran-
domized, double-blind, placebo-controlled trial. J Allergy Clin
Immunol. 2000;105(6 Pt 1):1108–16.
39. UK Prospective Diabetes Study. UKPDS) Group. Effect of
intensive blood-glucose control with metformin on complications
in overweight patients with type 2 diabetes (UKPDS 34. Lancet.
1998;352(9131):854–65.
40. Oostenbrink JB, Rutten-van Molken MPMH, Monz BU,
FitzGerald JM. Probabilistic markov model to assess the cost-
effectiveness of bronchodilator therapy in COPD patients in
different countries. Value Health. 2005;8(1):32–46. doi:10.1111/
j.1524-4733.2005.03086.x.
Economic Evaluation of the New Medicine Service (NMS) 1253

41. Mazzaglia G, Ambrosioni E, Alacqua M, Filippi A, Sessa E,
Immordino V, et al. Adherence to antihypertensive medications
and cardiovascular morbidity among newly diagnosed hyperten-
sive patients. Circulation. 2009;120(16):1598–605. doi:10.1161/
circulationaha.108.830299.
42. Nelson R, Reid CM, Ryan P, Willson K, Yelland L. Self-reported
adherence with medication and cardiovascular disease outcomes
in the Second Australian National Blood Pressure Study
(ANBP2). Med J Aust. 2006;185:487–9.
43. Krapek K, King K, Warren SS, George KG, Caputo DA, Mihe-
lich K, et al. Medication adherence and associated hemoglobin
A1c in type 2 diabetes. Ann Pharmacother. 2004;38(9):1357–62.
doi:10.1345/aph.1D612.
44. Quality Metric. The asthma control test. GlaxoSmithKline. 2012.
http://www.asthmacontroltest.com/. Accessed 15 Mar 2012.
45. Murphy AL. The community pharmacy SIMPLE approach to
asthma management. Regional Innovation Fund (RIF) Project
Evaluation Report. 2012.
46. Vestbo J. The TORCH (towards a revolution in COPD health)
survival study protocol. Eur Respir J. 2004;24(2):206–10.
47. Ara R, Brazier J. Health related quality of life by age, gender and
history of cardiovascular disease: results from the Health Survey
for England. Discussion Paper: Universities of York, Sheffield,
Leeds. 2009.
48. Juniper E, Guyatt G, Ferrie P, King D. Development and vali-
dation of a questionnaire to measure asthma control. Eur Respir J.
1999;14(4):902–7.
49. Bateman ED, Bousquet J, Keech ML, Busse WW, Clark TJH,
Pedersen SE, et al. The correlation between asthma control and
health status: the GOAL study. Eur Respir J. 2007;29(1):56–62.
doi:10.1183/09031936.00128505.
50. Rutten-van Molken MMH, Hoogendoorn M, Lamers L. Holistic
preferences for 1-year health profiles describing fluctuations in
health. Pharmacoeconomics. 2009;27(6):465–77. doi:10.2165/
00019053-200927060-00003.
51. Fenwick E, Byford S. A guide to cost-effectiveness acceptability
curves. Br J Psychiatry. 2005;187(2):106–8. doi:10.1192/bjp.187.
2.106.
52. Fenwick E, Claxton K, Sculpher MJ. Representing uncertainty:
the role of cost effectiveness acceptability curves. Health Econ.
2001;10:779–87.
53. Vemer P, Corro Ramos I, van Voorn GA, Al MJ, Feenstra TL.
AdViSHE: a validation-assessment tool of health-economic
models for decision makers and model users. Pharmacoeco-
nomics. 2016;34(4):349–61. doi:10.1007/s40273-015-0327-2.
54. Montgomery AA, Fahey T, Ben-Shlomo Y, Harding J. The
influence of absolute cardiovascular risk, patient utilities, and
costs on the decision to treat hypertension: a Markov decision
analysis. J Hypertens. 2003;21(9):1753–9. doi:10.1097/01.hjh.
0000084708.87421.d1.
55. Gandjour A, Stock S. A national hypertension treatment program
in Germany and its estimated impact on costs, life expectancy,
and cost-effectiveness. Health Policy. 2007;83(2–3):257–67.
doi:10.1016/j.healthpol.2007.01.003.
56. Nordmann AJ, Krahn M, Logan AG, Naglie G, Detsky AS. The
cost effectiveness of ACE inhibitors as first-line antihypertensive
therapy. Pharmacoeconomics. 2003;21(8):573–85.
57. Lamotte M, Annemans L, Evers T, Kubin M. A multi-country
economic evaluation of low-dose aspirin in the primary preven-
tion of cardiovascular disease. Pharmacoeconomics.
2006;24(2):155–69.
58. Nieuwlaat R, Wilczynski N, Navarro T, Hobson N, Jeffery R,
Keepanasseril A, et al. Interventions for enhancing medication
adherence. Cochrane Database Syst Rev. 2014. doi:10.1002/
14651858.CD000011.pub4.
59. Elliott RA, Barber N, Horne R. Cost-effectiveness of adherence-
enhancing interventions: a quality assessment of the evidence.
Ann Pharmacother. 2005;39:508–15.
60. National Institute for Health and Clinical Excellence. Medicines
adherence: involving patients in decisions about prescribed
medicines and supporting adherence. Clinical Guidelines: CG76.
2009.
61. Avery AJ, Rodgers S, Cantrill JA, Armstrong S, Cresswell K,
Eden M, et al. A pharmacist-led information technology inter-
vention for medication errors (PINCER): a multicentre, cluster
randomised, controlled trial and cost-effectiveness analysis.
Lancet. 2012;379(9823):1310–9.
62. Klopotowska JE, Kuiper R, van Kan HJ, de Pont AC, Dijkgraaf
MG, Lie AHL, et al. On-ward participation of a hospital phar-
macist in a Dutch intensive care unit reduces prescribing errors
and related patient harm: an intervention study. Crit Care (Lon-
don, England). 2010;14(5):R174.
63. Denneboom W, Dautzenberg MGH, Grol R, De Smet PAGM.
Treatment reviews of older people on polypharmacy in primary
care: Cluster controlled trial comparing two approaches. Br J Gen
Pract. 2007;57(542):723–31.
64. Karnon J, Campbell F, Czoski-Murray C. Model-based cost-ef-
fectiveness analysis of interventions aimed at preventing medi-
cation error at hospital admission (medicines reconciliation).
J Eval Clin Pract. 2009;15:299–306.
65. Clifford S. Evaluation of a patient-centred, pharmacist-delivered
intervention to improve patients’ adherence to medication. Psy-
chol Health. 2005;20:48–9.
66. Murri R, Ammassari A, Gallicano K, Luca AD, Cingolani A,
Jacobson D, et al. Patient-reported nonadherence to HAART is
related to protease inhibitor levels. J Acquir Immune Defic Syndr.
2000;24(2):123–8.
67. Butler JA, Peveler RC, Roderick P, Horne R, Mason JC. Mea-
suring compliance with drug regimens after renal transplantation:comparison of self-report and clinician rating with electronic
monitoring. Transplantation. 2004;77(5):786–9.
68. Lehmann A, Aslani P, Ahmed R, Celio J, Gauchet A, Bedouch P,
et al. Assessing medication adherence: options to consider. Int J
Clin Pharm. 2014;36(1):55–69. doi:10.1007/s11096-013-9865-x.
69. Caro JJ, Salas M, Speckman JL, Raggio G, Jackson JD. Persis-
tence with treatment for hypertension in actual practice. Can Med
Assoc J. 1999;160(1):31–7.
70. Vrijens B, Vincze G, Kristanto P, Urquhart J, Burnier M.
Adherence to prescribed antihypertensive drug treatments: lon-
gitudinal study of electronically compiled dosing histories. BMJ.
2008;336(7653):1114–7. doi:10.1136/bmj.39553.670231.25.
71. Morgan SG, Yan L. Persistence with hypertension treatment
among community-dwelling BC seniors. Can J Clin Pharmacol.
2004;11(2):e267–73.
72. McCabe C, Claxton K, Culyer AJ. The NICE cost-effectiveness
threshold: what it is and what that means. Pharmacoeconomics.
2008;26(9):733–44.
73. Office for National Statistics. Mortality rates UK 2009–2010.
2012. http://www.ons.gov.uk/ons/taxonomy/search/index.
html?nscl=Life?Tables&nscl-orig=Life?Tables&content-type=
Dataset&content-type=Reference?table&sortDirection=DES
CENDING&sortBy=pubdate. Accessed 10 June 2015.
74. Smolina K, Wright FL, Rayner M, Goldacre MJ. Long-term
survival and recurrence after acute myocardial infarction in
England, 2004 to 2010. Circ Cardiovasc Qual Outcomes. 2012.
doi:10.1161/circoutcomes.111.964700.
75. Luengo-Fernandez R, Gray AM. Rothwell PM, null. A popula-
tion-based study of hospital care costs during 5 years after tran-
sient ischemic attack and stroke. Stroke J Cereb Circ.
2012;43(12):3343–51.
1254 R. A. Elliott et al.

76. Price MJ, Briggs AH. Development of an economic model to
assess the cost effectiveness of asthma management strategies.
Pharmacoeconomics. 2002;20(3):183–94.
77. Rutten-van Molken MMH, Oostenbrink J, Miravitlles M, Monz
B. Modelling the 5-year cost effectiveness of tiotropium, sal-
meterol and ipratropium for the treatment of chronic obstructive
pulmonary disease in Spain. Eur J Health Econ.
2007;8(2):123–35. doi:10.1007/s10198-007-0039-4.
78. Pharmaceutical Services Negotiating Committee. Evaluation of
Evidence Provided by PharmOutcomes New Medicines Service
Data. 2013.
79. British Medical Association, Royal Pharmaceutical Society of
Great Britain. British National Formulary 66th Edition. Septem-
ber (66) ed. London: BMJ Group and RPS Publishing. 2013.
80. Lindgren P, Buxton M, Kahan T, Poulter NR, Dahlof B, Sever
PS, et al. Economic evaluation of ASCOT-BPLA: antihyperten-
sive treatment with an amlodipine-based regimen is cost effective
compared with an atenolol-based regimen. Heart. 2008;94(2):e4.
doi:10.1136/hrt.2007.127217.
81. Department of Health. HSHC 2013. Health service cost index,
annual summaries. 2013. http://www.info.doh.gov.uk/doh/
finman.nsf/Newsletters?OpenView&Start=13.1&ExpandView.
Accessed 10 June 2015.
82. Briggs AH, Bousquet J, Wallace MV, Busse WW, Clark TJH,
Pedersen SE, et al. Cost-effectiveness of asthma control: an
economic appraisal of the GOAL study. Allergy.
2006;61(5):531–6. doi:10.1111/j.1398-9995.2006.01038.x.
83. Lloyd A, Price D, Brown R. The impact of asthma exacerbations
on health-related quality of life in moderate to severe asthma
patients in the UK. Prim Care Respir J. 2007;16(1):22–7.
84. Rutten-van Molken MPMH, Oostenbrink JB, Tashkin DP, Bur-
khart D, Monz BU. Does quality of life of copd patients as
measured by the generic euroqol five-dimension questionnaire
differentiate between copd severity stages? Chest.
2006;130(4):1117–28. doi:10.1378/chest.130.4.1117.
85. Dolan P, Gudex C, Kind P, Williams A. A social tariff for
EuroQol: results from a UK general population survey: Centre for
Health Economics, University of York; 1995.
86. Hertel N, Kotchie RW, Samyshkin Y, Radford M, Humphreys S,
Jameson K. Cost-effectiveness of available treatment options for
patients suffering from severe COPD in the UK: a fully incre-
mental analysis. Int J Chronic Obstr Pulm Dis. 2012;7:183–99.
doi:10.2147/copd.s29820.
87. Hettle R, Wouters H, Ayres J, Gani R, Kelly S, Lion M, et al.
Cost-utility analysis of tiotropium versus usual care in patients
with COPD in the UK and Belgium. Respir Med.
2012;106(12):1722–33. doi:10.1016/j.rmed.2012.09.006.
88. Diabetes Trial Unit. UKPDS Outcomes Model. University of
Oxford. 2013. http://www.dtu.ox.ac.uk/outcomesmodel/. Acces-
sed 10 June 2015.
89. Clarke P, Gray A, Legood R, Briggs A, Holman R. The impact of
diabetes-related complications on healthcare costs: Results from
the United Kingdom Prospective Diabetes Study (UKPDS Study
No. 65). Diabet Med. 2003;20(6):442–50. doi:10.1046/j.1464-
5491.2003.00972.x.
90. Pharmaceutical Services Negotiating Committee. NMS statistics.
http://psnc.org.uk/funding-and-statistics/nhs-statistics/nms-statistics/.
Accessed 21 Jan 2017.
Economic Evaluation of the New Medicine Service (NMS) 1255