Cost-Effectiveness of a Government-Supported Strategy to ... · Cost-effectiveness ratio, evaluated...
61
Confidential: For Review Only Cost-Effectiveness of a Government-Supported Strategy to Decrease Sodium Intake: A Global Analysis across 183 Nations Journal: BMJ Manuscript ID BMJ.2015.027854.R3 Article Type: Research BMJ Journal: BMJ Date Submitted by the Author: 01-Aug-2016 Complete List of Authors: Webb, Michael; Stanford University, Department of Economics Fahimi, Saman; Harvard School of Public Health, Epidemiology Singh, Gitanjali; Harvard University School of Public Health, Nutrition Khatibzadeh, Shahab; Harvard School of Public Health, Epidemiology Micha, Renata; Harvard University School of Public Health, Nutrition Powles, John; Institute of Public Health, Primary Care Mozaffarian, Dariush; Friedman School of Nutrition Science and Policy, Tufts University, Keywords: Cardiovascular disease, Diet, Salt, Intervention, Epidemiology https://mc.manuscriptcentral.com/bmj BMJ
Transcript of Cost-Effectiveness of a Government-Supported Strategy to ... · Cost-effectiveness ratio, evaluated...

Confidential: For Review O
nly
Cost-Effectiveness of a Government-Supported Strategy to
Decrease Sodium Intake: A Global Analysis across 183 Nations
Journal: BMJ
Manuscript ID BMJ.2015.027854.R3
Article Type: Research
BMJ Journal: BMJ
Date Submitted by the Author: 01-Aug-2016
Complete List of Authors: Webb, Michael; Stanford University, Department of Economics Fahimi, Saman; Harvard School of Public Health, Epidemiology Singh, Gitanjali; Harvard University School of Public Health, Nutrition Khatibzadeh, Shahab; Harvard School of Public Health, Epidemiology Micha, Renata; Harvard University School of Public Health, Nutrition Powles, John; Institute of Public Health, Primary Care Mozaffarian, Dariush; Friedman School of Nutrition Science and Policy, Tufts University,
Keywords: Cardiovascular disease, Diet, Salt, Intervention, Epidemiology
https://mc.manuscriptcentral.com/bmj
BMJ

Confidential: For Review O
nly
Cost-Effectiveness of a Government-Supported Strategy to Decrease Sodium Intake: A Global
Analysis across 183 Nations
Michael Webb, doctoral candidate1; Saman Fahimi2; Gitanjali M. Singh, research assistant professor3;
Shahab Khatibzadeh, postdoctoral fellow2; Renata Micha, research assistant professor3; John Powles,
honorary senior visiting fellow4; Dariush Mozaffarian, dean3
1 Stanford University, 579 Serra Mall, Stanford, CA 94305, USA, and Institute for Fiscal Studies,
London, UK
2 Harvard T.H. Chan School of Public Health, 677 Huntington Ave, Boston, MA 02115, USA
3 Tufts Friedman School of Nutrition Science & Policy, 150 Harrison Ave, Boston, MA 02111, USA
4 Cambridge Institute of Public Health, Forvie Site, Robinson Way, Cambridge, CB2 0SR, UK
Correspondence: D. Mozaffarian, [email protected]
Page 1 of 60
https://mc.manuscriptcentral.com/bmj
BMJ
123456789101112131415161718192021222324252627282930313233343536373839404142434445464748495051525354555657585960
Confidential: For Review O
nly
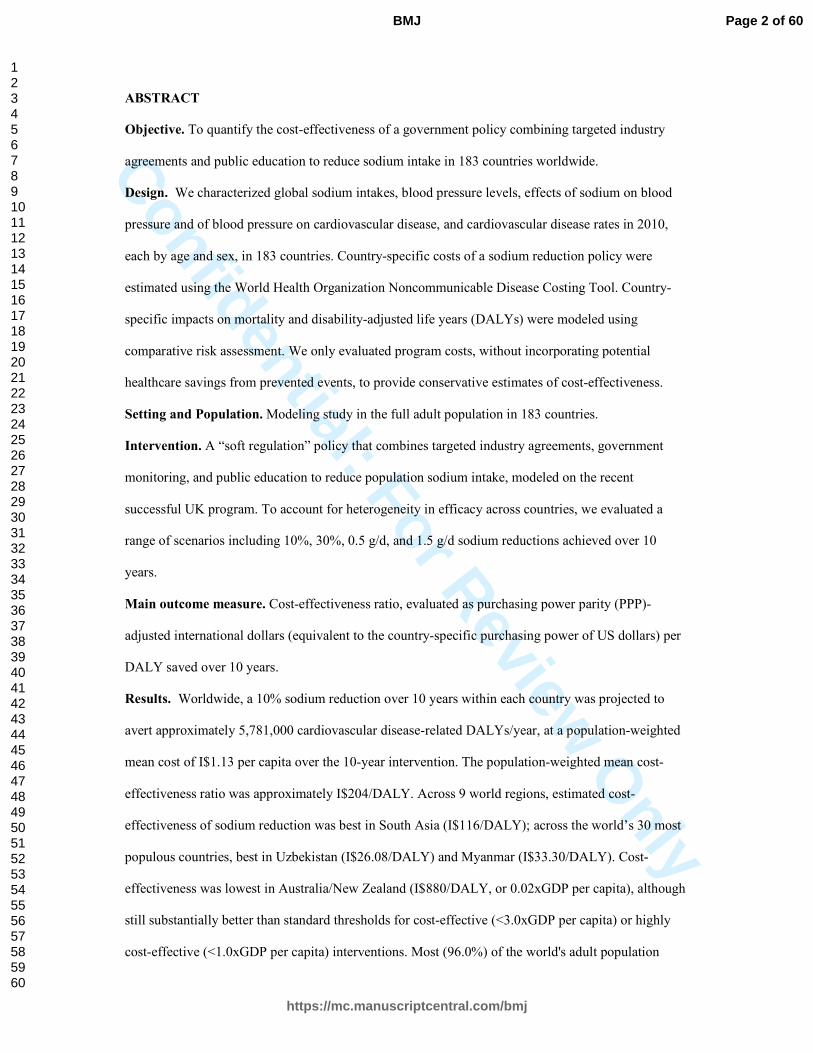
ABSTRACT
Objective. To quantify the cost-effectiveness of a government policy combining targeted industry
agreements and public education to reduce sodium intake in 183 countries worldwide.
Design. We characterized global sodium intakes, blood pressure levels, effects of sodium on blood
pressure and of blood pressure on cardiovascular disease, and cardiovascular disease rates in 2010,
each by age and sex, in 183 countries. Country-specific costs of a sodium reduction policy were
estimated using the World Health Organization Noncommunicable Disease Costing Tool. Country-
specific impacts on mortality and disability-adjusted life years (DALYs) were modeled using
comparative risk assessment. We only evaluated program costs, without incorporating potential
healthcare savings from prevented events, to provide conservative estimates of cost-effectiveness.
Setting and Population. Modeling study in the full adult population in 183 countries.
Intervention. A “soft regulation” policy that combines targeted industry agreements, government
monitoring, and public education to reduce population sodium intake, modeled on the recent
successful UK program. To account for heterogeneity in efficacy across countries, we evaluated a
range of scenarios including 10%, 30%, 0.5 g/d, and 1.5 g/d sodium reductions achieved over 10
years.
Main outcome measure. Cost-effectiveness ratio, evaluated as purchasing power parity (PPP)-
adjusted international dollars (equivalent to the country-specific purchasing power of US dollars) per
DALY saved over 10 years.
Results. Worldwide, a 10% sodium reduction over 10 years within each country was projected to
avert approximately 5,781,000 cardiovascular disease-related DALYs/year, at a population-weighted
mean cost of I$1.13 per capita over the 10-year intervention. The population-weighted mean cost-
effectiveness ratio was approximately I$204/DALY. Across 9 world regions, estimated cost-
effectiveness of sodium reduction was best in South Asia (I$116/DALY); across the world’s 30 most
populous countries, best in Uzbekistan (I$26.08/DALY) and Myanmar (I$33.30/DALY). Cost-
effectiveness was lowest in Australia/New Zealand (I$880/DALY, or 0.02xGDP per capita), although
still substantially better than standard thresholds for cost-effective (<3.0xGDP per capita) or highly
cost-effective (<1.0xGDP per capita) interventions. Most (96.0%) of the world's adult population
Page 2 of 60
https://mc.manuscriptcentral.com/bmj
BMJ
123456789101112131415161718192021222324252627282930313233343536373839404142434445464748495051525354555657585960

Confidential: For Review O
nly
lived in countries in which this intervention had a cost-effectiveness ratio <0.1xGDP per capita, and
99.6% in countries with a cost-effectiveness ratio <1.0xGDP per capita.
Conclusion. A government “soft regulation” strategy combining targeted industry agreements and
public education to reduce dietary sodium is projected to be highly cost-effective worldwide, even
without accounting for potential healthcare savings.
Funding: National Institutes of Health.
Page 3 of 60
https://mc.manuscriptcentral.com/bmj
BMJ
123456789101112131415161718192021222324252627282930313233343536373839404142434445464748495051525354555657585960

Confidential: For Review O
nly
INTRODUCTION
Excessive sodium consumption is common and linked to cardiovascular burdens in most
countries. 181 of 187 countries, representing 99.2% of the global adult population, have mean sodium
intakes exceeding the World Health Organization (WHO) recommended maximum of 2 g/d.[1]
Worldwide, an estimated 1,648,000 annual deaths from cardiovascular diseases were attributable to
excess dietary sodium in 2010.[2] Accordingly, the 2013 United Nations’ Global Action Plan for the
Prevention and Control of Noncommunicable Diseases has prioritized sodium reduction as one of 9
key targets for all member nations in 2013-2020.[3]
A potential barrier for implementation of this recommendation is cost. Many countries have
limited resources for health-related interventions, requiring careful assessment of their costs and cost-
effectiveness. While prior studies have estimated sodium reduction policies to be highly cost-
effective, even cost-saving, the potential cost-effectiveness of such strategies has been analyzed for
only a handful of nations and regions, mostly focused on high-income nations, and in ways that are
not generally comparable.[4-13] To address this key gap in knowledge, we assessed the cost-
effectiveness of sodium reduction strategies in 183 nations, based on the most up-to-date available
data on age- and sex-specific sodium intakes, blood pressure levels, and cardiovascular disease
burdens worldwide, the dose-response effects of sodium on blood pressure and of blood pressure on
cardiovascular disease, and nation-specific costs for each component of the intervention. Together,
these allowed us to model and estimate, using comparable and consistent methods, the cost-
effectiveness of sodium reduction strategies for every country.
Page 4 of 60
https://mc.manuscriptcentral.com/bmj
BMJ
123456789101112131415161718192021222324252627282930313233343536373839404142434445464748495051525354555657585960
Confidential: For Review O
nly
METHODS
Sodium reduction intervention
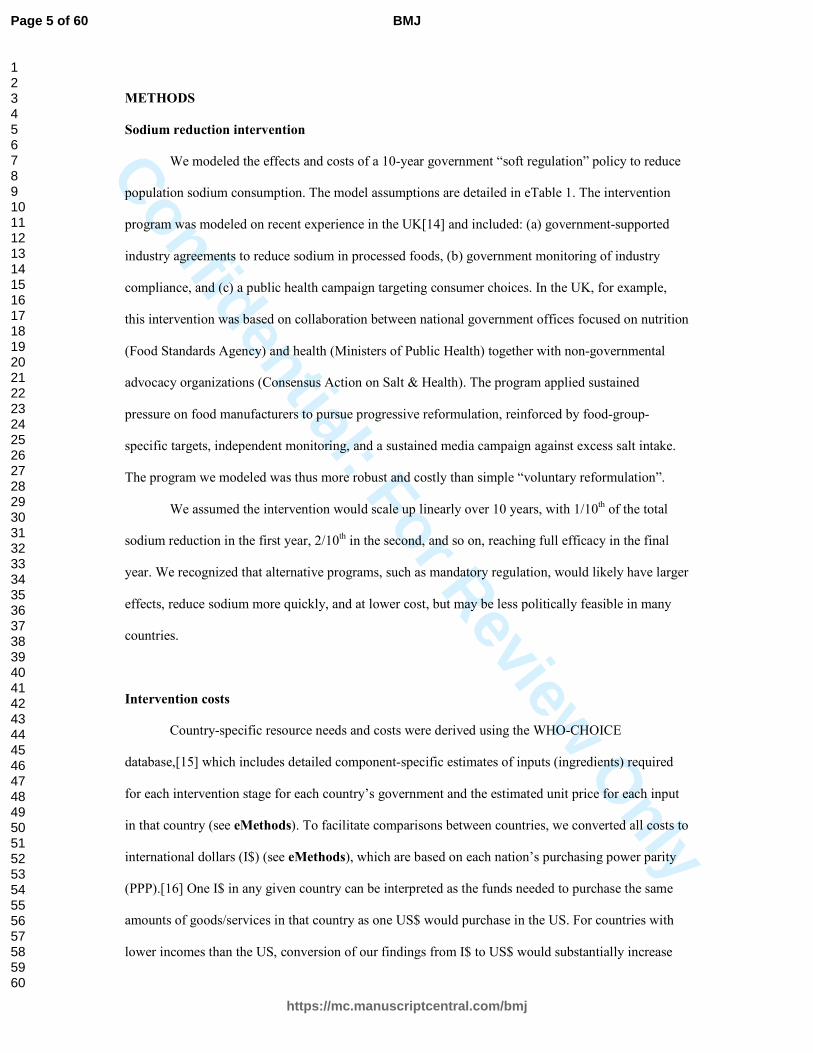
We modeled the effects and costs of a 10-year government “soft regulation” policy to reduce
population sodium consumption. The model assumptions are detailed in eTable 1. The intervention
program was modeled on recent experience in the UK[14] and included: (a) government-supported
industry agreements to reduce sodium in processed foods, (b) government monitoring of industry
compliance, and (c) a public health campaign targeting consumer choices. In the UK, for example,
this intervention was based on collaboration between national government offices focused on nutrition
(Food Standards Agency) and health (Ministers of Public Health) together with non-governmental
advocacy organizations (Consensus Action on Salt & Health). The program applied sustained
pressure on food manufacturers to pursue progressive reformulation, reinforced by food-group-
specific targets, independent monitoring, and a sustained media campaign against excess salt intake.
The program we modeled was thus more robust and costly than simple “voluntary reformulation”.
We assumed the intervention would scale up linearly over 10 years, with 1/10th of the total
sodium reduction in the first year, 2/10th in the second, and so on, reaching full efficacy in the final
year. We recognized that alternative programs, such as mandatory regulation, would likely have larger
effects, reduce sodium more quickly, and at lower cost, but may be less politically feasible in many
countries.
Intervention costs
Country-specific resource needs and costs were derived using the WHO-CHOICE
database,[15] which includes detailed component-specific estimates of inputs (ingredients) required
for each intervention stage for each country’s government and the estimated unit price for each input
in that country (see eMethods). To facilitate comparisons between countries, we converted all costs to
international dollars (I$) (see eMethods), which are based on each nation’s purchasing power parity
(PPP).[16] One I$ in any given country can be interpreted as the funds needed to purchase the same
amounts of goods/services in that country as one US$ would purchase in the US. For countries with
lower incomes than the US, conversion of our findings from I$ to US$ would substantially increase
Page 5 of 60
https://mc.manuscriptcentral.com/bmj
BMJ
123456789101112131415161718192021222324252627282930313233343536373839404142434445464748495051525354555657585960

Confidential: For Review O
nly
the apparent cost-effectiveness (i.e., the cost in US$ per DALY saved would be much lower).We
summed costs by year to calculate the total cost of the 10-year intervention for each country, with 3%
annual discounting.
In contrast to recent US models,[9 10] we did not include estimated healthcare savings from
prevented cardiovascular disease events because (a) such savings could, in theory, be partly offset by
new downstream health events resulting from enhanced survival[17 18] and (b) comparable
healthcare costing data is only available for a minority of countries globally. Because including such
cost savings would be optimal according to many cost-effectiveness guidelines, our results for overall
cost-effectiveness should be considered a conservative estimate.
Heterogeneity in intervention costs and effectiveness
While the WHO costing framework already accounted for some sources of variation by
country in terms of resources required and nation-specific costs, we recognized that details of
planning, development, and implementation might further vary from country to country beyond what
is captured by the costing tool. We also recognized that achieved effectiveness would vary from
country to country. Our base model assumed an average cost of this framework (already adjusted for
in-country differences in resource use and costs, according to the WHO costing tool), and an average
effectiveness. To understand the robustness of our findings to these assumptions, we tested widely
varying costs – including variations in resource use and cost of between 0.25 and 5-fold the base –
and varying intervention effectiveness – including 10% and 30% proportional reductions and 0.5 g/d
and 1.5 g/d absolute reductions in sodium intake over 10 years. Plausible intervention effectiveness
was informed by experiences in the UK, which achieved a 14.7% (0.6 g/d) reduction in population
sodium intake over 10 years,[19] and Turkey, which reported a more rapid 16% (1.2 g/d) reduction
over 4 years.[20] Together, these findings provided a broad range of possible scenarios against which
to evaluate the cost-effectiveness of the intervention.
Intervention impact on disability-adjusted life years (DALYs)
Page 6 of 60
https://mc.manuscriptcentral.com/bmj
BMJ
123456789101112131415161718192021222324252627282930313233343536373839404142434445464748495051525354555657585960

Confidential: For Review O
nly
Using data on population demographics, sodium consumption, blood pressure levels, and
rates of cardiovascular disease, each in 26 strata by age and sex within each country,[2] we estimated
the number of disability-adjusted life years (DALYs) that would be averted by the intervention in
each country for each year between 2011 and 2020. Risk reduction in each age-sex-country stratum
was calculated from the effect of sodium reduction on systolic blood pressure, including variation in
this effect by age, race, and hypertensive status; and the effect of blood pressure reduction on
cardiovascular disease, including variation in this effect by age.[2] The final comparative risk
assessment model incorporated each of these sources of heterogeneity, as well as their uncertainty.
Stratum-specific effects, accounting for underlying demographics and baseline cardiovascular disease
rates, were summed to derive national (or regional) effects. See eMethods for details on these inputs
and their modeling.
While some prior observational studies suggest a J-shaped relation between sodium intake
and cardiovascular disease,[21] the potential biases of sodium assessment in observational studies are
appreciated (see eMethods).[22] In extended follow-up of sodium reduction trials that overcame
many of these limitations, linear risk reductions were seen, including to <2300 mg/d.[23] We
recognized that while the precise optimal level remains controversial, every major national and
international organization that has reviewed all the evidence has concluded that high sodium increases
cardiovascular disease risk, and that lowering sodium reduces such risk, with optimal identified
intakes ranging from <1200 mg/d to <2400 mg/d.[2] We used an optimal intake of 2000 mg/d (WHO)
for our main analysis. For any sodium reductions below this level, we modeled neither additional
benefit nor risk, consistent with recent Institute of Medicine conclusions.[24] In sensitivity analyses,
we also evaluated lower (1000 mg/d) and higher (3000 mg/d) thresholds for optimal intake.
Our modeling further utilized known strengths of blood pressure as “an exemplar surrogate
endpoint for cardiovascular mortality and morbidity.”[25] Prospective cohort studies suggest log-
linear associations between systolic blood pressure and cardiovascular disease events, down to ~110
mm Hg;[26] and randomized controlled trials indicate that benefits of blood pressure-lowering
interventions are largely proportional to the magnitude of blood pressure reduction, rather than the
specific intervention, with similar proportional reductions in cardiovascular disease events down to
Page 7 of 60
https://mc.manuscriptcentral.com/bmj
BMJ
123456789101112131415161718192021222324252627282930313233343536373839404142434445464748495051525354555657585960
Confidential: For Review O
nly
starting blood pressures of ~110 mm Hg.[26-28] In our model, we assumed a log-linear dose-response
between blood pressure and cardiovascular disease until a systolic blood pressure level of 115 mm
Hg, after which we assumed no further lowering of risk. Given the relatively rapid reductions in
cardiovascular disease events in randomized trials of blood pressure-lowering therapies, and the
prolonged period of our intervention (10 years), we did not model any lag and assumed concurrent
gradual benefits in both blood pressure reduction and cardiovascular disease.
Cost-effectiveness ratios
To calculate the cost-effectiveness ratio for each country, we divided the total effect on
DALYs by the total cost of the intervention over 10 years. We compared these cost-effectiveness
ratios to WHO benchmarks, which define a cost-effectiveness ratio <3xGDP per capita as cost-
effective, and <1xGDP per capita as highly cost-effective.[29] We appreciated the potential
limitations of these WHO benchmarks,[30] yet also their practicality for multi-national studies such as
this. To quantify statistical uncertainty, we used probabilistic sensitivity analyses based on 1,000
Monte Carlo simulations to derive 95% uncertainty intervals, with varying inputs for sodium
exposure, blood pressure levels, effects of sodium on blood pressure, and effects of blood pressure on
cardiovascular disease (see eMethods).
Role of the funding source
The funders had no role in study design, data collection and analysis, decision to publish, or
preparation of the manuscript.
Patient involvement
No patients were involved in setting the research question or the outcome measures, nor were
they involved in developing plans for design or implementation of the study. No patients were asked
to advise on interpretation or writing up of results. There are no plans to disseminate the results of the
research to study participants or the relevant patient community.
Page 8 of 60
https://mc.manuscriptcentral.com/bmj
BMJ
123456789101112131415161718192021222324252627282930313233343536373839404142434445464748495051525354555657585960
Confidential: For Review O
nly
RESULTS
Cost-effectiveness of sodium reduction by national income level and region
The population characteristics and estimated costs, DALYs saved, and overall cost-
effectiveness of a policy intervention to reduce sodium, based on a 10% reduction in population
sodium, are shown globally, by national income, and by geographic region (Table 1). Worldwide,
over 10 years, the intervention could have averted approximately 5.78 million cardiovascular disease-
related DALYs/year (95% uncertainty interval (UI) 3.83 to 7.65). Nearly half (42.0%,
2,426,749/5,781,193) of averted DALYs were attributable to coronary heart disease (CHD), a similar
proportion (40.1%, 2,318,402/5,781,193) to stroke, and the remainder (17.9%, 1,036,042/5,781,193)
to other cardiovascular disease. Overall, a 10% sodium reduction would reduce the total burden of
cardiovascular disease worldwide by 1.96% (5,781,193/295,035,800). Per 1,000 adults globally, 1.51
DALYs on average would be averted annually (95%UI 1.01 to 2.00), with larger impact in upper-
middle-income countries (1.74 DALYs, 95%UI 1.15 to 2.28) than high-income countries (1.04
DALYs, 95%UI 0.68 to 1.40). Among 9 world regions, largest estimated reductions in DALYs would
be in Central Asia/Eastern and Central Europe (3.46 DALYs per 1,000 people per year, 95%UI 2.26
to 4.56); although even regions with smallest effects would experience benefits (e.g., Australia/New
Zealand: 0.66 DALYs, 95%UI 0.42 to 0.89).
Even with PPP-correction, the estimated intervention costs per capita generally decreased
with higher country income, although not uniformly. Per capita, the average estimated 10-year cost in
high-income nations (I$2.07) was nearly double that in upper-middle-income countries (I$1.09), with
smaller differences between lower-middle-income (I$0.74) and low-income (I$0.62) countries (Table
1). By world region, per capita cost was highest in Central Asia/Eastern and Central Europe (I$2.71)
and Australia/New Zealand (I$2.63). Estimated intervention costs in South Asia (I$0.74), Sub-
Saharan Africa (I$0.83), East/Southeast Asia (I$0.83), and Latin America/Caribbean (I$0.93) were
each below a dollar per capita.
The relative contributions of each intervention component to the total 10-year cost differed
significantly between countries (eFigure 1). For instance, costs of supplies/equipment, meetings, and
training were uniformly low (averaging I$0.01, I$0.01, and I$0.04 per capita respectively), whereas
Page 9 of 60
https://mc.manuscriptcentral.com/bmj
BMJ
123456789101112131415161718192021222324252627282930313233343536373839404142434445464748495051525354555657585960

Confidential: For Review O
nly
costs of human resources and mass media were much higher and more variable across countries.
Globally, average PPP-adjusted costs for human resources (personnel salaries) were I$0.27 per capita,
but with a 9-fold range comparing high-income (I$0.93) to low-income (I$0.10) countries. Human
resources were most costly in Australia/New Zealand (I$1.26 per capita), Western Europe (I$1.03),
and Canada/US (I$0.82); and lowest in South Asia (I$0.06). Mass media costs were generally the
most expensive component of the intervention: I$0.80 per capita globally, I$1.07 for high-income
nations, and I$0.44 for low-income nations. They represented the most costly component of the
intervention in every region except for Australia/New Zealand, Canada/US, and Western Europe,
where human resources was the most costly component.
Globally, the estimated average cost-effectiveness ratio of the 10-year intervention was
approximately I$204 per DALY saved (95%UI 149 to 322). This did not include potential savings
from lower health care costs or higher productivity due to averted cardiovascular disease events,
which would each further improve the estimated cost-effectiveness. The estimated cost-effectiveness
ratio was lowest (best) in lower-middle-income countries (I$111, 95%UI 81 to 175) and upper-
middle-income countries (I$146, 95%UI 109 to 223); higher in low-income countries (I$215, 95%UI
139 to 400); and highest in high-income countries (I$465, 95%UI 341 to 724). By region, lowest cost-
effectiveness ratios were in South Asia and East/Southeast Asia (I$116 and I$123, respectively). In
Central Asia/Eastern and Central Europe, high intervention efficacy partly offset its higher projected
cost, generating the next best cost-effectiveness ratio (I$211, 95%UI 157 to 324).
Effectiveness, cost, and cost-effectiveness by country
Across individual countries, the estimated intervention efficacy, in terms of DALYs averted
per 1,000 people, was highest in Kazakhstan (23.0, 95%UI 15.6 to 29.8), Georgia (21.6, 95%UI 14.3
to 28.3), Belarus (19.8, 95%UI 12.8 to 26.9), Ukraine (19.0, 95%UI 12.3 to 25.9), Mongolia (18.9,
95%UI 12.1 to 25.0), and Russia (18.8, 95%UI 12.2 to 25.5) (eTable 3). The relative rankings of
these nations should be considered in the context of the uncertainty in the estimates that preclude, for
example, confirming statistically significant differences in efficacy between Kazakhstan and Russia.
Nonetheless, the range of estimated efficacy across the 183 nations was large, for example lowest in
Page 10 of 60
https://mc.manuscriptcentral.com/bmj
BMJ
123456789101112131415161718192021222324252627282930313233343536373839404142434445464748495051525354555657585960

Confidential: For Review O
nly
Jamaica (1.9, 95%UI 1.1 to 2.7), Qatar (1.4, 95%UI 0.8 to 1.9), Rwanda (1.3, 95%UI 0.6 to 2.3), and
Kenya (0.4, 95%UI 0.2 to 0.7).
Per capita, estimated 10-year intervention cost was lowest in Myanmar, Vietnam, DPR Korea
(each I$0.31), Thailand (I$0.33), Nepal (I$0.40), and Uzbekistan (I$0.41) (eTable 3). A total of 68
countries had estimated 10-year intervention costs<I$1.00 per capita. For 84 countries, estimated
costs were between I$1.00 and I$9.99; for 19 countries, between I$10 and I$29.99; and for 12, greater
than I$30.
Estimated national cost-effectiveness ratios were correspondingly variable (Figure 1).
Uzbekistan’s was lowest (best) at I$26.08/DALY (95%UI 20.08 to 39.02), followed by Myanmar
(I$33.30, 95%UI 25.10 to 50.46). 28 countries had estimated cost-effectiveness ratios below
I$100/DALY, and 112 more, below I$1000/DALY. Eleven nations, all very small, had estimated
cost-effectiveness ratios between I$10,000 and I$30,000/DALY (eTable 3).
WHO benchmarks for cost-effectiveness
In comparison to WHO benchmarks (cost-effectiveness ratio <3xGDP/capita is cost-effective,
<1xGDP/capita, highly cost-effective),[29] the 10-year sodium reduction intervention was estimated
to be highly cost-effective globally. Across all 183 countries, the estimated cost-effectiveness ratio of
this policy intervention was >3xGDP/capita in only one nation (Marshall Islands: 4.7xGDP/capita),
between 3 and 1xGDP/capita in six nations (Kenya, Tonga, Kiribati, Samoa, Micronesia, Comoros),
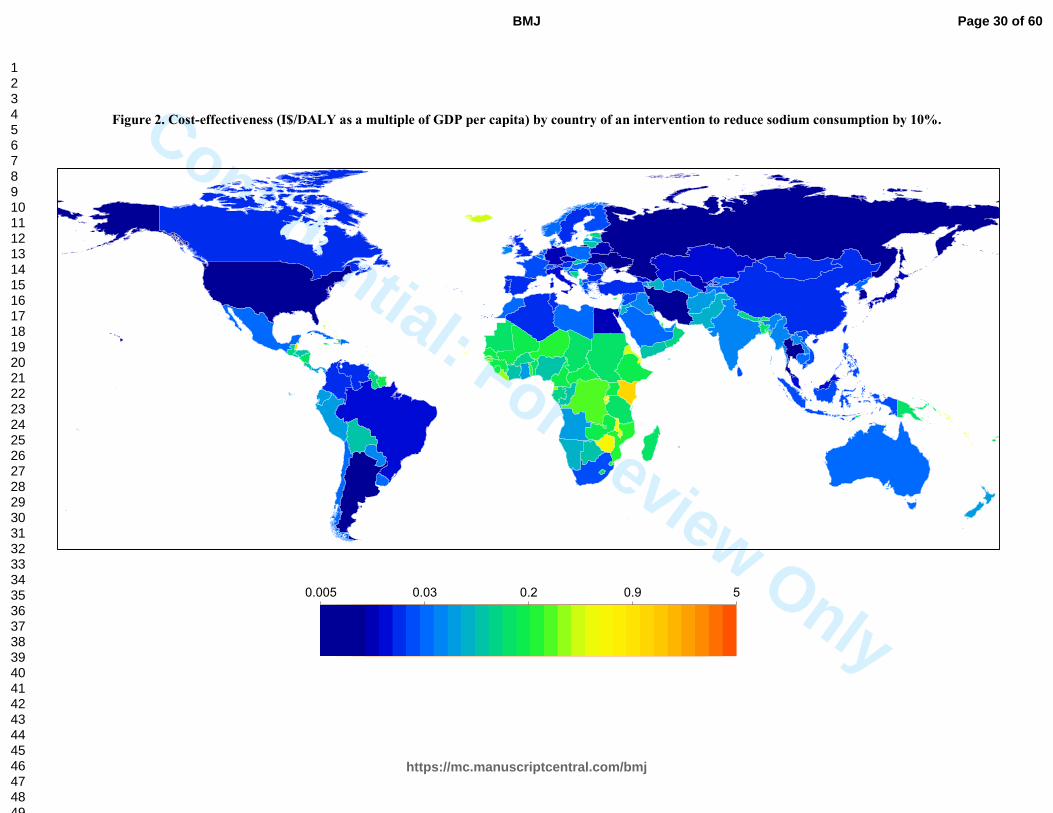
and highly cost-effective in all other nations (Figure 2). Indeed, in 130 countries, representing more
than 96% of the world’s population, the estimated cost-effectiveness ratio was <0.1xGDP/capita, far
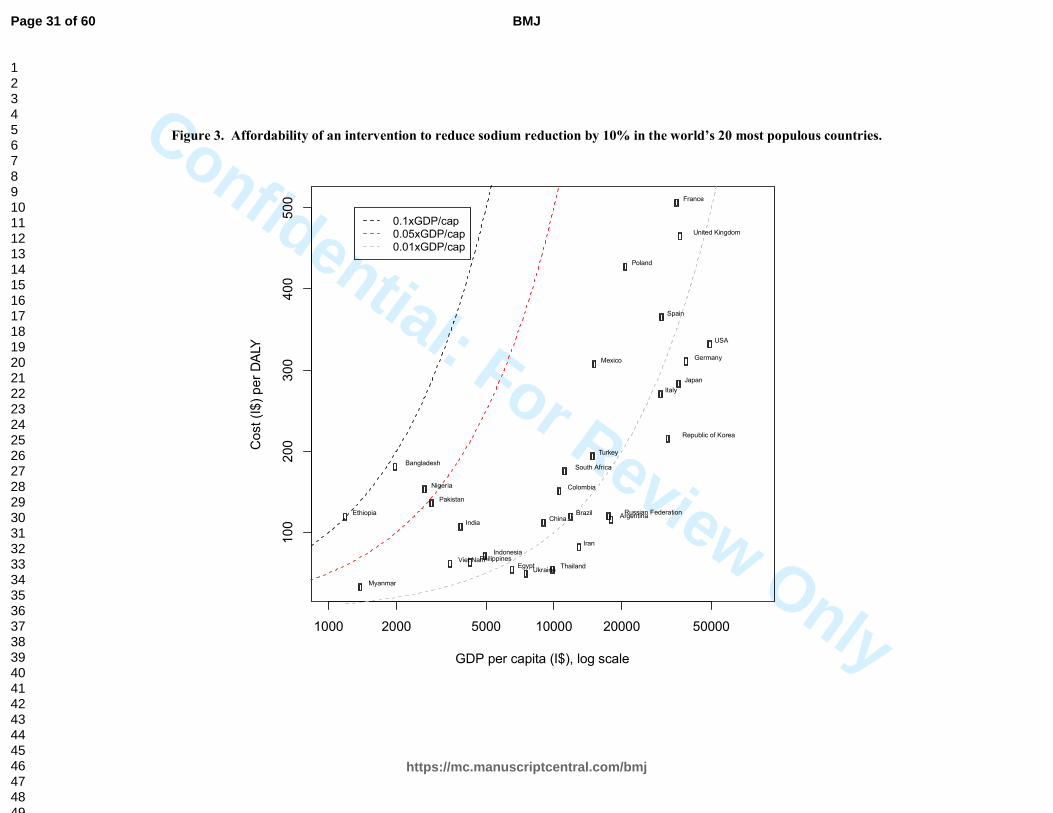
below usual cost-effectiveness thresholds. This included each of the world’s 20 most populous
countries (Figure 3).
Potential heterogeneity of effectiveness and costs
Sodium reduction remained highly cost-effective globally and by world region when we
considered alternative effectiveness (proportional reduction of 30%, absolute reduction of 0.5 g/d or
1.5 g/d); and alternative thresholds of optimal intake (the level at which further sodium reduction
Page 11 of 60
https://mc.manuscriptcentral.com/bmj
BMJ
123456789101112131415161718192021222324252627282930313233343536373839404142434445464748495051525354555657585960
Confidential: For Review O
nly
produces no further health benefits) of 3.0 or 1.0 g/d (Table 2). Generally, achieving larger sodium
reduction targets (e.g., 30%, 1.5 g/d) was more cost-effective (eFigure 2), but even modest achieved
reductions (10% or 0.5 g/d over 10 years) were highly cost-effective. Under any of these scenarios,
the estimated cost-effectiveness ratio was <0.05xGDP/capita in every world region except Sub-
Saharan Africa. Due to generally low sodium intakes in that region, the estimated cost-effectiveness
ratio was <0.1xGDP/capita when the optimal intake threshold was 1.0 g/d or 2.0 g/d, but up to
6.0xGDP/capita when it was assumed to be 3.0 g/d.
As expected, cost-effectiveness ratios were sensitive to variations in estimated intervention
cost. We evaluated the proportion of the world’s adult population living in countries with a cost-
effectiveness ratio (I$/DALY) <0.05x and <0.5xGDP/capita, for varying intervention costs that were
25%, 50%, 150%, 200%, or 500% of baseline cost estimates (eFigure 3). For a 10% sodium
reduction, under the base scenario for cost estimates, 89% of the global adult population would live in
countries with a cost-effectiveness ratio <0.05xGDP/capita. This decreased to 23% of the global adult
population if costs were 5-fold higher, 68% if costs were 2-fold higher, and 85% if costs were 1.5-fold
higher; while it increased to 96% if costs were half as large, and 99% if costs were one quarter as
large. For a 30% sodium reduction, the corresponding figures for a benchmark of <0.05xGDP/capita
were 85%, 92%, 96%, 98%, 99.1%, and 99.3% of the global adult population. We also made
comparisons against a cost-effectiveness ratio benchmark <0.5xGDP/capita, still substantially below
the WHO criterion of 1xGDP as highly cost-effective. For a 10% sodium reduction, even if the
intervention costs were 5-fold greater than the baseline estimate, 96% of the world’s population
would live in countries with a cost-effectiveness ratio <0.5xGDP/capita; and for a 30% sodium
reduction, 99% would.
Page 12 of 60
https://mc.manuscriptcentral.com/bmj
BMJ
123456789101112131415161718192021222324252627282930313233343536373839404142434445464748495051525354555657585960

Confidential: For Review O
nly
DISCUSSION
Principal findings
We found that a national government “soft regulation” policy intervention to reduce
population sodium consumption by 10% over 10 years was projected to be highly cost-effective
(<1xGDP/capita per DALY saved) in nearly every country in the world, and remarkably cost-
effective (<0.05xGDP/capita per DALY) in the great majority of countries. Hundreds of thousands of
deaths, and millions of DALYs, were estimated to be potentially averted annually, at low cost.
Comparison with other prevention strategies
These cost-effectiveness ratios compare very favorably with other prevention strategies. For
example, ‘best buy’ pharmacologic interventions to reduce cardiovascular disease in high-income
countries have estimated cost-effectiveness ratios >$21,000/DALY for primary prevention (statins)
and >$6,000/DALY for secondary prevention (beta-blockers).[31 32] By contrast, we project a cost-
effectiveness ratio of I$465/DALY for the 10% sodium reduction intervention in high-income
countries. Similarly, our projected cost-effectiveness ratio of I$143/DALY in low- and middle-
income countries compares very favorably with an estimated cost-effectiveness ratio of I$900/DALY
for a cardiovascular disease combination pill (‘polypill’) targeted at high-risk individuals in
developing countries.[33] Notably, several of these prior pharmacologic cost-effectiveness ratios
incorporated estimated health savings from averted cardiovascular disease events, which produces
substantially lower cost-effectiveness ratios than if estimated health savings are omitted, as in our
analysis.[32 33]
Despite differences in modeling methods, other studies of sodium reduction interventions in a
handful of nations have also found them to be extremely cost-effective. [4 8-10 12] Many of these
prior analyses incorporated estimated health system savings from averted cardiovascular disease
events, which generally rendered the interventions not only cost-effective but actually cost-saving,
i.e., with dominant cost-effectiveness ratios less than zero. Some analyses further accounted for
productivity gains from reduced cardiovascular disease morbidity and mortality, further increasing
cost savings. Investigations that, like ours, calculated only intervention costs and DALYs averted,
Page 13 of 60
https://mc.manuscriptcentral.com/bmj
BMJ
123456789101112131415161718192021222324252627282930313233343536373839404142434445464748495051525354555657585960

Confidential: For Review O
nly
without including any estimates of health system savings, arrived at very similar cost-effectiveness
ratios for equivalent regions (e.g., I$561 for Western Europe, versus our cost-effectiveness ratio of
I$477).[34]
Our investigation builds upon and substantially extends such prior analyses of potential
sodium reduction interventions in several important respects. First, most included only a single high-
income nation.[4 9 10 12] One prior analysis included 23 more varied nations, but only estimated
averted deaths, rather than DALYs,[6] preventing comparison with other cost-effectiveness ratios. In
contrast to prior analyses, we also jointly incorporated heterogeneity in blood pressure effects of
sodium reduction by age, race, and hypertensive status, providing more accurate cardiovascular
disease impact estimates. Additionally, our analysis of 183 countries using consistent methods
enabled us to explore sources of heterogeneity and sensitivity in estimated cost-effectiveness across
nations and regions.
Sources of heterogeneity
Differences in intervention costs were one of the major drivers of varying cost-effectiveness
ratios. The large variation of human resource and mass media costs across countries suggests potential
savings from multinational efforts to reduce sodium, which could benefit from economies of scale.
For instance, the new European Union Salt Reduction Framework, which monitors national sodium
reduction initiatives and supports implementation efforts across multiple member nations,[35] could
be emulated elsewhere. Consistent with the relevance of scale, the 20 nations with highest per capita
intervention costs all had adult populations <500,000. The higher cost of mass media, compared to
other intervention components, further suggests a need for research on how best to target such
resources. The recent finding[36] that salt reduction in the UK arose largely from product
reformulation rather than changes in consumer choice suggests that, in countries where most dietary
sodium comes from processed food (e.g., 77% in the US[37]), an intervention consisting of industry
targets but without mass media components might be more cost-effective. In contrast, in nations with
lower proportions of manufactured food, industry-focused efforts might lead to smaller absolute
reductions in sodium. Yet, many such countries also have lower baseline levels of sodium
Page 14 of 60
https://mc.manuscriptcentral.com/bmj
BMJ
123456789101112131415161718192021222324252627282930313233343536373839404142434445464748495051525354555657585960

Confidential: For Review O
nly
consumption,[1] so that percentage reductions might be similar. In comparison, for certain Asian
nations such as China, substantial sodium is added at home, making education and media efforts more
relevant. Nevertheless, even with an up to 5-fold increase in total costs, our multi-national
investigation suggests that a government-supported sodium reduction program would be highly cost-
effective for nearly every country in the world.
Our findings were robust to differing thresholds for optimal sodium intake. While the precise
optimal level of sodium intake remains uncertain,[24] to our knowledge ours is the first cost-
effectiveness analysis to evaluate the relevance of this uncertainty to policy. We found that this
threshold influences relative cost-effectiveness only in countries with the lowest intakes, with very
little effect in most others. For example, cost-effectiveness ratios increase notably in Sub-Saharan
Africa when the threshold is raised from 2.0 to 3.0 g/d, but relatively little in most other nations
(Table 2).
Strengths and limitations
While our analysis has several strengths (see eDiscussion), potential limitations should be
considered. We utilized estimates of sodium consumption, blood pressure levels, and rates of
cardiovascular disease based on raw data covering a majority but not all of the global population, with
hierarchical estimation of the remainder.[1 38 39] Our estimates of health benefits accounted only for
cardiovascular disease, whereas high sodium intake is also associated with vascular stiffness, renal
dysfunction, and stomach cancer, independent of blood pressure levels.[40-42] We did not account for
possible unintended consequences of the intervention, such as changes in population choices of
overall foods consumed. We did not model health system savings from averted cardiovascular disease
events. Averting events may compress disease and costs later in life, reducing overall morbidity and
lifetime costs, but modeling all potential subsequent health transitions and treatment costs for every
nation globally is not yet feasible. Our models are based on a 10-year intervention period including
planning, development, and staged implementation. Over the longer-term, intervention costs may
decrease, while lifetime health benefits might also increase. Thus, these findings should be considered
a platform on which to base intermediate-term policies, recognizing that longer-term effectiveness
Page 15 of 60
https://mc.manuscriptcentral.com/bmj
BMJ
123456789101112131415161718192021222324252627282930313233343536373839404142434445464748495051525354555657585960

Confidential: For Review O
nly
should also be evaluated. We did not evaluate other potential strategies to reduce sodium, such as
mandatory quality standards, taxation, complementary state or community initiatives, or multi-
component approaches that could be even more effective, such as seen in Japan and Finland.[43-45]
These might produce similar or even greater reductions in sodium at less cost, but are also perhaps
less feasible in certain nations.
Conclusions
In summary, even without incorporating potential healthcare savings from averted events, we
found that a government-supported, coordinated national policy to reduce population sodium intake
by 10% over 10 years would be extremely cost-effective in nearly all of 183 nations evaluated.
Page 16 of 60
https://mc.manuscriptcentral.com/bmj
BMJ
123456789101112131415161718192021222324252627282930313233343536373839404142434445464748495051525354555657585960
Confidential: For Review O
nly
Acknowledgments:
The authors gratefully acknowledge the World Health Organization for use of the NCD Costing Tool,
and the Institute for Health Metrics and Evaluation for use of their cardiovascular disease DALY
estimates.
Contributors:
MW and DM conceptualised the study and wrote the final draft of the paper; DM also provided
funding support and supervision. MW undertook the analysis, and wrote the first draft of the paper.
SF, GMS, SK, and RM prepared data and commented on the paper. JP commented on the paper. All
authors approved the final version. MW acts as guarantor of the study.
Funding:
This research was supported by the National Heart, Lung, and Blood Institute (R01 HL115189; PI
Mozaffarian) and the National Institute of Diabetes and Digestive and Kidney Diseases (T32 Training
Grant in Academic Nutrition, DK007703; Dr. Singh), National Institutes of Health. The sponsors had
no role in the study design; in the collection, analysis, and interpretation of data; in the writing of the
report; and in the decision to submit the article for publication.
Competing interests:
All authors have completed the ICMJE uniform disclosure form at www.icmje.org/coi_disclosure.pdf
and declare: financial support from the National Institutes of Health for the submitted work. Dr.
Mozaffarian reports ad hoc honoraria or consulting from Boston Heart Diagnostics, Haas Avocado
Board, Astra Zeneca, GOED, DSM, and Life Sciences Research Organization, none of which were
related to topics of dietary sodium. The other authors report no financial relationships with any
organisations that might have an interest in the submitted work in the previous three years.
Page 17 of 60
https://mc.manuscriptcentral.com/bmj
BMJ
123456789101112131415161718192021222324252627282930313233343536373839404142434445464748495051525354555657585960
Confidential: For Review O
nly
Ethical approval: Not required.
Data sharing: The global data on sodium intake may be requested from the authors for academic
collaborations; see http://www.globaldietarydatabase.org/requesting-data.html. Global data on blood
pressure is available for download at
https://www1.imperial.ac.uk/publichealth/departments/ebs/projects/eresh/majidezzati/healthmetrics/m
etabolicriskfactors/metabolic_risk_factor_maps/ Global data on cardiovascular events is available for
download from the Global Burden of Diseases Study at http://ghdx.healthdata.org/global-burden-
disease-study-2013-gbd-2013-data-downloads
The lead author (MW) affirms that the manuscript is an honest, accurate, and transparent account of
the study being reported; that no important aspects of the study have been omitted; and that any
discrepancies from the study as planned (and, if relevant, registered) have been explained.
SUMMARY BOX
What is already known on this topic
• In prior research in a limited number of high-income nations, national policies to reduce
excess sodium intake have been estimated to be highly cost-effective for reducing
hypertension and cardiovascular disease.
• For most countries of the world, the cost-effectiveness of a national policy intervention to
reduce sodium is unknown.
What this study adds
• We found that a government “soft regulation” strategy combining targeted industry
agreements and public education to reduce population sodium consumption by 10% over 10
years would be extremely cost-effective in nearly all of 183 nations evaluated, with an
average cost-effectiveness ratio (not accounting for potential health care savings due to
averted events) of I$204/DALY.
Page 18 of 60
https://mc.manuscriptcentral.com/bmj
BMJ
123456789101112131415161718192021222324252627282930313233343536373839404142434445464748495051525354555657585960

Confidential: For Review O
nly
PRINT ABSTRACT Study question. To quantify the cost-effectiveness of a government “soft regulation” policy
intervention combining targeted industry agreements and public education to reduce sodium intake in
183 countries worldwide.
Methods. We characterized global sodium intakes, blood pressure levels, effects of sodium on blood
pressure and of blood pressure on cardiovascular disease, and cardiovascular disease rates in 2010,
each by age and sex, in 183 countries. Country-specific costs of a policy that combines government-
supported education and targeted industry agreements to reduce population sodium intake were
estimated using the World Health Organization Noncommunicable Disease Costing Tool. Country-
specific impacts on mortality and disability-adjusted life years (DALYs) were modeled using
comparative risk assessment, based on scenarios including 10%, 30%, 0.5 g/d, and 1.5 g/d sodium
reductions achieved over 10 years. Cost-effectiveness was evaluated as purchasing power parity
(PPP)-adjusted international dollars (equivalent to the country-specific purchasing power of US
dollars) per DALY saved over 10 years.
Study answer and limitations. Worldwide, a 10% sodium reduction over 10 years within each
country was projected to avert 5,781,000 cardiovascular disease-related DALYs/year, at a mean cost
of I$1.13 per capita over the 10-year intervention and with a cost-effectiveness ratio of I$204/DALY.
We did not account for possible unintended consequences of the intervention, nor model health
system savings from averted cardiovascular disease events.
What this study adds. We found that a government “soft regulation” strategy combining targeted
industry agreements and public education to reduce population sodium consumption by 10% over 10
years would be extremely cost-effective in nearly all of 183 nations evaluated.
Funding, competing interests, data sharing This research was supported by the National Institutes
of Health. Dr. Mozaffarian reports ad hoc honoraria or consulting from Boston Heart Diagnostics,
Page 19 of 60
https://mc.manuscriptcentral.com/bmj
BMJ
123456789101112131415161718192021222324252627282930313233343536373839404142434445464748495051525354555657585960
Confidential: For Review O
nly
Haas Avocado Board, Astra Zeneca, GOED, DSM, and Life Sciences Research Organization, none of
which were related to topics of dietary sodium. The other authors report no financial relationships
with any organisations that might have an interest in the submitted work in the previous three years.
The global data on sodium intake, blood pressure, and cardiovascular events are all available for
download.
Suggested figure: Fig 1.
Page 20 of 60
https://mc.manuscriptcentral.com/bmj
BMJ
123456789101112131415161718192021222324252627282930313233343536373839404142434445464748495051525354555657585960
Confidential: For Review O
nly
REFERENCES
1. Powles J, Fahimi S, Micha R, et al. Global, regional and national sodium intakes in 1990 and 2010: a systematic analysis of 24 h urinary sodium excretion and dietary surveys worldwide. BMJ open 2013;3(12):e003733 doi: 10.1136/bmjopen-2013-003733[published Online First: Epub Date]|.
2. Mozaffarian D, Fahimi S, Singh GM, et al. Global sodium consumption and death from cardiovascular causes. N Engl J Med 2014;371(7):624-34 doi: 10.1056/NEJMoa1304127[published Online First: Epub Date]|.
3. Lichtenstein AH, Ausman LM, Carrasco W, Jenner JL, Ordovas JM, Schaefer EJ. Hypercholesterolemic effect of dietary cholesterol in diets enriched in polyunsaturated and saturated fat. Dietary cholesterol, fat saturation, and plasma lipids. Arterioscler Thromb 1994;14(1):168-75
4. Selmer RM, Kristiansen IS, Haglerod A, et al. Cost and health consequences of reducing the population intake of salt. Journal of epidemiology and community health 2000;54(9):697-702
5. Abelson P. Returns on investment in public health: an epidemiological and economic analysis prepared for the Department of Health and Ageing: Department of Health and Ageing, Australia, 2001.
6. Asaria P, Chisholm D, Mathers C, Ezzati M, Beaglehole R. Chronic disease prevention: health effects and financial costs of strategies to reduce salt intake and control tobacco use. Lancet 2007;370(9604):2044-53 doi: 10.1016/S0140-6736(07)61698-5[published Online First: Epub Date]|.
7. Penz ED, Joffres MR, Campbell NR. Reducing dietary sodium and decreases in cardiovascular disease in Canada. Can J Cardiol 2008;24(6):497-1
8. Palar K, Sturm R. Potential societal savings from reduced sodium consumption in the U.S. adult population. American journal of health promotion : AJHP 2009;24(1):49-57 doi: 10.4278/ajhp.080826-QUAN-164[published Online First: Epub Date]|.
9. Bibbins-Domingo K, Chertow GM, Coxson PG, et al. Projected effect of dietary salt reductions on future cardiovascular disease. N Engl J Med 2010;362(7):590-9
10. Smith-Spangler CM, Juusola JL, Enns EA, Owens DK, Garber AM. Population strategies to decrease sodium intake and the burden of cardiovascular disease: a cost-effectiveness analysis. Ann Intern Med 2010;152(8):481-7, W170-3
11. Cobiac LJ, Vos T, Veerman JL. Cost-effectiveness of interventions to reduce dietary salt intake. Heart 2010;96(23):1920-5 doi: 10.1136/hrt.2010.199240[published Online First: Epub Date]|.
12. Barton P, Andronis L, Briggs A, McPherson K, Capewell S. Effectiveness and cost effectiveness of cardiovascular disease prevention in whole populations: modelling study. BMJ (Clinical research ed.) 2011;343:d4044 doi: 10.1136/bmj.d4044[published Online First: Epub Date]|.
13. Bertram MY, Steyn K, Wentzel-Viljoen E, Tollman S, Hofman KJ. Reducing the sodium content of high-salt foods: effect on cardiovascular disease in South Africa. S Afr Med J 2012;102(9):743-5
14. UK Food Standards Agency. UK Salt Reduction Initiatives. http://www.food.gov.uk/sites/default/files/multimedia/pdfs/saltreductioninitiatives.pdf (accessed 28 May, 2016).
15. Johns B, Baltussen R, Hutubessy R. Programme costs in the economic evaluation of health interventions. Cost Eff Resour Alloc 2003;1(1):1
16. Summers R, Heston A. The Penn World Table (Mark 5): an expanded set of international comparisons, 1950-1987. Quarterly Journal of Economics 1991;106:327-68
17. Meltzer D. 42 Future costs in medical cost-effectiveness analysis. The Elgar companion to health economics 2012:447
18. Weinstein MC, Siegel JE, Gold MR, Kamlet MS, Russell LB. Recommendations of the Panel on Cost-effectiveness in Health and Medicine. JAMA 1996;276(15):1253-8
19. Sadler K, Nicholson S, Steer T, et al. National Diet and Nutrition Survey - Assessment of dietary sodium in adults (aged 19 to 64 years) in England, 2011. UK Department of Health, 2012.
Page 21 of 60
https://mc.manuscriptcentral.com/bmj
BMJ
123456789101112131415161718192021222324252627282930313233343536373839404142434445464748495051525354555657585960
Confidential: For Review O
nly
20. WHO News. Progress in reducing salt consumption in Turkey. http://www.euro.who.int/en/what-we-do/health-topics/disease-prevention/nutrition/news/news/2013/04/progress-in-reducing-salt-consumption-in-turkey (accessed 28 May, 2016).
21. O'Donnell M, Mente A, Rangarajan S, et al. Urinary sodium and potassium excretion, mortality, and cardiovascular events. N Engl J Med 2014;371(7):612-23 doi: 10.1056/NEJMoa1311889[published Online First: Epub Date]|.
22. Cobb LK, Anderson CA, Elliott P, et al. Methodological issues in cohort studies that relate sodium intake to cardiovascular disease outcomes: a science advisory from the American Heart Association. Circulation 2014;129(10):1173-86 doi: 10.1161/CIR.0000000000000015[published Online First: Epub Date]|.
23. Cook NR, Appel LJ, Whelton PK. Lower levels of sodium intake and reduced cardiovascular risk. Circulation 2014;129(9):981-9 doi: 10.1161/CIRCULATIONAHA.113.006032[published Online First: Epub Date]|.
24. Institute of Medicine. Sodium Intake in Populations: Assessment of Evidence. Washington (DC): The National Academies Press, 2013.
25. Institute of Medicine. Evaluation of Biomarkers and Surrogate Endpoints in Chronic Disease. Washington, DC: National Academies Press, 2010.
26. Lewington S, Clarke R, Qizilbash N, Peto R, Collins R, Prospective Studies C. Age-specific relevance of usual blood pressure to vascular mortality: a meta-analysis of individual data for one million adults in 61 prospective studies. Lancet 2002;360(9349):1903-13
27. Williamson JD, Supiano MA, Applegate WB, et al. Intensive vs Standard Blood Pressure Control and Cardiovascular Disease Outcomes in Adults Aged >/=75 Years: A Randomized Clinical Trial. JAMA 2016 doi: 10.1001/jama.2016.7050[published Online First: Epub Date]|.
28. Xie X, Atkins E, Lv J, et al. Effects of intensive blood pressure lowering on cardiovascular and renal outcomes: updated systematic review and meta-analysis. Lancet 2016;387(10017):435-43 doi: 10.1016/S0140-6736(15)00805-3[published Online First: Epub Date]|.
29. WHO Commission on Macroeconomics and Health. Macroeconomics and health: Investing in health for economic development. Geneva: World Health Organization 2001.
30. Marseille E, Larson B, Kazi DS, Kahn JG, Rosen S. Thresholds for the cost-effectiveness of interventions: alternative approaches. Bull World Health Organ 2015;93(2):118-24 doi: 10.2471/BLT.14.138206[published Online First: Epub Date]|.
31. Goldman L, Sia ST, Cook EF, Rutherford JD, Weinstein MC. Costs and effectiveness of routine therapy with long-term beta-adrenergic antagonists after acute myocardial infarction. N Engl J Med 1988;319(3):152-7 doi: 10.1056/NEJM198807213190306[published Online First: Epub Date]|.
32. Goldman L, Weinstein MC, Goldman PA, Williams LW. Cost-effectiveness of HMG-CoA reductase inhibition for primary and secondary prevention of coronary heart disease. JAMA 1991;265(9):1145-51
33. Gaziano T. Prevention and treatment of chronic diseases in developing countries. Expert Paper No. 2011/2: UN Dept of Economic and Social Affairs Population Division, 2011.
34. Murray CJ, Lauer JA, Hutubessy RC, et al. Effectiveness and costs of interventions to lower systolic blood pressure and cholesterol: a global and regional analysis on reduction of cardiovascular-disease risk. Lancet 2003;361(9359):717-25 doi: 10.1016/S0140-6736(03)12655-4[published Online First: Epub Date]|.
35. European Commission. Survey on Member States' Implementation of the EU Salt Reduction Framework. http://ec.europa.eu/health/nutrition_physical_activity/docs/salt_report1_en.pdf (accessed 28 May, 2016).
36. Griffith R, O'Connell M, Smith K. The importance of product reformulation versus consumer choice in improving diet quality. IFS Working Paper W14/15, 2014.
37. Mattes RD, Donnelly D. Relative contributions of dietary sodium sources. J Am Coll Nutr 1991;10(4):383-93
38. Danaei G, Finucane MM, Lin JK, et al. National, regional, and global trends in systolic blood pressure since 1980: systematic analysis of health examination surveys and epidemiological studies with 786 country-years and 5.4 million participants. Lancet 2011;377(9765):568-77 doi: 10.1016/S0140-6736(10)62036-3[published Online First: Epub Date]|.
Page 22 of 60
https://mc.manuscriptcentral.com/bmj
BMJ
123456789101112131415161718192021222324252627282930313233343536373839404142434445464748495051525354555657585960

Confidential: For Review O
nly
39. Murray CJ, Vos T, Lozano R, et al. Disability-adjusted life years (DALYs) for 291 diseases and injuries in 21 regions, 1990–2010: a systematic analysis for the Global Burden of Disease Study 2010. Lancet 2013;380(9859):2197-223
40. Aburto NJ, Ziolkovska A, Hooper L, Elliott P, Cappuccio FP, Meerpohl JJ. Effect of lower sodium intake on health: systematic review and meta-analyses. BMJ (Clinical research ed.) 2013;346:f1326 doi: 10.1136/bmj.f1326[published Online First: Epub Date]|.
41. Graudal NA, Hubeck-Graudal T, Jurgens G. Effects of low sodium diet versus high sodium diet on blood pressure, renin, aldosterone, catecholamines, cholesterol, and triglyceride. Cochrane Database Syst Rev 2011(11):CD004022 doi: 10.1002/14651858.CD004022.pub3[published Online First: Epub Date]|.
42. Joossens JV, Hill MJ, Elliott P, et al. Dietary salt, nitrate and stomach cancer mortality in 24 countries. European Cancer Prevention (ECP) and the INTERSALT Cooperative Research Group. Int J Epidemiol 1996;25(3):494-504
43. Christoforou A, Trieu K, Land MA, Bolam B, Webster J. State-level and community-level salt reduction initiatives: a systematic review of global programmes and their impact. Journal of epidemiology and community health 2016 doi: 10.1136/jech-2015-206997[published Online First: Epub Date]|.
44. Trieu K, Neal B, Hawkes C, et al. Salt Reduction Initiatives around the World - A Systematic Review of Progress towards the Global Target. PLoS One 2015;10(7):e0130247 doi: 10.1371/journal.pone.0130247[published Online First: Epub Date]|.
45. Hyseni L, Elliot-Green A, Lloyd-Williams F, et al. Systematic review of dietary salt reduction policies: evidence for an effectiveness hierarchy? (abstract). Circulation 2016;133(Suppl 1):P154
Page 23 of 60
https://mc.manuscriptcentral.com/bmj
BMJ
123456789101112131415161718192021222324252627282930313233343536373839404142434445464748495051525354555657585960
Confidential: For Review O
nly
FIGURE LEGENDS
Figure 1. Cost-effectiveness (purchasing power–adjusted I$/DALY) by country of an
intervention to reduce sodium consumption by 10%.
Figure 2. Cost-effectiveness (purchasing power–adjusted I$/DALY as a multiple of GDP per
capita) by country of an intervention to reduce sodium consumption by 10%.
Figure 3. Affordability of an intervention to reduce sodium reduction by 10% in the world’s 20
most populous countries. Each point shows the cost-effectiveness of the intervention (I$/DALY) for
a given country against that country’s GDP per capita (I$), adjusted for purchasing power. The dotted
lines show 0.01x, 0.05x, and 0.1xGDP per capita. So, for example, Nigeria and Bangladesh, being to
the right of the black line and to the left of the red line, have a cost-effectiveness ratio less than
0.1xGDP per capita but greater than 0.05xGDP per capita.
Page 24 of 60
https://mc.manuscriptcentral.com/bmj
BMJ
123456789101112131415161718192021222324252627282930313233343536373839404142434445464748495051525354555657585960
Confidential: For Review Only
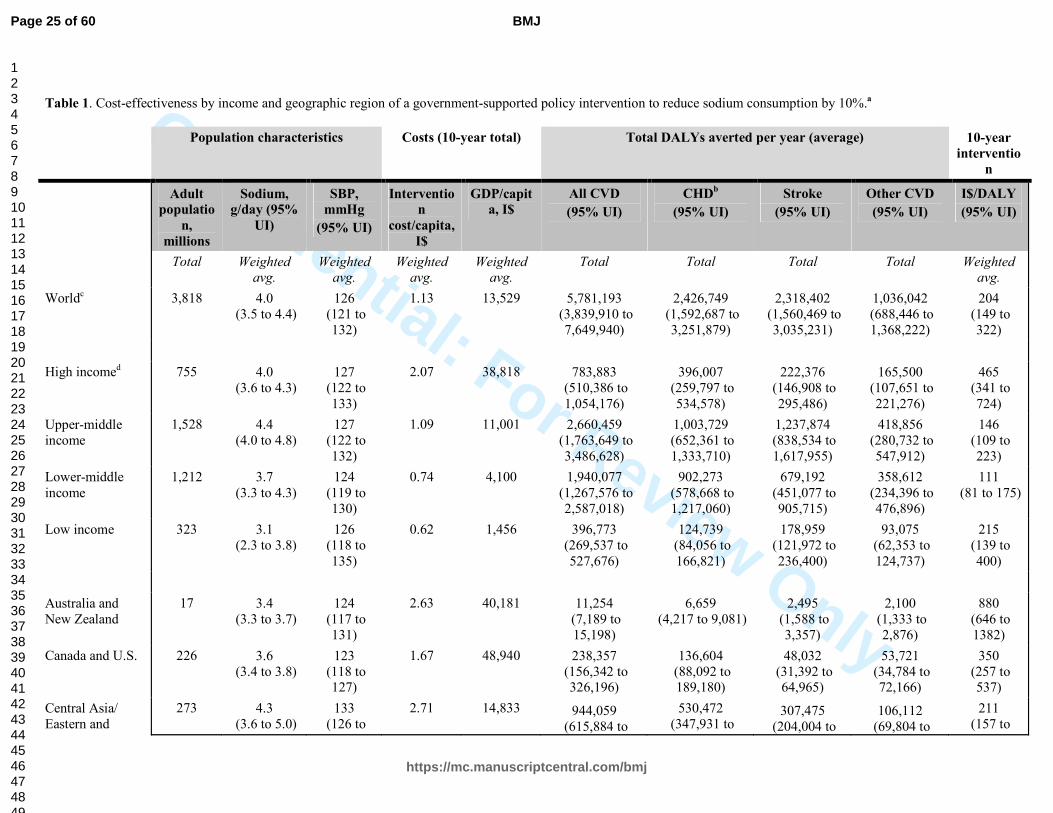
Table 1. Cost-effectiveness by income and geographic region of a government-supported policy intervention to reduce sodium consumption by 10%.a
Population characteristics Costs (10-year total) Total DALYs averted per year (average) 10-year
interventio
n
Adult
populatio
n,
millions
Sodium,
g/day (95%
UI)
SBP,
mmHg
(95% UI)
Interventio
n
cost/capita,
I$
GDP/capit
a, I$
All CVD
(95% UI)
CHDb
(95% UI)
Stroke
(95% UI)
Other CVD
(95% UI)
I$/DALY
(95% UI)
Total Weighted avg.
Weighted avg.
Weighted avg.
Weighted avg.
Total Total Total Total Weighted avg.
Worldc 3,818 4.0 (3.5 to 4.4)
126 (121 to 132)
1.13 13,529 5,781,193 (3,839,910 to 7,649,940)
2,426,749 (1,592,687 to 3,251,879)
2,318,402 (1,560,469 to 3,035,231)
1,036,042 (688,446 to 1,368,222)
204 (149 to 322)
High incomed 755 4.0 (3.6 to 4.3)
127 (122 to 133)
2.07 38,818 783,883 (510,386 to 1,054,176)
396,007 (259,797 to 534,578)
222,376 (146,908 to 295,486)
165,500 (107,651 to 221,276)
465 (341 to 724)
Upper-middle income
1,528 4.4 (4.0 to 4.8)
127 (122 to 132)
1.09 11,001 2,660,459 (1,763,649 to 3,486,628)
1,003,729 (652,361 to 1,333,710)
1,237,874 (838,534 to 1,617,955)
418,856 (280,732 to 547,912)
146 (109 to 223)
Lower-middle income
1,212 3.7 (3.3 to 4.3)
124 (119 to 130)
0.74 4,100 1,940,077 (1,267,576 to 2,587,018)
902,273 (578,668 to 1,217,060)
679,192 (451,077 to 905,715)
358,612 (234,396 to 476,896)
111 (81 to 175)
Low income 323 3.1 (2.3 to 3.8)
126 (118 to 135)
0.62 1,456 396,773 (269,537 to 527,676)
124,739 (84,056 to 166,821)
178,959 (121,972 to 236,400)
93,075 (62,353 to 124,737)
215 (139 to 400)
Australia and New Zealand
17 3.4 (3.3 to 3.7)
124 (117 to 131)
2.63 40,181 11,254 (7,189 to 15,198)
6,659 (4,217 to 9,081)
2,495 (1,588 to 3,357)
2,100 (1,333 to 2,876)
880 (646 to 1382)
Canada and U.S. 226 3.6 (3.4 to 3.8)
123 (118 to 127)
1.67 48,940 238,357 (156,342 to 326,196)
136,604 (88,092 to 189,180)
48,032 (31,392 to 64,965)
53,721 (34,784 to 72,166)
350 (257 to 537)
Central Asia/ Eastern and
273 4.3 (3.6 to 5.0)
133 (126 to
2.71 14,833 944,059 (615,884 to
530,472 (347,931 to
307,475 (204,004 to
106,112 (69,804 to
211 (157 to
Page 25 of 60
https://mc.manuscriptcentral.com/bmj
BMJ
123456789101112131415161718192021222324252627282930313233343536373839404142434445464748495051525354555657585960

Confidential: For Review Only
Central Europe 140) 1,245,547) 707,931) 403,720) 140,615) 324)
East and Southeast Asia
1,354 4.6 (4.3 to 5.1)
126 (121 to 130)
0.83 10,777 2,139,880 (1,428,092 to 2,809,299)
617,817 (405,227 to 826,603)
1,176,978 (793,689 to 1,535,809)
345,084 (230,836 to 449,547)
123 (93 to 184)
Latin America and Caribbean
316 3.5 (3.1 to 3.9)
126 (120 to 133)
0.93 12,505 325,607 (212,912 to 437,512)
140,529 (90,822 to 191,668)
110,632 (72,322 to 146,709)
74,446 (48,485 to 99,236)
236 (171 to 375)
North Africa and Middle East
225 3.9 (3.3 to 4.7)
125 (118 to 131)
1.31 12,436 367,829 (235,762 to 498,060)
171,883 (109,403 to 233,374)
112,826 (72,727 to 152,981)
83,120 (53,259 to 111,970)
300 (215 to 490)
South Asia 786 3.7 (3.4 to 4.1)
123 (117 to 128)
0.74 3,551 1,136,614 (733,267 to 1,534,026)
582,096 (364,382 to 791,879)
331,062 (218,435 to 444,645)
223,456 (143,221 to 299,264)
116 (85 to 182)
Sub-Saharan Africa
320 2.5 (2.0 to 3.0)
130 (123 to 137)
0.83 2,743 335,053 (202,998 to 468,036)
95,140 (58,076 to 133,355)
156,910 (95,447 to 218,782)
83,003 (50,151 to 116,135)
255 (166 to 473)
Western Europe 301 3.8 (3.5 to 4.3)
130 (124 to 136)
1.98 35,676 282,541 (183,440 to 380,484)
145,548 (94,348 to 196,380)
71,992 (46,942 to 96,720)
65,000 (41,894 to 87,414)
477 (350 to 744)
a. A program of government-supported industry targets including: (a) a public health campaign targeting consumer choices, (b) government-supported industry agreements to reduce sodium in processed foods, and (c) government monitoring of industry compliance. These results reflect the total effect over a 10-year policy intervention that includes 4 stages: planning (year 1), development (year 2), partial implementation (years 3-5), and full implementation (years 6-10). To enable comparisons between countries, all costs were evaluated in international dollars (I$), based on each nation’s purchasing power parity (PPP). One I$ in any given country can be interpreted as the funds needed to purchase the same amounts of goods/services in that country as one US$ would purchase in the US. For countries with lower income than in the US, conversion of our findings from I$ to US$ would substantially increase the apparent cost-effectiveness (i.e., the cost in US$ per DALY saved would be much lower).
b. CHD is coronary heart disease; stroke is ischemic stroke and hemorrhagic and other non-ischemic stroke; other CVD is aortic aneurysm, atrial fibrillation and flutter, cardiomyopathy and myocarditis, endocarditis, hypertensive heart disease, peripheral vascular disease, rheumatic heart disease, and other cardiovascular and circulatory diseases.
c. In 2010 globally, the total burden of cardiovascular disease (CVD) was 295,035,800 DALYs, of which CHD accounted for 129,819,900 DALYs, stroke 102,232,300 DALYs, and other CVD 62,983,600 DALYs. There were 14,669,000 total CVD deaths, of which 6,963,000 were CHD deaths, 5,798,000 stroke deaths, and 1,909,000 other CVD deaths. The numbers of deaths in each subtype may not exactly sum to the total CVD deaths due to rounding.
d. Income categorizations based on the World Bank classification system (http://data.worldbank.org/about/country-classifications/country-and-lending-groups).
Page 26 of 60
https://mc.manuscriptcentral.com/bmj
BMJ
123456789101112131415161718192021222324252627282930313233343536373839404142434445464748495051525354555657585960
Confidential: For Review Only
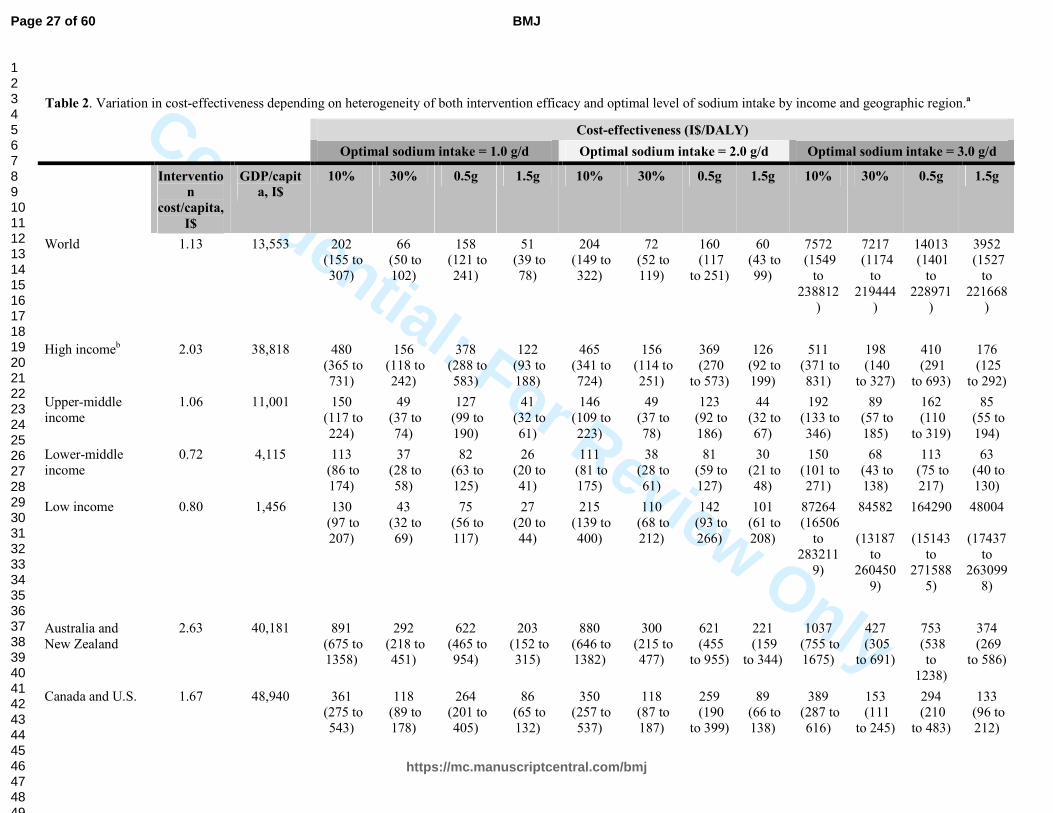
Table 2. Variation in cost-effectiveness depending on heterogeneity of both intervention efficacy and optimal level of sodium intake by income and geographic region.a
Cost-effectiveness (I$/DALY)
Optimal sodium intake = 1.0 g/d Optimal sodium intake = 2.0 g/d Optimal sodium intake = 3.0 g/d
Interventio
n
cost/capita,
I$
GDP/capit
a, I$
10% 30% 0.5g 1.5g 10% 30% 0.5g 1.5g 10% 30% 0.5g 1.5g
World 1.13 13,553 202 (155 to 307)
66 (50 to 102)
158 (121 to 241)
51 (39 to 78)
204 (149 to 322)
72 (52 to 119)
160 (117 to 251)
60 (43 to 99)
7572 (1549
to 238812
)
7217 (1174
to 219444
)
14013 (1401
to 228971
)
3952 (1527
to 221668
)
High incomeb 2.03 38,818 480 (365 to 731)
156 (118 to 242)
378 (288 to 583)
122 (93 to 188)
465 (341 to 724)
156 (114 to 251)
369 (270 to 573)
126 (92 to 199)
511 (371 to 831)
198 (140 to 327)
410 (291 to 693)
176 (125 to 292)
Upper-middle income
1.06 11,001 150 (117 to 224)
49 (37 to 74)
127 (99 to 190)
41 (32 to 61)
146 (109 to 223)
49 (37 to 78)
123 (92 to 186)
44 (32 to 67)
192 (133 to 346)
89 (57 to 185)
162 (110 to 319)
85 (55 to 194)
Lower-middle income
0.72 4,115 113 (86 to 174)
37 (28 to 58)
82 (63 to 125)
26 (20 to 41)
111 (81 to 175)
38 (28 to 61)
81 (59 to 127)
30 (21 to 48)
150 (101 to 271)
68 (43 to 138)
113 (75 to 217)
63 (40 to 130)
Low income 0.80 1,456 130 (97 to 207)
43 (32 to 69)
75 (56 to 117)
27 (20 to 44)
215 (139 to 400)
110 (68 to 212)
142 (93 to 266)
101 (61 to 208)
87264 (16506
to 283211
9)
84582
(13187 to
2604509)
164290
(15143 to
2715885)
48004
(17437 to
2630998)
Australia and New Zealand
2.63 40,181 891 (675 to 1358)
292 (218 to 451)
622 (465 to 954)
203 (152 to 315)
880 (646 to 1382)
300 (215 to 477)
621 (455 to 955)
221 (159 to 344)
1037 (755 to 1675)
427 (305 to 691)
753 (538 to
1238)
374 (269 to 586)
Canada and U.S. 1.67 48,940 361 (275 to 543)
118 (89 to 178)
264 (201 to 405)
86 (65 to 132)
350 (257 to 537)
118 (87 to 187)
259 (190 to 399)
89 (66 to 138)
389 (287 to 616)
153 (111 to 245)
294 (210 to 483)
133 (96 to 212)
Page 27 of 60
https://mc.manuscriptcentral.com/bmj
BMJ
123456789101112131415161718192021222324252627282930313233343536373839404142434445464748495051525354555657585960

Confidential: For Review Only
Central Asia/ Eastern and Central Europe
2.59 14,833 220 (170 to 330)
72 (54 to 109)
185 (143 to 279)
60 (46 to 90)
211 (157 to 324)
70 (52 to 112)
179 (133 to 270)
60 (44 to 91)
220 (161 to 349)
81 (58 to 129)
188 (136 to 308)
73 (53 to 117)
East and Southeast Asia
0.82 10,777 130 (102 to 190)
42 (33 to 62)
124 (97 to 183)
40 (31 to 59)
123 (93 to 184)
40 (31 to 63)
118 (89 to 174)
39 (29 to 59)
129 (94 to 214)
48 (33 to 87)
122 (88 to 209)
47 (33 to 88)
Latin America and Caribbean
0.87 12,505 233 (176 to 358)
76 (57 to 120)
151 (116 to 235)
50 (37 to 77)
236 (171 to 375)
83 (60 to 137)
157 (114 to 249)
64 (46 to 104)
415 (271 to 795)
228 (136 to 504)
309 (196 to 705)
217 (130 to 549)
North Africa and Middle East
1.33 12,436 314 (234 to 501)
102 (76 to 167)
253 (190 to 409)
81 (60 to 130)
300 (215 to 490)
100 (71 to 173)
245 (177 to 406)
84 (59 to 139)
325 (227 to 563)
123 (83 to 216)
268 (184 to 482)
111 (76 to 196)
South Asia 0.74 3,551 121 (92 to 187)
40 (30 to 61)
91 (70 to 140)
29 (22 to 45)
116 (85 to 182)
39 (29 to 62)
88 (65 to 138)
30 (22 to 48)
126 (91 to 205)
49 (34 to 79)
98 (69 to 167)
42 (30 to 70)
Sub-Saharan Africa
1.01 2,769 161 (120 to 256)
53 (39 to 85)
80 (59 to 122)
30 (22 to 48)
255 (166 to 473)
127 (80 to 242)
155 (101 to 289)
115 (70 to 236)
88269 (16762
to 285936
6)
85502
(13376 to
2629504)
165968
(15351 to
2741935)
48337
(17666 to
2656245)
Western Europe 2.00 35,676 489 (371 to 742)
160 (120 to 246)
374 (283 to 573)
121 (92 to 186)
477 (350 to 744)
160 (118 to 256)
367 (268 to 565)
126 (92 to 197)
528 (387 to 845)
205 (146 to 329)
412 (294 to 687)
180 (128 to 288)
a. A sodium reduction intervention may have differing effectiveness in different settings. To test the robustness of findings to different assumptions, we evaluated varying intervention effectiveness – including 10% and 30% proportional reductions and 0.5 g/d and 1.5 g/d absolute reductions in sodium intake. In addition, the optimal level of sodium intake remains uncertain. We evaluated 1.0, 2.0, and 3.0 g/d as varying optimal levels of sodium intake: the threshold at which further reductions in intake lead to no further cardiovascular disease benefits.
b. Income categorizations based on the World Bank classification system (http://data.worldbank.org/about/country-classifications/country-and-lending-groups).
Page 28 of 60
https://mc.manuscriptcentral.com/bmj
BMJ
123456789101112131415161718192021222324252627282930313233343536373839404142434445464748495051525354555657585960

Confidential: For Review Only
Figure 1. Cost-effectiveness (I$/DALY) by country of an intervention to reduce sodium consumption by 10%.
30 100 800 5000 30000
Page 29 of 60
https://mc.manuscriptcentral.com/bmj
BMJ
123456789101112131415161718192021222324252627282930313233343536373839404142434445464748495051525354555657585960
Confidential: For Review Only
Figure 2. Cost-effectiveness (I$/DALY as a multiple of GDP per capita) by country of an intervention to reduce sodium consumption by 10%.
0.005 0.03 0.2 0.9 5
Page 30 of 60
https://mc.manuscriptcentral.com/bmj
BMJ
123456789101112131415161718192021222324252627282930313233343536373839404142434445464748495051525354555657585960
Confidential: For Review Only
Figure 3. Affordability of an intervention to reduce sodium reduction by 10% in the world’s 20 most populous countries.
1000 2000 5000 10000 20000 50000
100
200
300
400
500
GDP per capita (I$), log scale
Cost (I$) per DALY
ChinaIndia
USA
Indonesia
Brazil Russian Federation
Japan
Pakistan
Bangladesh
Germany
Nigeria
Mexico
Viet Nam
Italy
Thailand
France
United Kingdom
Philippines
Iran
Turkey
Egypt
Republic of Korea
Spain
Ukraine
Ethiopia
Poland
Myanmar
South Africa
Colombia
Argentina
0.1xGDP/cap0.05xGDP/cap0.01xGDP/cap
Page 31 of 60
https://mc.manuscriptcentral.com/bmj
BMJ
123456789101112131415161718192021222324252627282930313233343536373839404142434445464748495051525354555657585960
Confidential: For Review O
nlyOnline Only Supplemental Materials
eMethods
eDiscussion
Evidence for Optimal Intake Levels and Causal Effects of Sodium
eTable 1. Model components and assumptions for cost-effectiveness analysis of a government
strategy to decrease sodium intake in 183 nations.
eTable 2. Resource needs for sodium reduction intervention for an example country.
eTable 3. Cost-effectiveness by country of a policy intervention to reduce sodium consumption by
10%.
eFigure 1. The relative contributions of intervention components to total cost by income and
geographic region.
eFigure 2. Cost-effectiveness (I$/DALY) by income and geographic region of interventions to reduce
sodium consumption by 10% and 30%.
eFigure 3. Sensitivity analysis of intervention cost assuming 10% and 30% reductions with optimal
intake 2g/day.
Page 32 of 60
https://mc.manuscriptcentral.com/bmj
BMJ
123456789101112131415161718192021222324252627282930313233343536373839404142434445464748495051525354555657585960

Confidential: For Review O
nlyeMethods
Intervention costs
We estimated component-specific resource costs over 10 years across 4 stages of policy development: planning (year 1), development (year 2), partial implementation (years 3-5), and full implementation (years 6-10). Resource needs at each stage were based on the WHO Non-communicable Disease (NCD) Costing Tool,1 which uses an ‘ingredients approach’ to estimation, described in the next section. In the planning stage, resource needs were estimated for preparing an evidence base and launching a public consultation. The development stage included resources for drafting a regulatory code, designing enforcement plans and training programs, and developing a media strategy. Implementation, which begins in year 3, included resources for launching a public information campaign and introducing the regulatory code, followed by staged (partial and then full) regular inspections, enforcement, and media advocacy through year 10. To determine resource needs at each stage, the WHO organized multiple consultations with country-specific program experts and validated their estimates against data from earlier studies. For each stage, quantities were estimated for five categories of resource use: human resources, training, meetings, supplies and equipment, and mass media. Within each category of resource, estimates were made for needs at the central and provincial level. An example of the estimated resource needs for a standardized country of 50 million people, split into provinces of 5 million each, is provided in eTable 2.
The WHO-CHOICE database contains information on salaries, per diem allowances (for training and meetings), media costs, and consumable item prices for each country. These data were estimated from consultation with regional expert teams, supplemented where possible with other sources, including the International Labour Organization database on occupational salaries. Prices of non-traded goods were derived using linear regression models fitted to a multinational dataset, with GDP per capita, region, and education levels among others used as explanatory variables.2
We converted the 2008 WHO NCD Costing Tool estimates to 2012 international dollars by first accounting for local inflation based on World Bank GDP deflator figures,3 then using 2012 PPP exchange rates from the IMF World Economic Outlook Database.4 We also updated the underlying data used to predict non-traded good prices, in particular countries’ GDP per capita.
Global sodium consumption by country, age, and sex
We used estimates of mean sodium consumption and its uncertainty by age and sex for 187 countries from the 2010 Global Burden of Diseases (GBD) project.5 These data were based on 205 national and subnational surveys, covering 66 countries and 74.1% of the global adult population. The main metric used was 24-hour urine collection, which might underestimate intake due to non-urinary (e.g., sweat) losses. An age-integrating Bayesian hierarchical imputation model was used to account for differences in missingness, representativeness, and measurement methods between the surveys, and to quantify sampling and modeling uncertainty. The final uncertainty intervals published represent the 2.5–97.5 percentiles of the posterior distribution of estimated mean sodium intakes for each age/sex stratum in each country, and we used these as inputs to our analysis.
Blood pressure levels by country, age, and sex
We used estimates of mean systolic blood pressure (SBP) levels and their uncertainties by age and sex for 187 countries, also from the 2010 GBP project.6 Data were obtained from published and unpublished health examination surveys and epidemiological studies from around the world, including data from 786 country-years and 5.4 million participants. A Bayesian hierarchical model was developed to obtain estimates for each age-country-year unit. Estimates were made for the years 1980 to 2008; we used the 2008 estimates for our calculations. Similar to the model used for sodium, the model borrowed information across countries, subregions, and regions, according to ‘proximity’ in geography, time, and country-level covariates, doing so to a greater degree when data were non-existent or non-informative. Various sources of uncertainty were quantified and propagated through
Page 33 of 60
https://mc.manuscriptcentral.com/bmj
BMJ
123456789101112131415161718192021222324252627282930313233343536373839404142434445464748495051525354555657585960

Confidential: For Review O
nlythe model. The final uncertainty intervals published represent the 2.5–97.5 percentiles of the posterior distribution of estimated mean SBP, and we used these as inputs to our analysis.
Cardiovascular disease burden by country, age, and sex
We used data on disability-adjusted life years (DALYs) for 11 causes, 7 age groups, both sexes, and 187 countries, also from the 2010 Global Burden of Diseases study.7 These causes were ischemic heart disease (ICD-10 codes I20-I25), ischemic stroke (I63, I65-I67, I69.3), hemorrhagic and other non-ischemic stroke (I60-I62, I69.0-I69.2, I67.4), hypertensive heart disease (I11-I13), aortic aneurysm (I71), rheumatic heart disease (I01, I02.0, I05-I09), endocarditis (I33), atrial fibrillation and flutter (I48), peripheral vascular disease (I73), myocarditis and cardiomyopathy (I40, I42), and other cardiovascular and circulatory diseases. These data were obtained by first estimating cause-specific mortality for 187 countries from 1980 to 2010,89 based on data on causes of death from vital registration, verbal autopsy, mortality surveillance, censuses, surveys, hospitals, police records, and mortuaries worldwide. Next, the prevalence of disease-sequelae (impairments of health resulting from a disease) was estimated by conducting a systematic analysis of published and available unpublished data sources for prevalence, incidence, remission, and excess mortality, and aggregating this data using a Bayesian meta-regression model, developed from those described above. Finally, disability weights were generated using data collected from more than 31,000 respondents via population-based surveys in the USA, Peru, Tanzania, Bangladesh, and Indonesia, and via an open internet survey. Results were found to be consistent across levels of educational attainment and cultural groups.10
Dose-response effects of sodium on BP and of BP on CVD
We used estimates of dose-response effects of sodium on BP and of BP on CVD from recently published meta-analyses. The first used results from 103 randomized trials, with a total of 6,970 subjects, to estimate the blood pressure-lowering effect of sodium reduction. 11 The study tested and confirmed the linearity of the effect, and quantified heterogeneity owing to age, hypertensive status, and race, all of which were found to be significant, and duration of intervention, which was not. We used coefficients estimated in a regression incorporating these first three covariates, together with their standard errors, as inputs to our analysis. The second meta-analysis combined results from the Prospective Studies Collaborative (61 cohorts, 1 million participants, 120,000 deaths) and the Asia Pacific Cohort Studies Collaborative (37 cohorts, 425,000 participants, 6,900 deaths) to estimate the effect of blood pressure on cardiovascular diseases by age.12 A linear relationship between age and log relative risk was found to have the best fit among a range of models. Monte Carlo simulations were used to estimate relative risks and their standard errors. Age-specific relative risks obtained in this way from the different sources were then pooled using a random effects model. We used these age-specific relative risks, together with their standard errors, as inputs to our analysis.
While some prior observational studies suggest a J-shaped relation between sodium intake and CVD, the potential biases of sodium assessment in observational studies are appreciated. These include incomplete 24-hour urine collections among sicker individuals, which causes a spurious association between low estimated intake and disease risk; reverse causation among at-risk subjects, especially those with high blood pressure, who are both at higher risk and also choose to actively lower their sodium; confounding by physical activity, given the strong positive correlation between sodium intake and total energy intake; and confounding by general health and appetite, due to the same strong correlation between sodium intake and total energy intake.
Intervention impact on disability-adjusted life years (DALYs)
Within each age-sex-country stratum, we calculated the proportion of DALYs attributable to CVD that would be averted if the existing distribution of systolic BP were shifted to lower levels due to reduced sodium consumption. We then multiplied this potential impact fraction by the total number of DALYs that were attributable to CVD in 2010. We performed these analyses separately for each subtype of CVD event (e.g., ischemic heart disease, ischemic stroke, hemorrhagic stroke, etc.). We assumed the intervention would scale up linearly over the implementation period, with 10% of the full
Page 34 of 60
https://mc.manuscriptcentral.com/bmj
BMJ
123456789101112131415161718192021222324252627282930313233343536373839404142434445464748495051525354555657585960

Confidential: For Review O
nlyeffect in the first year, 20% in the second, and so on, reaching full efficacy in the final year. We summed these yearly effects, discounting at 3% per year, to calculate the total effect. We assumed no other changes, other than related to the intervention, on global sodium consumption, BP levels, or CVD rates during this period.
Page 35 of 60
https://mc.manuscriptcentral.com/bmj
BMJ
123456789101112131415161718192021222324252627282930313233343536373839404142434445464748495051525354555657585960

Confidential: For Review O
nlyeDiscussion
Strengths of the analysis
Our analysis has several strengths. We used comparable and consistent methods to estimate the cost-effectiveness of a sodium reduction policy intervention for 183 countries. We utilized the most up-to-date available data on age, sex, and country-specific distributions of sodium consumption, BP, and rates of CVD. Effects of sodium reduction on BP were derived from a meta-analysis of randomized controlled trials, accounting for heterogeneity by age, race, and hypertension; and estimates of the age-specific relationship between BP-lowering and CVD was derived from a pooled analysis of established prospective pooling projects. We accounted for a 10-year intervention effect with a realistic scale-up trajectory and reasonable target reductions in sodium. We used a tool developed by the WHO to estimate the different quantities and costs of intervention components by country. These estimates incorporated country-specific demographic, economic, and health data, together with results from cross-country non-traded input price regressions, to produce credible approximations of these prices. We accounted for changes in GDP/capita, price levels, and purchasing power parity between countries. We incorporated uncertainty in all effect input parameters (measures of sodium exposure, distributions of BP, effects of sodium on BP, effects of BP on CVD) by means of Monte Carlo simulations, and evaluated additional uncertainty in intervention effectiveness and intervention costs by means of separate sensitivity analyses.
1 World Health Organization. "Scaling up action against noncommunicable diseases: how much will it cost?" Geneva: World Health Organization (2011). 2 Johns, Benjamin, Taghreed Adam, and David B. Evans. "Enhancing the comparability of costing methods: cross-country variability in the prices of non-traded inputs to health programmes." Cost Effectiveness and
Resource Allocation 4.1 (2006): 8. 3 World Bank World Development Indicators. Accessed at http://data.worldbank.org/indicator/NY.GDP.DEFL.KD.ZG 4 IMF World Economic Outlook Database, April 2013 update. Accessed at
http://www.imf.org/external/pubs/ft/weo/2013/01/weodata/index.aspx 5 Powles J, Fahimi S, Micha R, et al. Global, regional, and national sodium intakes in 1990 and 2010: A systematic analysis of 24-hour urinary sodium excretion and dietary surveys worldwide. BMJ Open 3.12 (2013): e003733. 6 Danaei, Goodarz, et al. "National, regional, and global trends in systolic blood pressure since 1980: systematic
analysis of health examination surveys and epidemiological studies with 786 country-years and 5· 4 million
participants."The Lancet 377.9765 (2011): 568-577. 7 Murray, Christopher JL, et al. "Disability-adjusted life years (DALYs) for 291 diseases and injuries in 21
regions, 1990–2010: a systematic analysis for the Global Burden of Disease Study 2010." The Lancet 380.9859
(2013): 2197-2223. 8 Lozano, Rafael, et al. "Global and regional mortality from 235 causes of death for 20 age groups in 1990 and
2010: a systematic analysis for the Global Burden of Disease Study 2010." The Lancet 380.9859 (2013): 2095-
2128. 9 Lim, Stephen S., et al. "A comparative risk assessment of burden of disease and injury attributable to 67 risk
factors and risk factor clusters in 21 regions, 1990–2010: a systematic analysis for the Global Burden of Disease
Study 2010." The Lancet 380.9859 (2013): 2224-2260. 10 Salomon, Joshua A., et al. "Common values in assessing health outcomes from disease and injury: disability
weights measurement study for the Global Burden of Disease Study 2010." The Lancet 380.9859 (2013): 2129-
2143. 11 Mozaffarian D, Fahimi S, Singh GM, et al. Global sodium consumption and death from cardiovascular causes. New England Journal of Medicine 371 (2014): 624-634. 12 Singh, Gitanjali M., et al. "The Age-Specific Quantitative Effects of Metabolic Risk Factors on
Cardiovascular Diseases and Diabetes: A Pooled Analysis."PloS one 8.7 (2013): e65174.
Page 36 of 60
https://mc.manuscriptcentral.com/bmj
BMJ
123456789101112131415161718192021222324252627282930313233343536373839404142434445464748495051525354555657585960
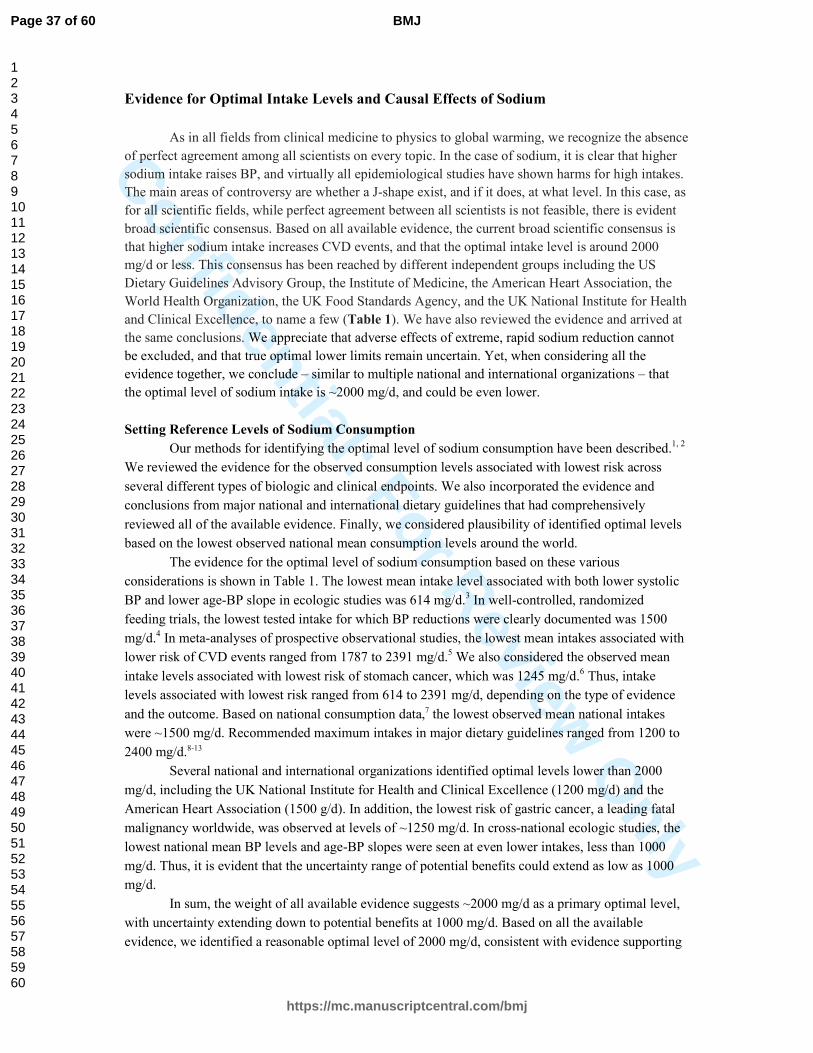
Confidential: For Review O
nlyEvidence for Optimal Intake Levels and Causal Effects of Sodium
As in all fields from clinical medicine to physics to global warming, we recognize the absence
of perfect agreement among all scientists on every topic. In the case of sodium, it is clear that higher
sodium intake raises BP, and virtually all epidemiological studies have shown harms for high intakes.
The main areas of controversy are whether a J-shape exist, and if it does, at what level. In this case, as
for all scientific fields, while perfect agreement between all scientists is not feasible, there is evident
broad scientific consensus. Based on all available evidence, the current broad scientific consensus is
that higher sodium intake increases CVD events, and that the optimal intake level is around 2000
mg/d or less. This consensus has been reached by different independent groups including the US
Dietary Guidelines Advisory Group, the Institute of Medicine, the American Heart Association, the
World Health Organization, the UK Food Standards Agency, and the UK National Institute for Health
and Clinical Excellence, to name a few (Table 1). We have also reviewed the evidence and arrived at
the same conclusions. We appreciate that adverse effects of extreme, rapid sodium reduction cannot
be excluded, and that true optimal lower limits remain uncertain. Yet, when considering all the
evidence together, we conclude – similar to multiple national and international organizations – that
the optimal level of sodium intake is ~2000 mg/d, and could be even lower.
Setting Reference Levels of Sodium Consumption
Our methods for identifying the optimal level of sodium consumption have been described.1, 2
We reviewed the evidence for the observed consumption levels associated with lowest risk across
several different types of biologic and clinical endpoints. We also incorporated the evidence and
conclusions from major national and international dietary guidelines that had comprehensively
reviewed all of the available evidence. Finally, we considered plausibility of identified optimal levels
based on the lowest observed national mean consumption levels around the world.
The evidence for the optimal level of sodium consumption based on these various
considerations is shown in Table 1. The lowest mean intake level associated with both lower systolic
BP and lower age-BP slope in ecologic studies was 614 mg/d.3 In well-controlled, randomized
feeding trials, the lowest tested intake for which BP reductions were clearly documented was 1500
mg/d.4 In meta-analyses of prospective observational studies, the lowest mean intakes associated with
lower risk of CVD events ranged from 1787 to 2391 mg/d.5 We also considered the observed mean
intake levels associated with lowest risk of stomach cancer, which was 1245 mg/d.6 Thus, intake
levels associated with lowest risk ranged from 614 to 2391 mg/d, depending on the type of evidence
and the outcome. Based on national consumption data,7 the lowest observed mean national intakes
were ~1500 mg/d. Recommended maximum intakes in major dietary guidelines ranged from 1200 to
2400 mg/d.8-13
Several national and international organizations identified optimal levels lower than 2000
mg/d, including the UK National Institute for Health and Clinical Excellence (1200 mg/d) and the
American Heart Association (1500 g/d). In addition, the lowest risk of gastric cancer, a leading fatal
malignancy worldwide, was observed at levels of ~1250 mg/d. In cross-national ecologic studies, the
lowest national mean BP levels and age-BP slopes were seen at even lower intakes, less than 1000
mg/d. Thus, it is evident that the uncertainty range of potential benefits could extend as low as 1000
mg/d.
In sum, the weight of all available evidence suggests ~2000 mg/d as a primary optimal level,
with uncertainty extending down to potential benefits at 1000 mg/d. Based on all the available
evidence, we identified a reasonable optimal level of 2000 mg/d, consistent with evidence supporting
Page 37 of 60
https://mc.manuscriptcentral.com/bmj
BMJ
123456789101112131415161718192021222324252627282930313233343536373839404142434445464748495051525354555657585960
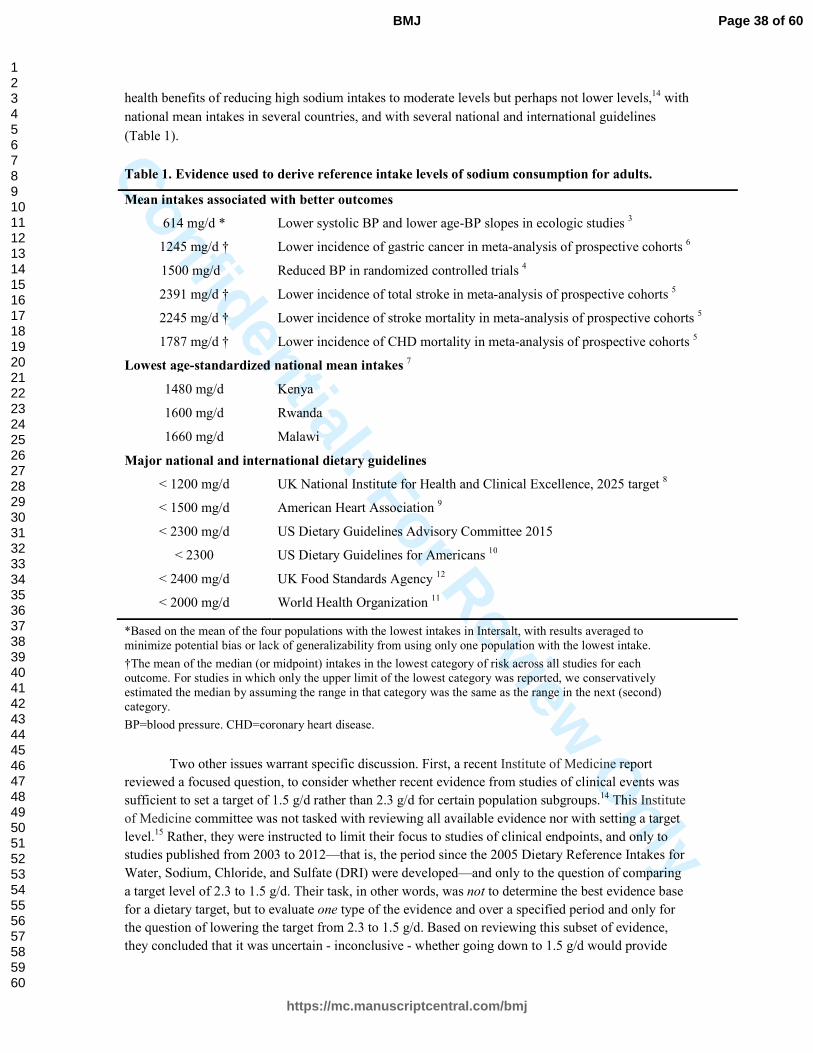
Confidential: For Review O
nlyhealth benefits of reducing high sodium intakes to moderate levels but perhaps not lower levels,14 with
national mean intakes in several countries, and with several national and international guidelines
(Table 1).
Table 1. Evidence used to derive reference intake levels of sodium consumption for adults.
Mean intakes associated with better outcomes
614 mg/d * Lower systolic BP and lower age-BP slopes in ecologic studies 3
1245 mg/d † Lower incidence of gastric cancer in meta-analysis of prospective cohorts 6
1500 mg/d . Reduced BP in randomized controlled trials 4
2391 mg/d † Lower incidence of total stroke in meta-analysis of prospective cohorts 5
2245 mg/d † Lower incidence of stroke mortality in meta-analysis of prospective cohorts 5
1787 mg/d † Lower incidence of CHD mortality in meta-analysis of prospective cohorts 5
Lowest age-standardized national mean intakes 7
1480 mg/d Kenya
1600 mg/d Rwanda
1660 mg/d Malawi
Major national and international dietary guidelines
< 1200 mg/d UK National Institute for Health and Clinical Excellence, 2025 target 8
< 1500 mg/d American Heart Association 9
< 2300 mg/d US Dietary Guidelines Advisory Committee 2015
< 2300 US Dietary Guidelines for Americans 10
< 2400 mg/d UK Food Standards Agency 12
< 2000 mg/d World Health Organization 11
*Based on the mean of the four populations with the lowest intakes in Intersalt, with results averaged to minimize potential bias or lack of generalizability from using only one population with the lowest intake.
†The mean of the median (or midpoint) intakes in the lowest category of risk across all studies for each outcome. For studies in which only the upper limit of the lowest category was reported, we conservatively estimated the median by assuming the range in that category was the same as the range in the next (second) category.
BP=blood pressure. CHD=coronary heart disease.
Two other issues warrant specific discussion. First, a recent Institute of Medicine report
reviewed a focused question, to consider whether recent evidence from studies of clinical events was
sufficient to set a target of 1.5 g/d rather than 2.3 g/d for certain population subgroups.14 This Institute
of Medicine committee was not tasked with reviewing all available evidence nor with setting a target
level.15 Rather, they were instructed to limit their focus to studies of clinical endpoints, and only to
studies published from 2003 to 2012—that is, the period since the 2005 Dietary Reference Intakes for
Water, Sodium, Chloride, and Sulfate (DRI) were developed—and only to the question of comparing
a target level of 2.3 to 1.5 g/d. Their task, in other words, was not to determine the best evidence base
for a dietary target, but to evaluate one type of the evidence and over a specified period and only for
the question of lowering the target from 2.3 to 1.5 g/d. Based on reviewing this subset of evidence,
they concluded that it was uncertain - inconclusive - whether going down to 1.5 g/d would provide
Page 38 of 60
https://mc.manuscriptcentral.com/bmj
BMJ
123456789101112131415161718192021222324252627282930313233343536373839404142434445464748495051525354555657585960
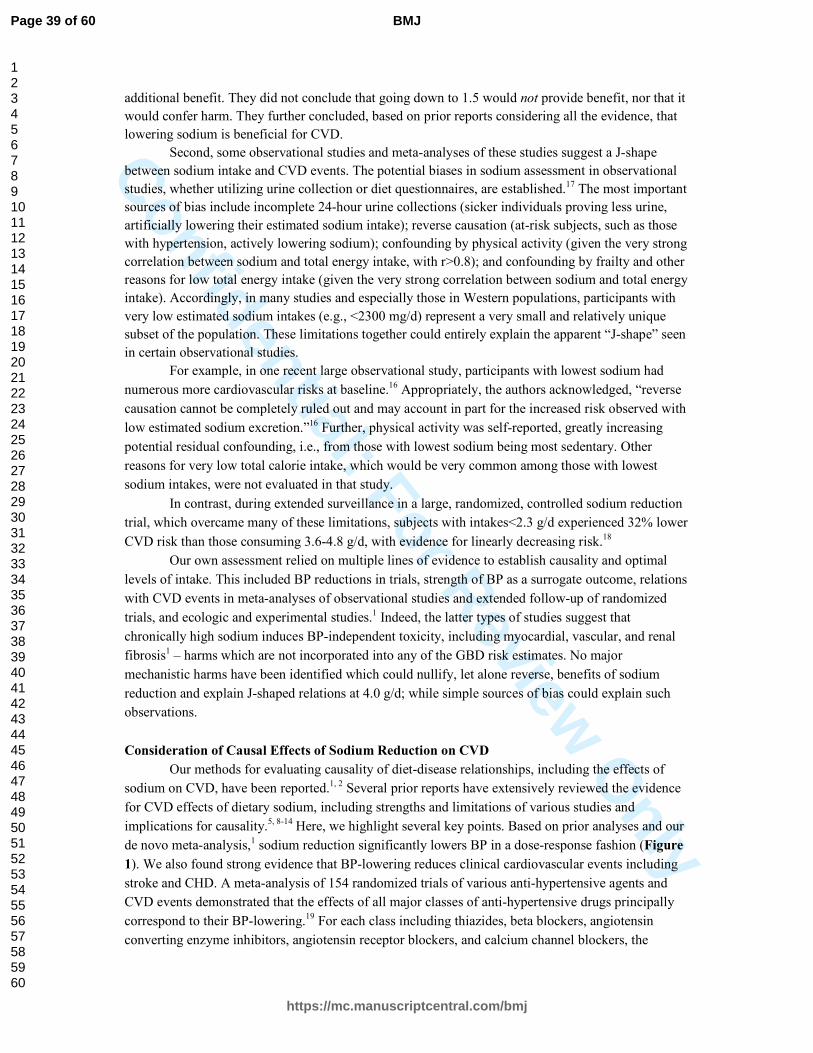
Confidential: For Review O
nlyadditional benefit. They did not conclude that going down to 1.5 would not provide benefit, nor that it
would confer harm. They further concluded, based on prior reports considering all the evidence, that
lowering sodium is beneficial for CVD.
Second, some observational studies and meta-analyses of these studies suggest a J-shape
between sodium intake and CVD events. The potential biases in sodium assessment in observational
studies, whether utilizing urine collection or diet questionnaires, are established.17 The most important
sources of bias include incomplete 24-hour urine collections (sicker individuals proving less urine,
artificially lowering their estimated sodium intake); reverse causation (at-risk subjects, such as those
with hypertension, actively lowering sodium); confounding by physical activity (given the very strong
correlation between sodium and total energy intake, with r>0.8); and confounding by frailty and other
reasons for low total energy intake (given the very strong correlation between sodium and total energy
intake). Accordingly, in many studies and especially those in Western populations, participants with
very low estimated sodium intakes (e.g., <2300 mg/d) represent a very small and relatively unique
subset of the population. These limitations together could entirely explain the apparent “J-shape” seen
in certain observational studies.
For example, in one recent large observational study, participants with lowest sodium had
numerous more cardiovascular risks at baseline.16 Appropriately, the authors acknowledged, “reverse
causation cannot be completely ruled out and may account in part for the increased risk observed with
low estimated sodium excretion.”16 Further, physical activity was self-reported, greatly increasing
potential residual confounding, i.e., from those with lowest sodium being most sedentary. Other
reasons for very low total calorie intake, which would be very common among those with lowest
sodium intakes, were not evaluated in that study.
In contrast, during extended surveillance in a large, randomized, controlled sodium reduction
trial, which overcame many of these limitations, subjects with intakes<2.3 g/d experienced 32% lower
CVD risk than those consuming 3.6-4.8 g/d, with evidence for linearly decreasing risk.18
Our own assessment relied on multiple lines of evidence to establish causality and optimal
levels of intake. This included BP reductions in trials, strength of BP as a surrogate outcome, relations
with CVD events in meta-analyses of observational studies and extended follow-up of randomized
trials, and ecologic and experimental studies.1 Indeed, the latter types of studies suggest that
chronically high sodium induces BP-independent toxicity, including myocardial, vascular, and renal
fibrosis1 – harms which are not incorporated into any of the GBD risk estimates. No major
mechanistic harms have been identified which could nullify, let alone reverse, benefits of sodium
reduction and explain J-shaped relations at 4.0 g/d; while simple sources of bias could explain such
observations.
Consideration of Causal Effects of Sodium Reduction on CVD
Our methods for evaluating causality of diet-disease relationships, including the effects of
sodium on CVD, have been reported.1, 2 Several prior reports have extensively reviewed the evidence
for CVD effects of dietary sodium, including strengths and limitations of various studies and
implications for causality.5, 8-14 Here, we highlight several key points. Based on prior analyses and our
de novo meta-analysis,1 sodium reduction significantly lowers BP in a dose-response fashion (Figure
1). We also found strong evidence that BP-lowering reduces clinical cardiovascular events including
stroke and CHD. A meta-analysis of 154 randomized trials of various anti-hypertensive agents and
CVD events demonstrated that the effects of all major classes of anti-hypertensive drugs principally
correspond to their BP-lowering.19 For each class including thiazides, beta blockers, angiotensin
converting enzyme inhibitors, angiotensin receptor blockers, and calcium channel blockers, the
Page 39 of 60
https://mc.manuscriptcentral.com/bmj
BMJ
123456789101112131415161718192021222324252627282930313233343536373839404142434445464748495051525354555657585960
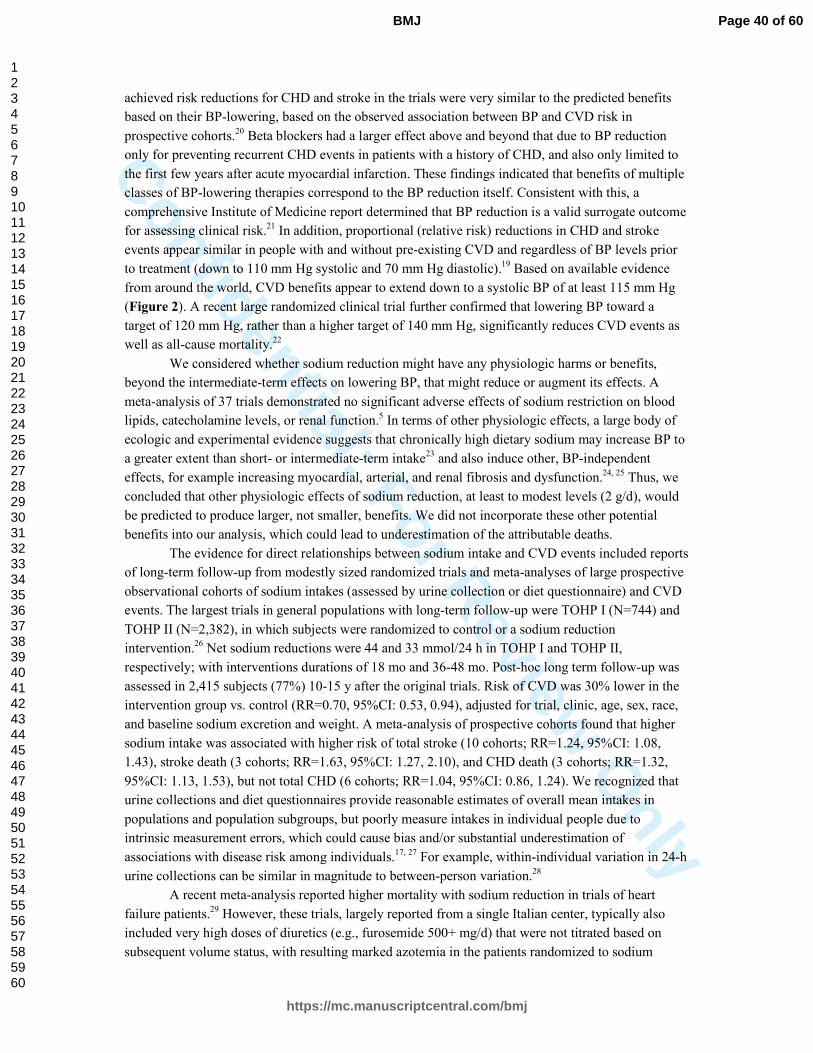
Confidential: For Review O
nlyachieved risk reductions for CHD and stroke in the trials were very similar to the predicted benefits
based on their BP-lowering, based on the observed association between BP and CVD risk in
prospective cohorts.20 Beta blockers had a larger effect above and beyond that due to BP reduction
only for preventing recurrent CHD events in patients with a history of CHD, and also only limited to
the first few years after acute myocardial infarction. These findings indicated that benefits of multiple
classes of BP-lowering therapies correspond to the BP reduction itself. Consistent with this, a
comprehensive Institute of Medicine report determined that BP reduction is a valid surrogate outcome
for assessing clinical risk.21 In addition, proportional (relative risk) reductions in CHD and stroke
events appear similar in people with and without pre-existing CVD and regardless of BP levels prior
to treatment (down to 110 mm Hg systolic and 70 mm Hg diastolic).19 Based on available evidence
from around the world, CVD benefits appear to extend down to a systolic BP of at least 115 mm Hg
(Figure 2). A recent large randomized clinical trial further confirmed that lowering BP toward a
target of 120 mm Hg, rather than a higher target of 140 mm Hg, significantly reduces CVD events as
well as all-cause mortality.22
We considered whether sodium reduction might have any physiologic harms or benefits,
beyond the intermediate-term effects on lowering BP, that might reduce or augment its effects. A
meta-analysis of 37 trials demonstrated no significant adverse effects of sodium restriction on blood
lipids, catecholamine levels, or renal function.5 In terms of other physiologic effects, a large body of
ecologic and experimental evidence suggests that chronically high dietary sodium may increase BP to
a greater extent than short- or intermediate-term intake23 and also induce other, BP-independent
effects, for example increasing myocardial, arterial, and renal fibrosis and dysfunction.24, 25 Thus, we
concluded that other physiologic effects of sodium reduction, at least to modest levels (2 g/d), would
be predicted to produce larger, not smaller, benefits. We did not incorporate these other potential
benefits into our analysis, which could lead to underestimation of the attributable deaths.
The evidence for direct relationships between sodium intake and CVD events included reports
of long-term follow-up from modestly sized randomized trials and meta-analyses of large prospective
observational cohorts of sodium intakes (assessed by urine collection or diet questionnaire) and CVD
events. The largest trials in general populations with long-term follow-up were TOHP I (N=744) and
TOHP II (N=2,382), in which subjects were randomized to control or a sodium reduction
intervention.26 Net sodium reductions were 44 and 33 mmol/24 h in TOHP I and TOHP II,
respectively; with interventions durations of 18 mo and 36-48 mo. Post-hoc long term follow-up was
assessed in 2,415 subjects (77%) 10-15 y after the original trials. Risk of CVD was 30% lower in the
intervention group vs. control (RR=0.70, 95%CI: 0.53, 0.94), adjusted for trial, clinic, age, sex, race,
and baseline sodium excretion and weight. A meta-analysis of prospective cohorts found that higher
sodium intake was associated with higher risk of total stroke (10 cohorts; RR=1.24, 95%CI: 1.08,
1.43), stroke death (3 cohorts; RR=1.63, 95%CI: 1.27, 2.10), and CHD death (3 cohorts; RR=1.32,
95%CI: 1.13, 1.53), but not total CHD (6 cohorts; RR=1.04, 95%CI: 0.86, 1.24). We recognized that
urine collections and diet questionnaires provide reasonable estimates of overall mean intakes in
populations and population subgroups, but poorly measure intakes in individual people due to
intrinsic measurement errors, which could cause bias and/or substantial underestimation of
associations with disease risk among individuals.17, 27 For example, within-individual variation in 24-h
urine collections can be similar in magnitude to between-person variation.28
A recent meta-analysis reported higher mortality with sodium reduction in trials of heart
failure patients.29 However, these trials, largely reported from a single Italian center, typically also
included very high doses of diuretics (e.g., furosemide 500+ mg/d) that were not titrated based on
subsequent volume status, with resulting marked azotemia in the patients randomized to sodium
Page 40 of 60
https://mc.manuscriptcentral.com/bmj
BMJ
123456789101112131415161718192021222324252627282930313233343536373839404142434445464748495051525354555657585960
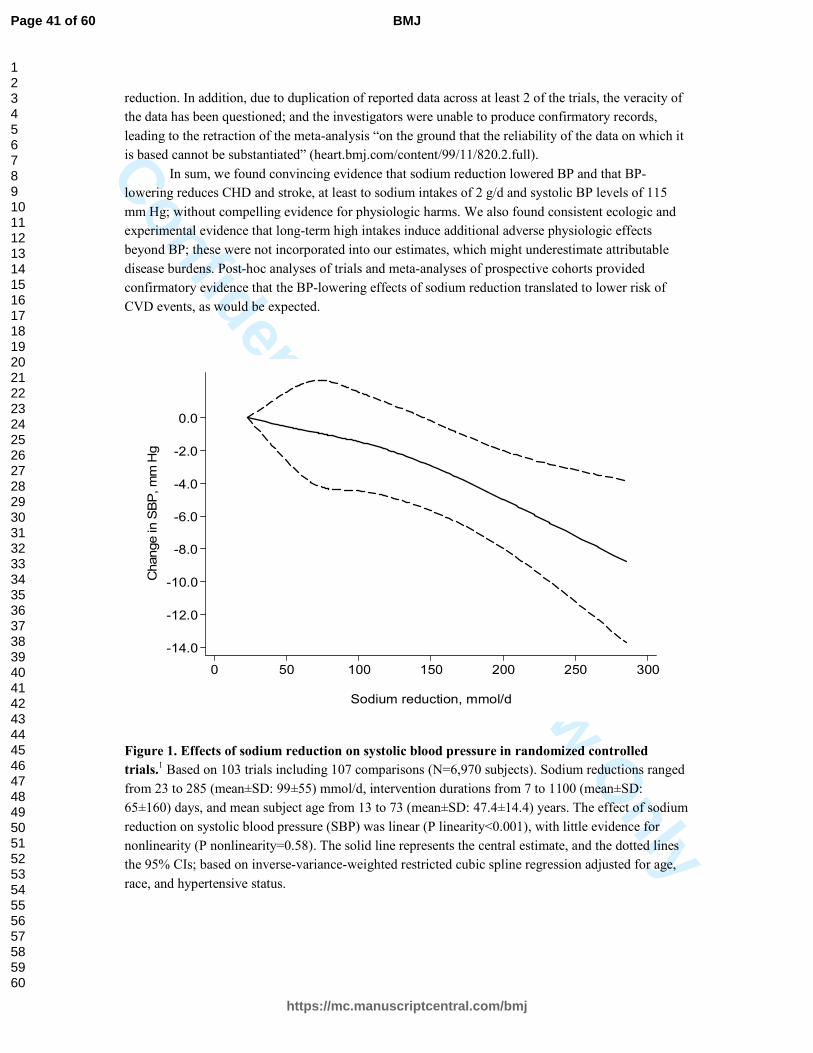
Confidential: For Review O
nlyreduction. In addition, due to duplication of reported data across at least 2 of the trials, the veracity of
the data has been questioned; and the investigators were unable to produce confirmatory records,
leading to the retraction of the meta-analysis “on the ground that the reliability of the data on which it
is based cannot be substantiated” (heart.bmj.com/content/99/11/820.2.full).
In sum, we found convincing evidence that sodium reduction lowered BP and that BP-
lowering reduces CHD and stroke, at least to sodium intakes of 2 g/d and systolic BP levels of 115
mm Hg; without compelling evidence for physiologic harms. We also found consistent ecologic and
experimental evidence that long-term high intakes induce additional adverse physiologic effects
beyond BP; these were not incorporated into our estimates, which might underestimate attributable
disease burdens. Post-hoc analyses of trials and meta-analyses of prospective cohorts provided
confirmatory evidence that the BP-lowering effects of sodium reduction translated to lower risk of
CVD events, as would be expected.
Figure 1. Effects of sodium reduction on systolic blood pressure in randomized controlled
trials.1 Based on 103 trials including 107 comparisons (N=6,970 subjects). Sodium reductions ranged
from 23 to 285 (mean±SD: 99±55) mmol/d, intervention durations from 7 to 1100 (mean±SD:
65±160) days, and mean subject age from 13 to 73 (mean±SD: 47.4±14.4) years. The effect of sodium
reduction on systolic blood pressure (SBP) was linear (P linearity<0.001), with little evidence for
nonlinearity (P nonlinearity=0.58). The solid line represents the central estimate, and the dotted lines
the 95% CIs; based on inverse-variance-weighted restricted cubic spline regression adjusted for age,
race, and hypertensive status.
0.0
-2.0
-4.0
-6.0
-8.0
-10.0
-12.0
-14.0
Change in S
BP
, m
m H
g
0 50 100 150 200 250 300
Sodium reduction, mmol/d
Page 41 of 60
https://mc.manuscriptcentral.com/bmj
BMJ
123456789101112131415161718192021222324252627282930313233343536373839404142434445464748495051525354555657585960

Confidential: For Review O
nly
Figure 2. Dose-response relationship between systolic blood pressure and cardiovascular
mortality, according to age, in one of the pooling projects utilized in our analysis. We quantified
the effects of systolic blood pressure on cardiovascular mortality by combining the results from two
large international pooling projects20, 30 which pooled individual-level data, consistently adjusted for
confounding, and accounted for regression dilution bias based on serial measures of blood pressure
over time.31 This Figures shows the main findings from one of these two pooling projects, based on
individual-level data across 61 prospective observational studies including 958,074 participants, 12.7
million person-years of follow-up, 34,000 coronary (ischemic) heart disease (IHD) deaths, and 12,000
stroke deaths.20 Participants were evaluated in deciles of systolic BP in 10-year age groups, with the
lowest age-BP strata as the reference category. BP levels were adjusted for regression dilution bias
based on serial measures over time. Adjusting for total blood cholesterol and, where available, HDL
and non-HDL cholesterol, diabetes, weight, alcohol consumption, and smoking did not materially
change these findings. Each square represents one age-BP stratum, with its size inversely proportional
to the effective variance of the log mortality rate. The solid lines represent the fitted regression line
for the relationship between BP and coronary heart disease and stroke mortality at each age.
Page 42 of 60
https://mc.manuscriptcentral.com/bmj
BMJ
123456789101112131415161718192021222324252627282930313233343536373839404142434445464748495051525354555657585960
Confidential: For Review O
nlyReferences
1. Mozaffarian D, Fahimi S, Singh GM, Micha R, Khatibzadeh S, Engell RE, Lim S, Danaei G, Ezzati M, Powles J. Global sodium consumption and death from cardiovascular causes. N Engl J Med. 2014;371:624-634
2. Micha R, Kalantarian S, Wirojratana P, Byers T, Danaei G, Elmadfa I, Ding E, Giovannucci E, Powles J, Smith-Warner S, Ezzati M, Mozaffarian D. Estimating the global and regional burden of suboptimal nutrition on chronic disease: methods and inputs to the analysis. Eur J Clin Nutr. 2012;66:119-129
3. INTERSALT Cooperative Research Group. Intersalt: an international study of electrolyte excretion and blood pressure. Results for 24 hour urinary sodium and potassium excretion. Intersalt Cooperative Research Group. BMJ (Clinical research ed). 1988;297:319-328
4. Sacks FM, Svetkey LP, Vollmer WM, Appel LJ, Bray GA, Harsha D, Obarzanek E, Conlin PR, Miller ER, 3rd, Simons-Morton DG, Karanja N, Lin PH. Effects on blood pressure of reduced dietary sodium and the Dietary Approaches to Stop Hypertension (DASH) diet. DASH-Sodium Collaborative Research Group. N Engl J Med. 2001;344:3-10
5. Aburto NJ, Ziolkovska A, Hooper L, Elliott P, Cappuccio FP, Meerpohl JJ. Effect of lower sodium intake on health: systematic review and meta-analyses. BMJ (Clinical research ed). 2013;346:f1326
6. World Cancer Research Fund/ American Institute for Cancer Research. Food, Nutrition, Physical Activity, and the Prevention of Cancer: a Global Perspective. 2007
7. Powles J, Fahimi S, Micha R, Khatibzadeh S, Shi P, Ezzati M, Engell RE, Lim S, Danaei G, Mozaffarian D, On behalf of the Global Burden of Diseases Nutrition and Chronic Diseases Expert Group (NutriCoDE). Global, regional, and national sodium intakes in 1990 and 2010: a systematic analysis of 24 h urinary sodium excretion and dietary surveys worldwide. BMJ
Open. 2013;3:e003733 8. National Institute for Health and Clinical Excellence. Prevention of cardiovascular disease at
population level (NICE public health guidance 25). London: National Institute for Health and Clinical Excellence; 2010.
9. Whelton PK, Appel LJ, Sacco RL, Anderson CA, Antman EM, Campbell N, Dunbar SB, Frohlich ED, Hall JE, Jessup M, Labarthe DR, Macgregor GA, Sacks FM, Stamler J, Vafiadis DK, Van Horn LV. Sodium, blood pressure, and cardiovascular disease: further evidence supporting the american heart association sodium reduction recommendations. Circulation. 2012;126:2880-2889
10. U.S. Department of Agriculture, U.S. Department of Health and Human Services. Dietary Guidelines for Americans, 2010. 2010
11. World Health Organization. WHO Guideline: Sodium intake for adults and children. Geneva: WHO; 2012.
12. Scientific Advisory Committee on Nutrition. Salt and Health. London: The Stationery Office; 2003.
13. Dietary Guidelines Advisory Committee. 2010 Report of the Dietary Guidelines Advisory Committee on the Dietary Guidelines for Americans. 2010. Available at: http://www.cnpp.usda.gov/DGAs2010-DGACReport.htm. Accessed: September 26, 2010.
14. Strom BL, Anderson CA, Ix JH. Sodium reduction in populations: Insights from the Institute of Medicine Committee. JAMA. 2013:1-2
15. Gunn JP, Barron JL, Bowman BA, Merritt RK, Cogswell ME, Angell SY, Bauer UE, Frieden TR. Sodium reduction is a public health priority: reflections on the Institute of Medicine's report, sodium intake in populations: assessment of evidence. Am J Hypertens. 2013;26:1178-1180
16. O'Donnell M, Mente A, Rangarajan S, McQueen MJ, Wang X, Liu L, Yan H, Lee SF, Mony P, Devanath A, Rosengren A, Lopez-Jaramillo P, Diaz R, Avezum A, Lanas F, Yusoff K, Iqbal R, Ilow R, Mohammadifard N, Gulec S, Yusufali AH, Kruger L, Yusuf R, Chifamba J, Kabali C, Dagenais G, Lear SA, Teo K, Yusuf S. Urinary sodium and potassium excretion, mortality, and cardiovascular events. N Engl J Med. 2014;371:612-623
Page 43 of 60
https://mc.manuscriptcentral.com/bmj
BMJ
123456789101112131415161718192021222324252627282930313233343536373839404142434445464748495051525354555657585960

Confidential: For Review O
nly17. Cobb LK, Anderson CA, Elliott P, Hu FB, Liu K, Neaton JD, Whelton PK, Woodward M,
Appel LJ. Methodological issues in cohort studies that relate sodium intake to cardiovascular disease outcomes: a science advisory from the american heart association. Circulation. 2014;129:1173-1186
18. Cook NR, Appel LJ, Whelton PK. Lower levels of sodium intake and reduced cardiovascular risk. Circulation. 2014;129:981-989
19. Law MR, Morris JK, Wald NJ. Use of blood pressure lowering drugs in the prevention of cardiovascular disease: meta-analysis of 147 randomised trials in the context of expectations from prospective epidemiological studies. BMJ (Clinical research ed). 2009;338:b1665
20. Lewington S, Clarke R, Qizilbash N, Peto R, Collins R. Age-specific relevance of usual blood pressure to vascular mortality: a meta-analysis of individual data for one million adults in 61 prospective studies. Lancet. 2002;360:1903-1913
21. Institute of Medicine. Evaluation of Biomarkers and Surrogate Endpoints in Chronic Disease. Washington, DC: National Academies Press; 2010.
22. Wright JT, Jr., Williamson JD, Whelton PK, Snyder JK, Sink KM, Rocco MV, Reboussin DM, Rahman M, Oparil S, Lewis CE, Kimmel PL, Johnson KC, Goff DC, Jr., Fine LJ, Cutler JA, Cushman WC, Cheung AK, Ambrosius WT. A Randomized Trial of Intensive versus Standard Blood-Pressure Control. N Engl J Med. 2015;373:2103-2116
23. Van Vliet BN, Montani JP. The time course of salt-induced hypertension, and why it matters. Int J Obes. 2008;32 Suppl 6:S35-47
24. Sacks FM, Campos H. Dietary therapy in hypertension. N Engl J Med. 2010;362:2102-2112 25. Susic D, Frohlich ED. Salt consumption and cardiovascular, renal, and hypertensive diseases:
clinical and mechanistic aspects. Curr Opin Lipidol. 2012;23:11-16 26. Cook NR, Cutler JA, Obarzanek E, Buring JE, Rexrode KM, Kumanyika SK, Appel LJ,
Whelton PK. Long term effects of dietary sodium reduction on cardiovascular disease outcomes: observational follow-up of the trials of hypertension prevention (TOHP). BMJ
(Clinical research ed). 2007;334:885-888 27. Willett W. Nutritional Epidemiology. New York: Oxford University Press; 1998. 28. Day N, McKeown N, Wong M, Welch A, Bingham S. Epidemiological assessment of diet: a
comparison of a 7-day diary with a food frequency questionnaire using urinary markers of nitrogen, potassium and sodium. Int J Epidemiol. 2001;30:309-317
29. Dinicolantonio JJ, Pasquale PD, Taylor RS, Hackam DG. Low sodium versus normal sodium diets in systolic heart failure: systematic review and meta-analysis. Heart. 2013;Mar 12. Epub ahead of print
30. Lawes CM, Bennett DA, Parag V, Woodward M, Whitlock G, Lam TH, Suh I, Rodgers A. Blood pressure indices and cardiovascular disease in the Asia Pacific region: a pooled analysis. Hypertension. 2003;42:69-75
31. Singh GM, Danaei G, Farzadfar F, Stevens GA, Woodward M, Wormser D, Kaptoge S, Whitlock G, Qiao Q, Lewington S, di Angelantonio E, vander Hoorn S, Lawes CM, Ali MK, Mozaffarian D, Ezzati M, Global Burden of Metabolic Risk Factors of Chronic Diseases Collaborating Group, Asia-Pacific Cohort Studies Collaboration (APCSC), Diabetes Epidemiology: Collaborative analysis of Diagnostic criteria in Europe (DECODE), Emerging Risk Factor Collaboration (ERFC), Prospective Studies Collaboration (PSC). The age-specific quantitative effects of metabolic risk factors on cardiovascular diseases and diabetes: a pooled analysis. PLoS One. 2013;8:e65174
Page 44 of 60
https://mc.manuscriptcentral.com/bmj
BMJ
123456789101112131415161718192021222324252627282930313233343536373839404142434445464748495051525354555657585960

Confidential: For Review Only
eTable 1. Model components and assumptions for cost-effectiveness analysis of a government strategy to decrease sodium intake in 183 nations.
Model
component
Type Source Notes and assumptions
Global sodium consumption levels in 2010 by country, age, and sex
Data input to model
Powles et al. [1]
Based on all available global data from systematic searches for national or subnational data on individual-level sodium intake. Data were obtained from published and unpublished surveys from around the world, including 142 surveys of 24-hour urinary excretion and 103 surveys of estimated sodium intake from 66 countries. Dietary estimates were adjusted to be comparable with 24-hour urine collections using 79 data points from 26 surveys for which both measures were collected. Together with additional covariates including national gross domestic product and United Nations Food and Agricultural Organization food balance sheets in all 183 countries, an age-integrating Bayesian hierarchical model (DisMod III) was used to provide estimated intakes by age and sex, with uncertainty intervals, for all 183 countries, incorporating differences in missingness, representativeness, and measurement methods, and quantifying sampling and modeling uncertainty using an MCMC algorithm with 1000 iterations. The uncertainty intervals used as inputs to the present model represent the 2.5-97.5 percentiles of the posterior distribution of estimated mean sodium intakes, by country, age, and sex.
BP levels in 2010 by country, age, and sex
Data input to model
Danaei et al. as part of the 2010 GBD, as previously summarized [2]
Based on all available global data from systematic searches for national or subnational data on individual-level BP levels. Data were obtained from published and unpublished health examination surveys and epidemiological studies from around the world, including data from 786 country-years and 5.4 million participants. They were converted to the comparable metric of mean systolic BP, if necessary imputed from hypertension prevalence. A Bayesian hierarchical model was used to account for differences in data quality and to quantify sampling and modeling uncertainty, with evaluation by both posterior predictive checks and cross-validation. The uncertainty intervals used as inputs to the present model represent the 2.5-97.5 percentiles of the posterior distribution of estimated mean systolic BP, by country, age, and sex.
CVD mortality in 2010 by country, age, and sex
Data input to CVD-related DALY estimates
Lozano et al. as part of the 2010 GBD, as previously summarized [2]
Data on causes of death were obtained from vital registration, verbal autopsy, mortality surveillance, censuses, surveys, hospitals, police records, and mortuaries worldwide. Causes of death, including CVD, were modeled individually and evaluated using out-of-sample predictive validity tests. Of all causes of death modeled in this way, CVD deaths had the lowest out-of-sample root-mean-square error. Causes were proportionately rescaled such that the sum of cause-specific estimates equaled the all-cause mortality estimate for every age-sex-country-year group.
Burden of CVD in 2010 in disability-adjusted life years (DALYs) by country, age, and sex
Data input to model
Murray et al. as part of the 2010 GBD, as previously summarized [2]
For a given population, DALYs are the sum of years of life lost due to premature mortality (YLLs) and years lived with disability (YLDs). YLLs were calculated by multiplying the number of deaths from the study in the row above by a standard life expectancy computed based on the lowest recorded death rates across countries in 2010. YLDs were computed as the prevalence of different disease-sequelae multiplied by the disability weight for each sequela. The prevalence of sequelae was estimated by conducting a systematic analysis of published and unpublished data sources and aggregating this data using a Bayesian meta-regression model (DisMod-MR). The weights were generated using data collected from more than 31,000 respondents via population-based surveys in the USA, Peru, Tanzania, Bangladesh, and Indonesia, and via an open internet survey. DALYs for CVD by country, age, and sex were used an inputs to our analysis.
Effect of sodium on BP
Parameter input to model
Mozaffarian et al. [2]
A meta-analysis of randomized controlled trials of sodium reduction and BP was conducted based on recent systematic searches and meta-analyses. The main analysis included 103 trials and 6,970 subjects. Sodium reductions ranged from 23 to 285 mmol/day (mean±SD: 99±55), intervention durations from 7 to 1100 days (mean±SD: 65±160), and mean subject age from 13 to 73 years (mean±SD: 47.4±14.4). About two-thirds (64.5%) of comparisons were in hypertensive subjects, and 9.3% in black subjects. The linearity of effects of sodium reduction on BP was evaluated using a semi-parametric restricted cubic spline regression with 4 knots. A likelihood ratio test comparing the model with a simple linear fit revealed no significant difference (p=0.58), while the first coefficient in the spline was strongly significant (p<0.001). This suggested a linear effect. We accounted for differences in effects of sodium on BP by age, hypertensive status, and race, based on meta-regression. In our modeling, we assumed no further BP reduction or cardiovascular benefits for any sodium reduction below a
Page 45 of 60
https://mc.manuscriptcentral.com/bmj
BMJ
123456789101112131415161718192021222324252627282930313233343536373839404142434445464748495051525354555657585960
Confidential: For Review Only
threshold of 2 g/d, with sensitivity analyses varying this threshold from 1 to 3 g/d.
Effect of BP on CVD
Parameter input to model
Singh et al. [3] The effect of BP on cardiovascular events was estimated from the combined data of the large Prospective Studies Collaborative and the Asia Pacific Cohort Studies Collaborative, both observational studies. Relative risks were determined, by age, against a theoretical-minimum-risk exposure distribution of 115 mg Hg for the age groups used in this study using a linear relationship between the log relative risk and the midpoint of age in each age category, which was the model with the best fit among a range of models considered. Overall uncertainty was estimated using a simulation approach, with the regression procedure repeated for each of 1000 draws from a normal distribution characterized by the reported log relative risk and its standard error in the original meta-analyses, and the distributions of these draws used to estimate a single log relative risk and standard error for each age group. The age-specific log relative risks obtained in this way from the different sources were pooled using a random effects model. The age-specific log relative risks are presented in eFigure T1. For adults age 25-34 years, we utilized the observed relative risks for adults age 35-44 years. In our modeling, we assumed no further cardiovascular benefits for any BP reduction below a threshold of 115 mm Hg.
Intervention components and costs
Data input to model
WHO NCD Costing Tool [4]
We modeled the effects and costs of a 10-year “soft regulation” government intervention to reduce population sodium consumption. The intervention program was based on recent experience in the UK [14] and included: (a) government-supported industry agreements to reduce sodium in processed foods, (b) government monitoring of industry compliance, and (c) a public health campaign targeting consumer choices. In the UK, for example, this intervention was based upon collaboration between national government offices focused on nutrition (Food Standards Agency) and health (Ministers of Public Health) together with non-governmental advocacy organizations (Consensus Action on Salt & Health). The program applied sustained pressure on food manufacturers to pursue progressive reformulation, reinforced by food-group-specific targets, independent monitoring, and a sustained media campaign against excess salt intake. The program we modeled was thus more robust and costly than simple “voluntary reformulation”. Intervention components and costs were based on the WHO NCD Costing Tool. The particular “soft regulation” intervention in the present analysis was explicitly costed by the Costing Tool authors. The Costing Tool uses the standard ‘ingredients approach’ developed by the WHO CHOICE project: the units of physical inputs required are assessed for each country and multiplied by the unit price for each input in that country. The Costing Tool authors report that quantities required were estimated using data obtained from a review of relevant publications and supplemented by primary data from WHO program staff in several countries. Within each category of resource (human resources, training, meetings, and mass media), estimates were made for needs at the central and provincial level. A standardized country of 50 million people was assumed, split into provinces of 5 million each. These standardized estimates were then adjusted to reflect the actual population size and administrative composition of each country, though national-level quantities were not adjusted. Scaled quantities were then multiplied by country-specific unit costs. These were taken from the WHO-CHOICE database, which contains estimates of salaries, per diem allowances (for training and meetings), media costs, and consumable item prices for each country. These in turn were predicted using linear regression models fitted to a multinational dataset, with GDP per capita, region, and education levels among other used as explanatory variables. Estimates of uncertainty were made neither for prices nor quantities. As such, this study presents the sensitivity of its final results to variations in cost of between 0.25 and 5 times the baseline estimates. Costs in this study are reported in international dollars, in line with the global cost-effectiveness literature, to enable meaningful comparisons between countries. The WHO NCD Costing Tool reports costs in local currency units for 2008. These were converted to 2012 international dollars by first accounting for local inflation using World Bank GDP deflator figures, then using 2012 PPP exchange rates from the IMF World Economic Outlook Database.
Intervention effects on sodium consumption
Model parameter
Recent experiences with similar intervention programs in the
Plausible intervention effectiveness was informed by experiences in the UK, which achieved 14.7% (0.6 g/d) reduction in population sodium intake over 10 years, and Turkey, which reported a more rapid 16% (1.2 g/d) reduction over 4 years. To incorporate likely differences in effectiveness across countries, we modeled varying intervention effectiveness – including 10% and 30% proportional reductions and 0.5 g/d and 1.5 g/d absolute reductions in sodium intake over 10 years. We assumed similar average effects for each age and sex stratum with a country, in the absence of compelling data otherwise by nation. In
Page 46 of 60
https://mc.manuscriptcentral.com/bmj
BMJ
123456789101112131415161718192021222324252627282930313233343536373839404142434445464748495051525354555657585960
Confidential: For Review Only
UK [5] and Turkey [6]
all cases, the intervention was assumed to scale up linearly over the implementation period, having 10% of the full effect in the first year, 20% in the second, and so on, reaching full efficacy in the final year. Past experiences with additives (e.g., trans fat) suggest that some companies begin reformulations early, as soon as they see any major government action looming, while other companies start later. Moreover, for some products, immediate small reductions are feasible, with more significant reduction taking more time. Thus, assuming an approximately even effect over time is reasonable and consistent with empirical experiences. The 10-year period was selected based on the approximate period of the UK intervention, and its results, to date. A shorter period could bias choices against programs that take a number of years of activity to start accumulating meaningful benefits. Much longer periods could be unrealistic for many government decisions, as the time horizon of policy decision-makers is often rather short.
Intervention effects on DALYs
Model calculation
Comparative risk assessment framework [2]
The data inputs described above were combined to produce estimates of the intervention effects for each age-sex-country stratum, additionally accounting for differences in effects of sodium on BP by hypertensive status (by estimating the proportional of hypertensive subjects within each stratum, based on the mean and SD of BP levels in that stratum) and for differences in effects of sodium on BP by race (utilizing this stronger effect in African nations, and not accounting for small proportions of people of Black race in other nations, which would underestimate the true impact of sodium reduction in those nations). The estimated DALYs attributable to current sodium intake in each stratum were calculated from the population attributable fraction (PAF) of CVD mortality attributable to current sodium intake, multiplying the PAF by the number of DALYs attributable to CVD in that stratum. The same procedure was used to calculate the estimated DALYs attributable to counterfactual sodium intake under the selected intervention (proportional or absolute sodium reductions, described above). The difference between these two estimates, summed across countries and regions, represents the estimated effect of the intervention, which was then evenly scaled over 10 years. Uncertainty was quantified using Monte Carlo simulation. For each of 1000 simulations, a draw was made from the (uncertainty) distributions of sodium intake for each country-age-sex stratum, of the sodium-BP effect for each country-age-sex stratum (accounting for hypertensive status and race, as above), and the effects of BP on each disease outcome of interest. Each draw was used to calculate for each stratum both the DALYs attributable to current sodium intake and the DALYs attributable to the counterfactual sodium intake, with the difference between these two numbers taken to be one simulated intervention effect for that stratum. The uncertainty intervals for each stratum then represent the 2.5-97.5 percentiles of the distribution of the intervention effects estimated across all 1000 simulations for that stratum.
Intervention cost-effectiveness
Model calculation
N/A The cost-effectiveness of the intervention is calculated by dividing the total cost of the intervention by its total effect over the intervention period, with both cost and effect discounted at 3% per year, and effects scaled linearly over 10 years as described above.
BP = blood pressure. CVD = cardiovascular disease. GBD = Global Burden of Diseases study.
1. Powles J, Fahimi S, Micha R, et al. Global, regional and national sodium intakes in 1990 and 2010: a systematic analysis of 24 h urinary sodium excretion and dietary surveys
worldwide. BMJ open 2013;3(12):e003733 doi: 10.1136/bmjopen-2013-003733[published Online First: Epub Date]|.
2. Mozaffarian D, Fahimi S, Singh GM, et al. Global sodium consumption and death from cardiovascular causes. N Engl J Med 2014;371(7):624-34 doi:
10.1056/NEJMoa1304127[published Online First: Epub Date]|.
3. Singh GM, Danaei G, Farzadfar F, et al. The age-specific quantitative effects of metabolic risk factors on cardiovascular diseases and diabetes: a pooled analysis. PLoS One
2013;8(7):e65174 doi: 10.1371/journal.pone.0065174[published Online First: Epub Date]|.
4. Johns B, Baltussen R, Hutubessy R. Programme costs in the economic evaluation of health interventions. Cost Eff Resour Alloc 2003;1(1):1
5. Sadler K, Nicholson S, Steer T, et al. National Diet and Nutrition Survey - Assessment of dietary sodium in adults (aged 19 to 64 years) in England, 2011. UK Department of
Health, 2012.
6. WHO News. Progress in reducing salt consumption in Turkey. http://www.euro.who.int/en/what-we-do/health-topics/disease-prevention/nutrition/news/news/2013/04/progress-
in-reducing-salt-consumption-in-turkey (accessed 28 May, 2016).
Page 47 of 60
https://mc.manuscriptcentral.com/bmj
BMJ
123456789101112131415161718192021222324252627282930313233343536373839404142434445464748495051525354555657585960

Confidential: For Review O
nly
eFigure T1. Relative risks (RRs) by age for cardiovascular diseases according to systolic blood pressure (SBP).
Reproduced with permission from Singh et al., PLoS One 2013;8(7):e65174.[3]
Page 48 of 60
https://mc.manuscriptcentral.com/bmj
BMJ
123456789101112131415161718192021222324252627282930313233343536373839404142434445464748495051525354555657585960

Confidential: For Review Only
eTable 2. Resource needs for sodium reduction intervention for an examplea country.
Planning
(year 1)
Development
(year 2)
Partial implementation
(years 3-5)
Full implementation
(years 6-10)
Administrative level National Province National Province National Province National Province
(Standardized population, in millions) (50m) (5m) (50m) (5m) (50m) (5m) (50m) (5m)
HUMAN RESOURCES
(incl. consultants) Roles / responsibilities FTEb FTE FTE FTE FTE FTE FTE FTE Program management
Director Oversight; Monitoring; Reporting 0.125 0.0625 0.125 0.0625 0.125 0.0625 0.125 0.0625 Manager Oversight; Monitoring; Reporting 0.25 0.125 0.25 0.125 0.25 0.125 0.25 0.125 Administrative officer Data collection; Monitoring 0.5 0.25 0.5 0.25 0.5 0.25 0.5 0.25 Clerical officer Data collection; Monitoring 1 0.5 1 0.5 1 0.5 1 0.5 Secretary Office support 0.9 0.4 0.9 0.4 0.9 0.4 0.9 0.4
Accountant Financial data entry/analysis 0.25 0.125 0.25 0.125 0.25 0.125 0.25 0.125 I.T. computing manager I.T. support 0.125 0.0625 0.125 0.0625 0.125 0.0625 0.125 0.0625 I.T. computing officer I.T. support 0.25 0.125 0.25 0.125 0.25 0.125 0.25 0.125 Cleaner General office maintenance 0.25 0 0.25 0 0.25 0 0.25 0 Subtotal 3.6 1.7 3.6 1.7 3.6 1.7 3.6 1.7 Promotion / media / advocacy
Public health specialist Advocacy; Dissemination 0.25 0.125 0.25 0.25 0.25 0.125 0.25 0.125 Public health officer Admin / research support 0.5 0.25 0.5 0.5 0.5 0.25 0.5 0.25 Health educator/trainer Advocacy; Dissemination 0.5 0.25 0.5 0.5 0.5 0.25 0.5 0.25
Public Relations Manager 0.25 0.25 0.25 0.25 0.25 0.25 0.25 0.25 Public Relations Officer 0.5 0.5 0.5 0.5 0.5 0.5 0.5 0.5
Subtotal 2.0 1.4 2.0 2.0 2.0 1.4 2.0 1.4 Law enforcement / inspection
Superintendent Supervision of new (voluntary) code 0.25 0.25 0.5 0.5 0.5 0.5 Enforcement / health safety officer Inspection 1 1 2 2 2 2 Lawyer Development of new code 1 0.5 1 0.25 0.25 0.125 0.25 0.125 Legal Officer Development of new code 2 1 2 0.5 0.5 0.25 0.5 0.25 Transport manager Transport support 0.2 0.1 0.3 0.1 0.2 0.1 0.2 0.1 Transport driver Transport support 0.9 0.5 1.1 0.6 0.8 0.6 0.8 0.6 Subtotal 4.2 2.2 5.6 2.7 4.3 3.6 4.3 3.6
National-level technical
assistance (local planning / implementation) International consultant (No. of 5-day trips p.a.) 2 2 1 1
TOTAL HUMAN RESOURCES 9.8 5.2 11.2 6.4 9.9 6.7 9.9 6.7
a. Example country is assumed to have a population of 50 million, split into provinces of 5 million each. a. Full-time equivalent.
Page 49 of 60
https://mc.manuscriptcentral.com/bmj
BMJ
123456789101112131415161718192021222324252627282930313233343536373839404142434445464748495051525354555657585960
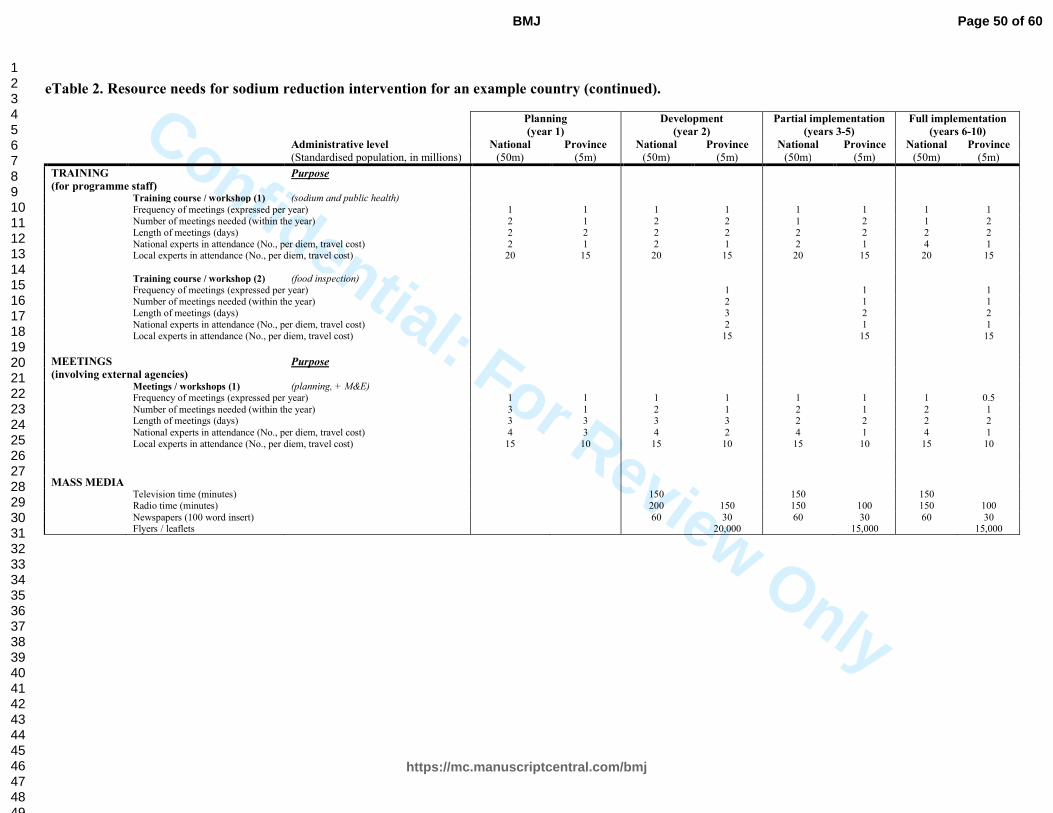
Confidential: For Review Only
eTable 2. Resource needs for sodium reduction intervention for an example country (continued).
Planning
(year 1)
Development
(year 2)
Partial implementation
(years 3-5)
Full implementation
(years 6-10)
Administrative level National Province National Province National Province National Province
(Standardised population, in millions) (50m) (5m) (50m) (5m) (50m) (5m) (50m) (5m)
TRAINING Purpose
(for programme staff) Training course / workshop (1) (sodium and public health)
Frequency of meetings (expressed per year) 1 1 1 1 1 1 1 1 Number of meetings needed (within the year) 2 1 2 2 1 2 1 2 Length of meetings (days) 2 2 2 2 2 2 2 2 National experts in attendance (No., per diem, travel cost) 2 1 2 1 2 1 4 1 Local experts in attendance (No., per diem, travel cost) 20 15 20 15 20 15 20 15
Training course / workshop (2) (food inspection) Frequency of meetings (expressed per year) 1 1 1 Number of meetings needed (within the year) 2 1 1 Length of meetings (days) 3 2 2 National experts in attendance (No., per diem, travel cost) 2 1 1 Local experts in attendance (No., per diem, travel cost) 15 15 15
MEETINGS Purpose (involving external agencies) Meetings / workshops (1) (planning, + M&E)
Frequency of meetings (expressed per year) 1 1 1 1 1 1 1 0.5
Number of meetings needed (within the year) 3 1 2 1 2 1 2 1 Length of meetings (days) 3 3 3 3 2 2 2 2
National experts in attendance (No., per diem, travel cost) 4 3 4 2 4 1 4 1 Local experts in attendance (No., per diem, travel cost) 15 10 15 10 15 10 15 10
MASS MEDIA
Television time (minutes) 150 150 150 Radio time (minutes) 200 150 150 100 150 100
Newspapers (100 word insert) 60 30 60 30 60 30 Flyers / leaflets 20,000 15,000 15,000
Page 50 of 60
https://mc.manuscriptcentral.com/bmj
BMJ
123456789101112131415161718192021222324252627282930313233343536373839404142434445464748495051525354555657585960
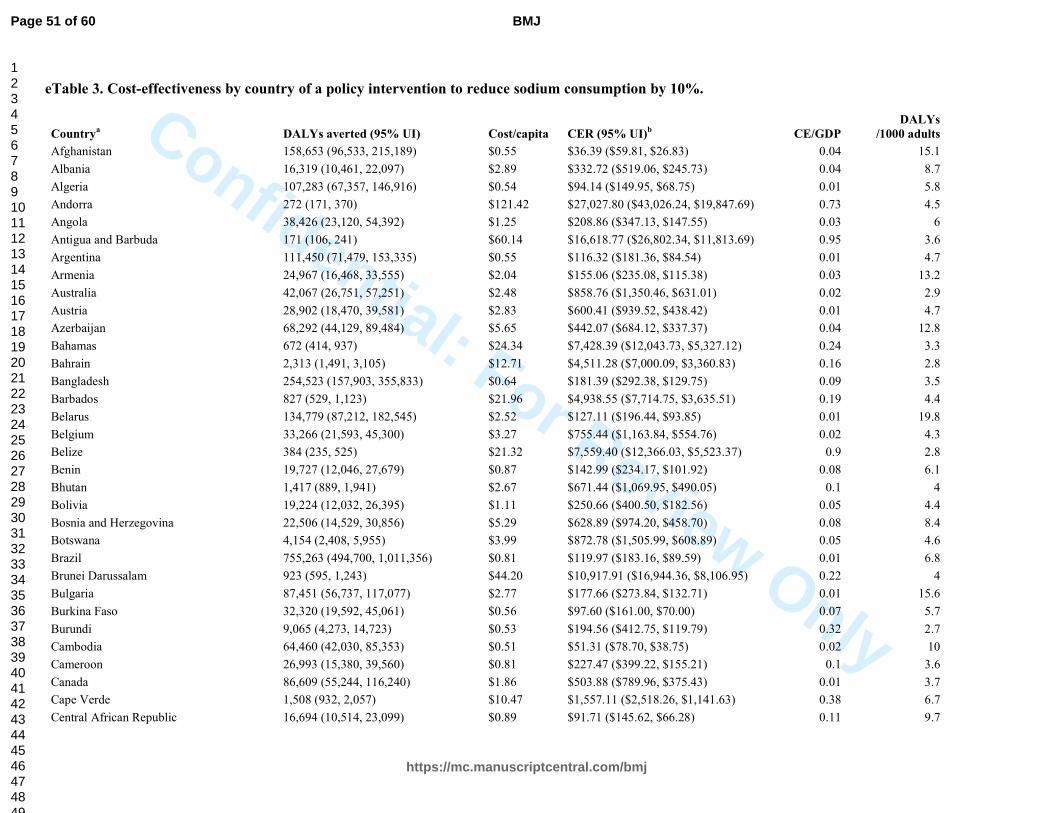
Confidential: For Review Only
eTable 3. Cost-effectiveness by country of a policy intervention to reduce sodium consumption by 10%.
Countrya DALYs averted (95% UI) Cost/capita CER (95% UI)
b CE/GDP
DALYs
/1000 adults
Afghanistan 158,653 (96,533, 215,189) $0.55 $36.39 ($59.81, $26.83) 0.04 15.1
Albania 16,319 (10,461, 22,097) $2.89 $332.72 ($519.06, $245.73) 0.04 8.7
Algeria 107,283 (67,357, 146,916) $0.54 $94.14 ($149.95, $68.75) 0.01 5.8
Andorra 272 (171, 370) $121.42 $27,027.80 ($43,026.24, $19,847.69) 0.73 4.5
Angola 38,426 (23,120, 54,392) $1.25 $208.86 ($347.13, $147.55) 0.03 6
Antigua and Barbuda 171 (106, 241) $60.14 $16,618.77 ($26,802.34, $11,813.69) 0.95 3.6
Argentina 111,450 (71,479, 153,335) $0.55 $116.32 ($181.36, $84.54) 0.01 4.7
Armenia 24,967 (16,468, 33,555) $2.04 $155.06 ($235.08, $115.38) 0.03 13.2
Australia 42,067 (26,751, 57,251) $2.48 $858.76 ($1,350.46, $631.01) 0.02 2.9
Austria 28,902 (18,470, 39,581) $2.83 $600.41 ($939.52, $438.42) 0.01 4.7
Azerbaijan 68,292 (44,129, 89,484) $5.65 $442.07 ($684.12, $337.37) 0.04 12.8
Bahamas 672 (414, 937) $24.34 $7,428.39 ($12,043.73, $5,327.12) 0.24 3.3
Bahrain 2,313 (1,491, 3,105) $12.71 $4,511.28 ($7,000.09, $3,360.83) 0.16 2.8
Bangladesh 254,523 (157,903, 355,833) $0.64 $181.39 ($292.38, $129.75) 0.09 3.5
Barbados 827 (529, 1,123) $21.96 $4,938.55 ($7,714.75, $3,635.51) 0.19 4.4
Belarus 134,779 (87,212, 182,545) $2.52 $127.11 ($196.44, $93.85) 0.01 19.8
Belgium 33,266 (21,593, 45,300) $3.27 $755.44 ($1,163.84, $554.76) 0.02 4.3
Belize 384 (235, 525) $21.32 $7,559.40 ($12,366.03, $5,523.37) 0.9 2.8
Benin 19,727 (12,046, 27,679) $0.87 $142.99 ($234.17, $101.92) 0.08 6.1
Bhutan 1,417 (889, 1,941) $2.67 $671.44 ($1,069.95, $490.05) 0.1 4
Bolivia 19,224 (12,032, 26,395) $1.11 $250.66 ($400.50, $182.56) 0.05 4.4
Bosnia and Herzegovina 22,506 (14,529, 30,856) $5.29 $628.89 ($974.20, $458.70) 0.08 8.4
Botswana 4,154 (2,408, 5,955) $3.99 $872.78 ($1,505.99, $608.89) 0.05 4.6
Brazil 755,263 (494,700, 1,011,356) $0.81 $119.97 ($183.16, $89.59) 0.01 6.8
Brunei Darussalam 923 (595, 1,243) $44.20 $10,917.91 ($16,944.36, $8,106.95) 0.22 4
Bulgaria 87,451 (56,737, 117,077) $2.77 $177.66 ($273.84, $132.71) 0.01 15.6
Burkina Faso 32,320 (19,592, 45,061) $0.56 $97.60 ($161.00, $70.00) 0.07 5.7
Burundi 9,065 (4,273, 14,723) $0.53 $194.56 ($412.75, $119.79) 0.32 2.7
Cambodia 64,460 (42,030, 85,353) $0.51 $51.31 ($78.70, $38.75) 0.02 10
Cameroon 26,993 (15,380, 39,560) $0.81 $227.47 ($399.22, $155.21) 0.1 3.6
Canada 86,609 (55,244, 116,240) $1.86 $503.88 ($789.96, $375.43) 0.01 3.7
Cape Verde 1,508 (932, 2,057) $10.47 $1,557.11 ($2,518.26, $1,141.63) 0.38 6.7
Central African Republic 16,694 (10,514, 23,099) $0.89 $91.71 ($145.62, $66.28) 0.11 9.7
Page 51 of 60
https://mc.manuscriptcentral.com/bmj
BMJ
123456789101112131415161718192021222324252627282930313233343536373839404142434445464748495051525354555657585960

Confidential: For Review Only
Chad 22,085 (13,373, 30,675) $0.94 $166.73 ($275.35, $120.04) 0.08 5.6
Chile 26,986 (16,976, 37,911) $1.03 $386.38 ($614.21, $275.04) 0.02 2.7
China 6,598,540 (4,460,556, 8,624,043) $0.87 $112.76 ($166.80, $86.27) 0.01 7.7
Colombia 105,836 (70,158, 140,949) $0.65 $151.59 ($228.69, $113.83) 0.01 4.3
Comoros 542 (270, 896) $5.15 $2,740.90 ($5,501.36, $1,657.86) 2.11 1.9
Congo 11,034 (6,148, 16,306) $1.87 $273.78 ($491.40, $185.27) 0.06 6.8
Costa Rica 6,567 (4,112, 9,075) $1.89 $754.64 ($1,205.20, $546.10) 0.06 2.5
Côte d'Ivoire 65,684 (39,219, 91,670) $0.73 $85.34 ($142.92, $61.15) 0.05 8.6
Croatia 27,603 (17,355, 37,275) $2.26 $262.60 ($417.68, $194.47) 0.01 8.6
Cuba 30,666 (19,183, 43,265) $0.90 $225.83 ($361.01, $160.06) 0.02 4
Cyprus 2,499 (1,630, 3,396) $15.07 $3,004.96 ($4,606.02, $2,211.14) 0.11 5
Czech Republic 59,174 (38,802, 79,566) $1.80 $234.06 ($356.95, $174.08) 0.01 7.7
Democratic People's Republic of Korea 131,411 (83,091, 179,293) $0.31 $35.58 ($56.28, $26.08) 0.02 8.8
Democratic Republic of the Congo 142,703 (84,788, 207,796) $0.51 $79.55 ($133.89, $54.63) 0.2 6.5
Denmark 15,502 (10,022, 21,436) $3.50 $868.67 ($1,343.72, $628.20) 0.02 4
Djibouti 1,840 (1,077, 2,660) $4.92 $1,011.93 ($1,729.21, $699.98) 0.37 4.9
Dominica 140 (85, 196) $50.03 $14,194.71 ($23,422.99, $10,111.66) 0.97 3.5
Dominican Republic 21,721 (13,216, 30,916) $0.90 $206.79 ($339.86, $145.29) 0.02 4.4
Ecuador 19,709 (12,102, 28,019) $0.84 $313.01 ($509.77, $220.18) 0.04 2.7
Egypt 455,019 (287,380, 624,452) $0.63 $54.78 ($86.73, $39.91) 0.01 11.5
El Salvador 9,381 (5,739, 13,236) $1.39 $424.80 ($694.37, $301.06) 0.06 3.3
Equatorial Guinea 1,259 (710, 1,876) $21.54 $4,956.41 ($8,786.29, $3,324.73) 0.25 4.3
Eritrea 9,945 (5,754, 14,519) $1.04 $209.13 ($361.42, $143.24) 0.26 4.9
Estonia 10,405 (6,738, 13,983) $17.00 $1,555.00 ($2,401.25, $1,157.14) 0.07 10.9
Ethiopia 127,441 (76,004, 187,775) $0.49 $120.00 ($201.22, $81.44) 0.1 4.1
Fiji 4,037 (2,396, 5,833) $3.82 $427.99 ($720.97, $296.21) 0.09 8.9
Finland 22,091 (14,431, 29,758) $3.82 $659.14 ($1,009.06, $489.32) 0.02 5.8
France 147,200 (95,540, 198,883) $1.72 $506.75 ($780.75, $375.06) 0.01 3.4
Gabon 2,855 (1,447, 4,370) $5.42 $1,239.27 ($2,445.36, $809.84) 0.07 4.4
Gambia 3,849 (2,343, 5,315) $2.42 $385.74 ($633.61, $279.32) 0.2 6.3
Georgia 63,063 (41,707, 82,849) $1.33 $61.47 ($92.95, $46.79) 0.01 21.6
Germany 299,996 (190,382, 407,770) $1.51 $311.28 ($490.49, $229.01) 0.01 4.8
Ghana 58,679 (34,476, 85,086) $0.64 $110.67 ($188.35, $76.32) 0.03 5.8
Greece 49,044 (30,988, 67,584) $2.10 $364.13 ($576.30, $264.24) 0.01 5.8
Grenada 266 (164, 380) $51.37 $10,071.49 ($16,394.71, $7,054.24) 0.71 5.1
Guatemala 14,381 (8,813, 20,302) $0.96 $366.91 ($598.74, $259.90) 0.07 2.6
Page 52 of 60
https://mc.manuscriptcentral.com/bmj
BMJ
123456789101112131415161718192021222324252627282930313233343536373839404142434445464748495051525354555657585960
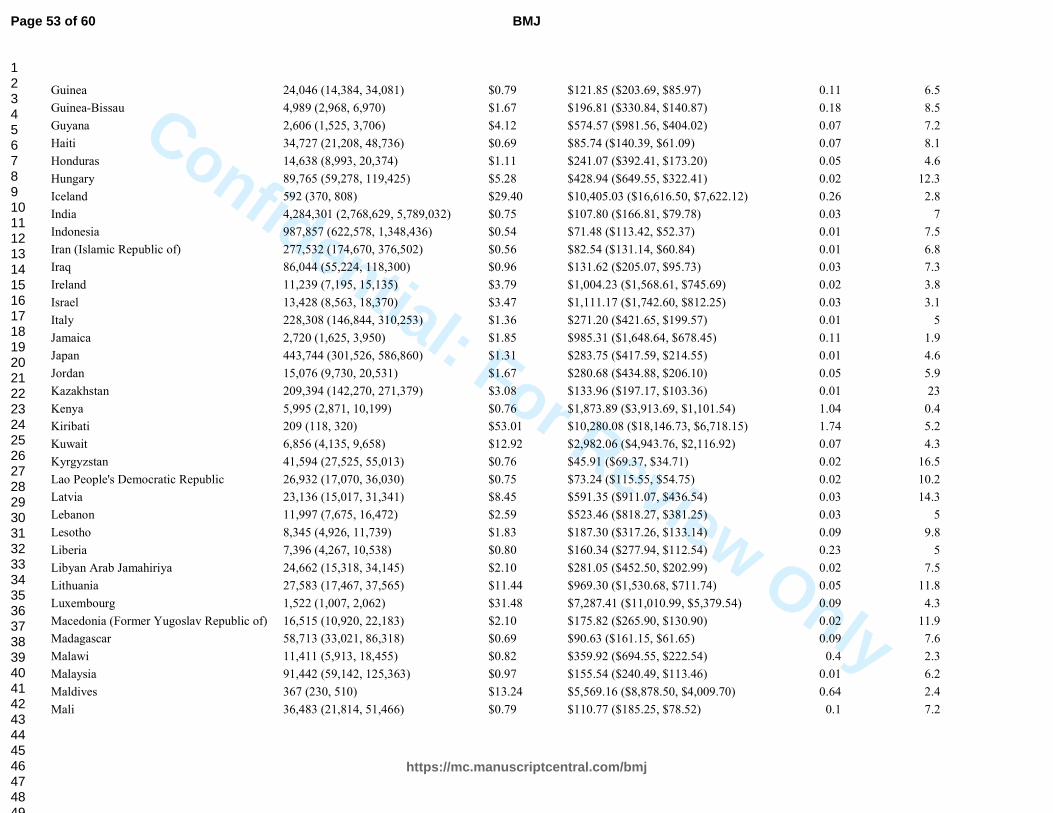
Confidential: For Review Only
Guinea 24,046 (14,384, 34,081) $0.79 $121.85 ($203.69, $85.97) 0.11 6.5
Guinea-Bissau 4,989 (2,968, 6,970) $1.67 $196.81 ($330.84, $140.87) 0.18 8.5
Guyana 2,606 (1,525, 3,706) $4.12 $574.57 ($981.56, $404.02) 0.07 7.2
Haiti 34,727 (21,208, 48,736) $0.69 $85.74 ($140.39, $61.09) 0.07 8.1
Honduras 14,638 (8,993, 20,374) $1.11 $241.07 ($392.41, $173.20) 0.05 4.6
Hungary 89,765 (59,278, 119,425) $5.28 $428.94 ($649.55, $322.41) 0.02 12.3
Iceland 592 (370, 808) $29.40 $10,405.03 ($16,616.50, $7,622.12) 0.26 2.8
India 4,284,301 (2,768,629, 5,789,032) $0.75 $107.80 ($166.81, $79.78) 0.03 7
Indonesia 987,857 (622,578, 1,348,436) $0.54 $71.48 ($113.42, $52.37) 0.01 7.5
Iran (Islamic Republic of) 277,532 (174,670, 376,502) $0.56 $82.54 ($131.14, $60.84) 0.01 6.8
Iraq 86,044 (55,224, 118,300) $0.96 $131.62 ($205.07, $95.73) 0.03 7.3
Ireland 11,239 (7,195, 15,135) $3.79 $1,004.23 ($1,568.61, $745.69) 0.02 3.8
Israel 13,428 (8,563, 18,370) $3.47 $1,111.17 ($1,742.60, $812.25) 0.03 3.1
Italy 228,308 (146,844, 310,253) $1.36 $271.20 ($421.65, $199.57) 0.01 5
Jamaica 2,720 (1,625, 3,950) $1.85 $985.31 ($1,648.64, $678.45) 0.11 1.9
Japan 443,744 (301,526, 586,860) $1.31 $283.75 ($417.59, $214.55) 0.01 4.6
Jordan 15,076 (9,730, 20,531) $1.67 $280.68 ($434.88, $206.10) 0.05 5.9
Kazakhstan 209,394 (142,270, 271,379) $3.08 $133.96 ($197.17, $103.36) 0.01 23
Kenya 5,995 (2,871, 10,199) $0.76 $1,873.89 ($3,913.69, $1,101.54) 1.04 0.4
Kiribati 209 (118, 320) $53.01 $10,280.08 ($18,146.73, $6,718.15) 1.74 5.2
Kuwait 6,856 (4,135, 9,658) $12.92 $2,982.06 ($4,943.76, $2,116.92) 0.07 4.3
Kyrgyzstan 41,594 (27,525, 55,013) $0.76 $45.91 ($69.37, $34.71) 0.02 16.5
Lao People's Democratic Republic 26,932 (17,070, 36,030) $0.75 $73.24 ($115.55, $54.75) 0.02 10.2
Latvia 23,136 (15,017, 31,341) $8.45 $591.35 ($911.07, $436.54) 0.03 14.3
Lebanon 11,997 (7,675, 16,472) $2.59 $523.46 ($818.27, $381.25) 0.03 5
Lesotho 8,345 (4,926, 11,739) $1.83 $187.30 ($317.26, $133.14) 0.09 9.8
Liberia 7,396 (4,267, 10,538) $0.80 $160.34 ($277.94, $112.54) 0.23 5
Libyan Arab Jamahiriya 24,662 (15,318, 34,145) $2.10 $281.05 ($452.50, $202.99) 0.02 7.5
Lithuania 27,583 (17,467, 37,565) $11.44 $969.30 ($1,530.68, $711.74) 0.05 11.8
Luxembourg 1,522 (1,007, 2,062) $31.48 $7,287.41 ($11,010.99, $5,379.54) 0.09 4.3
Macedonia (Former Yugoslav Republic of) 16,515 (10,920, 22,183) $2.10 $175.82 ($265.90, $130.90) 0.02 11.9
Madagascar 58,713 (33,021, 86,318) $0.69 $90.63 ($161.15, $61.65) 0.09 7.6
Malawi 11,411 (5,913, 18,455) $0.82 $359.92 ($694.55, $222.54) 0.4 2.3
Malaysia 91,442 (59,142, 125,363) $0.97 $155.54 ($240.49, $113.46) 0.01 6.2
Maldives 367 (230, 510) $13.24 $5,569.16 ($8,878.50, $4,009.70) 0.64 2.4
Mali 36,483 (21,814, 51,466) $0.79 $110.77 ($185.25, $78.52) 0.1 7.2
Page 53 of 60
https://mc.manuscriptcentral.com/bmj
BMJ
123456789101112131415161718192021222324252627282930313233343536373839404142434445464748495051525354555657585960

Confidential: For Review Only
Malta 1,459 (947, 1,940) $17.91 $3,620.52 ($5,579.75, $2,722.73) 0.14 4.9
Marshall Islands 151 (87, 211) $84.54 $15,069.42 ($26,189.19, $10,757.07) 4.71 5.6
Mauritania 8,787 (5,429, 12,366) $1.20 $189.91 ($307.40, $134.95) 0.09 6.3
Mauritius 11,493 (8,006, 14,108) $3.60 $249.91 ($358.75, $203.57) 0.02 14.4
Mexico 156,362 (97,089, 215,496) $0.81 $307.75 ($495.63, $223.30) 0.02 2.6
Micronesia (Federated States of) 303 (186, 433) $42.06 $6,310.99 ($10,250.47, $4,415.14) 2.1 6.7
Moldova 36,855 (23,764, 49,691) $1.40 $88.66 ($137.50, $65.76) 0.03 15.8
Mongolia 26,478 (16,925, 35,035) $1.15 $60.54 ($94.72, $45.76) 0.01 18.9
Montenegro 4,411 (2,848, 5,970) $26.22 $2,487.13 ($3,852.71, $1,837.64) 0.21 10.5
Morocco 107,021 (69,911, 143,478) $0.65 $102.10 ($156.30, $76.16) 0.02 6.4
Mozambique 29,216 (16,920, 43,243) $0.60 $173.61 ($299.78, $117.30) 0.14 3.4
Myanmar 246,217 (162,515, 326,712) $0.31 $33.30 ($50.46, $25.10) 0.02 9.2
Namibia 8,595 (5,241, 11,944) $2.86 $321.97 ($528.04, $231.70) 0.04 8.9
Nepal 61,800 (38,769, 84,742) $0.40 $83.83 ($133.63, $61.13) 0.06 4.8
Netherlands 37,631 (24,256, 51,252) $2.24 $693.93 ($1,076.58, $509.51) 0.02 3.2
New Zealand 9,639 (6,170, 13,177) $3.36 $989.45 ($1,545.86, $723.77) 0.03 3.4
Nicaragua 9,364 (5,915, 12,724) $1.00 $272.20 ($430.90, $200.32) 0.08 3.7
Niger 30,201 (17,764, 42,016) $0.71 $120.24 ($204.43, $86.43) 0.13 5.9
Nigeria 253,603 (154,353, 357,516) $0.65 $153.80 ($252.69, $109.10) 0.06 4.2
Norway 12,433 (7,891, 17,399) $4.30 $1,145.40 ($1,804.68, $818.48) 0.02 3.8
Oman 5,114 (3,106, 7,235) $7.26 $2,010.51 ($3,309.73, $1,421.03) 0.07 3.6
Pakistan 461,242 (289,095, 629,447) $0.84 $136.62 ($217.98, $100.11) 0.05 6.2
Panama 6,698 (4,264, 9,086) $1.65 $465.37 ($731.07, $343.08) 0.03 3.5
Papua New Guinea 8,894 (4,932, 12,906) $0.69 $223.50 ($403.03, $154.03) 0.08 3.1
Paraguay 20,559 (13,571, 27,307) $1.12 $161.99 ($245.40, $121.96) 0.03 6.9
Peru 32,151 (20,070, 45,102) $0.74 $339.43 ($543.75, $241.97) 0.03 2.2
Philippines 406,809 (262,442, 542,698) $0.62 $63.56 ($98.52, $47.64) 0.01 9.8
Poland 236,199 (154,876, 315,240) $3.74 $427.97 ($652.69, $320.66) 0.02 8.7
Portugal 40,519 (26,798, 55,034) $1.64 $317.07 ($479.43, $233.45) 0.01 5.2
Qatar 1,719 (1,038, 2,433) $19.10 $14,056.69 ($23,275.52, $9,932.23) 0.14 1.4
Republic of Korea 139,348 (93,766, 181,597) $0.89 $215.82 ($320.73, $165.61) 0.01 4.1
Romania 215,036 (139,641, 284,900) $2.06 $146.93 ($226.25, $110.90) 0.01 14
Russian Federation 1,874,746 (1,218,294, 2,520,416) $2.27 $120.65 ($185.66, $89.74) 0.01 18.8
Rwanda 5,008 (2,186, 8,894) $0.79 $614.80 ($1,408.22, $346.18) 0.44 1.3
Saint Lucia 375 (235, 517) $26.71 $6,755.78 ($10,774.11, $4,900.44) 0.51 4
Saint Vincent and the Grenadines 265 (163, 371) $35.70 $8,068.08 ($13,144.57, $5,770.83) 0.68 4.4
Page 54 of 60
https://mc.manuscriptcentral.com/bmj
BMJ
123456789101112131415161718192021222324252627282930313233343536373839404142434445464748495051525354555657585960
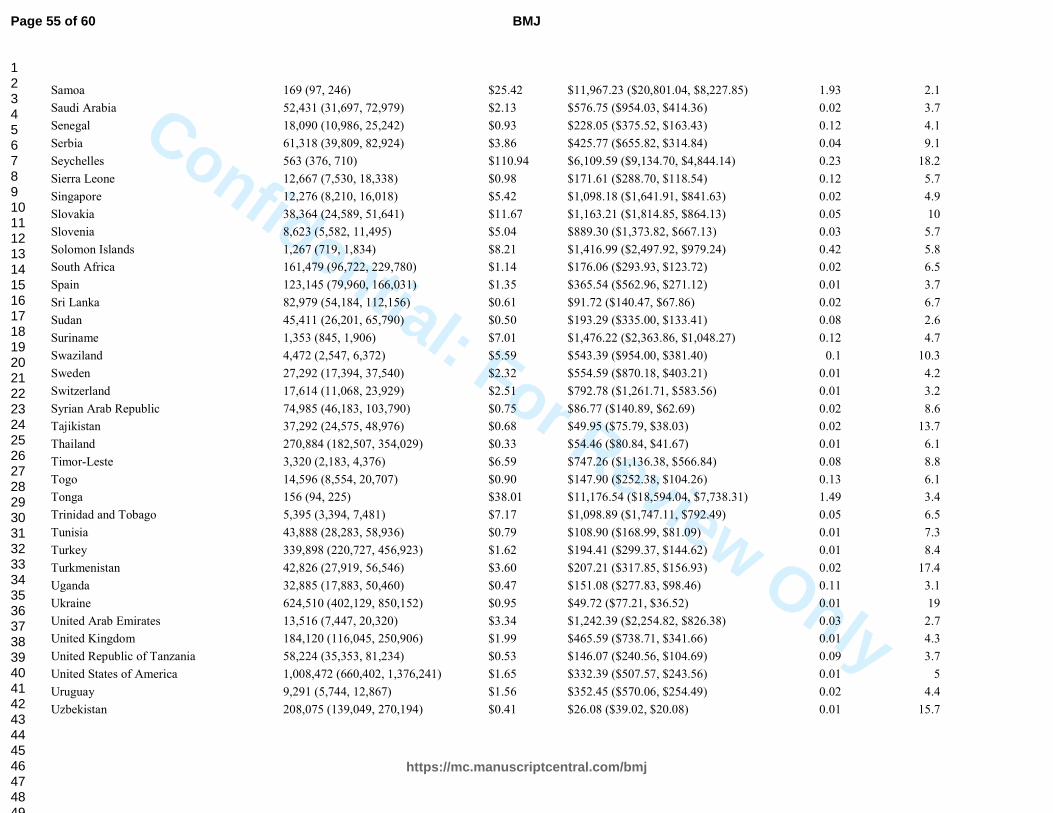
Confidential: For Review Only
Samoa 169 (97, 246) $25.42 $11,967.23 ($20,801.04, $8,227.85) 1.93 2.1
Saudi Arabia 52,431 (31,697, 72,979) $2.13 $576.75 ($954.03, $414.36) 0.02 3.7
Senegal 18,090 (10,986, 25,242) $0.93 $228.05 ($375.52, $163.43) 0.12 4.1
Serbia 61,318 (39,809, 82,924) $3.86 $425.77 ($655.82, $314.84) 0.04 9.1
Seychelles 563 (376, 710) $110.94 $6,109.59 ($9,134.70, $4,844.14) 0.23 18.2
Sierra Leone 12,667 (7,530, 18,338) $0.98 $171.61 ($288.70, $118.54) 0.12 5.7
Singapore 12,276 (8,210, 16,018) $5.42 $1,098.18 ($1,641.91, $841.63) 0.02 4.9
Slovakia 38,364 (24,589, 51,641) $11.67 $1,163.21 ($1,814.85, $864.13) 0.05 10
Slovenia 8,623 (5,582, 11,495) $5.04 $889.30 ($1,373.82, $667.13) 0.03 5.7
Solomon Islands 1,267 (719, 1,834) $8.21 $1,416.99 ($2,497.92, $979.24) 0.42 5.8
South Africa 161,479 (96,722, 229,780) $1.14 $176.06 ($293.93, $123.72) 0.02 6.5
Spain 123,145 (79,960, 166,031) $1.35 $365.54 ($562.96, $271.12) 0.01 3.7
Sri Lanka 82,979 (54,184, 112,156) $0.61 $91.72 ($140.47, $67.86) 0.02 6.7
Sudan 45,411 (26,201, 65,790) $0.50 $193.29 ($335.00, $133.41) 0.08 2.6
Suriname 1,353 (845, 1,906) $7.01 $1,476.22 ($2,363.86, $1,048.27) 0.12 4.7
Swaziland 4,472 (2,547, 6,372) $5.59 $543.39 ($954.00, $381.40) 0.1 10.3
Sweden 27,292 (17,394, 37,540) $2.32 $554.59 ($870.18, $403.21) 0.01 4.2
Switzerland 17,614 (11,068, 23,929) $2.51 $792.78 ($1,261.71, $583.56) 0.01 3.2
Syrian Arab Republic 74,985 (46,183, 103,790) $0.75 $86.77 ($140.89, $62.69) 0.02 8.6
Tajikistan 37,292 (24,575, 48,976) $0.68 $49.95 ($75.79, $38.03) 0.02 13.7
Thailand 270,884 (182,507, 354,029) $0.33 $54.46 ($80.84, $41.67) 0.01 6.1
Timor-Leste 3,320 (2,183, 4,376) $6.59 $747.26 ($1,136.38, $566.84) 0.08 8.8
Togo 14,596 (8,554, 20,707) $0.90 $147.90 ($252.38, $104.26) 0.13 6.1
Tonga 156 (94, 225) $38.01 $11,176.54 ($18,594.04, $7,738.31) 1.49 3.4
Trinidad and Tobago 5,395 (3,394, 7,481) $7.17 $1,098.89 ($1,747.11, $792.49) 0.05 6.5
Tunisia 43,888 (28,283, 58,936) $0.79 $108.90 ($168.99, $81.09) 0.01 7.3
Turkey 339,898 (220,727, 456,923) $1.62 $194.41 ($299.37, $144.62) 0.01 8.4
Turkmenistan 42,826 (27,919, 56,546) $3.60 $207.21 ($317.85, $156.93) 0.02 17.4
Uganda 32,885 (17,883, 50,460) $0.47 $151.08 ($277.83, $98.46) 0.11 3.1
Ukraine 624,510 (402,129, 850,152) $0.95 $49.72 ($77.21, $36.52) 0.01 19
United Arab Emirates 13,516 (7,447, 20,320) $3.34 $1,242.39 ($2,254.82, $826.38) 0.03 2.7
United Kingdom 184,120 (116,045, 250,906) $1.99 $465.59 ($738.71, $341.66) 0.01 4.3
United Republic of Tanzania 58,224 (35,353, 81,234) $0.53 $146.07 ($240.56, $104.69) 0.09 3.7
United States of America 1,008,472 (660,402, 1,376,241) $1.65 $332.39 ($507.57, $243.56) 0.01 5
Uruguay 9,291 (5,744, 12,867) $1.56 $352.45 ($570.06, $254.49) 0.02 4.4
Uzbekistan 208,075 (139,049, 270,194) $0.41 $26.08 ($39.02, $20.08) 0.01 15.7
Page 55 of 60
https://mc.manuscriptcentral.com/bmj
BMJ
123456789101112131415161718192021222324252627282930313233343536373839404142434445464748495051525354555657585960
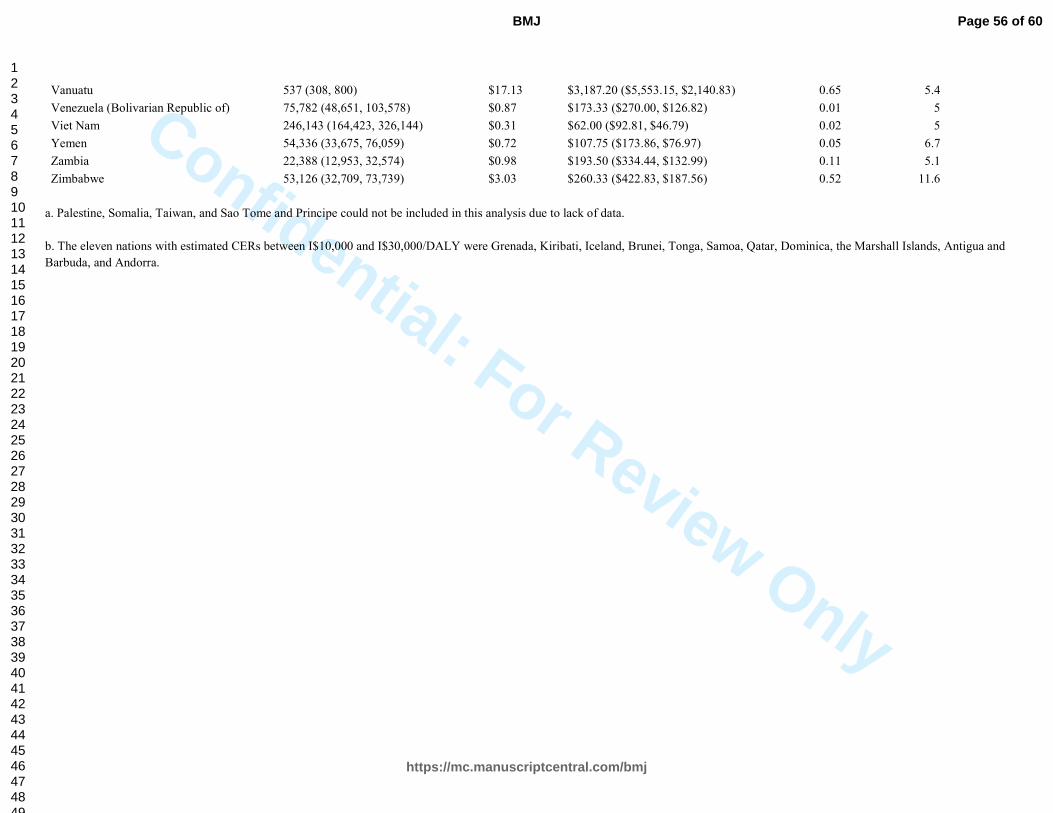
Confidential: For Review Only
Vanuatu 537 (308, 800) $17.13 $3,187.20 ($5,553.15, $2,140.83) 0.65 5.4
Venezuela (Bolivarian Republic of) 75,782 (48,651, 103,578) $0.87 $173.33 ($270.00, $126.82) 0.01 5
Viet Nam 246,143 (164,423, 326,144) $0.31 $62.00 ($92.81, $46.79) 0.02 5
Yemen 54,336 (33,675, 76,059) $0.72 $107.75 ($173.86, $76.97) 0.05 6.7
Zambia 22,388 (12,953, 32,574) $0.98 $193.50 ($334.44, $132.99) 0.11 5.1
Zimbabwe 53,126 (32,709, 73,739) $3.03 $260.33 ($422.83, $187.56) 0.52 11.6
a. Palestine, Somalia, Taiwan, and Sao Tome and Principe could not be included in this analysis due to lack of data.
b. The eleven nations with estimated CERs between I$10,000 and I$30,000/DALY were Grenada, Kiribati, Iceland, Brunei, Tonga, Samoa, Qatar, Dominica, the Marshall Islands, Antigua and
Barbuda, and Andorra.
Page 56 of 60
https://mc.manuscriptcentral.com/bmj
BMJ
123456789101112131415161718192021222324252627282930313233343536373839404142434445464748495051525354555657585960

Confidential: For Review O
nlyeFigure 1. The relative contributions of intervention components to total cost by income
and geographic region.
For each income and geographic region, the blue dot shows the cost per capita of supplies and equipment for the
intervention, the light green dot the cost per capita of meetings, the pink dot the cost per capita of training, the
orange dot the cost per capita of human resources, and the dark green dot the cost per capita of mass media.
Page 57 of 60
https://mc.manuscriptcentral.com/bmj
BMJ
123456789101112131415161718192021222324252627282930313233343536373839404142434445464748495051525354555657585960

Confidential: For Review O
nlyeFigure 2. Cost-effectiveness (I$/DALY) by income and geographic region of
interventions to reduce sodium consumption by 10% and 30%.
For each income and geographic region, the red point shows the intervention’s cost-effectiveness (I$/DALY) and its 95% uncertainty interval assuming an achieved sodium intake reduction of 10%; the green point shows the same assuming a reduction of 30%; and the blue point shows the regional GDP per capita. All figures are
population-weighted averages.
Page 58 of 60
https://mc.manuscriptcentral.com/bmj
BMJ
123456789101112131415161718192021222324252627282930313233343536373839404142434445464748495051525354555657585960

Confidential: For Review O
nlyeFigure 3. Sensitivity analysis of intervention cost assuming 10% and 30% reductions
with optimal intake 2g/day.
For each cost multiple (along the y-axis: 0.25, 0.5, 1, 1.5, 2, and 5 times the baseline cost), the dark and light green lines show the percentage of the world’s adult population living in countries with intervention cost <0.5xGDP per capita assuming achieved sodium intake reductions of 30% and 10% respectively; the dark and light blue lines show the percentage of the world’s adult population living in countries with intervention cost
<0.05xGDP per capita again assuming achieved sodium intake reductions of 30% and 10% respectively.
Page 59 of 60
https://mc.manuscriptcentral.com/bmj
BMJ
123456789101112131415161718192021222324252627282930313233343536373839404142434445464748495051525354555657585960

Confidential: For Review O
nly
1 World Health Organization. "Scaling up action against noncom m unicable diseases: how m uch wi ll i t cost ?" Geneva: World Hea lth Or gani zation (2011). 2
Johns, Benjam in, Taghreed Adam , and David B. Evans. "En hancing the comparability of costin g m ethods: cross-coun try variability in the prices of non- traded inputs to health program mes." Cost Effectiveness and Res ource Allocat ion 4.1 (2006): 8. 3
World Bank W orld Developm ent Indicators. Accessed at htt p:/ /data.worldban k.org /indicator/NY.GDP.DEFL.KD .ZG 4
IMF World Econom ic Outloo k Database, April 20 13 update. Accessed at http:/ /www.im f.org/external/pu bs/ft /weo/2013 /01/weodata/ index.aspx 5
Powles J, Fahimi S, Micha R, et al. Global, regional, and national sod ium inta kes in 1990 and 2010 : A sy stem atic analy sis of 24-hour urinary sodium excretion and dietary survey s worldwide. BMJ Open 3.12 (2013): e00 3733. 6 Danaei, Goodarz, et al. "Nat ional, regio nal, and global trends in systol ic blood pressure since 1980: systematic analysis of health exam ination survey s and epidemiological st udies with 786 country-y ears and 5· 4 m illion participants."The Lancet 377. 9765 (201 1): 568-57 7. 7
Murray , Christopher JL, et al. "Disabili ty-adjusted life years (DALYs) for 291 diseases and injuries in 21 regions, 199 0–2010 : a systematic analysis for the Global Burden of Disease Stu dy 2010." The La ncet 380.9859 (2013): 2197-2223. 8
Lozano, Rafael, et al. "Global and regional m ortality from 235 causes of death for 20 age groups in 1990 and 2010 : a sy stem atic analy sis for the Global Burden of D isease Study 2010. " The Lancet 380.985 9 (2013): 2095-2128. 9 Lim , Stephen S., et al. "A com parative ris k assessment of burden of di sease and injury attributable to 67 ris k factors and ris k factor clus ters in 21 regio ns, 1990–201 0: a sy stem atic analy sis for the Global Burden of Disease Study 2010." The Lancet 380.98 59 (2013): 2224-226 0. 10
Salomon, Jo shua A., et al. "Com m on values in assessing health outcomes from disease and injury : disability weights m easurem ent study for the Global Burden of D isease Stu dy 2010." The La ncet 380.98 59 (2013): 2129-214 3. 11
Mozaffarian D, Fahim i S, Singh GM, et al. Global s odium consumpt ion and death from cardiovascular causes. New England Jou rnal of Medicine 371 (2014): 624-634. 12
Sing h, Gitanj ali M. , et al. "T he Age-Specific Quantitative Effects of Metabolic Ris k Factors o n Cardiovascu lar Diseases and Diabetes: A Pooled A naly sis."PloS one 8.7 (2013): e6517 4.
Page 60 of 60
https://mc.manuscriptcentral.com/bmj
BMJ
123456789101112131415161718192021222324252627282930313233343536373839404142434445464748495051525354555657585960