COST –EFFECTIVENESS B MDR TB - who.int · a. Current practice of MDR‐TB treatment (hereafter...
30
This report is confidential and not for circulation, quotation or reproduction. It contains original non‐published data COST –EFFECTIVENESS OF INTRODUCING BEDAQUILINE IN MDR‐TB REGIMENS – A EXPLORATORY ANALYSIS FINAL DRAFT REPORT 26‐01‐2013 Prepared by Anna Vassall (London School of Hygiene and Tropical Medicine),
Transcript of COST –EFFECTIVENESS B MDR TB - who.int · a. Current practice of MDR‐TB treatment (hereafter...
This report is confidential and not for circulation, quotation or reproduction. It contains original non‐published data
COST –EFFECTIVENESS OF INTRODUCING BEDAQUILINE IN MDR‐TB REGIMENS – A EXPLORATORY ANALYSIS
FINAL DRAFT REPORT 26‐01‐2013
Prepared by Anna Vassall (London School of Hygiene and Tropical Medicine),
This report is confidential and not for circulation, quotation or reproduction. It contains original non‐published data
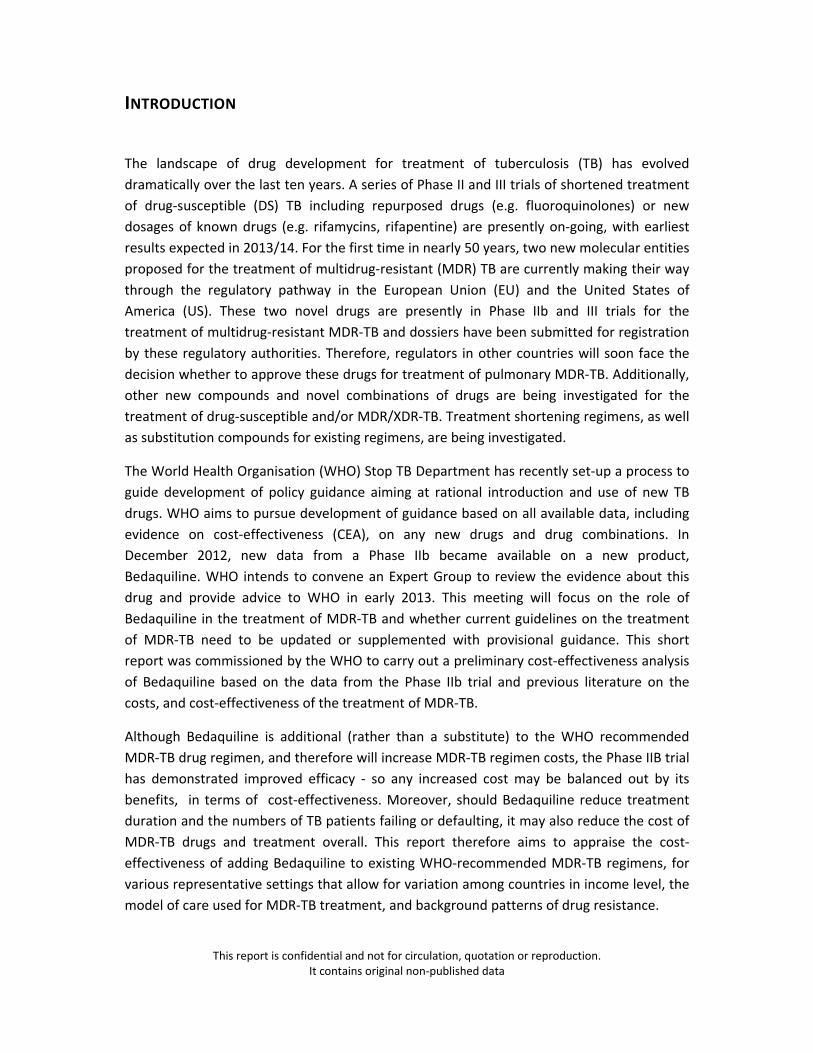
INTRODUCTION
The landscape of drug development for treatment of tuberculosis (TB) has evolved
dramatically over the last ten years. A series of Phase II and III trials of shortened treatment
of drug‐susceptible (DS) TB including repurposed drugs (e.g. fluoroquinolones) or new
dosages of known drugs (e.g. rifamycins, rifapentine) are presently on‐going, with earliest
results expected in 2013/14. For the first time in nearly 50 years, two new molecular entities
proposed for the treatment of multidrug‐resistant (MDR) TB are currently making their way
through the regulatory pathway in the European Union (EU) and the United States of
America (US). These two novel drugs are presently in Phase IIb and III trials for the
treatment of multidrug‐resistant MDR‐TB and dossiers have been submitted for registration
by these regulatory authorities. Therefore, regulators in other countries will soon face the
decision whether to approve these drugs for treatment of pulmonary MDR‐TB. Additionally,
other new compounds and novel combinations of drugs are being investigated for the
treatment of drug‐susceptible and/or MDR/XDR‐TB. Treatment shortening regimens, as well
as substitution compounds for existing regimens, are being investigated.
The World Health Organisation (WHO) Stop TB Department has recently set‐up a process to
guide development of policy guidance aiming at rational introduction and use of new TB
drugs. WHO aims to pursue development of guidance based on all available data, including
evidence on cost‐effectiveness (CEA), on any new drugs and drug combinations. In
December 2012, new data from a Phase IIb became available on a new product,
Bedaquiline. WHO intends to convene an Expert Group to review the evidence about this
drug and provide advice to WHO in early 2013. This meeting will focus on the role of
Bedaquiline in the treatment of MDR‐TB and whether current guidelines on the treatment
of MDR‐TB need to be updated or supplemented with provisional guidance. This short
report was commissioned by the WHO to carry out a preliminary cost‐effectiveness analysis
of Bedaquiline based on the data from the Phase IIb trial and previous literature on the
costs, and cost‐effectiveness of the treatment of MDR‐TB.
Although Bedaquiline is additional (rather than a substitute) to the WHO recommended
MDR‐TB drug regimen, and therefore will increase MDR‐TB regimen costs, the Phase IIB trial
has demonstrated improved efficacy ‐ so any increased cost may be balanced out by its
benefits, in terms of cost‐effectiveness. Moreover, should Bedaquiline reduce treatment
duration and the numbers of TB patients failing or defaulting, it may also reduce the cost of
MDR‐TB drugs and treatment overall. This report therefore aims to appraise the cost‐
effectiveness of adding Bedaquiline to existing WHO‐recommended MDR‐TB regimens, for
various representative settings that allow for variation among countries in income level, the
model of care used for MDR‐TB treatment, and background patterns of drug resistance.

This report is confidential and not for circulation, quotation or reproduction. It contains original non‐published data
OBJECTIVES
The objective of this report is to inform the decision of the Expert group, through estimating
the likely costs and effectiveness of Bedaquiline – and the pathways through which these
may be incurred. The Cost‐Effectiveness Analysis (CEA) is conducted from a TB programme
perspective and focuses on the direct benefits to patients, rather than any indirect (and
acquired) transmission benefits. It also excludes any broader economic benefits to patients.
It is important to note from the start that this approach was taken purely for pragmatic
(time constraint) reasons rather than scientific reasons. It is a highly conservative approach,
as it is plausible that Bedaquiline may have additional benefits both to the wider health
system, the economic conditions of patients and prevent the on‐going transmission of TB.
Despite its limits however this approach can still inform decision makers – by highlighting
where MDR‐TB is highly likely to be cost‐effective – particularly in the context of the general
lack of any evidence base on the Cost‐Effectiveness Analysis (CEA) of new MDR drugs at this
current time.
TREATMENT STRATEGIES
The cost‐effectiveness of two alternative MDR‐TB treatment strategies is compared:
a. Current practice of MDR‐TB treatment (hereafter referred to as the base case)
b. The addition of Bedaquiline to the base case (24 week regimen)
The analysis is conducted for six countries (Russia, Estonia, Philippines, Peru, Nepal and
China). These countries were primarily selected due to availability of cost data, but were
also assessed to obtain a range of different income levels, current practices, and MDR‐TB
prevalence. A summary of the main characteristics of each base case can be found in Table
1 below for both the trial and the different country settings.

This report is confidential and not for circulation, quotation or reproduction. It contains original non‐published data
TABLE 1 ‐ SUMMARY OF BASE CASE INTERVENTION1
RUSSIA (TOMSK)
ESTONIA THE PHILIPPINES
PERU CHINA NEPAL
REGIMEN Individualised Individualised Individualised Standardised Standardised Standardised
LOCATION FOR DOT
Hospital ward, health clinic
Hospital ward, health clinic
Clinic and patients home
Clinic Hospital and clinic
Clinic
HOSPITALISATION
DURING
TREATMENT
Yes, lengthy (average 192 days)
Yes lengthy (average 239 days)
Limited (average 7 days)
None Yes, around 60 days
None
This report is confidential and not for circulation, quotation or reproduction. It contains original non‐published data
METHODS
MODEL STRUCTURE
A decision analytic model is used to estimate the costs and benefits for a cohort of MDR‐TB
patients in a variety of different settings. The model divides treatment into four periods (0‐6
months, 6‐8 months, 8‐18 months, 18‐20 months cycles), and at the end of each time period
MDR‐TB patients either continue on treatment/cure, default, fail treatment, or die. In the
early time periods (6/8 months) it is not possible to be cured – just to default, die or
continue on treatment. MDR‐TB patients who convert are allowed to fail thereafter. MDR‐
TB patients who fail treatment at the end of a completed cycle continue on one further
cycle of MDR‐TB retreatment – thereafter they become chronic cases. MDR‐TB patients are
followed in the model until they either cure or die.
Broadly the parameterization of the model in terms of long‐term outcomes post treatment
follows past models of cost‐effectiveness in order to allow for some comparability of
results1. Probabilities of death of a chronic case and defaults are shown in Table 2, along
with other key model parameters. These parameters were directly sourced from the
previous studies of cost‐effectiveness2‐4. It should be noted however that the original data
on which these were based is limited. Most were estimated from results reported in a paper
by Goble et al5 examining the long term outcomes of a cohort of 171 MDRTB patients in the
US on treatment between 1973 and 1983. More recently a study by Chan et al6 showed
improved longer term outcomes – but study cohort was US based and has limited
generalisability to other settings – given the probable dependence of outcomes on the
availability and type of continuing MDR‐TB treatment. An upper bound of 99% of long term
death rates of defaults and chronic cases was therefore also applied in the uncertainty
analysis.
It should also be noted that the model structure does not allow defaulters to return once
they have left treatment. This structure has no effect in the primary estimates of cost‐
effectiveness however, as Bedaquiline is assumed to not impact on the default rate (despite
the reduced default rate observed during the Phase II trial (see below)). Defaulters who
leave have a 60% probability of death reflecting a possible future return to TB services. This
probably of death is not impacted by prior MDR‐TB treatment. This is a conservative
assumption – in the absence of empirical evidence ‐ as early conversion may increase the
cure rate of defaulters.
This report is confidential and not for circulation, quotation or reproduction. It contains original non‐published data
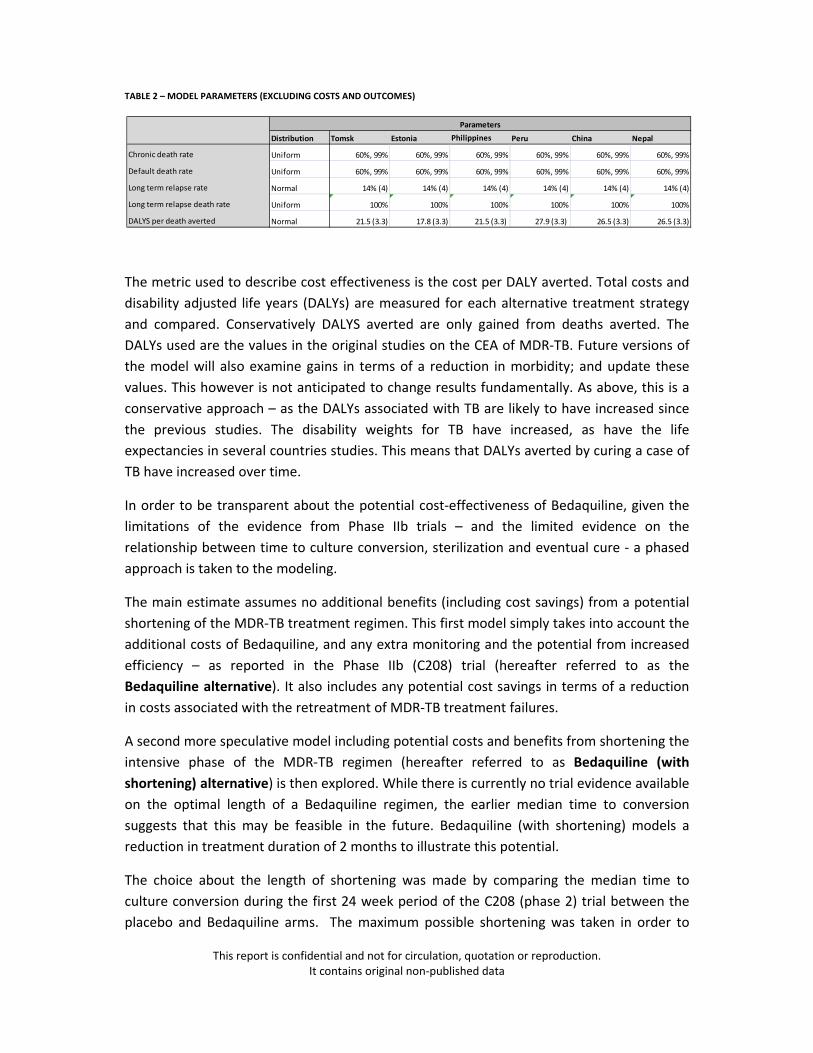
TABLE 2 – MODEL PARAMETERS (EXCLUDING COSTS AND OUTCOMES)
The metric used to describe cost effectiveness is the cost per DALY averted. Total costs and
disability adjusted life years (DALYs) are measured for each alternative treatment strategy
and compared. Conservatively DALYS averted are only gained from deaths averted. The
DALYs used are the values in the original studies on the CEA of MDR‐TB. Future versions of
the model will also examine gains in terms of a reduction in morbidity; and update these
values. This however is not anticipated to change results fundamentally. As above, this is a
conservative approach – as the DALYs associated with TB are likely to have increased since
the previous studies. The disability weights for TB have increased, as have the life
expectancies in several countries studies. This means that DALYs averted by curing a case of
TB have increased over time.
In order to be transparent about the potential cost‐effectiveness of Bedaquiline, given the
limitations of the evidence from Phase IIb trials – and the limited evidence on the
relationship between time to culture conversion, sterilization and eventual cure ‐ a phased
approach is taken to the modeling.
The main estimate assumes no additional benefits (including cost savings) from a potential
shortening of the MDR‐TB treatment regimen. This first model simply takes into account the
additional costs of Bedaquiline, and any extra monitoring and the potential from increased
efficiency – as reported in the Phase IIb (C208) trial (hereafter referred to as the
Bedaquiline alternative). It also includes any potential cost savings in terms of a reduction
in costs associated with the retreatment of MDR‐TB treatment failures.
A second more speculative model including potential costs and benefits from shortening the
intensive phase of the MDR‐TB regimen (hereafter referred to as Bedaquiline (with
shortening) alternative) is then explored. While there is currently no trial evidence available
on the optimal length of a Bedaquiline regimen, the earlier median time to conversion
suggests that this may be feasible in the future. Bedaquiline (with shortening) models a
reduction in treatment duration of 2 months to illustrate this potential.
The choice about the length of shortening was made by comparing the median time to
culture conversion during the first 24 week period of the C208 (phase 2) trial between the
placebo and Bedaquiline arms. The maximum possible shortening was taken in order to
Distribution Tomsk Estonia Philippines Peru China Nepal
Chronic death rate Uniform 60%, 99% 60%, 99% 60%, 99% 60%, 99% 60%, 99% 60%, 99%
Default death rate Uniform 60%, 99% 60%, 99% 60%, 99% 60%, 99% 60%, 99% 60%, 99%
Long term relapse rate Normal 14% (4) 14% (4) 14% (4) 14% (4) 14% (4) 14% (4)
Long term relapse death rate Uniform 100% 100% 100% 100% 100% 100%
DALYS per death averted Normal 21.5 (3.3) 17.8 (3.3) 21.5 (3.3) 27.9 (3.3) 26.5 (3.3) 26.5 (3.3)
Parameters

This report is confidential and not for circulation, quotation or reproduction. It contains original non‐published data
best illustrate the potential impact on cost‐effectiveness. However, C208 reports several
possible results in relation to time to conversion. A 40 day reduction is presented in the
primary analysis of efficacy performed when all subjects had completed their 24‐week
treatment with Bedaquiline or placebo (or had discontinued earlier) (i.e., with subjects who
discontinued during the 24‐week period being considered as not converted or their time to
culture conversion assigned to the last MGIT culture result). In addition, two other estimates
were made. The first, (no overruling for discontinuation) finds a difference of 27 days
between the Bedaquiline and placebo arms, the other that assumes that missing subjects
are treatment failures finds a slightly higher difference of 52 days. It should be noted that it
may be possible to provide Bedaquiline for a longer period and shorten the overall MDR‐TB
regimen further, but this option is not explored here.
The Bedaquiline alternatives also assume no negative impact on adverse events – apart
from the necessity to monitor potential QT prolongation. This assumption is made on the
basis of the pooled analysis of the C208 trials that found that overall the frequency of
adverse events leading to discontinuation of treatment was balanced between arms.
However it should be noted that a higher incidence of serious adverse events was found in
the Bedaquiline group (6.9%) compared to (1.9%) in the control group of the trials. This
difference was probed and a higher incidence of hepatic disorders was found in the
Bedaquiline group (8.8%) vs (1.9%) in the control group, due to the elevation of
transaminases. Moreover, the analysis of adverse drug reactions in C208/ C209 found an
increase in QT prolongation, and a higher incidence of headache and arthralgia.
PARAMETER SOURCES
Costs
Cost data for the base case in each country was sourced from published studies (Fitzpatrick
2012), with additional supplementary data provided by study authors. Cost data for China
and Nepal was provided by the Stop TB department of the WHO.
For the primary estimates for the unit cost per patient treatment with Bedaquiline, a
regimen cost of US$900 (for Global Fund Eligible countries) and US$3000 (for all other
countries) was used for a full course of Bedaquiline based on estimates from Janssen. In
addition the costs of four electro‐cardiograms (ECG) were added. The unit costs for the ECGs
were sourced from WHO‐Choice.
To estimate the possible cost savings from a shortened course with Bedaquiline, the costs of
an intensive phase of six months were estimated. Eight month intensive phase drugs costs
were adjusted to take into account reductions in hospitalization and required length of
This report is confidential and not for circulation, quotation or reproduction. It contains original non‐published data
second‐line parental agents (injectable anti‐tuberculosis drugs). Where hospitalization was
not used extensively in the intensive phase of treatment (Peru and Nepal), a reduction was
made in the cost of clinic visits. All other costs (programme management, testing costs etc)
were conservatively assumed to remain the same as the non‐shortened Bedaquiline
regimen.
All costs were considered to have uniform distributions. For the base case lower and upper
bounds allowed were 10% higher and lower than the point estimates. For Bedaquiline,
prices were allowed to vary between US$800‐US$1000 and US$1000‐US5000 for a complete
regimen.
Base case outcomes
The outcomes for the Philippines, Estonia, Russia and Peru were taken from published
studies (Tupasi 2006, Floyd 2012 and Suarez 2002). However, it should be noted that these
studies report on different MDR‐TB cohorts, in terms of previous treatment history. In Peru,
outcomes are reported for a cohort of all chronic cases. Likewise the majority of cases in
The Philippines study were chronic (77%). Tomsk (Russia) also reports on a mix of chronic,
new and re‐treatment cases, and Estonia on a cohort of new and retreatment only.
Orenstein (2009) finds no difference in treatment success in a pooled analysis comparing
cohorts with less or more than 75% of previously treated cases – but does not specifically
analyse how the proportion of chronic cases impacts treatment outcomes. Given the dearth
of evidence in this area, we consider outcome estimates for the whole cohort as our
‘likeliest’ estimates of base case outcomes. However where data is reported by sub‐
categories of previous treatment history, differences in % of chronic, retreated and new
cases are included in our probabilistic sensitivity analysis; using a triangular distribution.
No previous published cost‐effectiveness studies were available for China and Nepal,
therefore two systematic reviews of MDR‐TB outcomes (Johnston 2009 and Orenstein 2009)
were used to estimate outcomes1. Neither review found any studies from either Nepal or
China. However Orenstein (2009) estimates means (and standard deviations) for
standardized treatment and these (normal distributions) were used to estimate current
outcomes for China and Nepal.
Where outcomes over time were not known (for the base case), deaths and defaults over
time were estimated assuming they followed the same pattern as in Peru.
For Tomsk, Estonia and the Philippine MDR retreatment was assumed to have the same
outcomes as the initial MDR‐TB treatment. As Peru, China and Nepal all use standardized
1 Future estimates will include the outcomes of on‐going studies in both countries supported by the WHO
This report is confidential and not for circulation, quotation or reproduction. It contains original non‐published data
MDR‐TB treatment, retreatment was assumed to have a higher cure rate – due to the
assumed use of an individualized regimen.
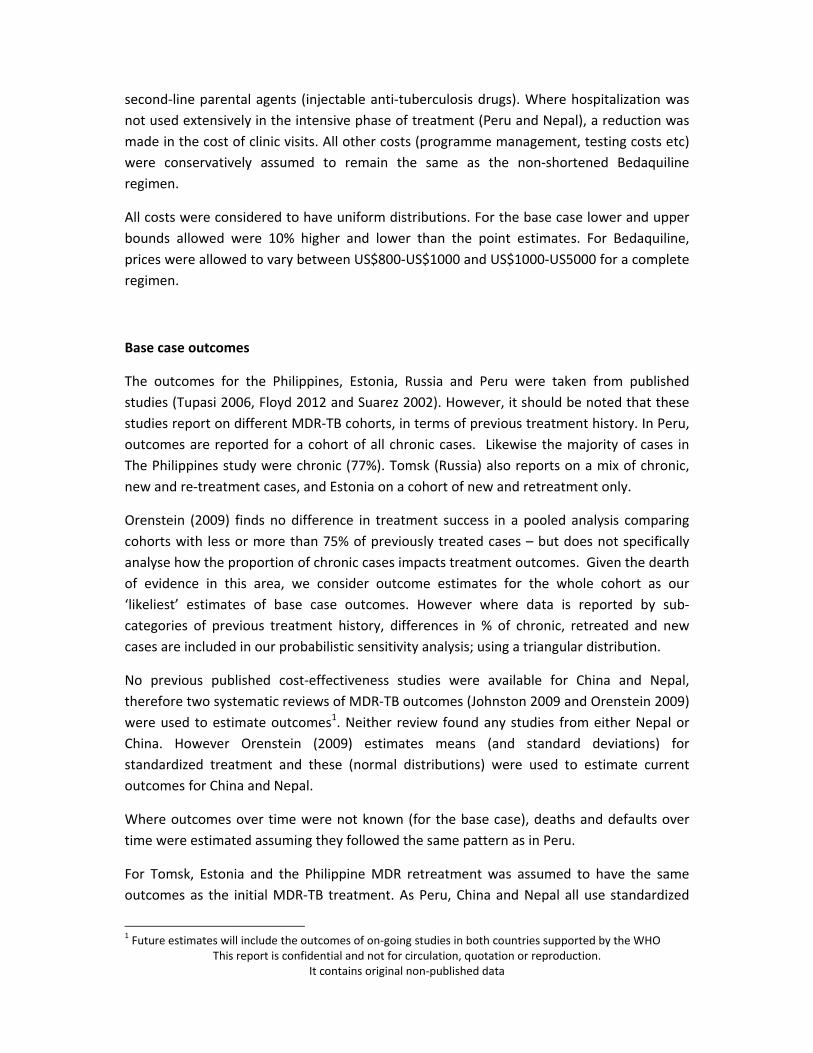
TABLE 3 – BASE CASE INITIAL MDR TREATMENT AND MDR RETREATMENT OUTCOMES
Bedaquiline outcomes
Bedaquiline outcomes were sourced from C208 trial data. The FDA submission for
Bedaquiline reports on sputum culture conversion. However in order to apply the results to
other settings where cohort outcomes are reported in terms of WHO defined outcomes,
some adjustments needed to be made. Statisticians at Janssen supplied a summary of
outcomes in terms of WHO guidelines (cure defined as 5 consecutive negative results) at
three times points: 72 weeks, 78‐82 weeks, and 120 weeks. For the six month and eight
month periods in the model, outcomes (in terms of those continuing, death and defaults)
were sourced from the FDA submission. The 78‐82 outcomes were used for the 18 month
time point (in addition a sensitivity analysis was conducted using the 72 week data). The 120
week data was used to estimate outcomes at 20 months.
TABLE 4 ‐ TREATMENT OUTCOMES BEDAQUILINE CASE (CONVERTED DEFAULTERS CATEGORISED AS FAILURES 18/20 MONTHS)
It can be seen from the Table 4 above, that the placebo arm performs poorly compared to
base case in all the countries being modeled. In part this may be due to the high number of
defaulters associated with the heavier than normal treatment monitoring associated with
Tomsk Estonia Philippines Peru China Nepal Tomsk Estonia Philippines Peru China Nepal
Cure/ Success 76% 61% 61% 49% 54% 54% 76% 61% 61% 62% 64% 64%
Failure 12% 9% 10% 28% 23% 23% 12% 9% 10% 16% 6% 6%
Default 8% 17% 14% 11% 12% 12% 8% 17% 14% 12% 12% 12%
Death 4% 13% 15% 12% 11% 11% 4% 13% 15% 10% 11% 11%
Total 100% 100% 100% 100% 100% 100% 100% 100% 100% 100% 93% 93%
Initial MDR Treatment MDR Retreatment
6 months 8 months 18 month 20 months 6 months 8 months 18 month 20 months
Continue (6/8 months)/
Cure (18/20 months) 79% 73% 61% 58% 58% 61% 38% 32%
Failure 0% 0% 8% 8% 0% 0% 26% 30%
Default 20% 24% 26% 26% 42% 39% 35% 36%
Death 2% 3% 6% 9% 0% 0% 2% 2%
Total 100% 100% 100% 100% 100% 100% 100% 100%
Bedaqualine Placebo
This report is confidential and not for circulation, quotation or reproduction. It contains original non‐published data
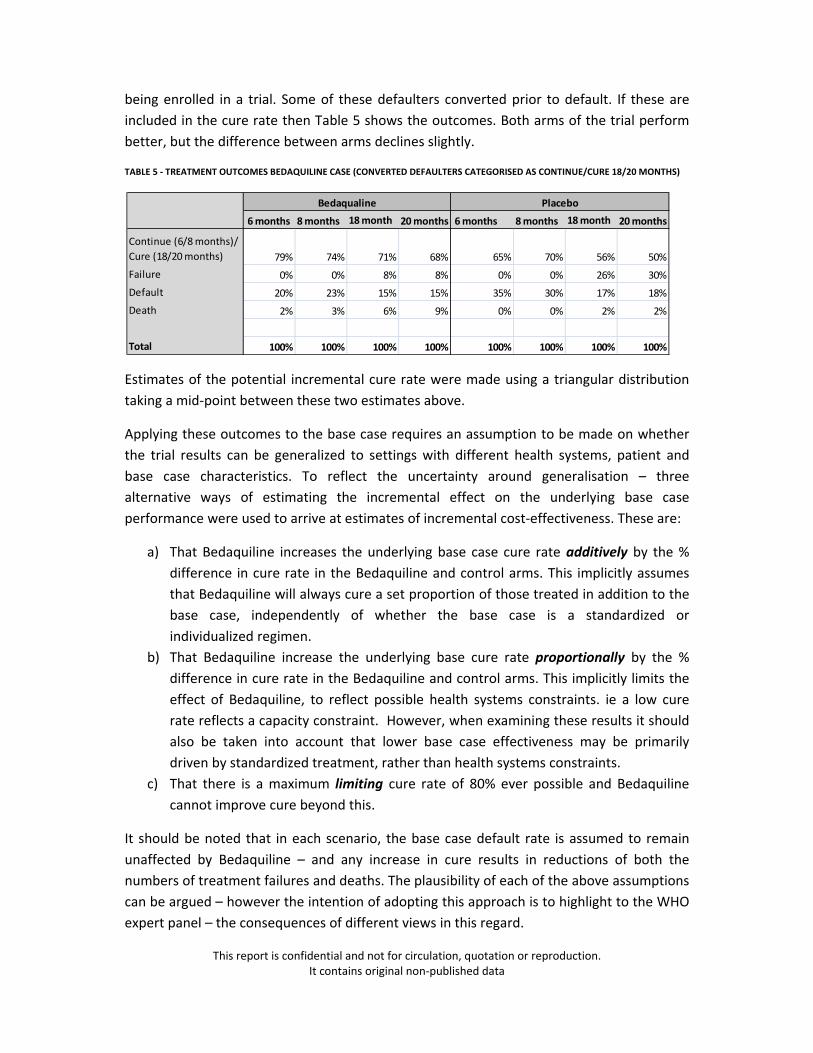
being enrolled in a trial. Some of these defaulters converted prior to default. If these are
included in the cure rate then Table 5 shows the outcomes. Both arms of the trial perform
better, but the difference between arms declines slightly.
TABLE 5 ‐ TREATMENT OUTCOMES BEDAQUILINE CASE (CONVERTED DEFAULTERS CATEGORISED AS CONTINUE/CURE 18/20 MONTHS)
Estimates of the potential incremental cure rate were made using a triangular distribution
taking a mid‐point between these two estimates above.
Applying these outcomes to the base case requires an assumption to be made on whether
the trial results can be generalized to settings with different health systems, patient and
base case characteristics. To reflect the uncertainty around generalisation – three
alternative ways of estimating the incremental effect on the underlying base case
performance were used to arrive at estimates of incremental cost‐effectiveness. These are:
a) That Bedaquiline increases the underlying base case cure rate additively by the %
difference in cure rate in the Bedaquiline and control arms. This implicitly assumes
that Bedaquiline will always cure a set proportion of those treated in addition to the
base case, independently of whether the base case is a standardized or
individualized regimen.
b) That Bedaquiline increase the underlying base cure rate proportionally by the %
difference in cure rate in the Bedaquiline and control arms. This implicitly limits the
effect of Bedaquiline, to reflect possible health systems constraints. ie a low cure
rate reflects a capacity constraint. However, when examining these results it should
also be taken into account that lower base case effectiveness may be primarily
driven by standardized treatment, rather than health systems constraints.
c) That there is a maximum limiting cure rate of 80% ever possible and Bedaquiline
cannot improve cure beyond this.
It should be noted that in each scenario, the base case default rate is assumed to remain
unaffected by Bedaquiline – and any increase in cure results in reductions of both the
numbers of treatment failures and deaths. The plausibility of each of the above assumptions
can be argued – however the intention of adopting this approach is to highlight to the WHO
expert panel – the consequences of different views in this regard.
6 months 8 months 18 month 20 months 6 months 8 months 18 month 20 months
Continue (6/8 months)/
Cure (18/20 months) 79% 74% 71% 68% 65% 70% 56% 50%
Failure 0% 0% 8% 8% 0% 0% 26% 30%
Default 20% 23% 15% 15% 35% 30% 17% 18%
Death 2% 3% 6% 9% 0% 0% 2% 2%
Total 100% 100% 100% 100% 100% 100% 100% 100%
Bedaqualine Placebo
This report is confidential and not for circulation, quotation or reproduction. It contains original non‐published data
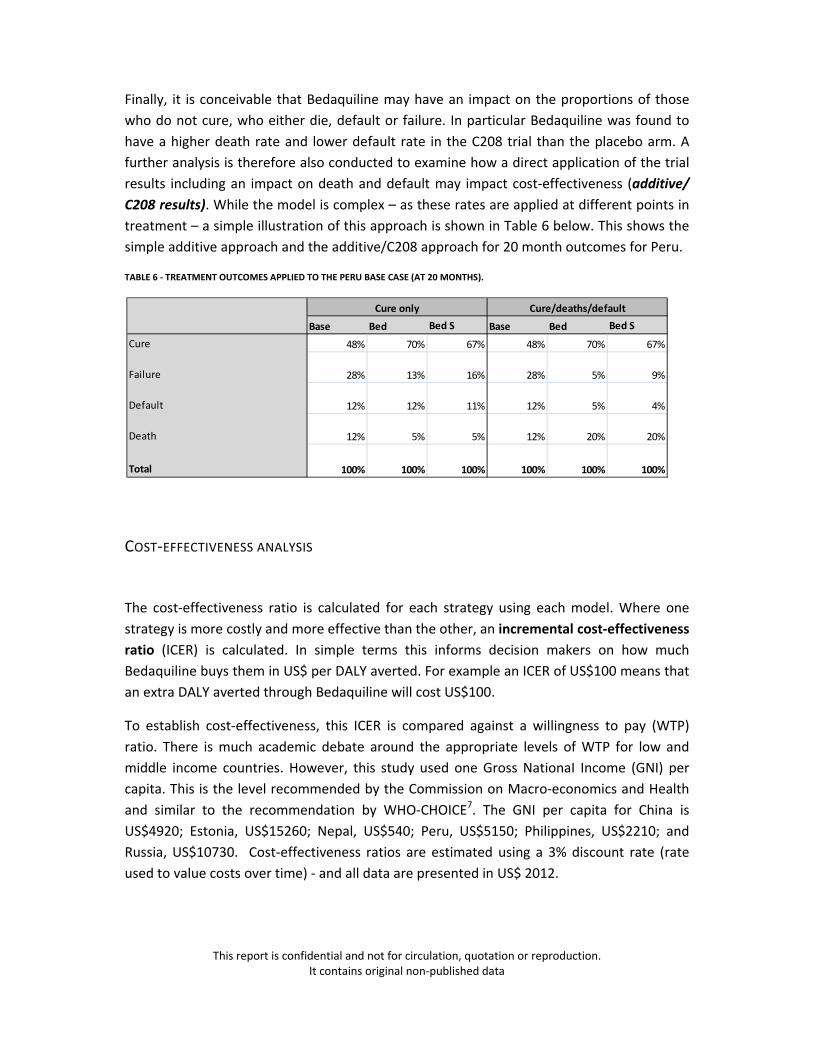
Finally, it is conceivable that Bedaquiline may have an impact on the proportions of those
who do not cure, who either die, default or failure. In particular Bedaquiline was found to
have a higher death rate and lower default rate in the C208 trial than the placebo arm. A
further analysis is therefore also conducted to examine how a direct application of the trial
results including an impact on death and default may impact cost‐effectiveness (additive/
C208 results). While the model is complex – as these rates are applied at different points in
treatment – a simple illustration of this approach is shown in Table 6 below. This shows the
simple additive approach and the additive/C208 approach for 20 month outcomes for Peru.
TABLE 6 ‐ TREATMENT OUTCOMES APPLIED TO THE PERU BASE CASE (AT 20 MONTHS).
COST‐EFFECTIVENESS ANALYSIS
The cost‐effectiveness ratio is calculated for each strategy using each model. Where one
strategy is more costly and more effective than the other, an incremental cost‐effectiveness
ratio (ICER) is calculated. In simple terms this informs decision makers on how much
Bedaquiline buys them in US$ per DALY averted. For example an ICER of US$100 means that
an extra DALY averted through Bedaquiline will cost US$100.
To establish cost‐effectiveness, this ICER is compared against a willingness to pay (WTP)
ratio. There is much academic debate around the appropriate levels of WTP for low and
middle income countries. However, this study used one Gross NationaI Income (GNI) per
capita. This is the level recommended by the Commission on Macro‐economics and Health
and similar to the recommendation by WHO‐CHOICE7. The GNI per capita for China is
US$4920; Estonia, US$15260; Nepal, US$540; Peru, US$5150; Philippines, US$2210; and
Russia, US$10730. Cost‐effectiveness ratios are estimated using a 3% discount rate (rate
used to value costs over time) ‐ and all data are presented in US$ 2012.
Base Bed Bed S Base Bed Bed S
Cure 48% 70% 67% 48% 70% 67%
Failure 28% 13% 16% 28% 5% 9%
Default 12% 12% 11% 12% 5% 4%
Death 12% 5% 5% 12% 20% 20%
Total 100% 100% 100% 100% 100% 100%
Cure only Cure/deaths/default

This report is confidential and not for circulation, quotation or reproduction. It contains original non‐published data

This report is confidential and not for circulation, quotation or reproduction. It contains original non‐published data
SENSITIVITY ANALYSIS
To test the robustness of the cost‐effective ratios to the structural assumptions made, a
number of one and multi‐way sensitivity analyses were conducted. Due to time constraints
these were limited to:
a) The price of Bedaquiline
b) The assumption that one round of retreatment is provided
c) The extent of hospitalization averted
Other structural assumptions that may impact results are the assumptions made about long
term outcomes and the levels of default and death at different periods during treatment.
Due to time constraints, these results also do not currently include a probabilistic sensitivity
analysis – which accounts for uncertainty in model parameterization (presenting upper and
lower bounds for ICERS –rather than the point estimates below). All analyses were
conducted using Treeage (Williamtown, USA) and Excel. No ethical approval was required
for this analysis, as only secondary data was used.
This report is confidential and not for circulation, quotation or reproduction. It contains original non‐published data
SUMMARY OF RESULTS
When assessing the results of this study, it is important that readers note that, while the
conservative approach described above is highly robust when it finds Bedaquiline to be cost‐
effective, it does not establish the converse. Any situation where Bedaquiline is not found to
be cost‐effective using these methods – does not mean Bedaquiline is not cost‐effective. It
should rather be seen as an area that requires further modeling/data in order to establish
cost‐effectiveness (or not). Moreover the absolute values in terms of ICERs may
substantially under‐represent the true cost‐effectiveness of Bedaquiline.
Tables 7‐9 below summarise the findings for the six countries using different assumptions
about the application of the trial results. Thereafter further tables outlining the findings of
the sensitivity analysis are presented. On the basis of these, the following section briefly
summarises the main study results and interpretation.
A. Bedaquiline is highly likely to be cost‐effective in most environments – for a wide
range of assumptions about the translation of trial results to current practice.
B. In some environments it may be cost‐saving – depending on the extent to which
increases in cure rate reduce the levels of MDR‐TB retreatment (i.e. impacts
failures as compared to deaths)2. This cost reduction will be strongest in
environments which have high MDR‐TB treatment costs.
C. The incremental effectiveness of Bedaquiline does not vary substantially by
setting – unless the base case has high cure rates (Russia).
D. Applying the full trial results (including the possible effect on deaths and
defaults) ‐ compared to cure rate alone ‐ can substantially impact both
effectiveness and cost‐effectiveness. In all settings it substantially reduces the
DALYs averted.
E. The impact of Bedaquiline on costs will depend on price and the cost savings
from retreatment. This latter ‘savings’ effect will benefit countries either with
higher retreatment costs or high current levels of treatment failures.
F. The cost‐effectiveness of Bedaquiline is ambiguous in low income countries like
Nepal, with much lower willingness to pay thresholds. Further work is required in
low income settings to fully take into account transmission and patient cost
consequences.
G. The possible effect of treatment shortening does not substantially impact the
above conclusions or results – although in some cases costs may be reduced.
DALYs averted (excluding transmission consequences) may also be reduced ‐
2 The conclusion is also substantiated by the first attempt at the model – which only allowed Bedaquiline to impact failure rather than default rates. This found higher cost savings than the final results below. The results below – which allow for Bedaquiline to reduce deaths result in higher levels of effectiveness.

This report is confidential and not for circulation, quotation or reproduction. It contains original non‐published data
depending on the extent to which shortening reduces defaults compared to the
slightly lower cure rates.
H. High end prices reduce cost‐effectiveness. However, in no setting do they bring
the ICER above the WTP threshold. In the case of Russia however they can make
the difference between Bedaquiline as a potentially cost‐saving to a cost‐
effective intervention and the base case scenario.
I. Removing the option of retreatment for MDR‐TB can improve cost‐effectiveness
– as more of those who otherwise die will be cured.
J. No hospitalization has an impact on cost‐effectiveness ‐ but does not change the
central findings on cost‐effectiveness above. In countries with higher
hospitalization costs, less cost savings are made.

This report is confidential and not for circulation, quotation or reproduction. It contains original non‐published data
TABLE 7 – UNIT COSTS PER PATIENT TREATED: BASE, BEDAQUILINE AND SHORTENED BEDAQUILINE (US$2012)
*Other category includes items such as programme management, treatment of adverse events, food supplements etc.
Tomsk Estonia Philippines Peru China Nepal Tomsk Estonia Philippines Peru China Nepal Tomsk Estonia Philippines Peru China Nepal
Drugs 4542 2711 1959 592 1994 1737 5442 3611 2859 1492 2894 2637 4966 3318 2641 1411 2673 2441
Hospital stays 7295 6527 131 301 434 0 7295 6527 131 301 434 0 5472 4895 98 225 326 0
Clinic visits 230 1292 142 716 119 36 230 1292 142 716 119 36 230 1292 142 663 119 32
Laboratory tests/
X‐rays/ ECGs 478 453 258 145 673 46 497 491 259 164 689 46 497 491 259 164 689 46
Other 4268 1532 1670 1036 5411 476 4268 1532 1670 1036 5411 476 4268 1532 1670 1036 5411 476
Total 16879 12529 4161 2790 8632 2294 17798 13468 5061 3709 9548 3194 15492 11542 4811 3500 9218 2995
Base Case Bedaqualine no‐ shortening Bedaqualine shortening
This report is confidential and not for circulation, quotation or reproduction. It contains original non‐published data
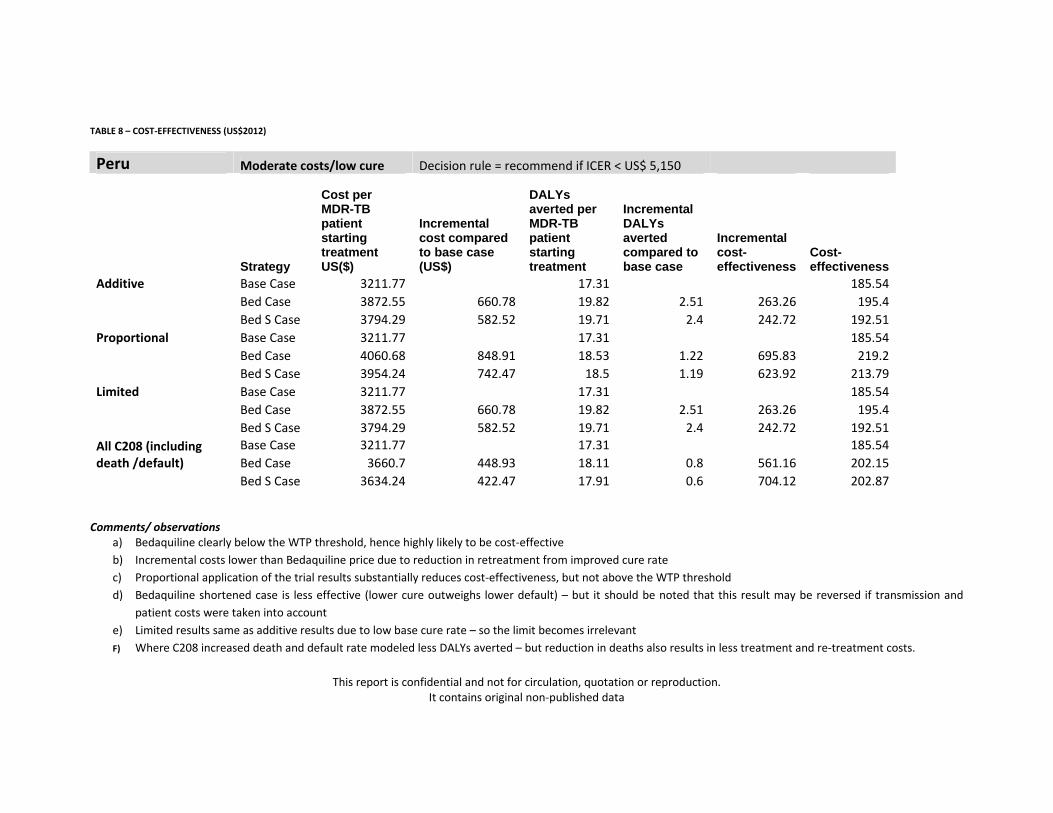
TABLE 8 – COST‐EFFECTIVENESS (US$2012)
Peru Moderate costs/low cure Decision rule = recommend if ICER < US$ 5,150
Strategy
Cost per MDR-TB patient starting treatment US($)
Incremental cost compared to base case (US$)
DALYs averted per MDR-TB patient starting treatment
Incremental DALYs averted compared to base case
Incremental cost-effectiveness
Cost-effectiveness
Additive Base Case 3211.77 17.31 185.54
Bed Case 3872.55 660.78 19.82 2.51 263.26 195.4
Bed S Case 3794.29 582.52 19.71 2.4 242.72 192.51
Proportional Base Case 3211.77 17.31 185.54
Bed Case 4060.68 848.91 18.53 1.22 695.83 219.2
Bed S Case 3954.24 742.47 18.5 1.19 623.92 213.79
Limited Base Case 3211.77 17.31 185.54
Bed Case 3872.55 660.78 19.82 2.51 263.26 195.4
Bed S Case 3794.29 582.52 19.71 2.4 242.72 192.51
All C208 (including death /default)
Base Case 3211.77 17.31 185.54
Bed Case 3660.7 448.93 18.11 0.8 561.16 202.15
Bed S Case 3634.24 422.47 17.91 0.6 704.12 202.87
Comments/ observations a) Bedaquiline clearly below the WTP threshold, hence highly likely to be cost‐effective
b) Incremental costs lower than Bedaquiline price due to reduction in retreatment from improved cure rate
c) Proportional application of the trial results substantially reduces cost‐effectiveness, but not above the WTP threshold
d) Bedaquiline shortened case is less effective (lower cure outweighs lower default) – but it should be noted that this result may be reversed if transmission and
patient costs were taken into account
e) Limited results same as additive results due to low base cure rate – so the limit becomes irrelevant
F) Where C208 increased death and default rate modeled less DALYs averted – but reduction in deaths also results in less treatment and re‐treatment costs.

This report is confidential and not for circulation, quotation or reproduction. It contains original non‐published data

This report is confidential and not for circulation, quotation or reproduction. It contains original non‐published data
Russia High cost/ high cure Decision rule = recommend if ICER < US$ 10,730
Strategy
Cost per MDR-TB patient starting treatment US($)
Incremental cost compared to base case (US$)
DALYs averted per MDR-TB patient starting treatment
Incremental DALYs averted compared to base case
Incremental cost-effectiveness
Cost-effectiveness
Additive Base Case 18290.81 16.42 1113.77
Bed Case 19616.35 1325.54 17.36 0.94 1410.15 1129.75
Bed S Case 17415.35 ‐875.46 17.42 1 Cost saving 999.75
Proportional Base Case 18290.81 16.42 1113.77
Bed Case 19616.35 1325.54 17.36 0.94 1410.15 1129.75
Bed S Case 17415.35 ‐875.46 17.42 1 Cost saving 999.75
Limited Base Case 18290.81 16.42 1113.77
Bed Case 21009.54 2718.73 16.66 0.24 11328.04 1261.25
Bed S Case 18961.9 671.09 16.7 0.28 2396.75 1135.29
All C208 (including death /default)
Base Case 18290.81 16.42 1113.77
Bed Case 19543.99 1253.18 16.18 ‐0.52 Dominated 1207.67
Bed S Case 17391.97 ‐898.84 16.24 ‐0.18 1070.96
Comments/ observations
a) Assuming either an additive or proportional increase in cure rates, Bedaquiline is highly cost‐effective. If treatment shortening is possible may be cost saving (i.e.
the savings from reductions in re‐treatment and reduced hospitalization outweigh the increased regimen cost).
b) If cure rate limited to 80% ‐ then given the high base case cure rate – Bedaquiline has a modest effect and may not be cost‐effective.
c) If Bedaquiline adversely impacts death rate then may be more costly and less effective than base case (dominated by the base case) – as current high cure rates
(and failures going onto retreatment) would be reduced to levels below the current situation.

This report is confidential and not for circulation, quotation or reproduction. It contains original non‐published data
Philippines Moderate cost/moderate cure Decision rule = recommend if ICER < US$ 2,210
Strategy
Cost per MDR-TB patient starting treatment US($)
Incremental cost compared to base case (US$)
DALYs averted per MDR-TB patient starting treatment
Incremental DALYs averted compared to base case
Incremental cost-effectiveness
Cost-effectiveness
Additive Base Case 4022.76 13.25 303.51
Bed Case 4915.71 892.95 16.12 2.87 311.132 304.89
Bed S Case 4873.83 851.07 16.03 2.78 306.140 304.06
Proportional Base Case 4022.76 13.25 303.51
Bed Case 4999.43 976.67 15 1.75 558.097 333.2
Bed S Case 4947.06 924.3 14.94 1.69 546.923 331.05
Limited Base Case 4022.76 13.25 303.51
Bed Case 4944.73 921.97 15.74 2.49 370.269 314.25
Bed S Case 4797.12 774.36 15.78 2.53 306.071 304.03
All C208 (including death /default)
Base Case 4022.76 13.25 303.51
Bed Case 4773.06 750.3 13.3 0.05 15006.000 358.76
Bed S Case 4617.89 595.13 13.4 0.15 3967.533 344.54
Comments/ observations
a) Bedaquiline likely to be cost –effective independent of assumptions about the application of trial cure rate.
b) A shortened regimen reduces costs and effectiveness slightly (to note excludes transmission and patient benefits)
c) Moderate base cure rate results in reasonably comparable impact whichever assumption about incremental cure rate is applied.
d) If all trial results (including death and default are applied) then Bedaquline may not be cost‐effective.
This report is confidential and not for circulation, quotation or reproduction. It contains original non‐published data
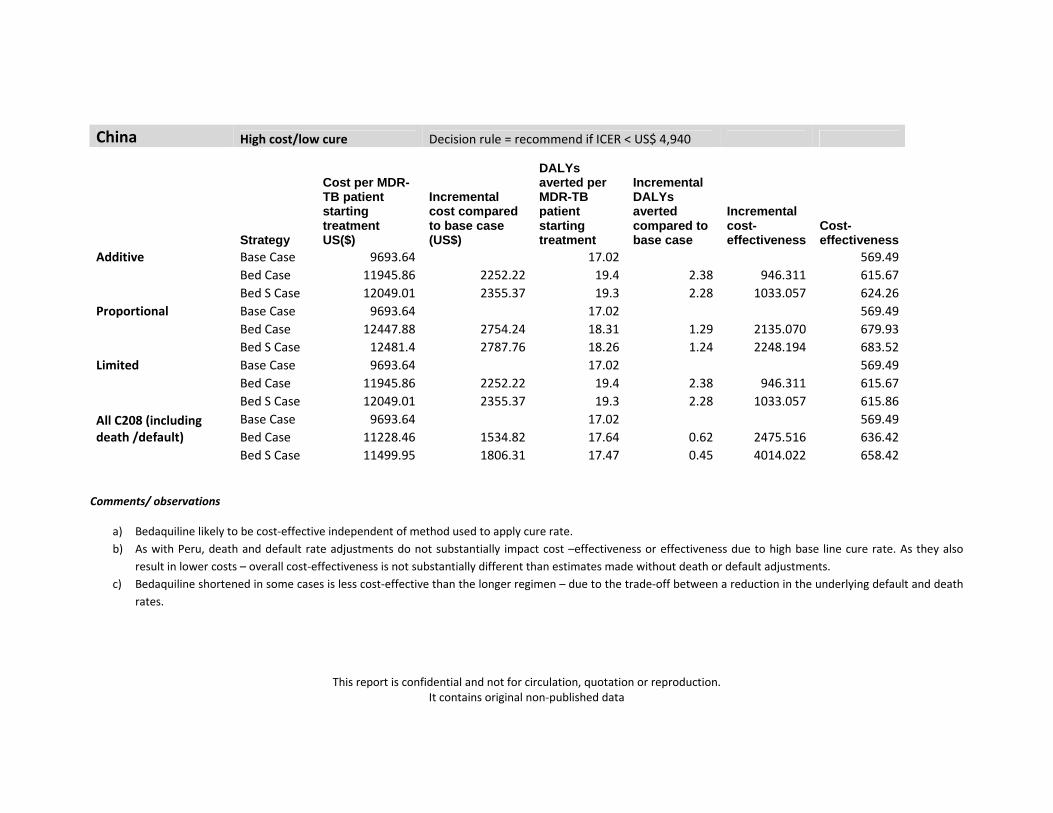
China High cost/low cure Decision rule = recommend if ICER < US$ 4,940
Strategy
Cost per MDR-TB patient starting treatment US($)
Incremental cost compared to base case (US$)
DALYs averted per MDR-TB patient starting treatment
Incremental DALYs averted compared to base case
Incremental cost-effectiveness
Cost-effectiveness
Additive Base Case 9693.64 17.02 569.49
Bed Case 11945.86 2252.22 19.4 2.38 946.311 615.67
Bed S Case 12049.01 2355.37 19.3 2.28 1033.057 624.26
Proportional Base Case 9693.64 17.02 569.49
Bed Case 12447.88 2754.24 18.31 1.29 2135.070 679.93
Bed S Case 12481.4 2787.76 18.26 1.24 2248.194 683.52
Limited Base Case 9693.64 17.02 569.49
Bed Case 11945.86 2252.22 19.4 2.38 946.311 615.67
Bed S Case 12049.01 2355.37 19.3 2.28 1033.057 615.86
All C208 (including death /default)
Base Case 9693.64 17.02 569.49
Bed Case 11228.46 1534.82 17.64 0.62 2475.516 636.42
Bed S Case 11499.95 1806.31 17.47 0.45 4014.022 658.42
Comments/ observations
a) Bedaquiline likely to be cost‐effective independent of method used to apply cure rate.
b) As with Peru, death and default rate adjustments do not substantially impact cost –effectiveness or effectiveness due to high base line cure rate. As they also
result in lower costs – overall cost‐effectiveness is not substantially different than estimates made without death or default adjustments.
c) Bedaquiline shortened in some cases is less cost‐effective than the longer regimen – due to the trade‐off between a reduction in the underlying default and death
rates.
This report is confidential and not for circulation, quotation or reproduction. It contains original non‐published data
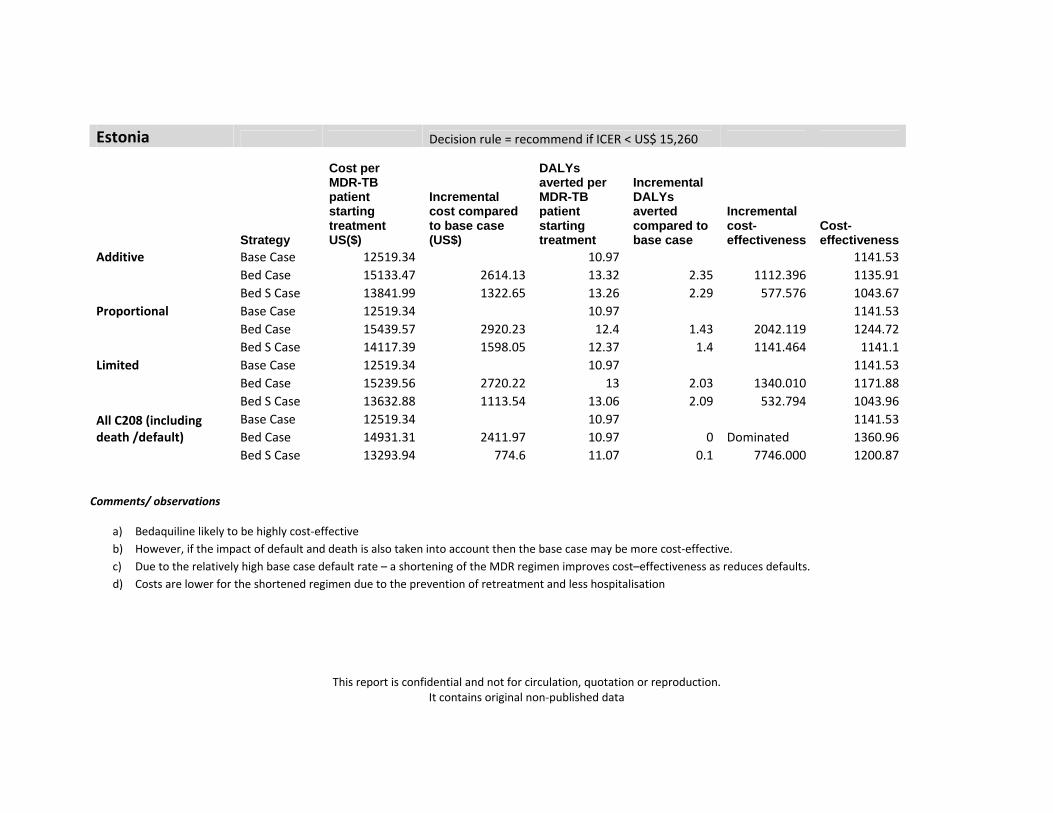
Estonia Decision rule = recommend if ICER < US$ 15,260
Strategy
Cost per MDR-TB patient starting treatment US($)
Incremental cost compared to base case (US$)
DALYs averted per MDR-TB patient starting treatment
Incremental DALYs averted compared to base case
Incremental cost-effectiveness
Cost-effectiveness
Additive Base Case 12519.34 10.97 1141.53
Bed Case 15133.47 2614.13 13.32 2.35 1112.396 1135.91
Bed S Case 13841.99 1322.65 13.26 2.29 577.576 1043.67
Proportional Base Case 12519.34 10.97 1141.53
Bed Case 15439.57 2920.23 12.4 1.43 2042.119 1244.72
Bed S Case 14117.39 1598.05 12.37 1.4 1141.464 1141.1
Limited Base Case 12519.34 10.97 1141.53
Bed Case 15239.56 2720.22 13 2.03 1340.010 1171.88
Bed S Case 13632.88 1113.54 13.06 2.09 532.794 1043.96
All C208 (including death /default)
Base Case 12519.34 10.97 1141.53
Bed Case 14931.31 2411.97 10.97 0 Dominated 1360.96
Bed S Case 13293.94 774.6 11.07 0.1 7746.000 1200.87
Comments/ observations
a) Bedaquiline likely to be highly cost‐effective
b) However, if the impact of default and death is also taken into account then the base case may be more cost‐effective.
c) Due to the relatively high base case default rate – a shortening of the MDR regimen improves cost–effectiveness as reduces defaults.
d) Costs are lower for the shortened regimen due to the prevention of retreatment and less hospitalisation
This report is confidential and not for circulation, quotation or reproduction. It contains original non‐published data
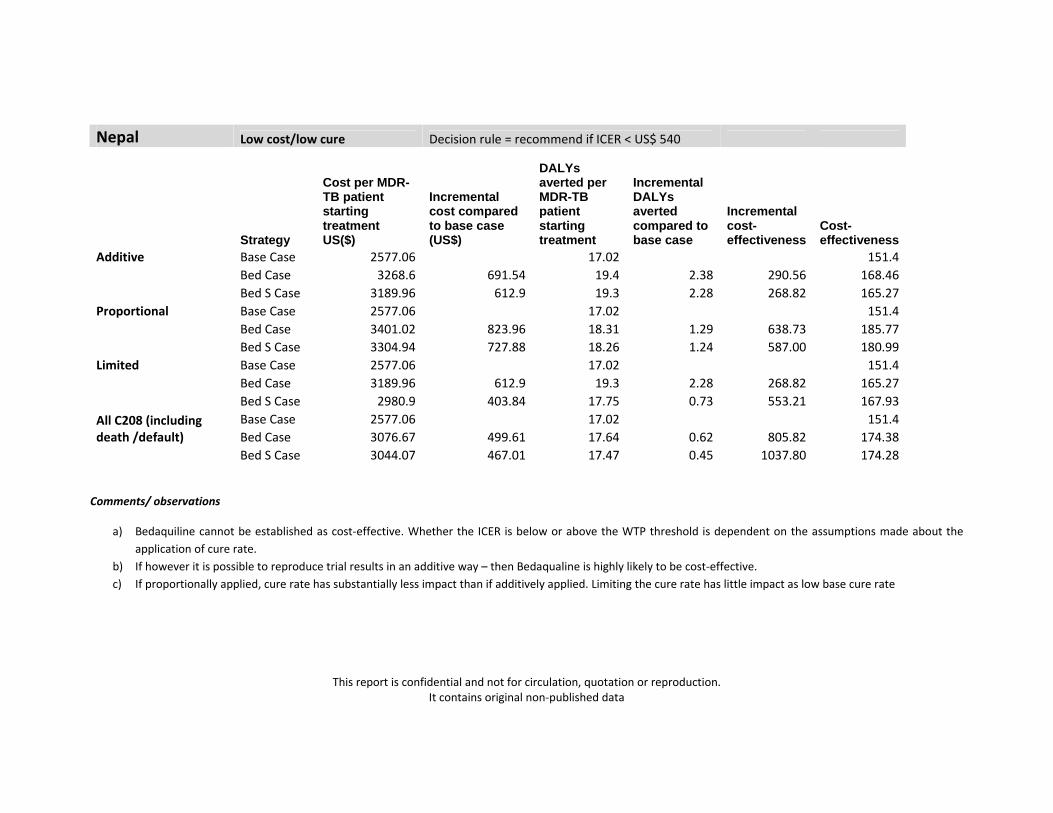
Nepal Low cost/low cure Decision rule = recommend if ICER < US$ 540
Strategy
Cost per MDR-TB patient starting treatment US($)
Incremental cost compared to base case (US$)
DALYs averted per MDR-TB patient starting treatment
Incremental DALYs averted compared to base case
Incremental cost-effectiveness
Cost-effectiveness
Additive Base Case 2577.06 17.02 151.4
Bed Case 3268.6 691.54 19.4 2.38 290.56 168.46
Bed S Case 3189.96 612.9 19.3 2.28 268.82 165.27
Proportional Base Case 2577.06 17.02 151.4
Bed Case 3401.02 823.96 18.31 1.29 638.73 185.77
Bed S Case 3304.94 727.88 18.26 1.24 587.00 180.99
Limited Base Case 2577.06 17.02 151.4
Bed Case 3189.96 612.9 19.3 2.28 268.82 165.27
Bed S Case 2980.9 403.84 17.75 0.73 553.21 167.93
All C208 (including death /default)
Base Case 2577.06 17.02 151.4
Bed Case 3076.67 499.61 17.64 0.62 805.82 174.38
Bed S Case 3044.07 467.01 17.47 0.45 1037.80 174.28
Comments/ observations
a) Bedaquiline cannot be established as cost‐effective. Whether the ICER is below or above the WTP threshold is dependent on the assumptions made about the
application of cure rate.
b) If however it is possible to reproduce trial results in an additive way – then Bedaqualine is highly likely to be cost‐effective.
c) If proportionally applied, cure rate has substantially less impact than if additively applied. Limiting the cure rate has little impact as low base cure rate
This report is confidential and not for circulation, quotation or reproduction. It contains original non‐published data
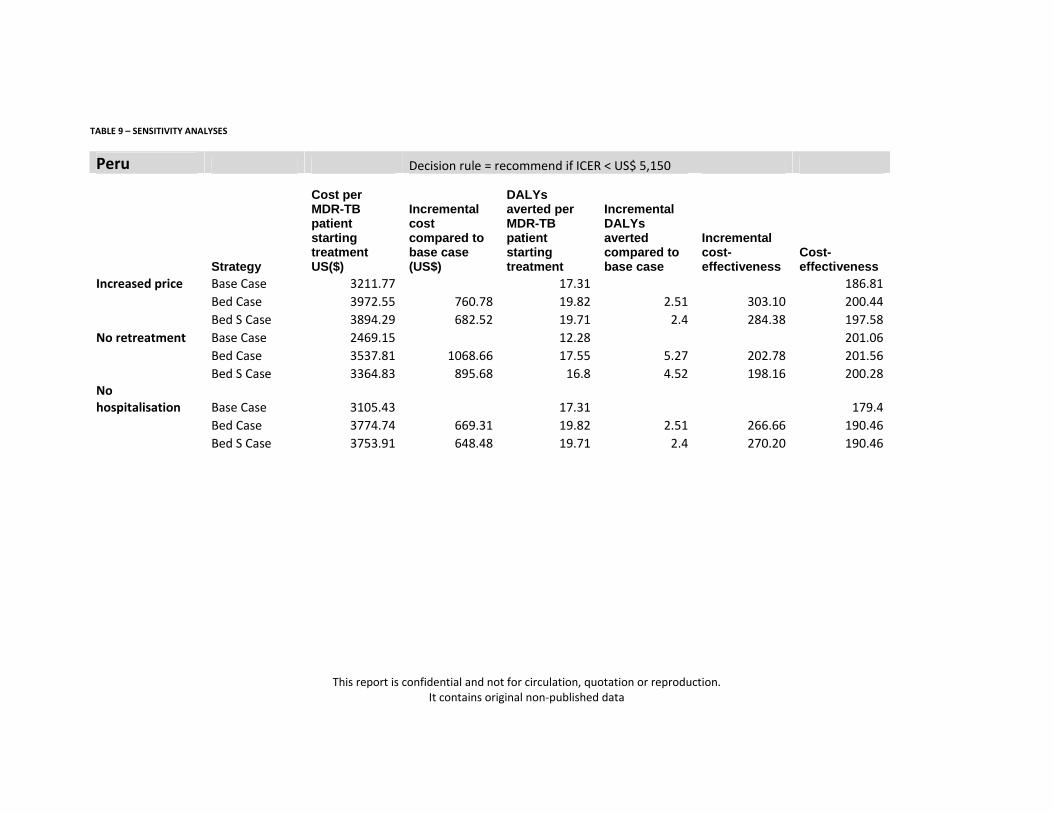
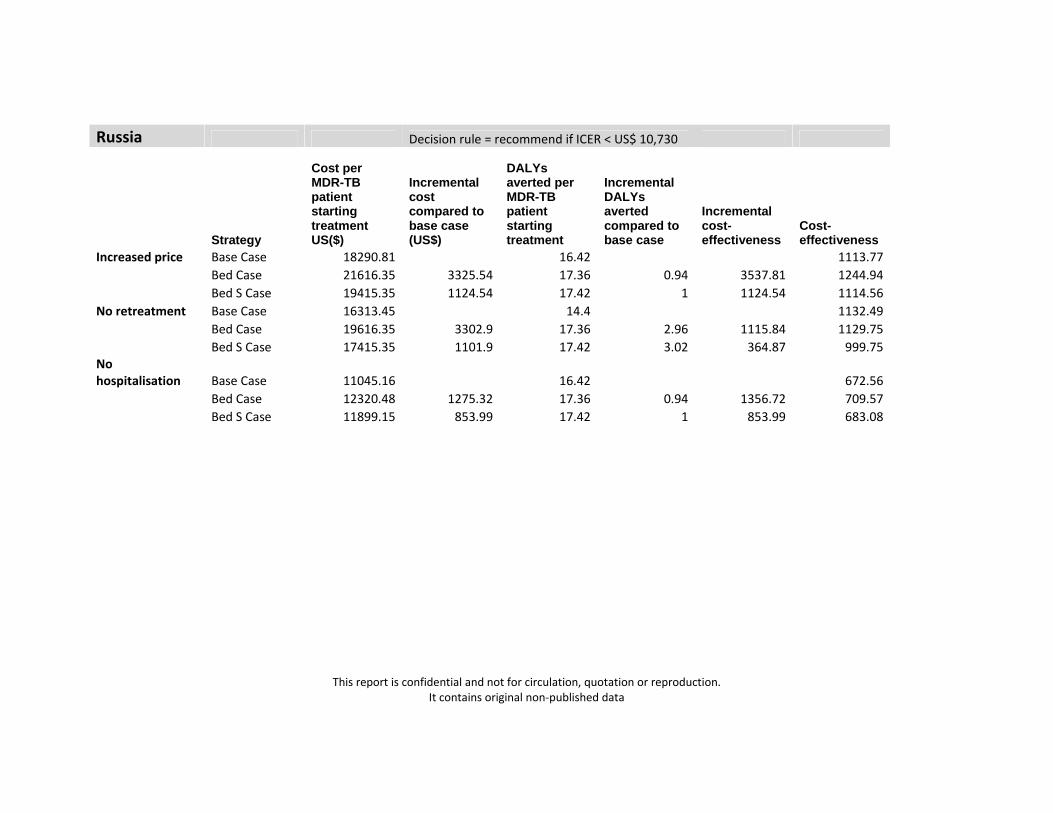
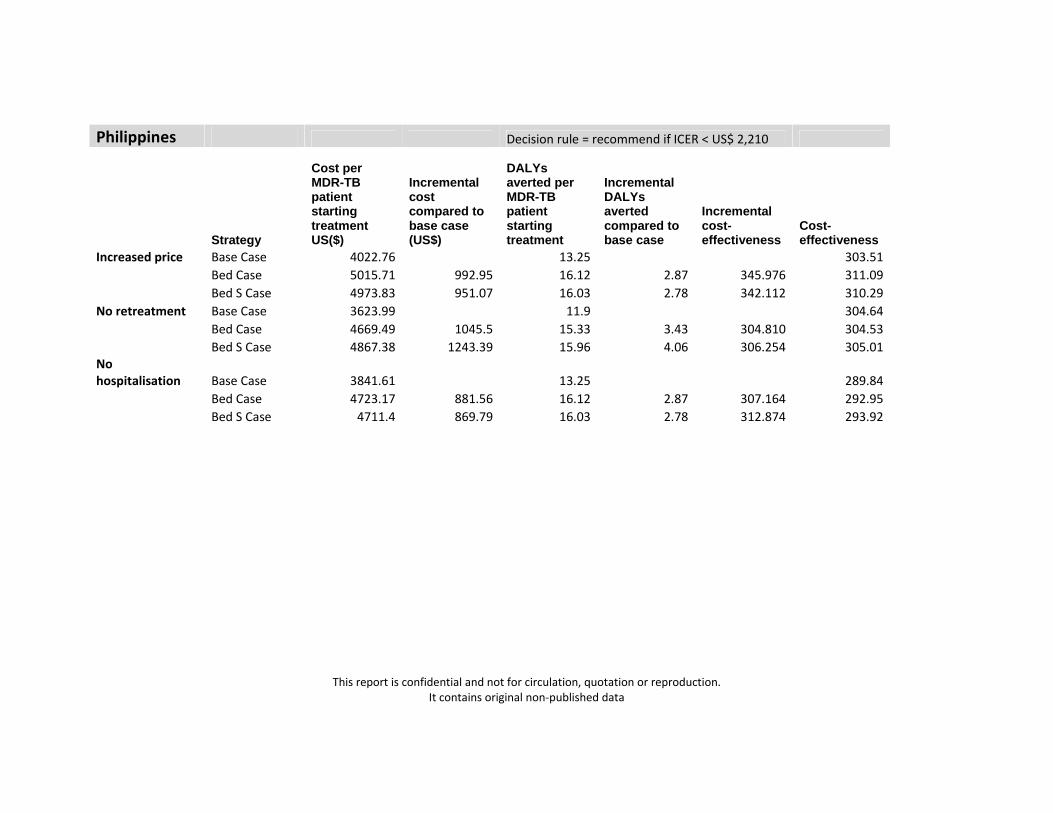
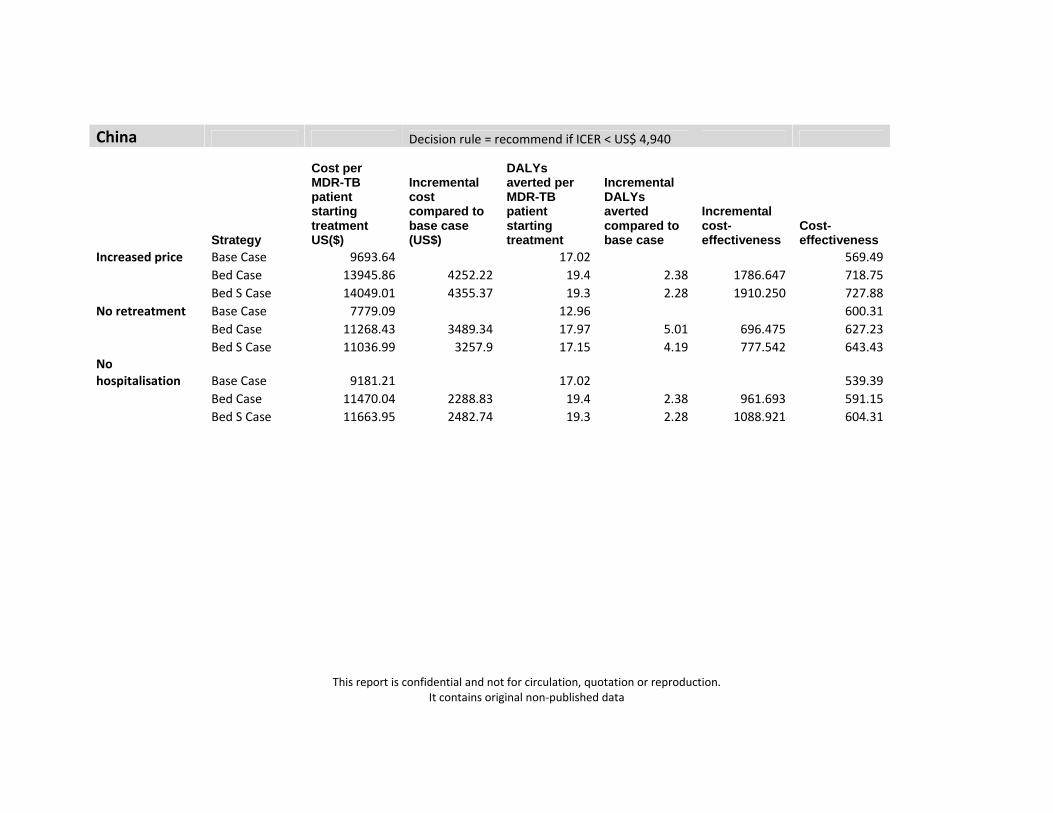
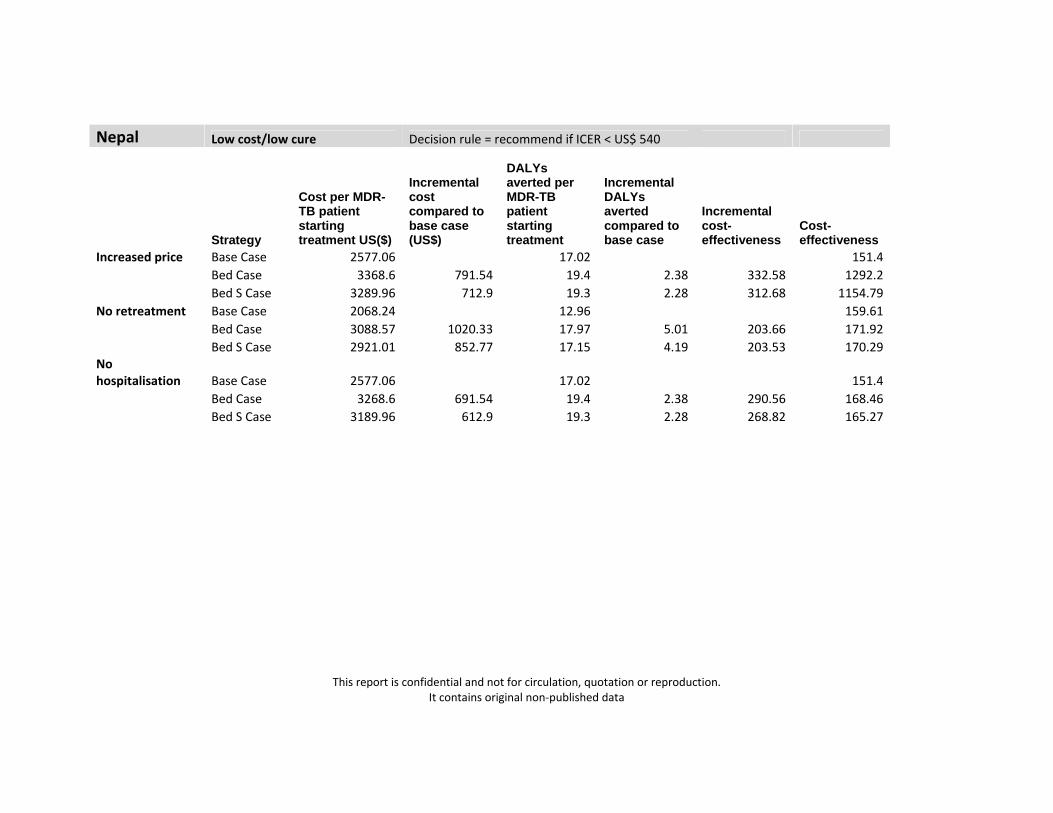
TABLE 9 – SENSITIVITY ANALYSES
Peru Decision rule = recommend if ICER < US$ 5,150
Strategy
Cost per MDR-TB patient starting treatment US($)
Incremental cost compared to base case (US$)
DALYs averted per MDR-TB patient starting treatment
Incremental DALYs averted compared to base case
Incremental cost-effectiveness
Cost-effectiveness
Increased price Base Case 3211.77 17.31 186.81
Bed Case 3972.55 760.78 19.82 2.51 303.10 200.44
Bed S Case 3894.29 682.52 19.71 2.4 284.38 197.58
No retreatment Base Case 2469.15 12.28 201.06
Bed Case 3537.81 1068.66 17.55 5.27 202.78 201.56
Bed S Case 3364.83 895.68 16.8 4.52 198.16 200.28No hospitalisation Base Case 3105.43 17.31 179.4
Bed Case 3774.74 669.31 19.82 2.51 266.66 190.46
Bed S Case 3753.91 648.48 19.71 2.4 270.20 190.46
This report is confidential and not for circulation, quotation or reproduction. It contains original non‐published data
Russia Decision rule = recommend if ICER < US$ 10,730
Strategy
Cost per MDR-TB patient starting treatment US($)
Incremental cost compared to base case (US$)
DALYs averted per MDR-TB patient starting treatment
Incremental DALYs averted compared to base case
Incremental cost-effectiveness
Cost-effectiveness
Increased price Base Case 18290.81 16.42 1113.77
Bed Case 21616.35 3325.54 17.36 0.94 3537.81 1244.94
Bed S Case 19415.35 1124.54 17.42 1 1124.54 1114.56
No retreatment Base Case 16313.45 14.4 1132.49
Bed Case 19616.35 3302.9 17.36 2.96 1115.84 1129.75
Bed S Case 17415.35 1101.9 17.42 3.02 364.87 999.75No hospitalisation Base Case 11045.16 16.42 672.56
Bed Case 12320.48 1275.32 17.36 0.94 1356.72 709.57
Bed S Case 11899.15 853.99 17.42 1 853.99 683.08
This report is confidential and not for circulation, quotation or reproduction. It contains original non‐published data
Philippines Decision rule = recommend if ICER < US$ 2,210
Strategy
Cost per MDR-TB patient starting treatment US($)
Incremental cost compared to base case (US$)
DALYs averted per MDR-TB patient starting treatment
Incremental DALYs averted compared to base case
Incremental cost-effectiveness
Cost-effectiveness
Increased price Base Case 4022.76 13.25 303.51
Bed Case 5015.71 992.95 16.12 2.87 345.976 311.09
Bed S Case 4973.83 951.07 16.03 2.78 342.112 310.29
No retreatment Base Case 3623.99 11.9 304.64
Bed Case 4669.49 1045.5 15.33 3.43 304.810 304.53
Bed S Case 4867.38 1243.39 15.96 4.06 306.254 305.01No hospitalisation Base Case 3841.61 13.25 289.84
Bed Case 4723.17 881.56 16.12 2.87 307.164 292.95
Bed S Case 4711.4 869.79 16.03 2.78 312.874 293.92
This report is confidential and not for circulation, quotation or reproduction. It contains original non‐published data
China Decision rule = recommend if ICER < US$ 4,940
Strategy
Cost per MDR-TB patient starting treatment US($)
Incremental cost compared to base case (US$)
DALYs averted per MDR-TB patient starting treatment
Incremental DALYs averted compared to base case
Incremental cost-effectiveness
Cost-effectiveness
Increased price Base Case 9693.64 17.02 569.49
Bed Case 13945.86 4252.22 19.4 2.38 1786.647 718.75
Bed S Case 14049.01 4355.37 19.3 2.28 1910.250 727.88
No retreatment Base Case 7779.09 12.96 600.31
Bed Case 11268.43 3489.34 17.97 5.01 696.475 627.23
Bed S Case 11036.99 3257.9 17.15 4.19 777.542 643.43No hospitalisation Base Case 9181.21 17.02 539.39
Bed Case 11470.04 2288.83 19.4 2.38 961.693 591.15
Bed S Case 11663.95 2482.74 19.3 2.28 1088.921 604.31

This report is confidential and not for circulation, quotation or reproduction. It contains original non‐published data
Estonia Decision rule = recommend if ICER < US$ 15,260
Strategy
Cost per MDR-TB patient starting treatment US($)
Incremental cost compared to base case (US$)
DALYs averted per MDR-TB patient starting treatment
Incremental DALYs averted compared to base case
Incremental cost-effectiveness
Cost-effectiveness
Increased price Base Case 12519.34 10.97 1141.53
Bed Case 17133.47 4614.13 13.32 2.35 1963.460 1286.03
Bed S Case 15841.99 3322.65 13.26 2.29 1450.939 1194.47
No retreatment Base Case 11448.63 9.96 1149.67
Bed Case 15131.99 3683.36 13.32 3.36 1096.238 1135.92
Bed S Case 13378.67 1930.04 12.83 2.87 672.488 1043.08No hospitalisation Base Case 6008.83 10.97 547.89
Bed Case 8452.71 2443.88 13.32 2.35 1039.949 634.46
Bed S Case 8704.98 2696.15 13.26 2.29 1177.358 656.35
This report is confidential and not for circulation, quotation or reproduction. It contains original non‐published data
Nepal Low cost/low cure Decision rule = recommend if ICER < US$ 540
Strategy
Cost per MDR-TB patient starting treatment US($)
Incremental cost compared to base case (US$)
DALYs averted per MDR-TB patient starting treatment
Incremental DALYs averted compared to base case
Incremental cost-effectiveness
Cost-effectiveness
Increased price Base Case 2577.06 17.02 151.4
Bed Case 3368.6 791.54 19.4 2.38 332.58 1292.2
Bed S Case 3289.96 712.9 19.3 2.28 312.68 1154.79
No retreatment Base Case 2068.24 12.96 159.61
Bed Case 3088.57 1020.33 17.97 5.01 203.66 171.92
Bed S Case 2921.01 852.77 17.15 4.19 203.53 170.29No hospitalisation Base Case 2577.06 17.02 151.4
Bed Case 3268.6 691.54 19.4 2.38 290.56 168.46
Bed S Case 3189.96 612.9 19.3 2.28 268.82 165.27
This report is confidential and not for circulation, quotation or reproduction. It contains original non‐published data
REFERENCES
1. Fitzpatrick C, Floyd K. A systematic review of the cost and cost effectiveness of treatment for multidrug‐resistant tuberculosis. Pharmacoeconomics. 2012 Jan;30(1):63‐80. 2. Floyd K, Hutubessy R, Kliiman K, Centis R, Khurieva N, Jakobowiak W, et al. Cost and cost‐effectiveness of multidrug‐resistant tuberculosis treatment in Estonia and Russia. Eur Respir J. 2012 Jul;40(1):133‐42. 3. Suarez PG, Floyd K, Portocarrero J, Alarcon E, Rapiti E, Ramos G, et al. Feasibility and cost‐effectiveness of standardised second‐line drug treatment for chronic tuberculosis patients: a national cohort study in Peru. Lancet. 2002 Jun 8;359(9322):1980‐9. 4. Tupasi TE, Gupta R, Quelapio MI, Orillaza RB, Mira NR, Mangubat NV, et al. Feasibility and cost‐effectiveness of treating multidrug‐resistant tuberculosis: a cohort study in the Philippines. PLoS Med. 2006 Sep;3(9):e352. 5. Goble M, Iseman MD, Madsen LA, Waite D, Ackerson L, Horsburgh CR, Jr. Treatment of 171 patients with pulmonary tuberculosis resistant to isoniazid and rifampin. N Engl J Med. 1993 Feb 25;328(8):527‐32. 6. Chan ED, Laurel V, Strand MJ, Chan JF, Huynh ML, Goble M, et al. Treatment and outcome analysis of 205 patients with multidrug‐resistant tuberculosis. Am J Respir Crit Care Med. 2004 May 15;169(10):1103‐9. 7. Shillcutt SD, Walker DG, Goodman CA, Mills AJ. Cost effectiveness in low‐ and middle‐income countries: a review of the debates surrounding decision rules. Pharmacoeconomics. 2009;27(11):903‐17.