Cost-Effectiveness Analysis: New methods for old limitations? R Scott Braithwaite, MD, MSc, FACP R...
41
Cost-Effectiveness Cost-Effectiveness Analysis: New Analysis: New methods for old methods for old limitations? limitations? R Scott Braithwaite, MD, MSc, R Scott Braithwaite, MD, MSc, FACP FACP Yale University School of Medicine Yale University School of Medicine Connecticut VA Healthcare System Connecticut VA Healthcare System
-
Upload
june-williams -
Category
Documents
-
view
216 -
download
0
Transcript of Cost-Effectiveness Analysis: New methods for old limitations? R Scott Braithwaite, MD, MSc, FACP R...

Cost-Effectiveness Analysis: Cost-Effectiveness Analysis: New methods for old New methods for old
limitations?limitations?
R Scott Braithwaite, MD, MSc, FACPR Scott Braithwaite, MD, MSc, FACP Yale University School of MedicineYale University School of Medicine
Connecticut VA Healthcare SystemConnecticut VA Healthcare System

CEA LimitationsCEA Limitations
Difficulty interpreting “number” (ICER) Difficulty interpreting “number” (ICER) Is $59,000/life-year good or bad?Is $59,000/life-year good or bad?
A policy tool in search of a U.S. policy A policy tool in search of a U.S. policy “lever” “lever” Other countries use it (e.g. Canada, U.K., Other countries use it (e.g. Canada, U.K.,
Australia, Netherlands) but U.S. payers Australia, Netherlands) but U.S. payers don’t don’t
Does not incorporate quality of evidence Does not incorporate quality of evidence An analysis based on a high-quality study An analysis based on a high-quality study
may appear to have same certitude as may appear to have same certitude as analysis based on expert opinionanalysis based on expert opinion

New CEA Methods New CEA Methods
Decision rules for interpreting Decision rules for interpreting resultsresults
Linking results to policy “levers” in Linking results to policy “levers” in U.SU.S
Incorporating quality of evidenceIncorporating quality of evidence

Question: How can we use Question: How can we use CEA to inform statin CEA to inform statin formulary decisions ?formulary decisions ?
Case 1. 64 year-old female diabetic, Case 1. 64 year-old female diabetic, prior MI, pre-treatment LDL 137prior MI, pre-treatment LDL 137
Case 2. 41 year-old male, no cardiac Case 2. 41 year-old male, no cardiac risk factors or history of risk factors or history of cardiovascular disease, pre-cardiovascular disease, pre-treatment LDL 167treatment LDL 167 Note: Treatment of both patients Note: Treatment of both patients
endorsed by current NCEP guidelinesendorsed by current NCEP guidelines
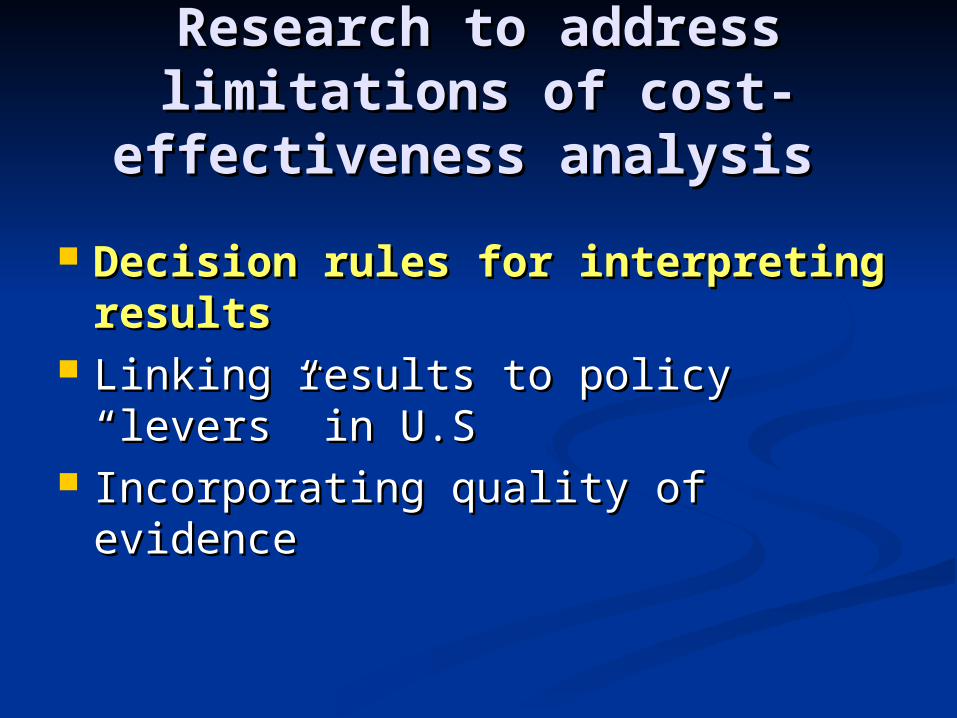
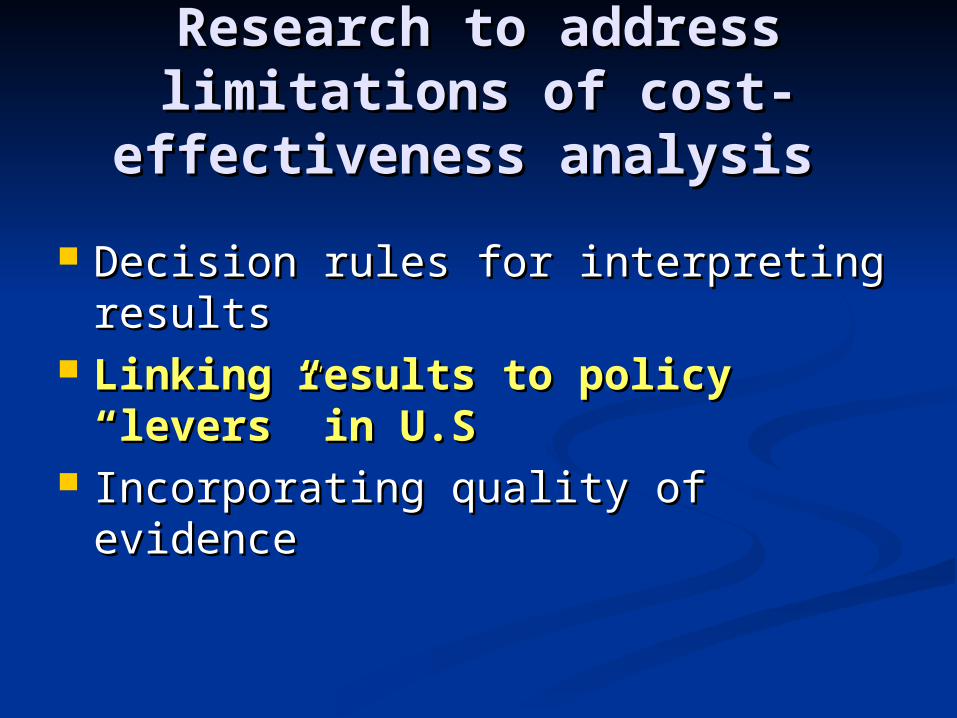
Research to address Research to address limitations of cost-limitations of cost-
effectiveness analysis effectiveness analysis
Decision rules for interpreting Decision rules for interpreting resultsresults
Linking results to policy “levers” in Linking results to policy “levers” in U.SU.S
Incorporating quality of evidenceIncorporating quality of evidence
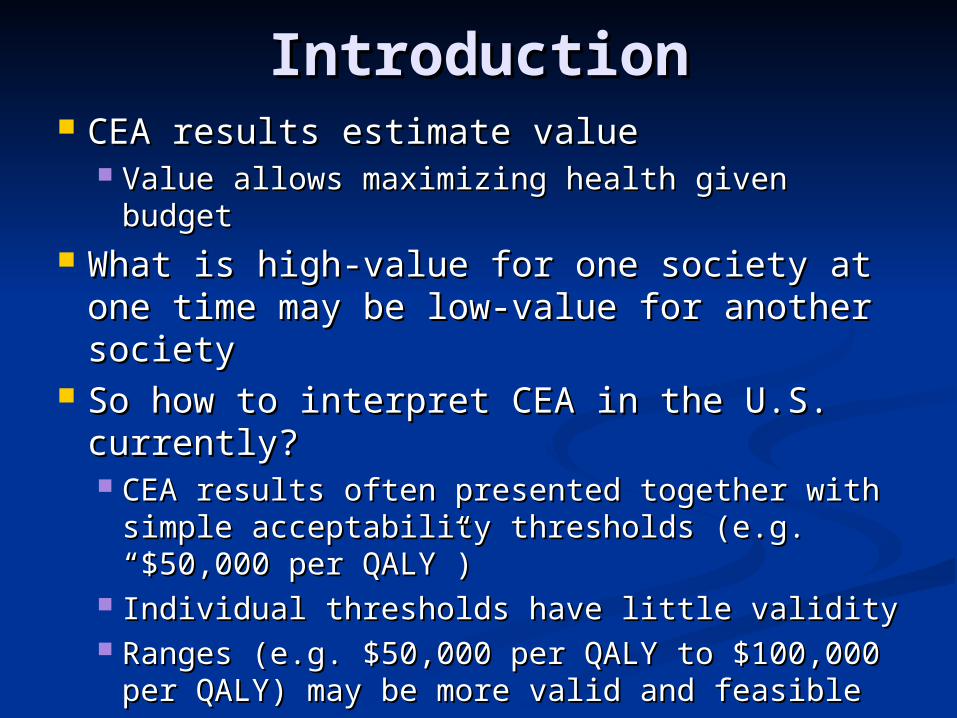
IntroductionIntroduction CEA results estimate valueCEA results estimate value
Value allows maximizing health given budgetValue allows maximizing health given budget What is high-value for one society at one What is high-value for one society at one
time may be low-value for another time may be low-value for another societysociety
So how to interpret CEA in the U.S. So how to interpret CEA in the U.S. currently?currently? CEA results often presented together with CEA results often presented together with
simple acceptability thresholds (e.g. simple acceptability thresholds (e.g. “$50,000 per QALY”)“$50,000 per QALY”)
Individual thresholds have little validityIndividual thresholds have little validity Ranges (e.g. $50,000 per QALY to $100,000 Ranges (e.g. $50,000 per QALY to $100,000
per QALY) may be more valid and feasibleper QALY) may be more valid and feasible

ObjectiveObjective
To inform decision rules for CEA To inform decision rules for CEA interpretation based on health care interpretation based on health care purchasing choices in USpurchasing choices in US Two distinct but complementary Two distinct but complementary
analyses to estimate upper- and lower-analyses to estimate upper- and lower-bounds of range bounds of range

MethodsMethods
Analysis #1:Analysis #1: Estimate cost- Estimate cost-effectiveness of “modern” health effectiveness of “modern” health carecare
Individuals prefer cost/benefit of Individuals prefer cost/benefit of modern health care to cost/benefit of modern health care to cost/benefit of pre-modern care pre-modern care
If willing to pay for modern care, then If willing to pay for modern care, then should be willing to pay for services should be willing to pay for services that have same or better cost-that have same or better cost-effectiveness as modern careeffectiveness as modern care May inform lower bound for decision rule May inform lower bound for decision rule

MethodsMethods Analysis #2 :Analysis #2 : Estimate cost-effectiveness Estimate cost-effectiveness
of unsubsidized health insurance of unsubsidized health insurance Individuals prefer cost/benefit of no Individuals prefer cost/benefit of no
insurance to cost/benefit of unsubsidized insurance to cost/benefit of unsubsidized insurance insurance Free rider effect: Pay 1/10 costs, get 2/3 benefit Free rider effect: Pay 1/10 costs, get 2/3 benefit
If not willing to pay for unsubsidized If not willing to pay for unsubsidized insurance, then should be not willing to pay insurance, then should be not willing to pay for services that have same or worse cost-for services that have same or worse cost-effectiveness effectiveness May inform higher bound for decision ruleMay inform higher bound for decision rule

0%
10%
20%
30%
40%
50%
60%
70%
80%
90%
100%
<100% 100%-199% 200%-299% 300%-399% ≥400%
<$19K $19K-$37K $38K-$56K $57K-$75K >$75K
% Willing to Pay for Health Insurance No Employer Subsidy Employer Subsidy
% Poverty Line
Income (Family of 4)

Cost-effectiveness of modern Cost-effectiveness of modern health carehealth care
Incremental Incremental benefitsbenefits of modern care of modern care 53% of observed mortality decrease53% of observed mortality decrease 4.7 life-years4.7 life-years
Incremental lifetime Incremental lifetime costscosts of modern of modern carecare $452,000 $452,000
IncrementalIncremental cost-effectiveness cost-effectiveness of of modern caremodern care $96,000 per life-year$96,000 per life-year Approximately $100,000 per QALYApproximately $100,000 per QALY
Braithwaite RS et al, Med Care 2008; 46:349-356

Cost-effectiveness of Cost-effectiveness of unsubsidized insuranceunsubsidized insurance
Incremental Incremental benefitsbenefits of buying (for of buying (for 1 year)1 year) Mortality reduced by 18%Mortality reduced by 18% LE increased by 0.020 years LE increased by 0.020 years
Incremental Incremental costscosts of buying (for 1 of buying (for 1 year)year) $4100 $4100
Incremental cost-effectivenessIncremental cost-effectiveness of of buying unsubsidized insurancebuying unsubsidized insurance $204,000 per life-year$204,000 per life-year Approximately $300,000 per QALY Approximately $300,000 per QALY
Braithwaite RS et al, Med Care 2008; 46:349-356
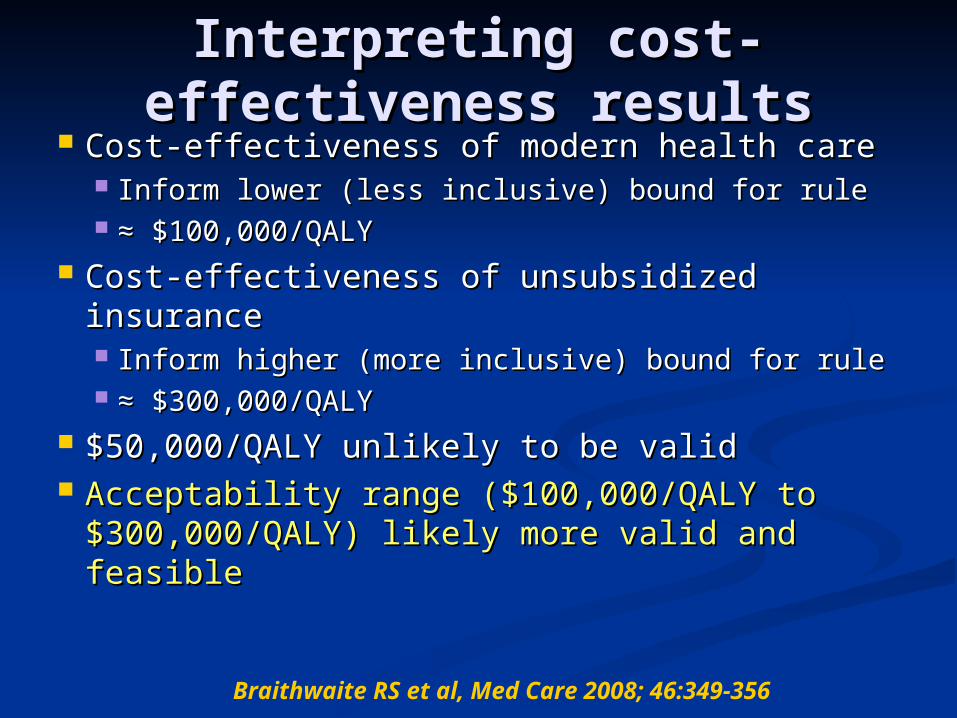
Interpreting cost-Interpreting cost-effectiveness resultseffectiveness results
Cost-effectiveness of modern health careCost-effectiveness of modern health care Inform lower (less inclusive) bound for ruleInform lower (less inclusive) bound for rule ≈ ≈ $100,000/QALY $100,000/QALY
Cost-effectiveness of unsubsidized Cost-effectiveness of unsubsidized insuranceinsurance Inform higher (more inclusive) bound for ruleInform higher (more inclusive) bound for rule ≈ ≈ $300,000/QALY$300,000/QALY
$50,000/QALY unlikely to be valid$50,000/QALY unlikely to be valid Acceptability range ($100,000/QALY to Acceptability range ($100,000/QALY to
$300,000/QALY) likely more valid and $300,000/QALY) likely more valid and feasiblefeasible
Braithwaite RS et al, Med Care 2008; 46:349-356

Question: How can we use Question: How can we use CEA to inform statin CEA to inform statin formulary decisions ?formulary decisions ?
Case 1. 64 year-old female diabetic, Case 1. 64 year-old female diabetic, prior MI, pre-treatment LDL 137prior MI, pre-treatment LDL 137 Incremental cost-effectiveness Incremental cost-effectiveness
<$10,000/QALY<$10,000/QALY FavorableFavorable
Case 2. 41 year-old male, no cardiac risk Case 2. 41 year-old male, no cardiac risk factors or history of cardiovascular factors or history of cardiovascular disease, pre-treatment LDL 167disease, pre-treatment LDL 167 Incremental cost-effectiveness Incremental cost-effectiveness
$420,000/QALY$420,000/QALY UnfavorableUnfavorable
Research to address Research to address limitations of cost-limitations of cost-
effectiveness analysis effectiveness analysis
Decision rules for interpreting Decision rules for interpreting resultsresults
Linking results to policy “levers” Linking results to policy “levers” in U.Sin U.S
Incorporating quality of evidenceIncorporating quality of evidence

BackgroundBackground
Cost-sharing becoming a standard “volume Cost-sharing becoming a standard “volume knob” to control utilization in U.S.knob” to control utilization in U.S.
Cost-sharing hasCost-sharing has Great potential to control costsGreat potential to control costs Great potential to cause harmGreat potential to cause harm
Increasing calls to link cost-sharing to Increasing calls to link cost-sharing to value (e.g. value-based insurance value (e.g. value-based insurance design)design) No cost-sharing for high-value servicesNo cost-sharing for high-value services Same or increased cost-sharing for low-value Same or increased cost-sharing for low-value
servicesservices
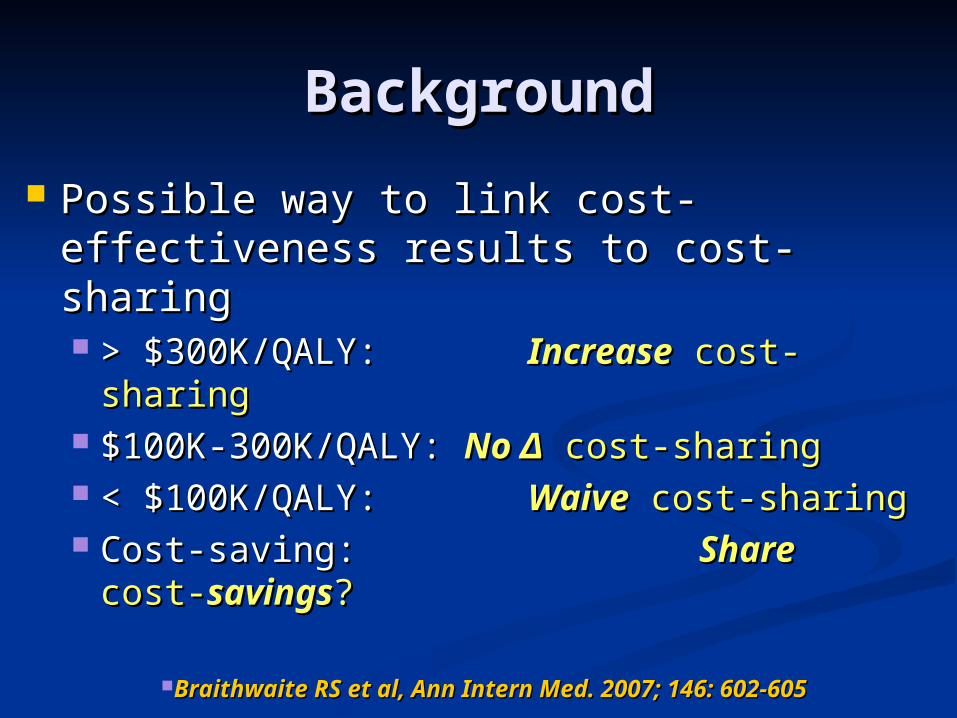
BackgroundBackground
Possible way to link cost-effectiveness Possible way to link cost-effectiveness results to cost-sharingresults to cost-sharing > $300K/QALY: > $300K/QALY: IncreaseIncrease cost-sharing cost-sharing $100K-300K/QALY: $100K-300K/QALY: No No ΔΔ cost-sharing cost-sharing < $100K/QALY: < $100K/QALY: WaiveWaive cost-sharing cost-sharing Cost-saving: Cost-saving: ShareShare cost- cost-
savingssavings??
Braithwaite RS et al, Ann Intern Med. 2007; 146: 602-Braithwaite RS et al, Ann Intern Med. 2007; 146: 602-605605

PurposePurpose
To estimate the impact of value-To estimate the impact of value-linked cost-sharing if it were applied linked cost-sharing if it were applied systematically across US health systematically across US health system system

Methods Methods
Cost-Cost-sharingsharing
0%0% 18%18%
(Curren(Current)t)
30%30% 100%100%
Relative Relative utilizatioutilizationn
1.061.06 1.001.00 0.850.85 0.650.65
• From RAND, we can estimate the impact of cost-sharing amount on health service demand
• Results confirmed by >100 observational studies

Age NHealth
expenditure
New year = new “pull” from cost-effectiveness distribution
Insured Uninsured Insured, value-based cost-sharing
High cost-sharing
lowers health expenditures
Prevailing cost-sharing
maintains health
expenditures
Value increases, lowers, or maintains
health expenditures
Age N+1
Mortality

4.5
4.6
4.7
4.8
4.9
5
5.1
5.2
5.3
Current cost-shar Current insurance
Current cost-shar Expand insurance
Value-based cost-shar Current insurance
Value-based cost-shar Expand insurance
20% 30% 40% 50% Copayment if low-value
No cost-shar, Expand insurance
Life Expectancy Gain (Years)

4800
5000
5200
5400
5600
5800
6000
6200
6400
Current cost-shar Current insurance
Current cost-shar Expand insurance
Value-based cost-shar Current insurance
Value-based cost-shar Expand insurance
20% 30% 40% 50% Copayment if low-value
No cost-shar, Expand insurance
Annual per-capita cost (2003 $)
ConclusionsConclusions
Value-linked cost-sharing may Value-linked cost-sharing may increase life expectancy from health increase life expectancy from health care while reducing costscare while reducing costs
Costs may be lowered sufficiently to Costs may be lowered sufficiently to offset incremental expenditures from offset incremental expenditures from expanding health insurance coverageexpanding health insurance coverage

Question: How can we use Question: How can we use CEA to inform statin CEA to inform statin formulary decisions ?formulary decisions ?
Case 1. 64 year-old female diabetic, prior MI, Case 1. 64 year-old female diabetic, prior MI, pre-treatment LDL 137pre-treatment LDL 137 Incremental cost-effectiveness Incremental cost-effectiveness <$10,000/QALY<$10,000/QALY FavorableFavorable No cost-sharing No cost-sharing
Case 2. 41 year-old male, no cardiac risk Case 2. 41 year-old male, no cardiac risk factors or history of cardiovascular disease, factors or history of cardiovascular disease, pre-treatment LDL 167pre-treatment LDL 167 Incremental cost-effectiveness Incremental cost-effectiveness $420,000/QALY$420,000/QALY UnfavorableUnfavorable Higher cost-sharing (30%-35%)Higher cost-sharing (30%-35%)
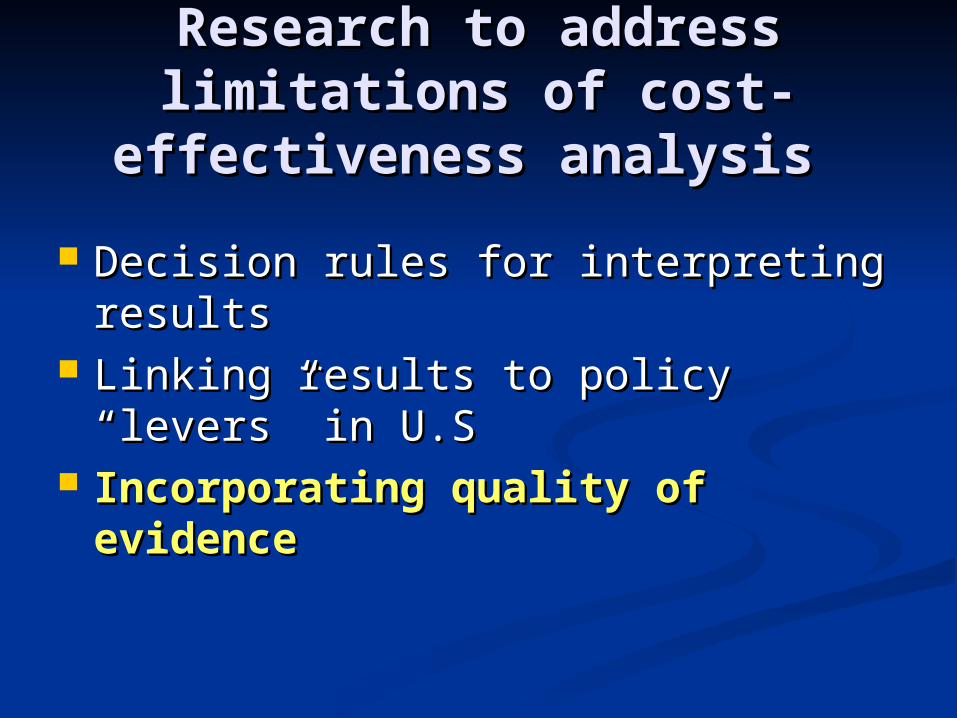
Research to address Research to address limitations of cost-limitations of cost-
effectiveness analysis effectiveness analysis
Decision rules for interpreting Decision rules for interpreting resultsresults
Linking results to policy “levers” in Linking results to policy “levers” in U.SU.S
Incorporating quality of evidenceIncorporating quality of evidence

ProblemProblem
Clinicians and policy-makers often Clinicians and policy-makers often wonder “what goes into the model”wonder “what goes into the model”
Current methods for cost-Current methods for cost-effectiveness analysis take into effectiveness analysis take into account uncertainty from random account uncertainty from random variation but not from low-quality variation but not from low-quality evidenceevidence

ObjectiveObjective
Can we augment standard cost-Can we augment standard cost-effectiveness analysis methods to effectiveness analysis methods to develop a sensitivity analysis based develop a sensitivity analysis based on quality of evidence? on quality of evidence?
MethodsMethods Basic concept of our approachBasic concept of our approach
When potential information sources When potential information sources have insufficient quality of evidence, have insufficient quality of evidence, don’t use themdon’t use them
Instead, assume that little is known by Instead, assume that little is known by using uninformative distributions over using uninformative distributions over wide rangewide range
Don’t obscure questionable data under Don’t obscure questionable data under a “false veneer of mathematical a “false veneer of mathematical certitude” certitude” Warning!Warning! If you set evidence If you set evidence
standards very high, not much of the standards very high, not much of the available evidence may qualify.available evidence may qualify.

MethodsMethods Assess quality of evidence using USPSTF Assess quality of evidence using USPSTF
guidelines guidelines Study designStudy design
Design differs from controlled experiment Design differs from controlled experiment Internal validityInternal validity
Results represent truth in study Results represent truth in study populationpopulation
External validityExternal validity Results represent truth in target Results represent truth in target
populationpopulation Our approach can be used with Our approach can be used with anyany evidence- evidence-
evaluation hierarchyevaluation hierarchy We chose USPSTF guidelines because of We chose USPSTF guidelines because of
ubiquity not because of rigorubiquity not because of rigor

MethodsMethods
Set minimum standard in each evidence Set minimum standard in each evidence domaindomain These can be “dialed” up or down at willThese can be “dialed” up or down at will
Evaluate each possible source of evidence Evaluate each possible source of evidence If source meets evidence criterion, use its If source meets evidence criterion, use its
95% confidence interval in the analysis95% confidence interval in the analysis If evidence does not meet criterion, do not If evidence does not meet criterion, do not
use it in the analysis use it in the analysis Instead use uninformative (“wide”) distribution Instead use uninformative (“wide”) distribution

Test Case: Directly Test Case: Directly observed therapy for HIV observed therapy for HIV
antiretroviralsantiretrovirals Base Case: No evidence criteria Base Case: No evidence criteria
All 17 data sources eligible for parameter estimationAll 17 data sources eligible for parameter estimation Study DesignStudy Design set to highest standard (“1”) set to highest standard (“1”)
1313 out of 17 sources were eligible out of 17 sources were eligible Internal ValidityInternal Validity set to highest standard set to highest standard
(“good”)(“good”) 99 out of 17 sources were eligible out of 17 sources were eligible
External ValidityExternal Validity set to highest standard set to highest standard (“high”)(“high”) 55 out of 17 sources were eligible out of 17 sources were eligible
All three criteria All three criteria set to highest standardsset to highest standards 33 out of 17 sources were eligible out of 17 sources were eligible

Results: All EvidenceResults: All Evidence
Braithwaite RS et al, Ann Intern Med 2007; 146:133-141

Results: Internal Validity Results: Internal Validity “Good”“Good”
Braithwaite RS et al, Ann Intern Med 2007; 146:133-141

Results: Study Design Results: Study Design “1”“1”
Braithwaite RS et al, Ann Intern Med 2007; 146:133-141

Results: External Validity Results: External Validity “High”“High”
Braithwaite RS et al, Ann Intern Med 2007; 146:133-141

Results: All 3 CriteriaResults: All 3 Criteria
Braithwaite RS et al, Ann Intern Med 2007; 146:133-141

ConclusionsConclusions
Quality of evidence may have Quality of evidence may have profound impact on the precision and profound impact on the precision and estimates of CEAsestimates of CEAs
Stricter evidence criteria may Stricter evidence criteria may produce more uncertain results produce more uncertain results because there are fewer studies to because there are fewer studies to base assumptions on base assumptions on
Approach shows when evidence is not Approach shows when evidence is not good enough for decision makinggood enough for decision making Need higher-quality information on HIV Need higher-quality information on HIV
DOT DOT

Question: How can we use Question: How can we use CEA to inform statin CEA to inform statin formulary decisions ?formulary decisions ?
Case 1. 64 year-old female diabetic, Case 1. 64 year-old female diabetic, prior MI, pre-treatment LDL 137prior MI, pre-treatment LDL 137 Incremental cost-effectiveness Incremental cost-effectiveness
<$10,000/QALY<$10,000/QALY Value:Value: Favorable Favorable Likely <$100,000/QALY if strict evidence Likely <$100,000/QALY if strict evidence
std?std? Yes Yes Decision:Decision: No cost-sharing No cost-sharing

Question: How can we use Question: How can we use CEA to inform statin CEA to inform statin formulary decisions ?formulary decisions ?
Case 2. 41 year-old male, no cardiac risk Case 2. 41 year-old male, no cardiac risk factors or history of cardiovascular factors or history of cardiovascular disease, pre-treatment LDL 167disease, pre-treatment LDL 167 Incremental cost-effectiveness Incremental cost-effectiveness
$420,000/QALY$420,000/QALY Value:Value: Unfavorable Unfavorable Likely ≥$300,000/QALY if strict evidence Likely ≥$300,000/QALY if strict evidence
std?std? Yes Yes Decision:Decision: Higher cost-sharing (30%-35%) Higher cost-sharing (30%-35%)
Cost-Effectiveness Analysis Cost-Effectiveness Analysis Limitations Limitations (and possible (and possible
solutions)solutions) Difficulty interpreting end-result Difficulty interpreting end-result
Give policy makers decision rules Give policy makers decision rules demarcating low from intermediate from demarcating low from intermediate from high cost-effectivenesshigh cost-effectiveness
A policy tool in search of a U.S. policy A policy tool in search of a U.S. policy “lever” “lever” Link CEA results to level of cost-sharingLink CEA results to level of cost-sharing
Does not incorporate quality of evidence Does not incorporate quality of evidence Let policymakers and payers specify Let policymakers and payers specify
minimum threshold of evidence for minimum threshold of evidence for decision makingdecision making

Questions ??????Questions ?????? Special thanks toSpecial thanks to
MentorsMentors Amy C Justice, MD, PhDAmy C Justice, MD, PhD Mark S Roberts, MD, MPPMark S Roberts, MD, MPP
FundersFunders NIAAANIAAA RWJRWJ
Co-authors, includingCo-authors, including David O. Meltzer, MD, PhDDavid O. Meltzer, MD, PhD Joseph King, MDJoseph King, MD Alison B. Rosen, MD, ScDAlison B. Rosen, MD, ScD John Concato, MD, MScJohn Concato, MD, MSc