Cost Effectiveness Analysis - George Mason Universitymason.gmu.edu/~aloerch/Levinelec.pdf · 2 Page...
27
1 Page 1 Slide 1 Cost Effectiveness Analysis Dan Levine Institute for Defense Analyses January 25, 2001 Slide 2 TOPICS • Decision-making and cost effectiveness • Methodology • Example • Theoretical foundations • Elaboration of methodology • Criticisms of cost effectiveness analysis
Transcript of Cost Effectiveness Analysis - George Mason Universitymason.gmu.edu/~aloerch/Levinelec.pdf · 2 Page...

1
Page 1
Slide 1
Cost Effectiveness Analysis
Dan Levine
Institute for Defense AnalysesJanuary 25, 2001
Slide 2
TOPICS
• Decision-making and cost effectiveness• Methodology• Example• Theoretical foundations• Elaboration of methodology• Criticisms of cost effectiveness analysis

2
Page 2
Slide 3
DECISION-MAKING
Most decisions by government,business and households ---
--- involve allocatingresources ---
-- which means decidingamong alternatives ---
--- which requires consideringcosts and benefits
Slide 4
COMMON DECISION-MAKING METHODS
• Judgments by officials and professionals– Captures corporate memory and institutional knowledge
But decision makers often disagree
• Immersion in the facts– Stays in contact with reality
But “what is” diverts attention from “what could be”
• Holistic approach (“Since judgment calls are required, let the practitioner decide”)– People learn to do very well what they do every day
But practitioners do not spend their days studying alternatives, costs and benefits

3
Page 3
Slide 5
• Deals with objective, alternatives, costand benefits explicitly
• Does it quantitatively as much as possible
ANOTHER METHOD:COST EFFECTIVENESS
Slide 6
SOME ODDS AND ENDS
• Cost effectiveness– is a methodology, not a type of effectiveness– is sometimes called “systems analysis”– is related to profit maximization and cost–
benefit analysis– in defense analysis, focuses on the peacetime
cost of wartime capability

4
Page 4
Slide 7
COST EFFECTIVENESSMETHODOLOGY
• Define Objectives What do we want to do?• Structure Alternatives What are the ways to do it?• Calculate Effectiveness What do we gain?• Estimate Costs What do we lose?• Choose a Criterion Which alternative is best?
Slide 8
SOME CRUCIAL ISSUES
• If at all possible, construct alternatives that holdsomething constant– Hold cost constant and maximize effectiveness
Or– Hold effectiveness constant and minimize cost
• If this is impossible to bring off (i.e., cost and effectiveness both vary)– Identify cost-effectiveness frontier– Calculate cost-effectiveness ratios
• Don’t carry out the steps sequentially

5
Page 5
Slide 9
OTHER IMPORTANT ISSUES
• Construct a “base case” using the most plausible inputs
• Conduct sensitivity analyses to cover uncertainties• List omitted factors and indicate
their likely effects• Highlight critical issues requiring judgment calls• Should the analyst make policy recommendations?
Slide 10
APPLICATIONS
• Government– Buy new C-17s or stretch B-52s?– Extend subway to Dulles or widen the road?
• Industrial– What kind of plant to build?
• Medical– What diagnosis tools are best?
• Consumer– Toyota or Lexus?

6
Page 6
Slide 11
AN EXAMPLE:BUYING A NEW CAR
Buy a Chevy Buy a Honda Buy a Chevy Buy a ChevyRent a Mercedes Fly Between Cities
for Inter -city Travel
Unit CostProcurement $15,000 $20,000 $15,000 $15,000Operating
City $0.14/mi $0.12/mi $0.14/mi $0.14/miCountry $0.10/mi $0.08/mi
Rental $0.40/miAirlines $0.20/miSalvage value $5,000 $10,000 $6,000 $6,000
Unit EffectivenessMiles in city 10,000 mi/yr 10,000 mi/yr 10,000 mi/yr 10,000 mi/yrMiles in country 5,000 mi/yr 5,000 mi/yr 5,000 mi/yr 5,000 mi/yr
Total 10-year cost $29,000 $26,000 $43,000 $33,000Total 10-year effectiveness
City 100,000 mi 100,000 mi 100,000 mi 100,000 miCountry 50,000 mi 50,000 mi 50,000 mi 50,000 mi
Slide 12
WHY SHOULD COST ANALYSTSUNDERSTAND COST EFFECTIVENESS
• We do cost analyses to support decision making• The decision affects the structure of the cost
analysis– Which costs are relevant– What discount rate to use– How much accuracy is necessary?

7
Page 7
Slide 13
THEORETICAL FOUNDATIONS
Cost Effectiveness is a branch of microeconomics
Benefit Cost CriterionPrivate Sector Revenue ($) Cost ($) Maximize profit ($)
Public Sector,Marketable Output Benefit ($) Cost ($) Maximize the ratio
Public Sector,Non-marketableOutput Effectiveness Cost ($) Hold one constant,
optimize the other
Cost effectiveness analysis
Slide 14
• More on foundations of cost effectiveness in “Economics in Cost Analysis” on February 10.

8
Page 8
Slide 15
INSTITUTIONAL REQUIREMENTS
• Cost effectiveness analysis is– Required in the Department of Defense for large
programs (COEA or AOA)– Recommended by OMB for non-defense
programs
Slide 16
FALLACIES AND ISSUES IN COST EFFECTIVENESS
• Objectives• Alternatives• Cost• Effectiveness• Criterion

9
Page 9
Slide 17
• “Determine the system that has the highest effectiveness and the lowest cost”
How can you do both?
• “Determine the least costly system for meeting the requirements”
Requirements don’t exist, exceptinstitutionally --
The more we buy, the higher the effectivenessand the higher the cost
OBJECTIVES
Slide 18
OBJECTIVES(Continued)
• “You can’t analyze all resource questions — some are really intractable”
A polar position!
• “You can’t analyze new technology options (basic research, exploratory development)”
Make the alternatives menus of possibilities, rather than systems
10
Page 10
Slide 19
ALTERNATIVES
• “We should include all alternatives”– We can’t
Scenarios are uncertainData are incompleteModels are imperfect
• One way to cope with these problems– Compare polar cases
• E.g., a sophisticated costly aircraft with a simpler but less costly one
Slide 20
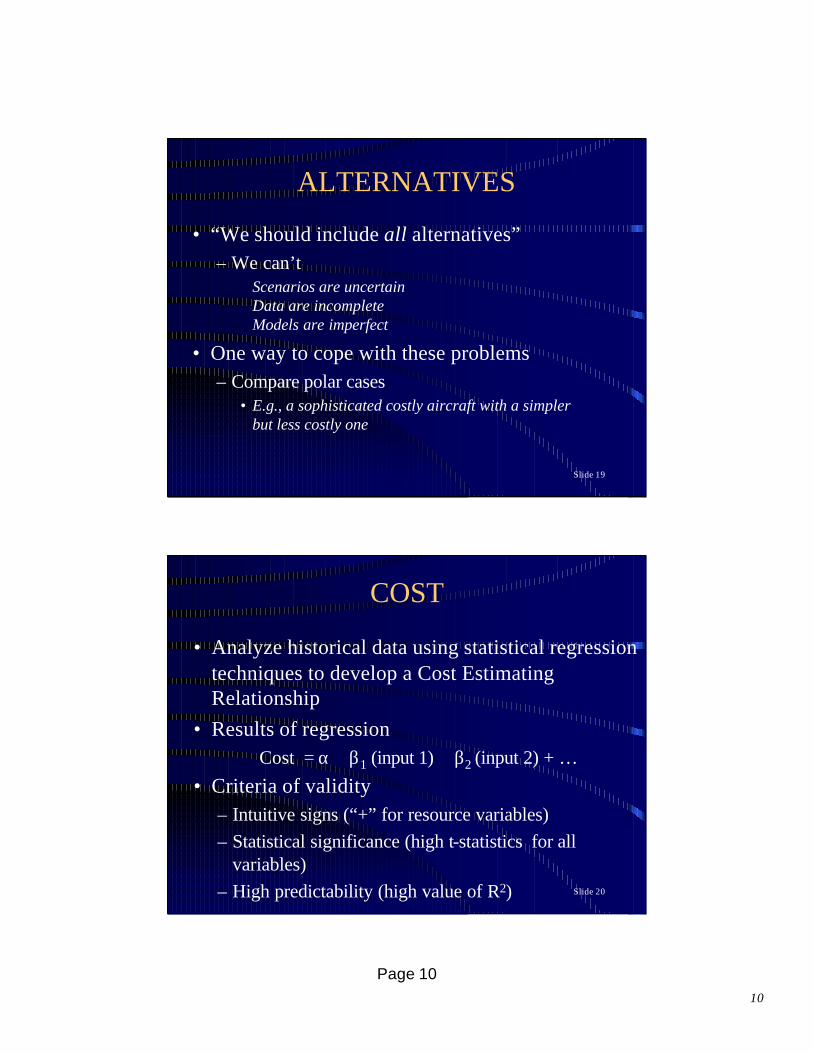
COST
• Analyze historical data using statistical regression techniques to develop a Cost Estimating Relationship
• Results of regressionCost = α + β1 (input 1) + β2 (input 2) + …
• Criteria of validity– Intuitive signs (“+” for resource variables)– Statistical significance (high t-statistics for all
variables)– High predictability (high value of R2)

11
Page 11
Slide 21
TYPES OF COST
• Acquisition (non-recurring)– Development– Procurement
• Land• Facilities• Equipment (depends on number of systems)
– Salvage
• Operations and Support (recurring)– Operations and Maintenance– Personnel
Slide 22
SUMMARY MEASURES
• 10-year system costDevelopment (~ no. of prototypes)
+ Procurement (unit proc. × no. of systems)+ O&S (unit O&S × no. of systems × 10)
– Salvage value (unit salvage × no. of systems)
• Life-cycle cost30 years of O&S
• Time-phased costTotal expenditures over next 10 (or 30) years

12
Page 12
Slide 23
• More specifics on cost models in the remaining lectures.
Slide 24
ACCOUNTING FOR TIME
• A problem: $1 commands different resources in different years
• Why?– Inflation (general increase in prices)– Discount rate *(return on investment)– Sunk costs
• Therefore, we must adjust!
* Same as interest rate

13
Page 13
Slide 25
ADJUSTMENTS
• For inflation– Deflate future costs to constant (current) dollars
• For interest– Translate future costs to present values
• For sunk costs– Forget them!
Slide 26
Calculating Constant Dollarsand Present Values
• Assume 4% inflation and 6% real interest rate–Cost of widget purchased in 2001 =$100–Cost in 2000 dollars = $100/(1.04) = $96.15–Present value in 2000 dollars = $96.15/(1.06) = $90.71
• One step, using a nominal discount rate1 + nominal r = (1 + .06) x (1 + .04)
= 1 + .06 + .04 + (.06)(.04)≅ 1 + .10
Present value in 2000 dollars = $100/(1.10) = $90.91
14
Page 14
Slide 27
WARNING!
• OMB appropriation-specific deflators
include real cost increases, in addition to
inflation
• Therefore:
– Use them for budgeting
– But not for calculating costs in constant dollars
Slide 28
• More on the rationale and use of discounting in “Economics in Cost Analysis” on February 10, “Cost Data” on February 24, and “Life-Cycle Costing” on April 21.

15
Page 15
Slide 29
SUNK COSTS
• Quiz for the student:– Why ignore sunk costs?
• Answer:– They are not costs!
Slide 30
FALLACIES
• “They’re only 14 to 16 months away from coming up with a system. It would be a shame to throw away the investment in the program.”
• “We’re interested in how much money to put in the budget, so we should use the inflated costs for our cost effectiveness studies.”
• “The DoD budget is relatively constant year-to-year, so there are no time tradeoffs, and costs should not be discounted.”

16
Page 16
Slide 31
ACCOUNTING FOR LEARNING IN ESTIMATING PRODUCTION COSTS
People Average cost = First unit cost x Slope log (Quantity)
Example for 90% learning curve (0.90 slope)
Number ofSystems Average Total
Purchased Cost Cost
100 $ 100.0 $ 10,000200 90.0 18,000300 84.6 25,400400 81.0 32,400
||
Slide 32
• More on learning curves in “Cost Progress Curves” on March 9.

17
Page 17
Slide 33
INDIRECT COSTS
• Reduction in reenlistment rates due tofamily separation
• Costs of Army defenses of deployed Air Force bases
• Reduction in mobilization base due to procurement cuts
• Imputed land cost of military bases
• Costs of environmental cleanup
Slide 34
IF YOU CANNOT ESTIMATE ALL COSTS
• Estimate what you can. Something is better than nothing!
Cost of Cadillac $31,000Cost of Honda – $19,000What you are paying $12,000for improved comfort
• The question becomes, “Is the softer ride worth $12,000?”
18
Page 18
Slide 35
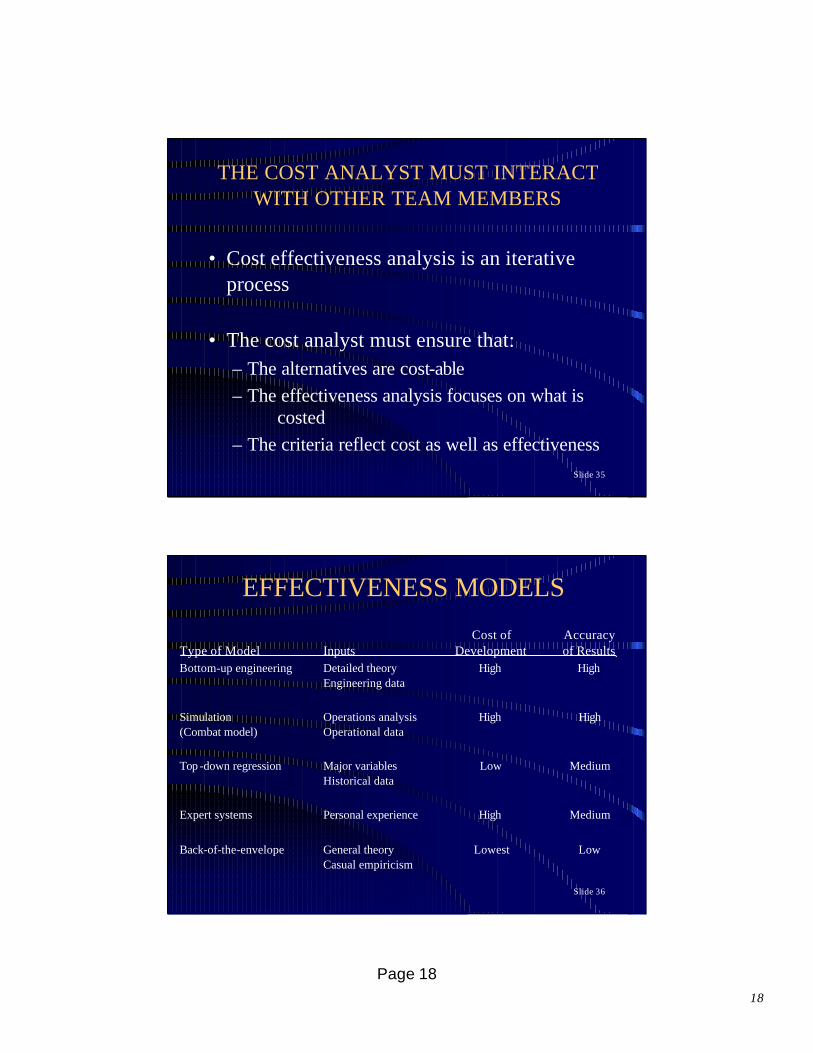
THE COST ANALYST MUST INTERACTWITH OTHER TEAM MEMBERS
• Cost effectiveness analysis is an iterative process
• The cost analyst must ensure that:– The alternatives are cost-able– The effectiveness analysis focuses on what is
costed– The criteria reflect cost as well as effectiveness
Slide 36
EFFECTIVENESS MODELS
Cost of AccuracyType of Model Inputs Development of ResultsBottom-up engineering Detailed theory High High
Engineering data
Simulation Operations analysis High High(Combat model) Operational data
Top -down regression Major variables Low MediumHistorical data
Expert systems Personal experience High Medium
Back-of-the-envelope General theory Lowest LowCasual empiricism
19
Page 19
Slide 37
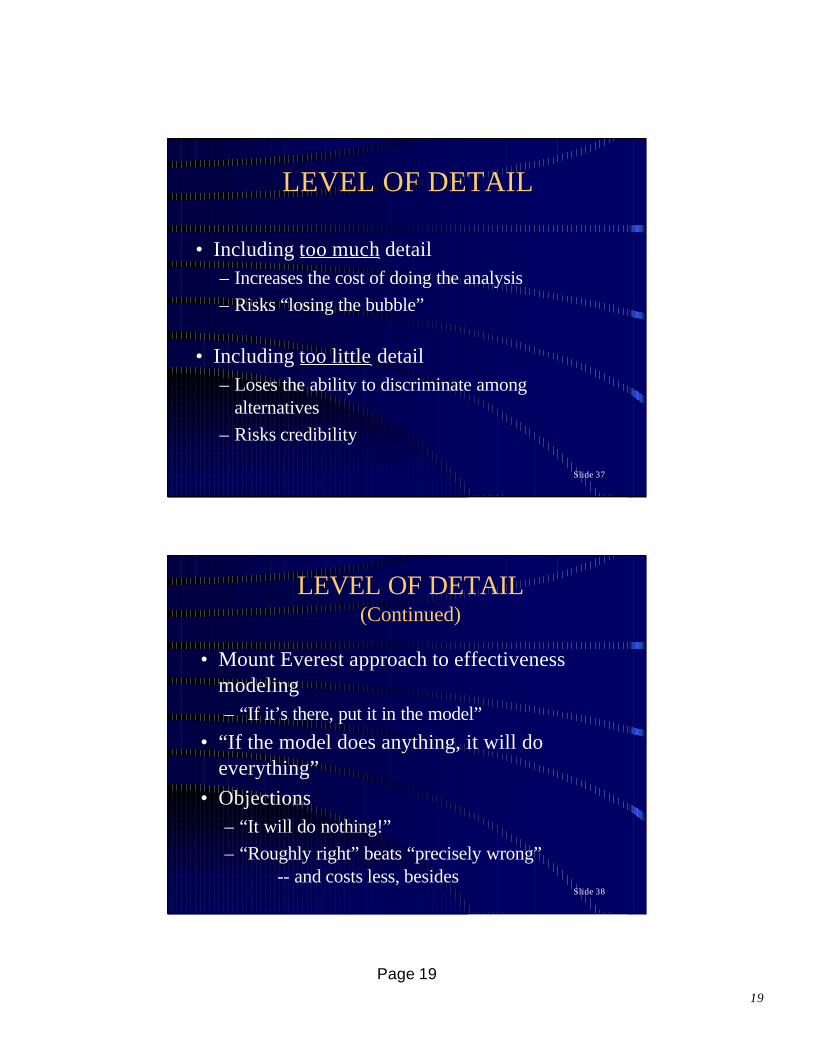
LEVEL OF DETAIL
• Including too much detail– Increases the cost of doing the analysis– Risks “losing the bubble”
• Including too little detail– Loses the ability to discriminate among
alternatives– Risks credibility
Slide 38
• Mount Everest approach to effectiveness modeling– “If it’s there, put it in the model”
• “If the model does anything, it will do everything”
• Objections– “It will do nothing!”– “Roughly right” beats “precisely wrong”
-- and costs less, besides
LEVEL OF DETAIL(Continued)

20
Page 20
Slide 39
SENSIBLE APPROACH TO MODELING
• Start with a back-of-the-envelope analysis
• Refine the model only where needed to discriminate among the alternatives
Slide 40
“THE ANALYSIS ISNOT REALISTIC”
• We’re analyzing alternatives, not making movies!
• All analysis involves abstraction from the real world
• The trick is to capture the effects that discriminate among the alternatives
21
Page 21
Slide 41
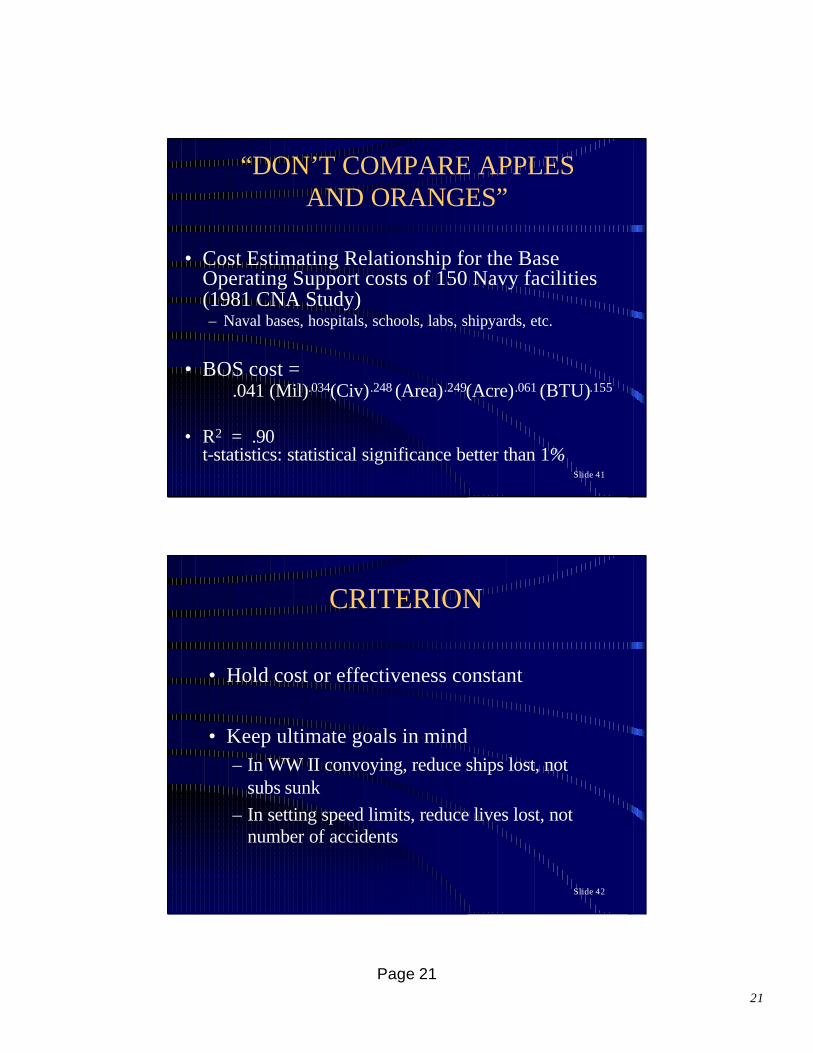
“DON’T COMPARE APPLESAND ORANGES”
• Cost Estimating Relationship for the Base Operating Support costs of 150 Navy facilities (1981 CNA Study)– Naval bases, hospitals, schools, labs, shipyards, etc.
• BOS cost =.041 (Mil).034(Civ).248 (Area).249(Acre).061 (BTU).155
• R2 = .90t-statistics: statistical significance better than 1%
Slide 42
CRITERION
• Hold cost or effectiveness constant
• Keep ultimate goals in mind– In WW II convoying, reduce ships lost, not
subs sunk– In setting speed limits, reduce lives lost, not
number of accidents

22
Page 22
Slide 43
Effectiveness
Cost
A
B C
DUnambiguous choices
A>BB>CA>C
Ambiguous choiceD~B
UNAMBIGUOUS CHOICES
Slide 44
WHICH TO HOLD CONSTANT,COST OR EFFECTIVENESS?
• Theory doesn’t care
• The sponsor may have preferences
• Consider analytical convenience

23
Page 23
Slide 45
HOLD ING SOMETHING CONSTANT MAKES DECISION-MAKING EASIER
Which choice is easier?$18,000 Honda vs $30,000 Cadillac
$18,000 Honda andnew $12,000 kitchen vs $30,000 Cadillac
Slide 46
IF YOU CANNOT HOLD SOMETHING CONSTANT
Effectiveness
Cost
.
.. .
.
..
.
.
..
.
.
.
.
..
.
.. .
..
.
. ..
..
Frontier
.
..
..
.
.
.

24
Page 24
Slide 47
Effectiveness
Cost
B
D′
B´
D
BEWARE OF COSTEFFECTIVENESS RATIOS
Option D’ has a betterC/E ratio than option B
But B > D and B’>D’(B technology dominates
D technology)
Slide 48
0
20
40
60
80
100
0.0 1.0 2.0 3.0 4.0
Cost of Parts ($ Million)
Ship Availability (Percent)
Knee
42%
65%
73%
93%
THE KNEE OF THE CURVE:FORGET THE KNEE, USE THE HEAD!
Spending the last $2M on parts buys
$100M of ship availability
(93% – 73%) x $500M = $100M
Optimum

25
Page 25
Slide 49
WHAT SHOULD YOU GIVETHE SPONSOR?
• Alternatives– What he asks for?– What he really wants?– What you think he should want?
• Strategic Basing Study, Late 1950s– Air Force question: Where in Europe should we station the
strategic bombers?– RAND response: Station them in the U.S. and buy tankers!
Slide 50
HANDLING RISK AND UNCERTAINTY
• Risk (probabilities are known)
– Calculate expected value and variance of cost and effectiveness
• Uncertainty (probabilities are not known)
– Give the decision maker information so he canapply his own intuition
• Show cross-over points
– “Radar A > radar B if target range is over 100 miles”
• Show results for ranges of inputs

26
Page 26
Slide 51
CRITICISMS OF CURRENTC-E PRACTICE
• Does not identify who is helped, who is hurt
• Reduces comparisons to a single dimension, generally dollars and cents
• Conceals uncertainty of estimates
Slide 52
• Helps to structure the problem– Offers a framework for analysis– Makes assumptions explicit– Identifies biases
• Helps advocates understand the strengths and weaknesses of their own positions
• Offers a neutral position for adjudicating disputes (elevating the quality of the debate)
• Incidentally, decision makers are free to reject our advice!!
C-E ANALYSIS CAN COMPLEMENTOTHER WAYS OF MAKING DECISIONS

27
Page 27
Slide 53
SUMMARY
• What is cost effectiveness?• What does it apply to?• What are its strong points?• What are its failings?• Even with its failings, can it help decision
makers?