Cost effective tools for monitoring Soil Organic Carbon (SOC)
26
Cost effective tools for soil organic carbon monitoring Keith Shepherd & Ermias Betemariam 9 April 2013 EGU General Assembly, Vienna
-
Upload
land-health-decisions-sd4-icraf -
Category
Science
-
view
35 -
download
2
Transcript of Cost effective tools for monitoring Soil Organic Carbon (SOC)

Cost effective tools for soil organic carbon monitoring
Keith Shepherd & Ermias Betemariam
9 April 2013
EGU General Assembly, Vienna

Outline• Context - soils as basis for ecosystem
functioning
• Decisions before measurement
• Emerging technologies (Applications in Africa)
• Measurement and uncertainties

Context
3
Soils the largest carbon reservoir of the terrestrial carbon - small change could cause large effects on climate system
Soil comes to the global agenda: Sustainable intensification; Global Environmental Benefits (GEF/UNCCD)
SOC as useful indicator of soil health. Taxonomic soil classification systems provide little information on soil functionality in particular the productivity function (Mueller et al 2010)
But lack of coherent and rigorous sampling and assessment frameworks
High spatial variability in soil properties - large data sets required
Soil monitoring is expensive to maintain
Digital wall-to-wall soil mapping of soil functional properties desired

Decisions before Measurement

• Little evidence for impact of monitoring initiatives on real-world decision making/management
• Information has no value unless it has the potential to change a decision
• The measurement inversion − most measurement effort in business cases is spent on variables that have the least information value
Review of the Evidence on Indicators, Metrics and Monitoring Systems
DFID-commissioned review: Shepherd et al. 2013http://r4d.dfid.gov.uk/output/192446/default.aspx
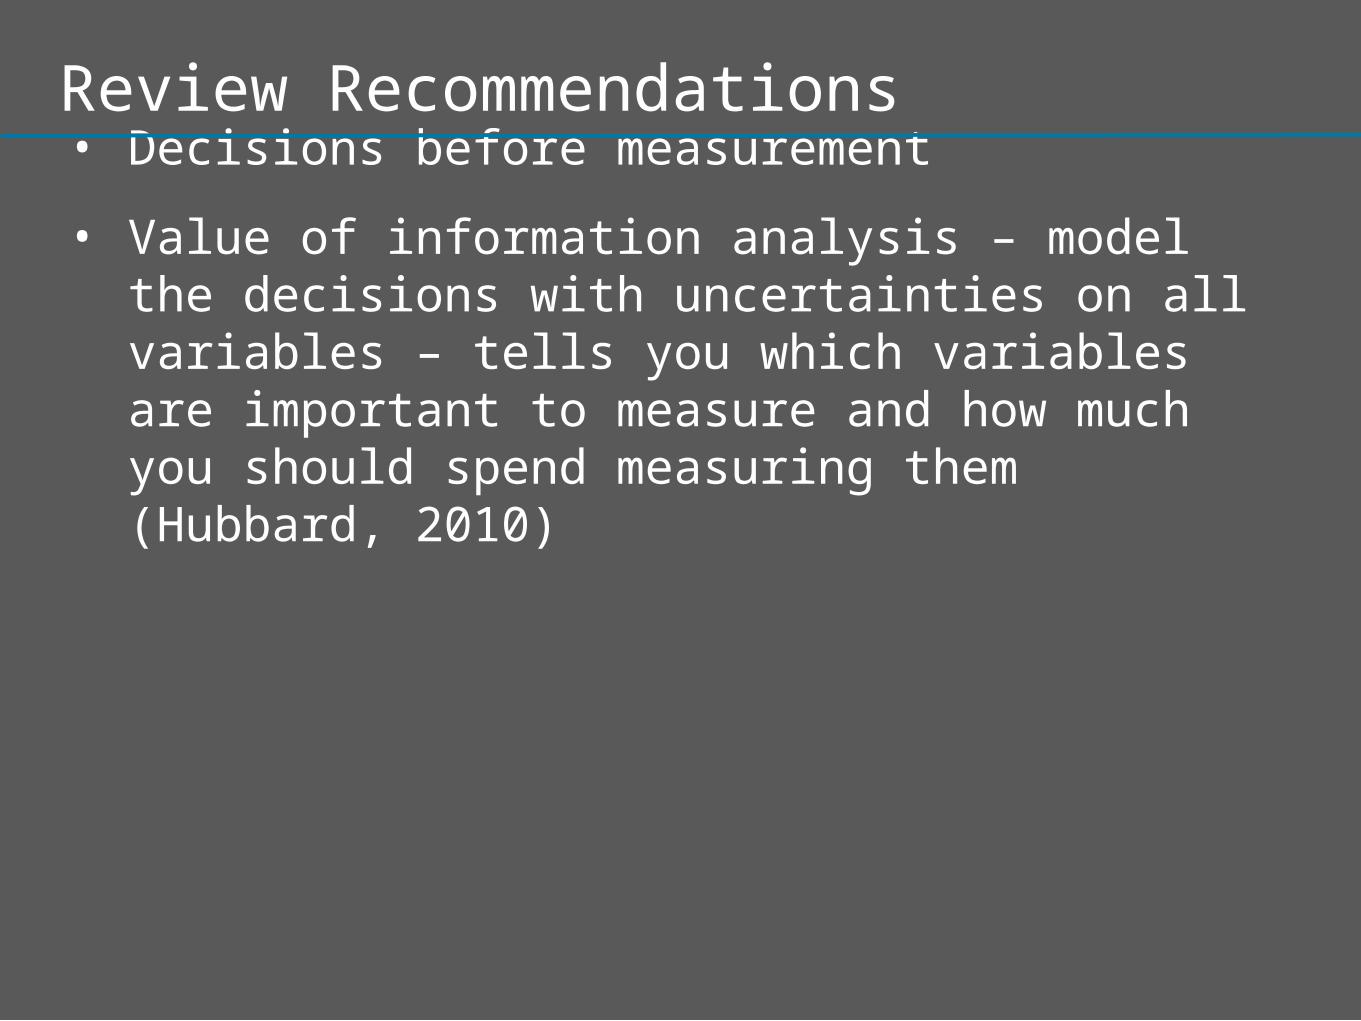
• Decisions before measurement
• Value of information analysis – model the decisions with uncertainties on all variables – tells you which variables are important to measure and how much you should spend measuring them (Hubbard, 2010)
Review Recommendations

• Do we need to ameliorate soil organic carbon? • Do we know what is a good or bad level?• What is the value of accurately monitoring
soil carbon levels if we don’t know how to interpret?
• Is critical limit the high-information-value variable?
Soil carbon decisions – need for specificity
• How much soil carbon credit to pay out?• Soil carbon has increased by x t/ha with 90%
certainty • Which variable has largest uncertainty and
highest risk of being wrong: Bulk density? Sampling error due to spatial variation? Lab measurement?

Emerging technologies
Applications in Africa

SPECTROSCOPY HISTORY
Shepherd KD and Walsh MG. (2002) Development of reflectance spectral libraries for characterization of soil properties. Soil Science Society of America Journal 66:988-998.

Instrumentation Dispersive VNIR FT-NIR FT-MIR
Handheld NIR/MIR
•Portable•Repeatability?•External service
•No validation
•Benchtop•Repeatability ***
•Self serviceable
•Validation in-built
•ISO compliant•Industry proven
•Multipurpose
•Benchtop•Repeatability***
•No gas purging•Some servicing•Robotic•Validation in-built
•ISO compliant•Outperforms NIR
•Handheld•Sample homogeneity?
•Variable moisture?
•Repeatability?•Still expensive•Rapidly developing
•Need to prepare by developing soil reference libraries

Soil mid-infrared Spectroscopy for rapid soil characterization
RapidLow costReproduciblePredicts many soil functional
properties
• Hi resolution monitoring• Decision/policy support

Soil-Plant Spectral Diagnostics Lab
•500 visitors in 2012
•Outreach spectral labs growing & demand support
•Capacity building

Spectral Diagnostics – Capacity Building
•IAMM, Mozambique
•AfSIS, Sotuba, Mali
•AfSIS, Salien, Tanzania
•AfSIS, Chitedze, Malawi
•ICRAF, Nairobi, Kenya
•CNRA, Abidjan, Cote D’Ivoire
•KARI, Nairobi, Kenya
•ICRAF, Yaounde, Cameroon
•Obafemi Awolowo University, Ibadan, Nigeria
•IAR, Zaria, Nigeria
•ICRAF, Nairobi, Kenya
Planned
•Eggerton University, Kenya
•ATA, Ethiopia (6)
•IITA (3)
•Liberia
Personal request for info

AfSIS
✓ 60 primary sentinel sites➡ 9,600 sampling plots➡ 19,200 “standard” soil samples➡ ~ 38,000 soil spectra
EthioSIS 97 Sentinel sites
Applications

Land Health out-scaling projects
Tibetan Plateau/ Mekong
Vital signs
Cocoa - CDIParklands Malawi
National surveillance systems
Regional Information Systems
Project baselines
Ethiopia
Rangelands E/W AfricaSLM Cameroon MICCA EAfrica
Global-Continental Monitoring Systems
Evergreen Ag / Horn of Africa
CRP5 pan-tropical basins
AfSIS

Living Standards Measurement StudyIntegrated Surveys on Agriculture (LSMS-IMS)
Improve measurements of agricultural productivity through methodological validation and research
Responding to policy needs to provide data to understand the determinants of social sector outcomes.
Soil fertility monitoring componentTwo pilot countries

Predicting SOC stocks using soil infrared spectroscopy
17
A case study from Western Kenya

Uncertainties in SOC stock monitoring

•Measuring soil carbon stock changes for carbon trading purposes requires high levels of measurement precision
•But there is still large uncertainty on whether the costs of measurement exceed the benefits
•Sample size
•Bulk density and measuring based on equal-depth
Measurement uncertainties
High spatial variability of SOC can rise sevenfold when scaling up from point sample to landscape scales (Hobley and Willgoose, 2010)
• High uncertainties in calculations of SOC stocks. • This hinders the ability to accurately measure changes in
stocks at scales relevant to emissions trading schemes

20
• Tillage increases the thickness per unit area• A management that leads to a DECREASE in bulk density will
UNDER ESTIMATES SOC stocks & vice versa (Ellert and Bettany, 1995)C conc.(%)
Depth(cm)
Bulk density(g/cm)
SOC stock (Mg/ha) Error
1.5 150 1.2 270 1.5 150 1 225 -16.67%
Monitoring SOC stock change
Bulk density as confounding variable in comparing SOC stocks
Think mass not depth

21
Comparing SOC stocks between treatments or monitoring over time on equivalent soil mass basis
No need to dig pits for deep bulk density
Monitoring SOC change
What is the minimum detectable change? What time interval for monitoring?
Determining auger-hole volume using sand filling method
Cumulative soil mass sampling plate: to recover soil samples for measuring soil mass
Cumulative soil mass sampling

10 50 100 150 200 2500
2000
4000
6000NIR spectroscopyThermal oxidationSample preparationSoil sampling
Number of samples
Ca
rbo
n m
ea
surm
en
t co
st (
US
D)
Personnel
Oth
ers0
3
6
9
12
15NIR spectroscopyThermal oxidationSample preparationSoil sampling
Ca
rbo
n m
ea
sure
me
nt c
ost
pe
r sa
mp
le (
US
D)
Cost –error analysis
-100 100 300 500 700 900 1100130015000
2000
4000
6000
8000 Thermal oxidationNIR spectroscopy
Number of samples
Carb
on m
easu
rem
ent c
ost (
USD
)Comparisons of costs of measuring SOC using a commercial lab and NIR
CostIR is cheaper (<~ 56%) than combustion method for large number of samplesThroughputCombustion ~ 30-60 samples/dayNIR ~ 350 samples/dayMIR ~ 1000/day

Cost –error analysis
0 200 400 600 800 10000.00
2.00
4.00
6.00
8.00
10.00
Number of samples
Hal
f 95%
con
fiden
ce in
terv
al (t
C h
a-1)
0 5000 10000 15000 200000.00
2.00
4.00
6.00
8.00
10.00
Cost of carbon measurement (USD)
Hal
f 95%
con
fiden
ce in
terv
al (t
C h
a-1)

Final remarks• Need to be clear on the decisions that we are trying to make before designing measurements
• Uncertainty analysis and decision modelling can guide where to focus measurement effort and how much to spend on measurements (new CGIAR research area)
• Soil spectroscopy methods provide low cost alternative for rapid and reproducible measurement of soil carbon and other functional properties.
• Need for large investments in establishing soil spectral libraries.
• Supplementary spectral measurements may aid interpretation (x-ray, laser)

References• Hobley E & Willgoose G. 2010. Measuring soil organic carbon stocks – issues and considerations. Symposium 1.5.1. Quantitative monitoring of soil change. 62-65. 19th WCSS, Brisbane, Australia, Published on DVD
• Hubbard D. 2010. How to Measure Anything: Finding the Value of Intangibles in Business, 2nd ed., John Wiley & Sons
• Shepherd KD & Walsh MG. 2002. Development of reflectance spectral libraries for characterization of soil properties. Soil Science Society of America Journal 66:988-998
• Shepherd KD, Farrow A, Ringler C, Gassner A, Jarvis A. 2013. Review of the Evidence on Indicators, Metrics and Monitoring Systems. Commissioned by the UK Department for International Development (DFID). Nairobi: World Agroforestry Centre http://r4d.dfid.gov.uk/output/192446/default.aspx