Cost Concept
41
CHAPTER 2 CHAPTER 2 Cost Concepts and Cost Concepts and Application Application
-
Upload
anif-zaidi -
Category
Business
-
view
16 -
download
0
Transcript of Cost Concept

CHAPTER 2CHAPTER 2
Cost Concepts and Application Cost Concepts and Application
COSTCOST
Cost is a resource sacrificed or forgone to Cost is a resource sacrificed or forgone to achieve a specific objective. It is usually achieve a specific objective. It is usually measured as the monetary amount (or measured as the monetary amount (or money) that must be paid to acquire goods money) that must be paid to acquire goods and services. and services.

Cost TerminologyCost Terminology
Others cost terminologyOthers cost terminology Opportunity costOpportunity cost Social costSocial cost Direct costsDirect costs Indirect cost Indirect cost Sunk costSunk cost Explicit cost Explicit cost Implicit costImplicit cost Recurring/Non-recurring costRecurring/Non-recurring cost
Cost Terminology base on behaviour
Fixed cost Variable costs

Cost TerminologyCost Terminology
An An opportunity costopportunity cost is the cost of the best is the cost of the best rejected ( i.e., foregone ) opportunity and rejected ( i.e., foregone ) opportunity and is hidden or implied. (Used in is hidden or implied. (Used in Replacement Analysis)Replacement Analysis) a student who could earn $20,000 for working a student who could earn $20,000 for working
during a year, but chooses instead to go to during a year, but chooses instead to go to school for a year and spend $5,000 to do so. school for a year and spend $5,000 to do so. The opportunity cost of going to school for The opportunity cost of going to school for that year is $25,000: $5,000 cash outlay and that year is $25,000: $5,000 cash outlay and $20,000 for income$20,000 for income

Cost TerminologyCost Terminology
Social cost – A cost due to negative Social cost – A cost due to negative impact from the economy activities. (B/C impact from the economy activities. (B/C ratio analysis) Example : pollution, traffic-ratio analysis) Example : pollution, traffic-jam, inflation. jam, inflation. Environmental pollution, traffic jam or price Environmental pollution, traffic jam or price
increase on certain products.increase on certain products. Government will imposed tax to the Government will imposed tax to the
responsible party.responsible party.

Cost TerminologyCost Terminology
Direct costsDirect costs can be reasonably measured and can be reasonably measured and allocated to a specific output or work activity -- allocated to a specific output or work activity -- labor and material directly allocated with a labor and material directly allocated with a product, service or construction activity;product, service or construction activity;
Indirect costsIndirect costs are difficult to allocate to a specific are difficult to allocate to a specific output or activity -- costs of common tools, output or activity -- costs of common tools, general supplies, and equipment maintenance ;general supplies, and equipment maintenance ;
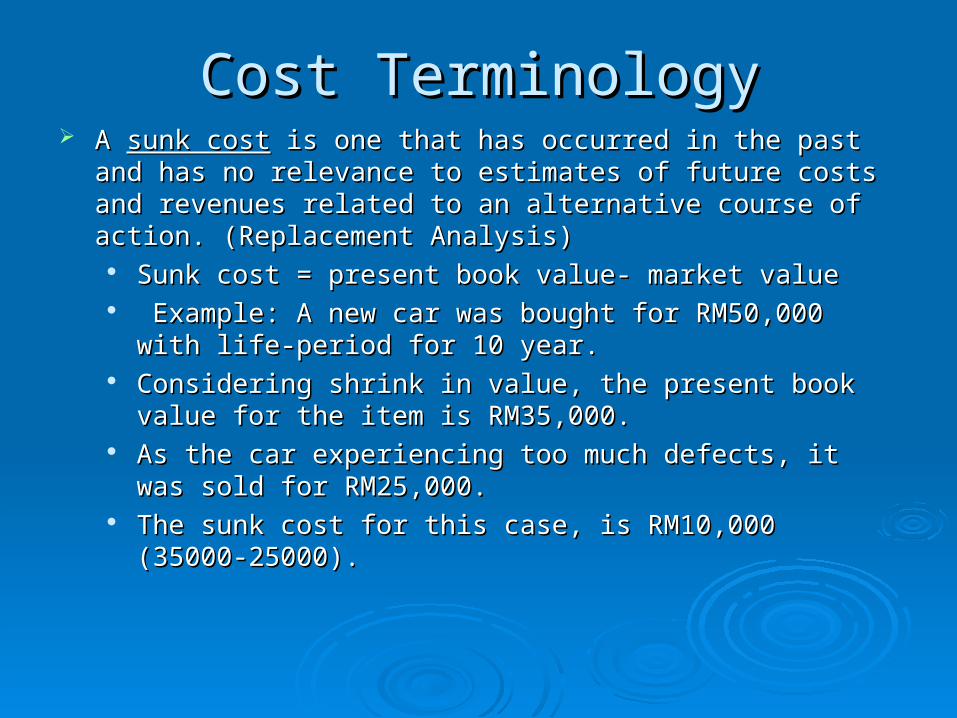
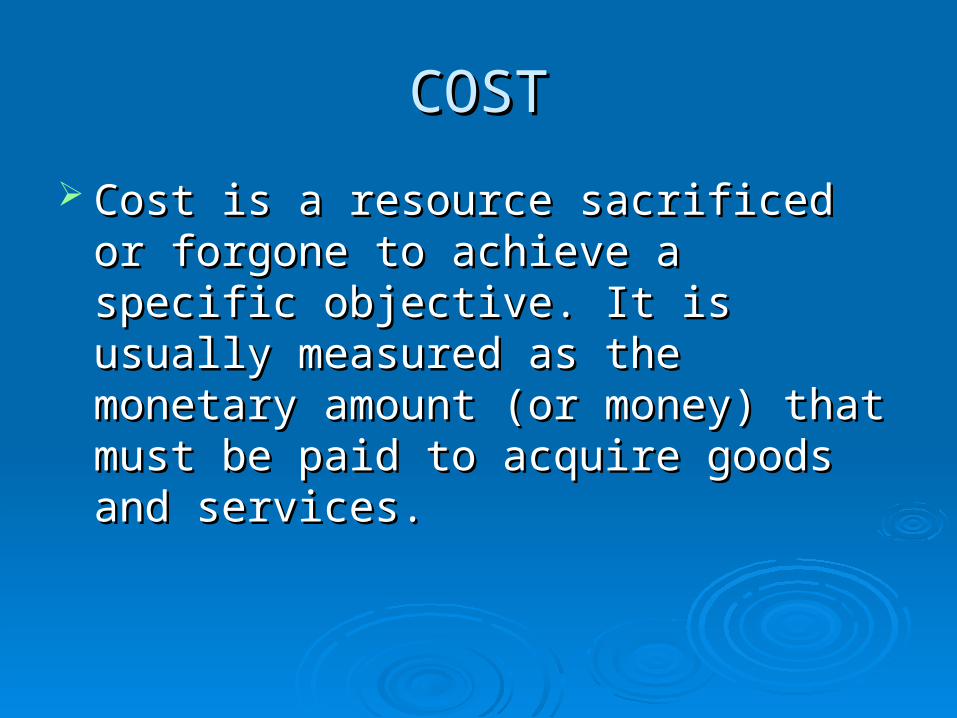
Cost TerminologyCost Terminology A A sunk costsunk cost is one that has occurred in the past and has no is one that has occurred in the past and has no
relevance to estimates of future costs and revenues related relevance to estimates of future costs and revenues related to an alternative course of action. (Replacement Analysis)to an alternative course of action. (Replacement Analysis)
Sunk cost = present book value- market valueSunk cost = present book value- market value Example: A new car was bought for RM50,000 with life-Example: A new car was bought for RM50,000 with life-
period for 10 year.period for 10 year. Considering shrink in value, the present book value for Considering shrink in value, the present book value for
the item is RM35,000.the item is RM35,000. As the car experiencing too much defects, it was sold for As the car experiencing too much defects, it was sold for
RM25,000. RM25,000. The sunk cost for this case, is RM10,000 (35000-25000).The sunk cost for this case, is RM10,000 (35000-25000).

Cost TerminologyCost Terminology
An An Explicit costExplicit cost is an easy accounted cost, such as is an easy accounted cost, such as wage, rent and materials. It can be transacted in the wage, rent and materials. It can be transacted in the form of money payment and is lost directlyform of money payment and is lost directly
An An implicit costimplicit cost occurs when one foregoes an alternative occurs when one foregoes an alternative action but does not make an actual payment . Example- action but does not make an actual payment . Example- Sundry shop’s owner who open & manage his business Sundry shop’s owner who open & manage his business using his own property and wealth. Implicit cost include:using his own property and wealth. Implicit cost include:
Importing workers from other place and paid their salaries.Importing workers from other place and paid their salaries. Interest to be received by him if invest at another place.Interest to be received by him if invest at another place. Potential gain from the shop if he choose to rent his shop.Potential gain from the shop if he choose to rent his shop.

Cost TerminologyCost Terminology Life-Cycle CostLife-Cycle Cost
In engineering practice, the term life-cycle cost is often In engineering practice, the term life-cycle cost is often encountered. This term refers to a summation of all the costs encountered. This term refers to a summation of all the costs related to a product, structure, system, or service during its life related to a product, structure, system, or service during its life spanspan


Cost Concept & Cost CurveCost Concept & Cost Curve
Fixed costs are those unaffected by changes in activity level over a feasible range of operations for the capacity or capability available.
Typical fixed costs include insurance and taxes on facilities, general management and administrative salaries, license fees, and interest costs on borrowed capital.
When large changes in usage of resources occur, or when plant expansion or shutdown is involved fixed costs will be affected.

Cost Classification & Cost CurveCost Classification & Cost Curve
Variable costs are those associated with an operation that vary in total with the quantity of output or other measures of activity level.
Example of variable costs include : costs of material and labor used in a product or service, because they vary in total with the number of output units -- even though costs per unit remain the same.

Cost Classification & Cost CurveCost Classification & Cost Curve
Total Cost (TC) = FC + VCTotal Cost (TC) = FC + VC
TC
VC
FC500
Quantity,Q
Cost (RM)

Linear Cost EquationLinear Cost Equation
TC = FC + VC TC = FC + VC Where; Where; TC = Total cost (RM)TC = Total cost (RM) FC = Fixed Cost (RM)FC = Fixed Cost (RM) VC = Variable Cost (RM)VC = Variable Cost (RM)
= aQ = aQ
a = average variable cost per unit (RM/unit)a = average variable cost per unit (RM/unit)
Q = Quantity (unit)Q = Quantity (unit)

Ex 3.1Ex 3.1 : : To process one kg. of coffee require average cost per unit of RM5, To process one kg. of coffee require average cost per unit of RM5,
and FC of RM300 per day.and FC of RM300 per day. (a) Produce a linear equation for production of coffee(a) Produce a linear equation for production of coffee (b) Calculate production cost of coffee to process 1000 kg per day. (b) Calculate production cost of coffee to process 1000 kg per day.
Solution:Solution:
(a) Given: F=RM300/day; VC =RM5/kilo. If production is Q kilo per day, (a) Given: F=RM300/day; VC =RM5/kilo. If production is Q kilo per day, then total VC=5Q.then total VC=5Q.
TC = FC + a(Q) = 300 + 5Q TC = FC + a(Q) = 300 + 5Q
(b) To produce 1000 kg of coffee per day(b) To produce 1000 kg of coffee per day TC = 300 +5(1000) = RM5,300TC = 300 +5(1000) = RM5,300

Ex 3.2Ex 3.2 : :
Production cost for 10 shirt is RM350 and RM600 to Production cost for 10 shirt is RM350 and RM600 to produce 20 shirts. Show the linear equation for the produce 20 shirts. Show the linear equation for the shirt production.shirt production.
Solution:Solution: Formula: TC = FC + aQFormula: TC = FC + aQ Given: TC1 = 350, Q1 =10; TC2=600, Q2=20Given: TC1 = 350, Q1 =10; TC2=600, Q2=20
350 = F + a(10) ………….. (i)350 = F + a(10) ………….. (i) 600 = F + a(20) ……………(ii), then600 = F + a(20) ……………(ii), then
250 = a(10) >>>> 250 = a(10) >>>> a=25a=25 350 = F + 25(10) >>>> 350 = F + 25(10) >>>> FC=100FC=100 ; then ; then TC = 100 + 25QTC = 100 + 25Q

Profit and Breakeven PointProfit and Breakeven Point
Profit Profit = Total Revenue – Total Cost= Total Revenue – Total Cost
= TR – TC= TR – TC
= (P x Q) – (FC + VC)= (P x Q) – (FC + VC) Breakeven Point is the point at which Breakeven Point is the point at which
gains equal losses. At this pointgains equal losses. At this point
TR = TCTR = TC

Profit and Breakeven PointProfit and Breakeven Point
TC
VC
FC500
Quantity, Q
Cost (RM)TR
BP
Profit
Loss

Contoh 3.3Contoh 3.3 : :Daripada Contoh 3.1, Daripada Contoh 3.1, Persamaam linear Jumlah kos, TC = 300 + 5QPersamaam linear Jumlah kos, TC = 300 + 5QKatakan kopi dijual RM10 per Kg.Katakan kopi dijual RM10 per Kg.a)a) Hitungkan titik pulang modal.Hitungkan titik pulang modal.b)b) Keuntungan jika syarikat mengeluarkan / menjual kopiKeuntungan jika syarikat mengeluarkan / menjual kopi
(i) 100 Kg sehari (ii) 50 Kg sehari(i) 100 Kg sehari (ii) 50 Kg sehari
Penyelesaian:Penyelesaian:a)a) Diperolehi TC = 300 + 5QDiperolehi TC = 300 + 5Q Pada titik pulang modal, Jumlah Hasil(TR) = Jumlah Pada titik pulang modal, Jumlah Hasil(TR) = Jumlah
Kos(TC),Kos(TC), TR = Harga (P) x Kuantiti (Q) = 10QTR = Harga (P) x Kuantiti (Q) = 10Q 10Q = 300 + 5Q10Q = 300 + 5Q Q = 60 Q = 60 (Pada titik pulang modal, kuantiti keluaran ialah 60 kg (Pada titik pulang modal, kuantiti keluaran ialah 60 kg
sehari)sehari)
b) Keuntungan = TR – TCb) Keuntungan = TR – TC (i) = 10(100) – (300 + 5(100)) = RM200 (untung)(i) = 10(100) – (300 + 5(100)) = RM200 (untung) (ii) = 10(50) – (300 + 5(50)) = RM-50 (rugi)(ii) = 10(50) – (300 + 5(50)) = RM-50 (rugi)

Contoh 3.3Contoh 3.3 : :
In relation to Ex.1, if coffee is sold for RM10 per kilo,(a) calculate the breakeven point(b) compute TR if the firm produce and sell (i) 100 kilo/day & (ii) 50 kilo/day.
Solution:(a) Referring to Ex.1, TC = 300 +5Q
From above, TR=10 Q Therefore,10 Q = 300 + 5Q Q = 60 units
(b) Profit = TR – TC,
Substitute Q=100 & Q=50 to compute(i) Profit= 10(100) – 300- 5(100) = 200 >>> Profit = RM200(ii) Profit = 10(50) – 300 – 5(50) = -50 >>> Loss = RM50

When the problems of location identification occurs?When the problems of location identification occurs?
Starting the new Business Business Enlargement Centralization Economics
The factors effecting the location identification?The factors effecting the location identification? Closed to market & raw material suppliers Ease of getting labor Geographical factor Social acceptability Ease of getting other utilities Procedures & laws
Closed to market & raw material suppliers Ease of getting labor Geographical factor Social acceptability Ease of getting other utilities Procedures & laws
Break even analysis in selecting facility Break even analysis in selecting facility locationlocation

What is facility ?What is facility ?
Production: any discrete parts or process industry facilities Production: any discrete parts or process industry facilities Health care: hospitals, clinics, rehab. centers, nursing homeHealth care: hospitals, clinics, rehab. centers, nursing home Education: schools, colleges, day care centers, libraries Education: schools, colleges, day care centers, libraries Food: restaurants, fast-food places, banquet hallsFood: restaurants, fast-food places, banquet halls Commercial/Residential: shopping malls, office buildings, Commercial/Residential: shopping malls, office buildings,
banks, houses, hotels, motels banks, houses, hotels, motels Government/Public Services: court house, IRS, INS, post officeGovernment/Public Services: court house, IRS, INS, post office Transportation: airports, train stations, bus terminals Transportation: airports, train stations, bus terminals Public assembly: stadium, auditoriums, theatersPublic assembly: stadium, auditoriums, theaters Religious: temples, chapels, churchesReligious: temples, chapels, churches

Location Cost-Profit-Volume AnalysisLocation Cost-Profit-Volume Analysis(Break Even Analysis)(Break Even Analysis)
For cost analysis, the total cost are:For cost analysis, the total cost are:
Total Cost = FC + VC(Q)FC = Fixed Cost
VC = Variable Cost per unit
Q = Quantity/volume of output

AssumptionAssumption1. Only one product is involved (main product)1. Only one product is involved (main product)
2. Variable cost/unit is constant regardless of production qty. 2. Variable cost/unit is constant regardless of production qty.
3. Fixed cost remains unchanged when output quantity changed3. Fixed cost remains unchanged when output quantity changed
4. Sale price is fixed regardless of sale quantity4. Sale price is fixed regardless of sale quantity

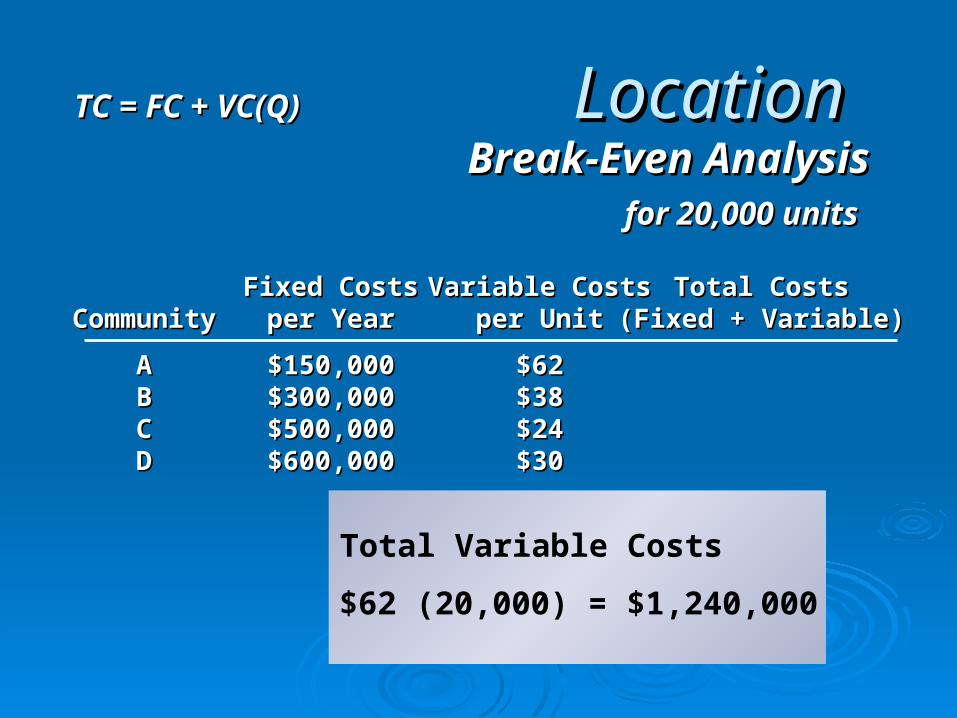
LocationLocationBreak-Even AnalysisBreak-Even Analysis
Fixed CostsFixed Costs Variable CostsVariable Costs Total CostsTotal CostsCommunityCommunity per Yearper Year per Unitper Unit (Fixed + Variable)(Fixed + Variable)
AA $150,000$150,000 $62$62BB $300,000$300,000 $38$38CC $500,000$500,000 $24$24DD $600,000$600,000 $30$30
TC = FC + VC(Q)TC = FC + VC(Q)

LocationLocationBreak-Even AnalysisBreak-Even Analysis
Fixed CostsFixed Costs Variable CostsVariable Costs Total CostsTotal CostsCommunityCommunity per Yearper Year per Unitper Unit (Fixed + Variable)(Fixed + Variable)
AA $150,000$150,000 $62$62BB $300,000$300,000 $38$38CC $500,000$500,000 $24$24DD $600,000$600,000 $30$30
for 20,000 unitsfor 20,000 units
Total Variable Costs
$62 (20,000)
TC = FC + VC(Q)TC = FC + VC(Q)
LocationLocationBreak-Even AnalysisBreak-Even Analysis
Fixed CostsFixed Costs Variable CostsVariable Costs Total CostsTotal CostsCommunityCommunity per Yearper Year per Unitper Unit (Fixed + Variable)(Fixed + Variable)
AA $150,000$150,000 $62$62BB $300,000$300,000 $38$38CC $500,000$500,000 $24$24DD $600,000$600,000 $30$30
for 20,000 unitsfor 20,000 units
Total Variable Costs
$62 (20,000) = $1,240,000
TC = FC + VC(Q)TC = FC + VC(Q)

LocationLocationBreak-Even AnalysisBreak-Even Analysis
Fixed CostsFixed Costs Variable CostsVariable Costs Total CostsTotal CostsCommunityCommunity per Yearper Year per Unitper Unit (Fixed + Variable)(Fixed + Variable)
AA $150,000$150,000 $62$62 $1,390,000 (P2)$1,390,000 (P2)BB $300,000$300,000 $38$38CC $500,000$500,000 $24$24DD $600,000$600,000 $30$30
for 20,000 unitsfor 20,000 units
Total Variable Costs
$62 (20,000) = $1,240,000
TC = FC + VC(Q)TC = FC + VC(Q)

LocationLocationBreak-Even AnalysisBreak-Even Analysis
Fixed CostsFixed Costs Variable CostsVariable Costs Total CostsTotal CostsCommunityCommunity per Yearper Year per Unitper Unit (Fixed + Variable)(Fixed + Variable)
AA $150,000 (P1)$150,000 (P1) $62$62 $1,390,000 (P2)$1,390,000 (P2)BB $300,000$300,000 $38$38 $1,060,000$1,060,000CC $500,000$500,000 $24$24 $ 980,000$ 980,000DD $600,000$600,000 $30$30 $1,200,000$1,200,000
for 20,000 unitsfor 20,000 units
TC = FC + VC(Q)TC = FC + VC(Q)

QQ (thousands of units) (thousands of units)
00
200200
400400
600600
800800
10001000
12001200
14001400
16001600
22 44 66 88 1010 1212 1414 1616 1818 2020 2222
An
nu
al c
ost
(th
ou
san
ds
of
do
llars
)A
nn
ual
co
st (
tho
usa
nd
s o
f d
olla
rs)
Fixed Costs Total CostsCommunity per Year (Fixed + Variable)
A $150,000 $1,390,000B $300,000 $1,060,000C $500,000 $ 980,000D $600,000 $1,200,000

QQ (thousands of units) (thousands of units)
00
200200
400400
600600
800800
10001000
12001200
14001400
16001600
22 44 66 88 1010 1212 1414 1616 1818 2020 2222
AA
DDBBCC
(20, 1390)(20, 1390)
(20, 1200)(20, 1200)
(20, 1060)(20, 1060)
(20, 980)(20, 980)
An
nu
al c
ost
(th
ou
san
ds
of
do
llars
)A
nn
ual
co
st (
tho
usa
nd
s o
f d
olla
rs)
Fixed Costs Total CostsCommunity per Year (Fixed + Variable)
A $150,000 $1,390,000B $300,000 $1,060,000C $500,000 $ 980,000D $600,000 $1,200,000

AA
DDBBCC
(20, 1390)(20, 1390)
(20, 1200)(20, 1200)
(20, 1060)(20, 1060)
(20, 980)(20, 980)
A bestA best
Break-even Break-even pointpoint
QQ (thousands of units) (thousands of units)
00
200200
400400
600600
800800
10001000
12001200
14001400
16001600
22 44 66 88 1010 1212 1414 1616 1818 2020 2222
An
nu
al c
ost
(th
ou
san
ds
of
do
llars
)A
nn
ual
co
st (
tho
usa
nd
s o
f d
olla
rs)
Fixed Costs Total CostsCommunity per Year (Fixed + Variable)
A $150,000 $1,390,000B $300,000 $1,060,000C $500,000 $ 980,000D $600,000 $1,200,000

B bestB best
Break-even pointBreak-even point
AA
DDBBCC
(20, 1390)(20, 1390)
(20, 1200)(20, 1200)
(20, 1060)(20, 1060)
(20, 980)(20, 980)
A bestA best
6.256.25
Break-even point
QQ (thousands of units) (thousands of units)
00
200200
400400
600600
800800
10001000
12001200
14001400
16001600
22 44 66 88 1010 1212 1414 1616 1818 2020 222214.314.3
An
nu
al c
ost
(th
ou
san
ds
of
do
llars
)A
nn
ual
co
st (
tho
usa
nd
s o
f d
olla
rs)
Fixed Costs Total CostsCommunity per Year (Fixed + Variable)
A $150,000 $1,390,000B $300,000 $1,060,000C $500,000 $ 980,000D $600,000 $1,200,000

C bestC best
(20, 980)(20, 980)
B bestB best
Break-even point
AA
DDBBCC
(20, 1390)(20, 1390)
(20, 1200)(20, 1200)
(20, 1060)(20, 1060)
A bestA best
6.256.25
Break-even point
QQ (thousands of units) (thousands of units)
00
200200
400400
600600
800800
10001000
12001200
14001400
16001600
22 44 66 88 1010 1212 1414 1616 1818 2020 222214.314.3
An
nu
al c
ost
(th
ou
san
ds
of
do
llars
)A
nn
ual
co
st (
tho
usa
nd
s o
f d
olla
rs)
Fixed Costs Total CostsCommunity per Year (Fixed + Variable)
A $150,000 $1,390,000B $300,000 $1,060,000C $500,000 $ 980,000D $600,000 $1,200,000

LocationLocationBreak-Even AnalysisBreak-Even Analysis
QQ (thousands of units) (thousands of units)
00
200200
400400
600600
800800
10001000
12001200
14001400
16001600
22 44 66 88 1010 1212 1414 1616 1818 2020 2222
A bestA best B bestB best C bestC best
Break-even point
6.256.25 14.314.3
AA
DDBBCC
(20, 1390)(20, 1390)
(20, 1200)(20, 1200)
(20, 1060)(20, 1060)
(20, 980)(20, 980)
Break-even point
An
nu
al c
ost
(th
ou
san
ds
of
do
llars
)A
nn
ual
co
st (
tho
usa
nd
s o
f d
olla
rs)

QQ (thousands of units) (thousands of units)
00
200200
400400
600600
800800
10001000
12001200
14001400
16001600
22 44 66 88 1010 1212 1414 1616 1818 2020 2222
A bestA best B bestB best C bestC best
Break-even pointBreak-even point
6.256.25 14.314.3
AA
DDBBCC
(20, 1390)(20, 1390)
(20, 1200)(20, 1200)
(20, 1060)(20, 1060)
(20, 980)(20, 980)
Break-even Break-even pointpoint
An
nu
al c
ost
(th
ou
san
ds
of
do
llars
)A
nn
ual
co
st (
tho
usa
nd
s o
f d
olla
rs)LocationLocation
Break-Even AnalysisBreak-Even Analysis
(A) (B)
$150,000 + $62Q = $300,000 + $38QQ = 6,250 units
$300,000 + $38Q = $500,000 + $24QQ = 14,286 units
(B) (C)
Break-Even Quantities

Present Economy StudyPresent Economy Study
When alternatives for accomplishing a specific task are being compared over one year or less and the influence of time on money can be ignored, engineering economic analyses are referred to as present economy studies
RULE 1: When revenues and other economic benefits are present and vary among alternatives, choose the alternative that maximizes overall profitability based on the number of defect-free units of a product or service produced.RULE 2: When revenues and other economic benefits are not present or are constant among all alternatives, consider only the costs and select the alternative that minimizes total cost per defect-free unit of product or service output.
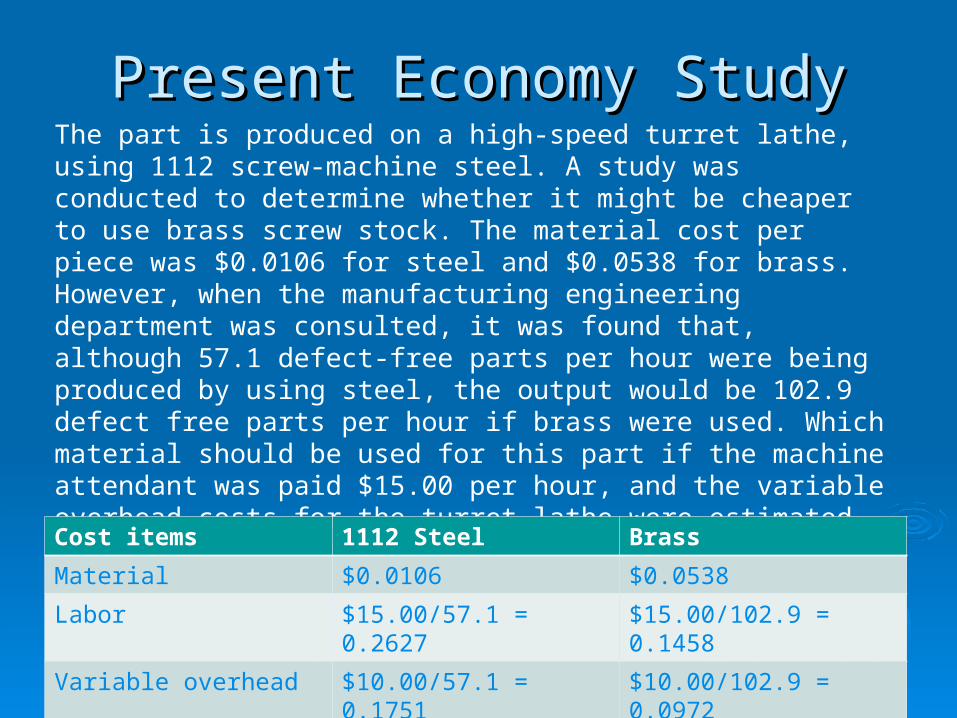
Present Economy StudyPresent Economy StudyThe part is produced on a high-speed turret lathe, using 1112 screw-machine steel. A study was conducted to determine whether it might be cheaper to use brass screw stock. The material cost per piece was $0.0106 for steel and $0.0538 for brass. However, when the manufacturing engineering department was consulted, it was found that, although 57.1 defect-free parts per hour were being produced by using steel, the output would be 102.9 defect free parts per hour if brass were used. Which material should be used for this part if the machine attendant was paid $15.00 per hour, and the variable overhead costs for the turret lathe were estimated to be $10.00 per hour. Solution Solution
Cost items 1112 Steel Brass
Material $0.0106 $0.0538
Labor $15.00/57.1 = 0.2627 $15.00/102.9 = 0.1458
Variable overhead $10.00/57.1 = 0.1751 $10.00/102.9 = 0.0972
Total cost per piece $0.4484 $0.2968

Present Economy StudyPresent Economy StudyTwo currently owned machines are being considered for the production of a part. The capital investment associated with the machines is about the same and can be ignored. The important differences between the machines are their production capacities are depicted in the following table:
If the material cost is $6.00 per part, and all defect-free parts produced can be sold for $12 each. (Rejected parts have negligible scrap value.) For either machine, the operator cost is $15.00 per hour and the variable overhead rate for traceable costs is $5.00 per hour. (a)Assume that the daily demand for this part is large enough that all defect-free parts can be sold. Which machine should be selected? (b)(b) What would the percent of parts rejected have to be for Machine B to be as profitable as Machine A?
Cost items Machine A Machine B
Production rate 100 parts/hour 130 parts/hour
Hours available for production 7 hours/day 6 hours/day
Percent parts rejected 3% 10%

Present Economy StudyPresent Economy StudyProfit per day = Revenue per day − Cost per day
= (Production rate)(Production hours)($12/part) × [1 − (%rejected/100)] − (Production rate)(Production hours)($6/part) − (Production hours)($15/hour + $5/hour).
Machine A: Profit per day = (100 parts/hour)(7 hours/day )( $12/part)(1 − 0.03) − (100 parts/hour)(7 hours/day)( $6/part) (7 hours day)($15/hour + $5/hour) = $3,808 per day.
Machine B: Profit per day = (130 parts/hour)(6 hours/day)($12/part)(1 − 0.10) − (130 parts/hour )(6 hours/day)($6/part) (6 hours/day)($15/hour + $5/hour) = $3,624 per day.
Therefore, select Machine A to maximize profit per day