Cost Benefit Analysis: Tokyo Skytreezkanemoto/TokyoSkytree.pdf · analogy method are utilized in...
25
Cost Benefit Analysis: Tokyo Skytree Aug 12, 2012 Lee, Jongwon Margallo, Ronald Takagi, Yu Xu, Yuncheng Graduate School of Public Policy, University of Tokyo Economic Analysis of Public Policy 2012
Transcript of Cost Benefit Analysis: Tokyo Skytreezkanemoto/TokyoSkytree.pdf · analogy method are utilized in...

Cost Benefit Analysis: Tokyo Skytree
Aug 12, 2012
Lee, Jongwon
Margallo, Ronald
Takagi, Yu
Xu, Yuncheng
Graduate School of Public Policy, University of Tokyo
Economic Analysis of Public Policy 2012

Contents
Executive Summary
1. Introduction
1.1 Project Overview
1.2 Goal of the Study
2. Financial Appraisal
2.1 Tokyo Skytree Tower
2.2 Tokyo Skytree Town
3. Cost-Benefit Analysis
3.1 Methodology
3.2 Cost Benefit Analysis on Primary Markets
3.2.1 Digital Signal Broadcasting Market
3.2.2 Leisure Market (Climbers)
3.2.3 Leisure Market (Shoppers)
3.3 Calculation of Changes in Social Surplus
3.4 Horizontal Value
3.5 Sensitivity Analysis
4. Qualitative Analysis
4.1 Existence Value
4. 2 Active and Passive Use Value
4.3 Attitude Surveys
4.4 Non-use Value
4.5 Other Concerns
5. Conclusion
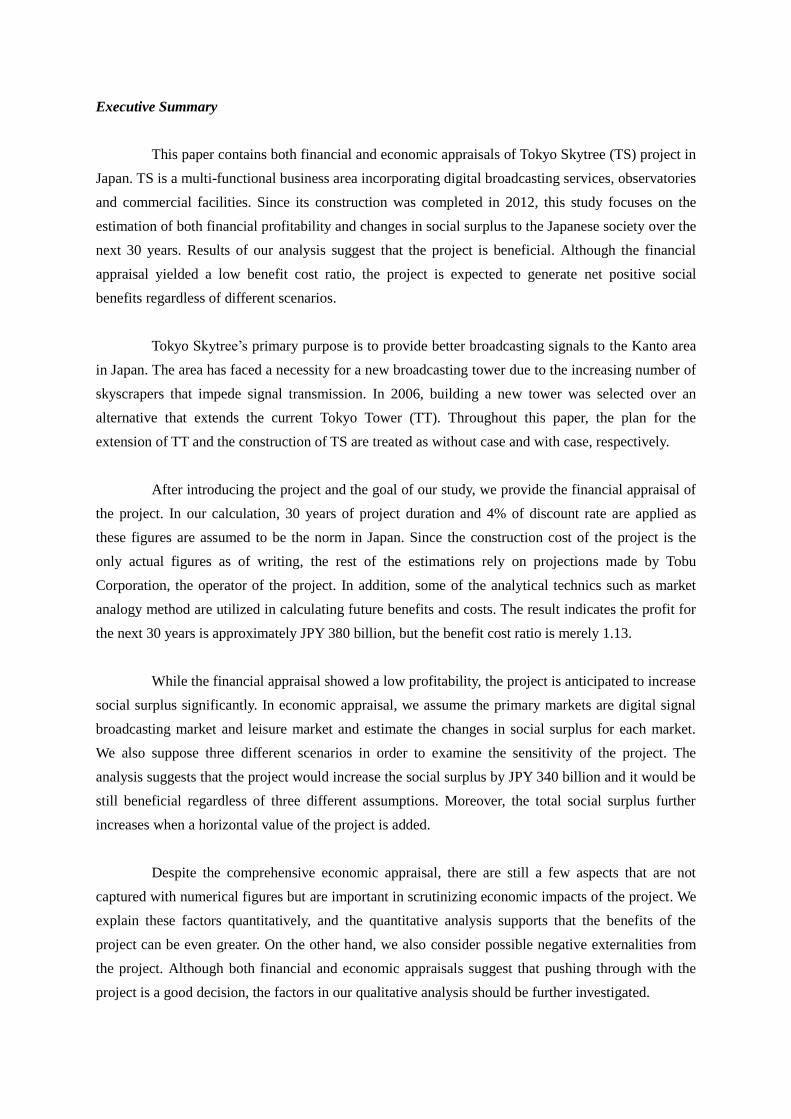
Executive Summary
This paper contains both financial and economic appraisals of Tokyo Skytree (TS) project in
Japan. TS is a multi-functional business area incorporating digital broadcasting services, observatories
and commercial facilities. Since its construction was completed in 2012, this study focuses on the
estimation of both financial profitability and changes in social surplus to the Japanese society over the
next 30 years. Results of our analysis suggest that the project is beneficial. Although the financial
appraisal yielded a low benefit cost ratio, the project is expected to generate net positive social
benefits regardless of different scenarios.
Tokyo Skytree’s primary purpose is to provide better broadcasting signals to the Kanto area
in Japan. The area has faced a necessity for a new broadcasting tower due to the increasing number of
skyscrapers that impede signal transmission. In 2006, building a new tower was selected over an
alternative that extends the current Tokyo Tower (TT). Throughout this paper, the plan for the
extension of TT and the construction of TS are treated as without case and with case, respectively.
After introducing the project and the goal of our study, we provide the financial appraisal of
the project. In our calculation, 30 years of project duration and 4% of discount rate are applied as
these figures are assumed to be the norm in Japan. Since the construction cost of the project is the
only actual figures as of writing, the rest of the estimations rely on projections made by Tobu
Corporation, the operator of the project. In addition, some of the analytical technics such as market
analogy method are utilized in calculating future benefits and costs. The result indicates the profit for
the next 30 years is approximately JPY 380 billion, but the benefit cost ratio is merely 1.13.
While the financial appraisal showed a low profitability, the project is anticipated to increase
social surplus significantly. In economic appraisal, we assume the primary markets are digital signal
broadcasting market and leisure market and estimate the changes in social surplus for each market.
We also suppose three different scenarios in order to examine the sensitivity of the project. The
analysis suggests that the project would increase the social surplus by JPY 340 billion and it would be
still beneficial regardless of three different assumptions. Moreover, the total social surplus further
increases when a horizontal value of the project is added.
Despite the comprehensive economic appraisal, there are still a few aspects that are not
captured with numerical figures but are important in scrutinizing economic impacts of the project. We
explain these factors quantitatively, and the quantitative analysis supports that the benefits of the
project can be even greater. On the other hand, we also consider possible negative externalities from
the project. Although both financial and economic appraisals suggest that pushing through with the
project is a good decision, the factors in our qualitative analysis should be further investigated.
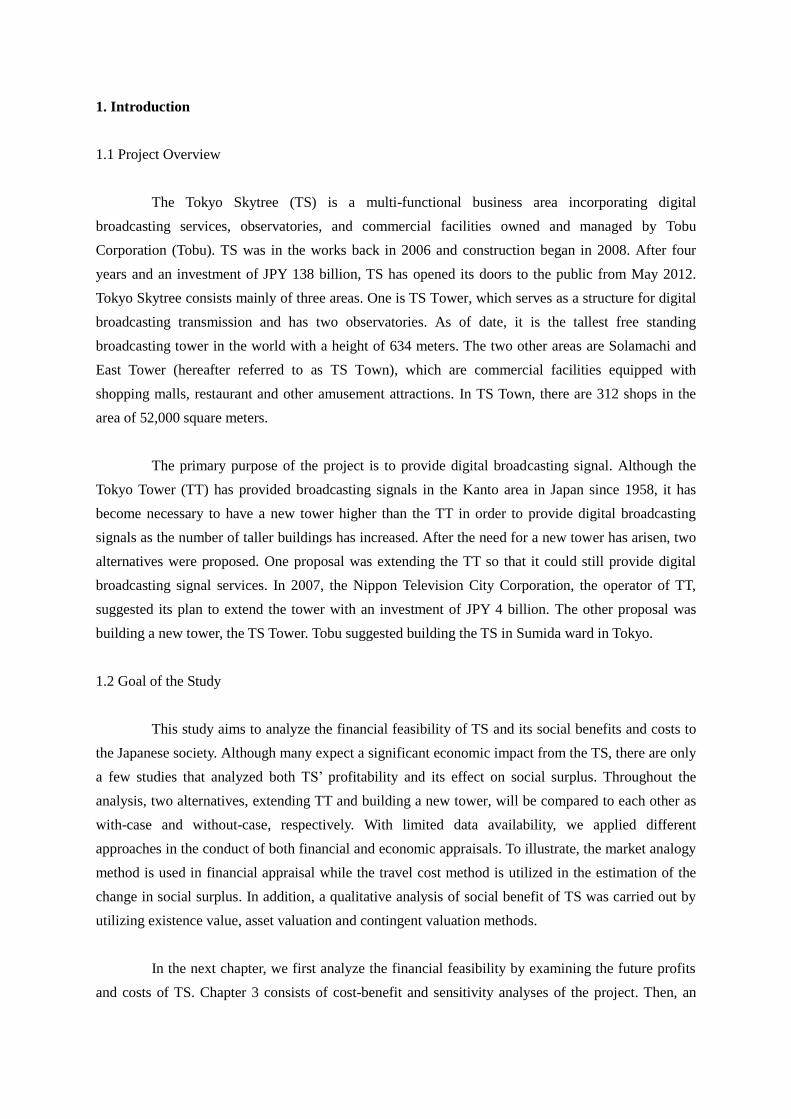
1. Introduction
1.1 Project Overview
The Tokyo Skytree (TS) is a multi-functional business area incorporating digital
broadcasting services, observatories, and commercial facilities owned and managed by Tobu
Corporation (Tobu). TS was in the works back in 2006 and construction began in 2008. After four
years and an investment of JPY 138 billion, TS has opened its doors to the public from May 2012.
Tokyo Skytree consists mainly of three areas. One is TS Tower, which serves as a structure for digital
broadcasting transmission and has two observatories. As of date, it is the tallest free standing
broadcasting tower in the world with a height of 634 meters. The two other areas are Solamachi and
East Tower (hereafter referred to as TS Town), which are commercial facilities equipped with
shopping malls, restaurant and other amusement attractions. In TS Town, there are 312 shops in the
area of 52,000 square meters.
The primary purpose of the project is to provide digital broadcasting signal. Although the
Tokyo Tower (TT) has provided broadcasting signals in the Kanto area in Japan since 1958, it has
become necessary to have a new tower higher than the TT in order to provide digital broadcasting
signals as the number of taller buildings has increased. After the need for a new tower has arisen, two
alternatives were proposed. One proposal was extending the TT so that it could still provide digital
broadcasting signal services. In 2007, the Nippon Television City Corporation, the operator of TT,
suggested its plan to extend the tower with an investment of JPY 4 billion. The other proposal was
building a new tower, the TS Tower. Tobu suggested building the TS in Sumida ward in Tokyo.
1.2 Goal of the Study
This study aims to analyze the financial feasibility of TS and its social benefits and costs to
the Japanese society. Although many expect a significant economic impact from the TS, there are only
a few studies that analyzed both TS’ profitability and its effect on social surplus. Throughout the
analysis, two alternatives, extending TT and building a new tower, will be compared to each other as
with-case and without-case, respectively. With limited data availability, we applied different
approaches in the conduct of both financial and economic appraisals. To illustrate, the market analogy
method is used in financial appraisal while the travel cost method is utilized in the estimation of the
change in social surplus. In addition, a qualitative analysis of social benefit of TS was carried out by
utilizing existence value, asset valuation and contingent valuation methods.
In the next chapter, we first analyze the financial feasibility by examining the future profits
and costs of TS. Chapter 3 consists of cost-benefit and sensitivity analyses of the project. Then, an

analysis of the qualitative aspects of TS that cannot be explained with explicit figures is conducted in
Chapter 4. The last chapter provides conclusion and the limitation of the study.
2. Financial Analysis
Financial appraisal is important in that it examines the minimum level of feasibility of the
project. The result of the analysis for TS suggests that the project is profitable although its benefit-cost
ratio is slightly higher than 1. The summary of the financial appraisal is illustrated in Table 1. As
shown in the table, the project duration is 30 years from the start of operation and the 4% of discount
rate is applied.
Table 2.1 Summary of Financial Appraisal
Project Duration 30 Years
Discount Rate 4 %
Total Benefit JPY 380 billion
Total Cost JPY 335 billion
Benefit-Cost Ratio 1.13
Since the TS Tower and TS Town have different markets, the financial analyses for those
two facilities were conducted separately. The whole analysis is basically based on the projection made
by Tobu for the next three years, which is illustrated in Table 2. However, the estimations of future
benefits and costs after the first three years rely on the market analogy of TT and Ikebukuro Sunshine
City (ISC), respectively.
Table 2.2 Projection by Tobu Corporation
TS Tower TS Town
Number of Visitors Operating
Revenue
Operating
Cost
Operating
Revenue
Operating
Cost
1st Year 10.6 10.1 9.5 9.2 4 million
2nd
Year 12.3 9.4 10.8 9.5 4.6 million
3rd
Year 11.6 8.9 11.2 9.6 4.3 million
Unit: JPY billion
2.2 Tokyo Skytree Tower
The revenues for TS Tower mainly come from the rents paid by broadcasting companies and
admission fees to the observatories. Assuming that the amount of revenues from rent would not
change significantly, the estimation of the benefit for the Tower was calculated by adjusting the
projection of Tobu. In order to estimate the future demand for the observatory, the change in the
number of visitors for TT was applied as a benchmark.
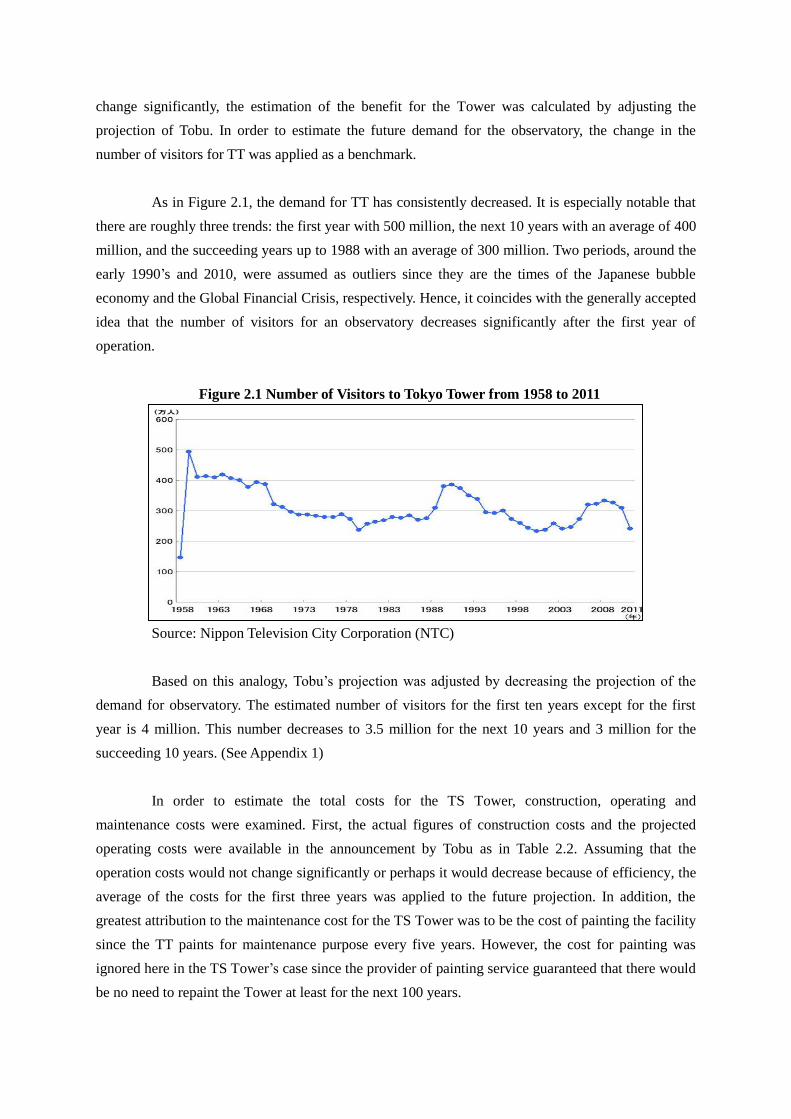
As in Figure 2.1, the demand for TT has consistently decreased. It is especially notable that
there are roughly three trends: the first year with 500 million, the next 10 years with an average of 400
million, and the succeeding years up to 1988 with an average of 300 million. Two periods, around the
early 1990’s and 2010, were assumed as outliers since they are the times of the Japanese bubble
economy and the Global Financial Crisis, respectively. Hence, it coincides with the generally accepted
idea that the number of visitors for an observatory decreases significantly after the first year of
operation.
Figure 2.1 Number of Visitors to Tokyo Tower from 1958 to 2011
Source: Nippon Television City Corporation (NTC)
Based on this analogy, Tobu’s projection was adjusted by decreasing the projection of the
demand for observatory. The estimated number of visitors for the first ten years except for the first
year is 4 million. This number decreases to 3.5 million for the next 10 years and 3 million for the
succeeding 10 years. (See Appendix 1)
In order to estimate the total costs for the TS Tower, construction, operating and
maintenance costs were examined. First, the actual figures of construction costs and the projected
operating costs were available in the announcement by Tobu as in Table 2.2. Assuming that the
operation costs would not change significantly or perhaps it would decrease because of efficiency, the
average of the costs for the first three years was applied to the future projection. In addition, the
greatest attribution to the maintenance cost for the TS Tower was to be the cost of painting the facility
since the TT paints for maintenance purpose every five years. However, the cost for painting was
ignored here in the TS Tower’s case since the provider of painting service guaranteed that there would
be no need to repaint the Tower at least for the next 100 years.

It is notable that the TS Tower would lose money if the number of visitors is less than 3.5
million even though the total projection suggests positive profitability of JPY 25 billion. Additionally,
the benefit cost ratio for TS tower is 1.16. (See Appendix 1) The construction cost was omitted when
calculating the total profit since the costs for each year include depreciation costs.
2.3 Tokyo Skytree Town
The revenue from TS Town is largely the rents paid by business facilities. Thus, it could be
assumed that the future revenue would not fluctuate unless there is a serious change in the occupancy
rate of TS Town. Based on this assumption, the average of the revenues for the first three years is
implied for the estimated revenues after those three years.
The total costs for TS Town was also broken down into three aspects: construction,
operation and maintenance. As same as the TS Tower estimation, the actual figure of construction cost
was used and the average of Tobu’s projection was borrowed for the operation cost. To estimate the
maintenance cost of TS Town, however, the market analogy of ISC was implied as a benchmark in
that the ISC provides similar services and has similar size of business as to the Town. Indeed, the ISC
provides a wide range of services from shopping mall and restaurants to an observatory.
According to the financial statements by ISC, it has spent approximately JPY 2 billion on
average from 2007 to 2010. We then calculated the maintenance cost per square meter for the ISC and
calculated the number by the size of business area of TS Town. As a result, the maintenance cost for
square meter of TS Town was estimated as JPY 637 million per year. The financial analysis for the
Town yielded 1.10 of benefit-cost ratio, lower than that of TS tower. (See Appendix 2)
As stated as in Table 1, the financial appraisal for TS is positive with profit of JPY 43 billion,
although the benefit-cost ratio is very low. (See Appendix 3) However, the ratio could be possibly
higher due to the uncertainty in the estimation of maintenance costs. Tobu only disclosed their
projection of operating costs, and we added estimated maintenance cost when calculating the total
cost for the project. There is a chance that the maintenance costs were double counted if maintenance
costs were already included in the Tobu’s projection of operation costs.
3. Cost-Benefit Analysis
As we mentioned above, TS has two functions, one is for broadcasting and the other is for
commercial purpose, which can be divided into TS climbers and TS town shoppers. So, based on

these, the cost-benefit-analysis was implemented under following conditions or assumptions. First, the
alternative project is without TS. And its primary markets are digital signal broadcasting (DSB)
market and leisure market (climbers and shoppers). The main standings are consumers and producers
of primary markets and government as well. Also, we expected that TS has indirect impacts on the
employment, consumption and even local real estate markets, which need conducting quantitative
analysis.
3.1. Methodology
Since different primary markets have different features, we have chosen to use different
ways to estimate the Social Surplus (SS). These are:
a. For the DSB market: SS = Social Benefit (SB) - Social Cost (SC)
b. For the Leisure markets: SS = Consumer Surplus (CS)+Producer Surplus (PS)+Tax
Revenue–External Costs
3.2 CBA on Primary Markets
3.2.1 DSB Market
One of the main purposes of constructing TS is to better signal transmission for the TV
viewers in Kanto-area, while alternative choice is to extend the current Tokyo Tower. So for the DSB
market, based on the “with and w/o” scenario, we calculate the change of SS of TS tower.
Table 3.1 Digital Signal Broadcasting (DSB) Market
DSB market w/o TS Tower w/ TS Tower
Social Benefit A A
Social Cost 7.5 12
Social Surplus A - 7.5 A - 12
Unit: JPY billion
For SB, since both options have more or less the same impact on the improvement of
audience reach and view quality, we assume a same positive value A both for “w/ and w/o”. For SC,
the determining factor is the construction costs for extension of TT or TS Tower. Based on the
projection by NTC, the estimated extension cost was JPY 7.5 billion. While for the TS Tower, though
the total construction cost is JPY 60 billion, it is inappropriate to assign such amount to DSB market
since there are other primary markets. To make it simple and reasonable, we put 20% of cost , or JPY
12 billion, as the SC based on the revenue ratio from the DSB marker for Tobu company. So, from the
table, we can see clearly that the change of SS of TS Tower is minus JPY 4.5 billion.

3.2.2 Leisure Market (Climbers)
TS as a new landmark building in Tokyo will attract many visitors. Here we first focus on
the climbers who pay the admission fee to go to the 350-meter and 450-meter high viewing decks
called Tembo Deck and Tembo Galleria and enjoy the view of the Tokyo Metropolis and Mt. Fuji.
As we discussed above, we apply different method to calculate the change of social surplus.
Another important assumption is that, since TS is a unique building, we regard TS as a new market,
which means that we don’t calculate the change of social surplus according to the price change in an
existing market. So for the leisure market (both climbers and shoppers), we use the methodology
which can be reflected in the figure below and we just calculate the value of each part. (e.g. CS ,PS,
etc)
Figure 3.1 Methodology for the Leisure Market
Source: Economic Analysis of Public Policies class handout
A typical way of calculating the social surplus under this methodology is to derive the
demand curve. Due to limited time and small, inappropriate sample base for surveys, we use
alternative ways. The table below is the final outcome.
Table 3.2 Leisure Market (Climbers)
Leisure Market (Climbers) w/o TS Tower w/ TS Tower
Consumer Surplus No market existed. 4.6
Producer Surplus No market existed. 4.3
Taxes No market existed. 1.3
External Cost No market existed. 0
Social Surplus - 10.2
Unit: JPY billion

For consumer surplus, we use travel cost as an estimate. Though some surveys (we will talk
about it later) showed that the willingness to pay (WTP) is lower than the admission fee of TS Tower
(3000 Yen), it still seems to be logical to make the assumption that the WTP should be the same, if not
larger than, as the travel cost plus the admission fee. According to the projection of Tobu, the annual
number of climbers will be 4.6 million (from 2013). And according to the Japanese National Tourism
Organization, the average travel cost of visiting the TS will be JPY 1,000. So we get the annual
consumer surplus as JPY 4.6 billion.
For producer surplus, we directly calculate that based on the financial appraisal and use the
annual cash flow as an estimate of PS. Here annual cash flow equals the net profit plus the
depreciation cost. In Year 2013 the profit is JPY 2.7 billion and depreciation cost is JPY 1.6 billion
(80% of construction cost, or 48 billion, over 30 maturity years), so the annual producer surplus is
JPY 4.3 billion (2.7+1.6).
For tax revenue, there are basically two kinds of tax. One is consumption tax at a rate of 5%
and the other is corporate tax at a rate of 30%. So, we can calculate these taxes by multiplying the
annual revenue and net profit with the said rates. In Year 2013, the annual revenue for TS Tower is
JPY 11.8 billion and net profit is JPY 2.7 billion. So, consumption tax is JPY 0.5 billion
(11.8*5%/105%) and corporate tax is JPY 0.8 billion (2.7*30%). All in all, annual tax revenue will be
JPY 1.3 billion.
For external cost, TS seems to have some complex externalities, either positive or negative.
To give a specific value to the external cost, we use the real estate market of the neighboring areas as
a proxy. The figure below shows the land price of neighboring areas. We can see clearly that during
2011-12, when TS begins to operate, there is no change in the land price. In other words, the positive
externalities are offset by the negative externalities. Thus, it is safe to say that the external cost is zero
in this circumstance.
Consequently, the total annual social surplus is JPY 10.2 billion (4.6+4.3+1.3).
Figure 3.2 Trends in Real Estate Market

Source: Land General Information System, Ministry of Land, Infrastructure, Transport and Tourism
3.2.3 Leisure Market (Shoppers)
To prompt the tourism, TS has also built a complex shopping mall called Solamachi.
Basically the method we use in calculating the SS of the TS climbers market can also apply in the TS
shoppers market.
Table 3.3 Leisure Market (Shoppers)
Leisure Market (Shoppers) w/o TS Town with TS Town
Consumer Surplus No market existed. 12.6
Producer Surplus No market existed. 3.4
Taxes No market existed. 0.8
External Cost No market existed. 0
Social Surplus - 16.8
Unit: JPY billion
For consumer surplus, according to the projection by Sumida City government, the annual
shoppers will be 12.6 million. And the average travel cost is same with TS climbers, which is JPY
1000. So, the annual consumer surplus is JPY 12.6 billion. For producer surplus, in Year 2013, the net
profit is JPY 0.8 billion and the depreciation cost is JPY 2.6 billion (the whole construction cost of TS
Town, JPY 78 billion, over 30 years). So, the annual producer surplus is JPY 3.4 billion. For taxes,
since the revenue will be 10.8 billion and net profit will be JPY 0.8 billion in Year 2013, the
consumption tax will be JPY 0.52 billion and corporate tax will be JPY 0.25 billion. So, the annual
taxes will be JPY 0.8 billion. External cost is zero, same as TS tower. So, the total annual social
surplus will be JPY 16.8 billion (12.6+3.4+0.8).
3.3 Changes in Social Surplus from the Three Markets
We follow the same methodology in the previous section for computing the present value
of benefits for the succeeding years. It should be noted that the present value of social benefits in the
first year is adjusted since Tokyo Skytree opened in May 2012. For the other years, the values reflect
benefits for the full year. Adding up all values gives total social benefits of more than JPY 338.7
billion. The breakdown of this amount is shown in Table 3.4. Details of the computation are in
Appendix 4.
Table 3.4: Breakdown of the Change in Social Surplus
Source Net Change in Social Surplus

Digital Signal Broadcasting Market (4,500,000,000)
Leisure Market (Climbers) 129,263,889,253
Leisure Market (Shoppers) 214,006,405,829
Total 338,770,295,082
Unit: JPY
3.4 Horizon Value
The net social benefit from TS is assumed to continue indefinitely. Although the time frame
of the analysis in the previous section is for 30 years only, there will still be a need for TS Tower
beyond 2041. It is expected that TS Tower will continue to provide broadcasting services. It is
reasonable to say that no new skyscrapers will be built such that TS Tower’s broadcasting function is
compromised. Thus, constructing a taller tower will not be necessary. Furthermore, technological
advancements are assumed not to have any adverse effects on the existence of TS Tower. In the case
of TS Town, it is presumed to continue providing office and store spaces for lease. The Town’s
attractiveness to both businesses and visitors will not wane mainly due to its strong association with
TS Tower and Tobu’s constant innovation in amusement and leisure activities. Given all these
assumptions, TS will not become obsolete and the Japanese society will derive net benefits from it
over a long period of time.
A simplified computation of the net present value of TS’ horizon value is obtained through the
following formula from Boardman, Greenberg, Vining and Weimer (2010):
where A is the amount of net benefits received each year in annuity and i the interest rate. In our
computation, TS’s annual benefits from the 31st year onwards is equal to the net benefit in the 30
th
year, or around JPY 8.65 billion. Given the social discount rate of 4%, the horizon value is calculated
to be more than JPY 216.4 billion.
All in all, the total change in social surplus from TS is the present value of the net benefits for
the first 30 years, as computed in the section 3.4, plus the horizon value, or a total of JPY 555.21
billion.
3.5 Partial Sensitivity Analysis

A comprehensive CBA would not be complete without looking at possible changes in the
factors that affect the value of a project’s net social benefit. We analyze the effects of exogenous
changes in three factors, namely, the social discount rate, consumer demand, and acts of God.
A. An upward change in the social discount rate (SDR)
According to Otani (2012), the 4% SDR in Japan is derived from the yield on
long-term government bonds. This figure may increase due to two major factors. First, the
SDR would shoot up definitely if the Japanese government defaults from its debt. The
likelihood of defaulting would remain high if the Japanese government does not lower its debt
to GDP ratio. Second, the SDR may breach the 4% level if the system bases the its calculation
on the return rate on private investment and/or market interest rate. These rates are usually
higher than the yield on government bonds.
B. Negative demand shock
We look at scenarios wherein the demand for TS is lower than what is projected by
Tobu. The level of attention that TS is enjoying now may not be sustainable for a long period
of time. Preferences of the two leisure markets are dynamic and any unfavorable change
overtime would lower the social surplus derived from TS. This could be due to factors such as
Tobu’s shortcomings in meeting or surpassing climbers and shoppers’ expectations or an
exogenous drop in consumer patronage. We look at the effect of a drop in demand by 20%,
50%, and 80% for both leisure markets beginning on the second year of operation. The
demand from the digital signal broadcasting market is assumed to be constant.
C. Acts of God
A team from the University of Tokyo predicts that there is 75% likelihood that an
earthquake with a magnitude of at least 7 would hit Tokyo in the next four years.1 The
Japanese government has a less alarming but still gloomy prediction: 70% chance in the next
30 years. Considering this, we choose arbitrarily that the long overdue massive earthquake
would hit Tokyo in 2020. We assume that Tokyo Skytree would remain standing, as it
survived the great Tohoku earthquake last 11 March 2011, but would be damaged badly. For
purposes of calculating the value of such an effect, we assumed that the one-time
reconstruction expense would equal TS’ initial construction cost of JPY 138 billion.
As summarized in Table 3.5, TS remains beneficial to the Japanese society. Even if the SDR
doubles or quadruples (8% and 16%, respectively), the new social surplus is still positive. This is not
surprising considering that the internal rate of return stands at around 19.4%. Furthermore, negative
1 From reports in BBC News Asia (January 2012) and International Business Times (March 2012)

demand shocks do not bring the present value of social benefits in the red. A dramatic drop by 80% in
the demand of the two leisure markets results in a new social surplus with a positive value of JPY
15.21 billion. In terms of a one time increase in cost due to an earthquake in 2020, the social surplus is
valued at around JPY 454.4 billion. These scenarios show that in spite of changes in the three
parameters (all other things constant), TS’ net present value is still positive.
Table 3.5 Social Surplus from Tokyo Skytree Given Changes in Parameters
Three Parameters Change New Social Surplus
Value (in JPY)2
Is Tokyo Skytree still
beneficial? (Y/N)
A. Social discount rate
- An increase due to the impact
of the Japanese government
defaulting from its debt
↑ to 8%
↑ to 16%
212,670,000,000
33,840,000,000
Yes
Yes
B. Demand shock
- Actual arrival figures are
lower than projections due to
weak consumer demand
↓ by 20%
↓ by 50%
↓ by 80%
420,210,000,000
217,710,000,000
15,210,000,000
Yes
Yes
Yes
C. Acts of God
- Massive earthquake in 2020
causes a one time cost increase
↑ cost by
JPY 138
billion
454,374,751,710 Yes
4. Qualitative Analysis
4.1 Existence Value
Some observed changes in consumption of a good whose price or quantity is affected by
the policy change (situation change) allow WTP to be estimated. For applications of CBA, analysts
can reasonably assume that such estimates capture the entire WTP. However, in some applications of
CBA, especially those involving changes to unique environmental and social resources, people may
be willing to pay for the existence of “good” that they themselves will never actually “consume.”
Although conceptualizing and measuring such existence values poses a challenge to the application of
CBA, we consider existence value of TS as an additional category of benefit.
4. 2 Active and Passive Use Value
The first and the most obvious benefit category arising from “active use” of a good is
2 The new social surplus takes into account changes in both the net present value of social benefits and horizon
value.

“rivalrous consumption” of goods. In the case of TS, when people climb up to the observation deck of
TS or when people go shopping at the mall, TS can be categorized into “rivalrous consumption
goods.” The other use categories are for nonrivalrous goods. In particular, “indirect nonrivalrous
consumption” takes place offsite. Those consumed onsite,(i.e., watching TS from afar and buying
picture and postcard of TS at shops in different places) are labeled direct nonrivalrous consumption.
Expenditures of time and money on offsite nonrivalrous consumption provide some information for
estimating its value, though much less reliably than the other use category.
In terms of motivations of “passive use” benefits, four categories can be distinguished. The
first category, option value, is the amount that someone is willing to pay to keep open the option of
use, active or passive, in the future. It is only passive in the sense that it would not be fully captured
by estimates of WTP based on observations of active use.
4.3 Attitude Surveys
According to the survey by Toyo Keizai Inc., which was conducted just after the opening
of TS, more than 43% of respondents from different areas in Japan responded that they strongly want
to or, if possible, want to go to TS.
Table 4.1 Outline of Attitude Survey
Survey method Toyo Keizai Inc
Survey period June 2, 2012- June 3, 2012
Sample Size 1,000
Table 4.2 Result of Attitude Survey
Option value
While people in Hokkaido and Kinki might not be so enthusiastic about TS because of the
distance or the rivalrous relationship between Kanto and Kansai, nearly 44% of people in Japan who
haven’t visited but want to go to TS in the future, which can be option value. The second category,
pure existence value, arises because people believe the good has intrinsic value apart from its use. For
example, some people might be willing to pay to TS because they think that it is right that the
symbolic, the highest tower exists in Tokyo, as the largest metropolitan area in the world. As TS
survived from the big earthquake in March 2011, this tower is an embodiment of Japan’s advance
technology in architectural engineering. Some people might feel a sense of pride in TS as a symbol of
re-establishment of Japan after the earthquake. The remaining two categories are based on altruistic
existence values: gift to the current generation and bequest to future generations. Given the fact that
TS was constructed for the future multi-channel broadcasting systems or further development of
Sumida and Koto areas, an old town of Tokyo, the altruistic existence values might be focused on the
value to future generations.
There is another attitude survey conducted by a travel agency regarding more details of
preferences for TS. The survey asked respondents about their preferences in using or non-using, and
possible partitioning of WTP.
Table 4.3 Outline of WTP Survey
Survey method Questionnaire in the website of 4 travel.jp
Survey period December 27, 2011- January 5, 2012
Sample Size 993
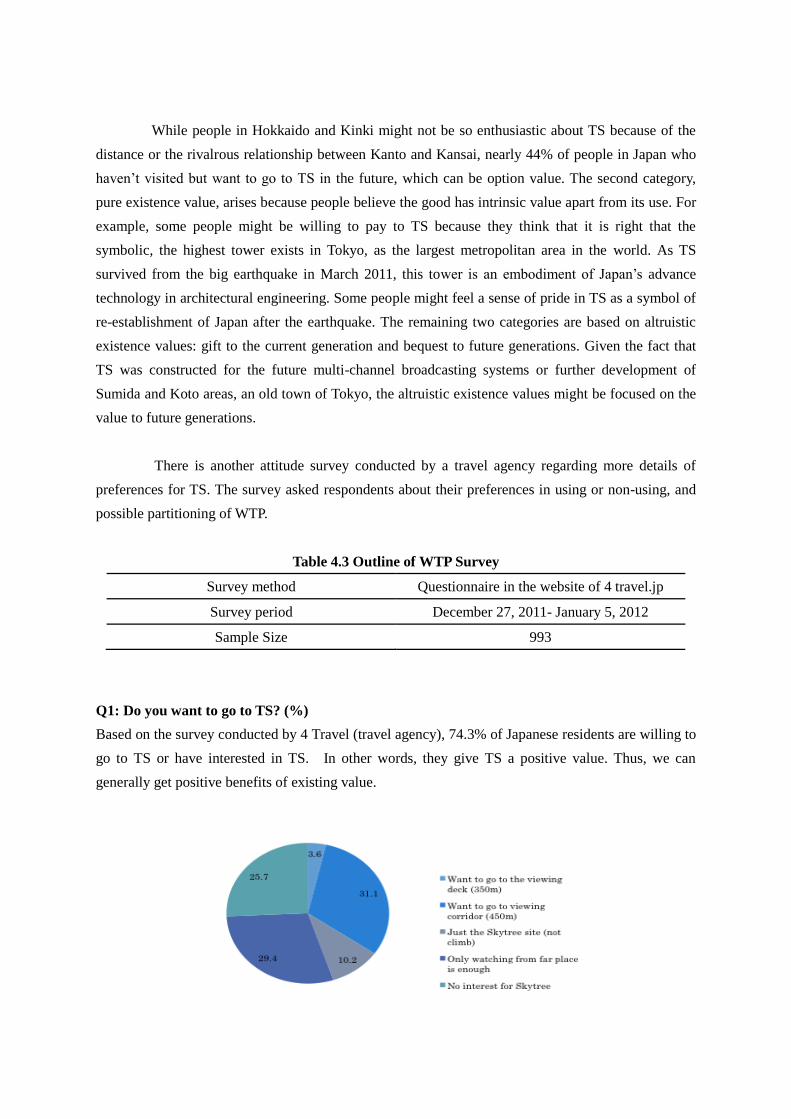
Q1: Do you want to go to TS? (%)
Based on the survey conducted by 4 Travel (travel agency), 74.3% of Japanese residents are willing to
go to TS or have interested in TS. In other words, they give TS a positive value. Thus, we can
generally get positive benefits of existing value.

Q2: The appropriate price of the ticket to the viewing corridor (450m) for you? * Actual Price:
3,000 yen
A manifest fact, according to the results of the surveys, is that although 74.3% of people feels positive
about TS, the appropriate price of ticket for them is quite low, compared with the actual price to the
viewing corridor (3,000 yen) . Given such a huge difference in ticket price between TS and Tokyo
Tower5, the price of TS's ticket can be a reason that people might reluctant to visit TS repeatedly. It
implies that, after the end of booms of TS, people’s demand for TS might be changed drastically as we
pointed out at the part of "sensitivity analysis."
4.4 Difficulty with non-use value
While most economists accept the general idea that people may derive value from the
existence of unique assets, clearly defining nonuse value6 is a complicated issue and there is not yet a
clear consensus on its precise as following points.
- Definition of non-use is not clear
- A good may have both use and non-use values
- Non-use value cannot be directly observed, only discovered through stated preferences
One difficulty arises in drawing a sharp line between use and nonuse. In terms of
standard consumer theory, any good that a person values is an argument in his or her utility function.
However, the quantity of a pure public good such as national defense, for instance, is “consumed” by
individuals passively. In this sense, existence value can also be thought of as a pure public good. It is
nonrivalrous - the value one person derives from it does not diminish the values derived by others. It
is nonexcludable- no one can be excluded from driving value from the quantity of the good, which is
5 The ticket price of Tokyo Tower's observatory is 820 yen and the total price to the special observatory is 1,420 yen. In
terms of proximity to the center of Tokyo and the ticket price, Tokyo Tower should have the price competitiveness. 6 The notion that people may place a value on the very existence of “unique phenomena of nature” that they neither visit,
nor ever anticipate visiting was introduced into the CBA literature by John V. Krutilla.

provided commonly to all. Viewed as a public good, it seems more appropriate to describe existence
value as passive use rather than nonuse.
Another difficulty arises because individuals derive both use and nonuse value from a
given asset. A person’s WTP for TS may be motivated by the anticipation of visiting TS in future and
the pleasure of knowing that future generations will be able to enjoy much broader and stable services
due to construction of TS. While the person’s total WTP, or as it is often called in the context total
economic value, is conceptually clear, the division between two categories of value is ambiguous
because the order or valuation is generally relevant.
The third difficulty has to do with differences in the way quantify changes affect use and
nonuse benefits. In general, nonuse benefits tend to be less quantity sensitive than use benefits.
Finally, the non-use category raises issues of motivation which are usually overlooked by
economists. In case that nonuse does not leave a behavioral trace, then non-use value cannot be
directly observed but only discovered through stated preferences.
4.5 Potential danger of electromagnetic wave (Other Concerns)
There is another discussion regarding the impact of the electromagnetic wave on human
health. As part of its Charter to protect public health and in response to public concern, the World
Health Organization (WHO) established the International EMF Project in 1996 to assess the scientific
evidence of possible health effects of EMF. 7 Although the cause and effect relationship has not been
fully established, strong signals from tower generates electromagnetic wave and negative impact of
electromagnetic wave is becoming issue. As we can easily observed through internet, many people
across the countries concerns of the negative impact on health (ex. childhood leukemia) by exposure
to electromagnetic fields (EMF).8
Each country sets its own limit level of EMF wave. In Europe where the adverse effects are
clearly recognized, each country set the following level.
- Italy: 10μW/c ㎡
- Russia, Switzerland : 2~4μW/c ㎡
- Around Tokyo tower: More than 10μW/c ㎡
7 http://www.who.int/peh-emf/en/ 8 http://www.babycom.gr.jp/eco/kodomo/s5.html
On the other hand, as some NPO, groups and activities also point out, the level of EMF
around Tokyo Tower is the same or even higher than that of the regulation level in some countries. If
the correlation between EMF and its negative impact on human health, the location of TS and TT
and the strength of the signals can be questioned. Moreover, the existence value of TS leads to a
fundamental change.
As CBA is increasingly applied to environmental and health issues, concern about existence
values among analysts will almost certainly grow. Unless methods of measurement improve
substantially, however, deciding when and how to include existence values in CBA will continue to be
difficult. By being aware of the limitations of these methods, analysts can be better producers and
consumers of CBA.
5. Conclusion & Limitations
As our CBA research shows, the project is profitable for Tobu Corporation. TS is expected
to generate significant social benefits regardless of different scenarios. However, at the same time, our
research has some limitations due to the time constrain and data availability. The credibility of the
analysis can be enhanced thorough contingent analysis such as more detailed attitude surveys. In
particular, further developing analysis, which includes external effects and the possible synergetic
effects between TS and other business units of Tobu Corporation, will give our CBA more
comprehensive perspective and social significance.

< References >
1. Japanese Sources:
第一生命経済研究所「第二東京タワーの経済波及効果」2006 年 5 月 10 日
(Dai-ichi Life Research Institute, Economic Effects of the Second Tokyo Tower)
墨田区地域振興部「新タワーによる地域活性化等調査報告書」2008 年 1 月
(Sumida Ward Office, Economic Effects of the New Tower on the Community)
あしぎん総合研究所「東京スカイツリータウン開業による栃木県への経済波及効果」2012年 4
月 25 日
(Ashigin Research Institute, Economic Effects of the Skytree on Tochigi Prefecture)
東部鉄道株式会社「2011年度決算説明資料」2012 年 5 月 11 日
(Tobu Corporation, Press Release)
株式会社サンシャインシティ「有価証券報告書」第 42 基, 第 43 基, 第 44 基, 第 45 基
(Sunshine City Corporation, Financial Reports)
日本電波塔株式会社「記者説明会資料:完全デジタル時代の東京タワー 」2007 年 9 月 21 日
(Nippon Television City Corporation, Press Release)
2. English Sources:
BBC News Asia. Big Tokyo Earthquake Likely Within the Next Few Years. 23 January 2012.
http://www.bbc.co.uk/news/16681136
Boardman, A. E, D. H. Greenberg, A. R. Vining and D. L. Weimer. Cost-Benefit Analysis:
Concepts and Practice, Fourth Edition. Prentice-Hall, Upper Saddle River, NJ, 2010.

International Business Times. Japan Earthquake 2012: Tokyo at Risk for Major Disaster in
Near Future. 15 March 2012.
http://www.ibtimes.com/articles/314733/20120315/japan-earthquake-2012-tokyo.htm
Otani, Satoru. Research to Advance the Evaluation Methodology of Public Works Projects.
Research Center for Land and Construction Management. 2012
http://www.nilim.go.jp/english/annual/annual2012/80.pdf

< Appendix 1: Financial Appraisal for Tokyo Skytree Tower >
Year No. of years
after opening
Discount
Rate: 4%
No. of
Visitors
Revenue
(After Discounting)
Cost
(After Discounting)
Net Profit Before
Tax
2011 1.04 62,400,000,000 -62,400,000,000
2012 1 1.00 4,000,000 10,600,000,000 10,173,333,333 426,666,667
2013 2 0.96 4,600,000 11,826,923,077 9,144,230,769 2,682,692,308
2014 3 0.92 4,300,000 10,724,852,071 8,330,251,479 2,394,600,592
2015 4 0.89 4,000,000 9,601,160,674 7,654,258,648 1,946,902,025
2016 5 0.85 4,000,000 9,231,885,263 7,359,864,085 1,872,021,178
2017 6 0.82 4,000,000 8,876,812,753 7,076,792,389 1,800,020,364
2018 7 0.79 4,000,000 8,535,396,878 6,804,608,067 1,730,788,811
2019 8 0.76 4,000,000 8,207,112,383 6,542,892,372 1,664,220,011
2020 9 0.73 4,000,000 7,891,454,214 6,291,242,665 1,600,211,549
2021 10 0.70 4,000,000 7,587,936,744 6,049,271,793 1,538,664,951
2022 11 0.68 4,000,000 7,296,093,023 5,816,607,494 1,479,485,530
2023 12 0.65 3,500,000 6,300,935,036 5,592,891,821 708,043,215
2024 13 0.62 3,500,000 6,058,591,381 5,377,780,597 680,810,784
2025 14 0.60 3,500,000 5,825,568,636 5,170,942,882 654,625,754
2026 15 0.58 3,500,000 5,601,508,303 4,972,060,463 629,447,840
2027 16 0.56 3,500,000 5,386,065,676 4,780,827,368 605,238,308
2028 17 0.53 3,500,000 5,178,909,304 4,596,949,393 581,959,911
2029 18 0.51 3,500,000 4,979,720,485 4,420,143,647 559,576,838
2030 19 0.49 3,500,000 4,788,192,774 4,250,138,122 538,054,652
2031 20 0.47 3,500,000 4,604,031,513 4,086,671,271 517,360,242
2032 21 0.46 3,500,000 4,426,953,378 3,929,491,607 497,461,771
2033 22 0.44 3,000,000 3,773,968,978 3,778,357,314 -4,388,336
2034 23 0.42 3,000,000 3,628,816,325 3,633,035,879 -4,219,554
2035 24 0.41 3,000,000 3,489,246,467 3,493,303,730 -4,057,263
2036 25 0.39 3,000,000 3,355,044,679 3,358,945,894 -3,901,215
2037 26 0.38 3,000,000 3,226,004,499 3,229,755,667 -3,751,168
2038 27 0.36 3,000,000 3,101,927,403 3,105,534,296 -3,606,892
2039 28 0.35 3,000,000 2,982,622,503 2,986,090,669 -3,468,166
2040 29 0.33 3,000,000 2,867,906,253 2,871,241,028 -3,334,775
2041 30 0.32 3,000,000 2,757,602,166 2,760,808,681 -3,206,514
Total 182,713,242,839 157,638,323,421 25,074,919,419
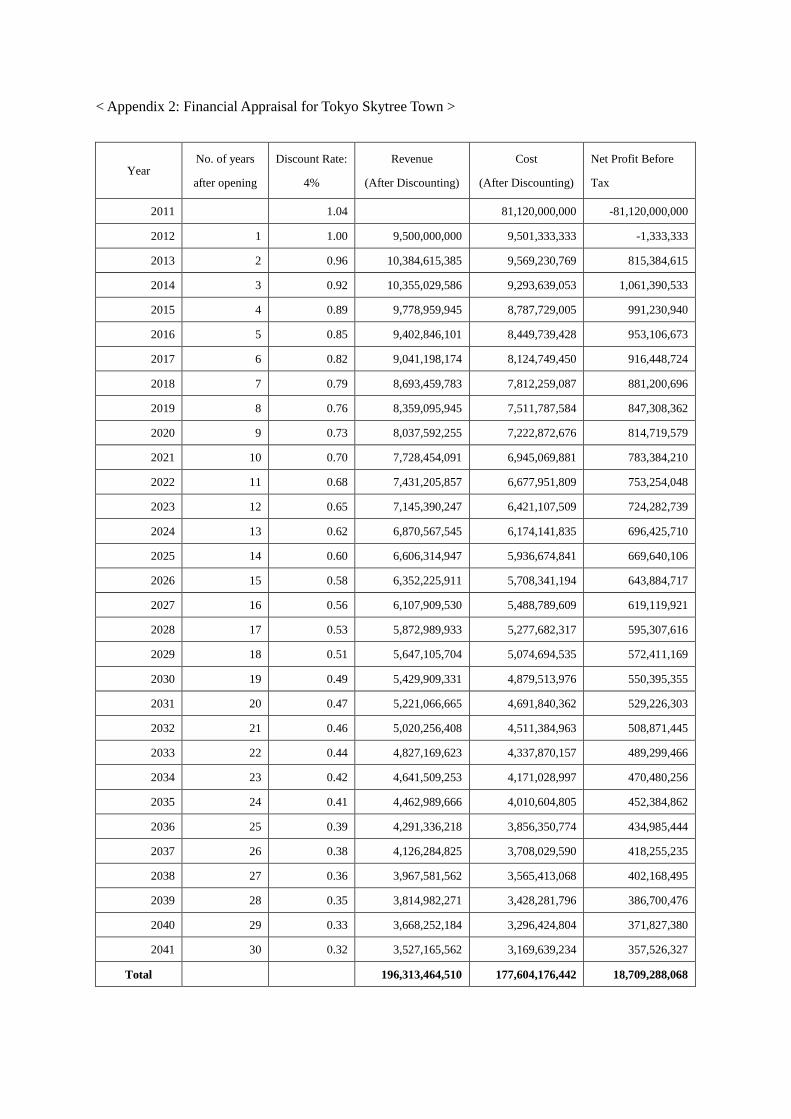
< Appendix 2: Financial Appraisal for Tokyo Skytree Town >
Year No. of years
after opening
Discount Rate:
4%
Revenue
(After Discounting)
Cost
(After Discounting)
Net Profit Before
Tax
2011 1.04 81,120,000,000 -81,120,000,000
2012 1 1.00 9,500,000,000 9,501,333,333 -1,333,333
2013 2 0.96 10,384,615,385 9,569,230,769 815,384,615
2014 3 0.92 10,355,029,586 9,293,639,053 1,061,390,533
2015 4 0.89 9,778,959,945 8,787,729,005 991,230,940
2016 5 0.85 9,402,846,101 8,449,739,428 953,106,673
2017 6 0.82 9,041,198,174 8,124,749,450 916,448,724
2018 7 0.79 8,693,459,783 7,812,259,087 881,200,696
2019 8 0.76 8,359,095,945 7,511,787,584 847,308,362
2020 9 0.73 8,037,592,255 7,222,872,676 814,719,579
2021 10 0.70 7,728,454,091 6,945,069,881 783,384,210
2022 11 0.68 7,431,205,857 6,677,951,809 753,254,048
2023 12 0.65 7,145,390,247 6,421,107,509 724,282,739
2024 13 0.62 6,870,567,545 6,174,141,835 696,425,710
2025 14 0.60 6,606,314,947 5,936,674,841 669,640,106
2026 15 0.58 6,352,225,911 5,708,341,194 643,884,717
2027 16 0.56 6,107,909,530 5,488,789,609 619,119,921
2028 17 0.53 5,872,989,933 5,277,682,317 595,307,616
2029 18 0.51 5,647,105,704 5,074,694,535 572,411,169
2030 19 0.49 5,429,909,331 4,879,513,976 550,395,355
2031 20 0.47 5,221,066,665 4,691,840,362 529,226,303
2032 21 0.46 5,020,256,408 4,511,384,963 508,871,445
2033 22 0.44 4,827,169,623 4,337,870,157 489,299,466
2034 23 0.42 4,641,509,253 4,171,028,997 470,480,256
2035 24 0.41 4,462,989,666 4,010,604,805 452,384,862
2036 25 0.39 4,291,336,218 3,856,350,774 434,985,444
2037 26 0.38 4,126,284,825 3,708,029,590 418,255,235
2038 27 0.36 3,967,581,562 3,565,413,068 402,168,495
2039 28 0.35 3,814,982,271 3,428,281,796 386,700,476
2040 29 0.33 3,668,252,184 3,296,424,804 371,827,380
2041 30 0.32 3,527,165,562 3,169,639,234 357,526,327
Total 196,313,464,510 177,604,176,442 18,709,288,068
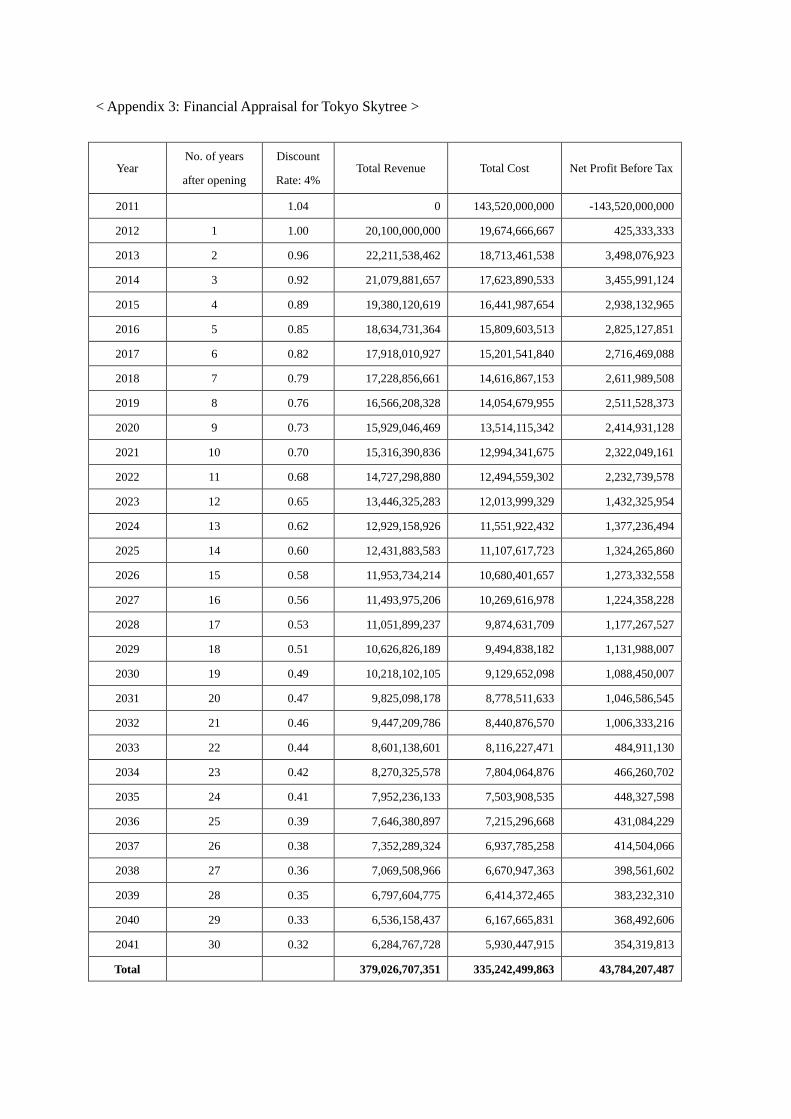
< Appendix 3: Financial Appraisal for Tokyo Skytree >
Year No. of years
after opening
Discount
Rate: 4% Total Revenue Total Cost Net Profit Before Tax
2011 1.04 0 143,520,000,000 -143,520,000,000
2012 1 1.00 20,100,000,000 19,674,666,667 425,333,333
2013 2 0.96 22,211,538,462 18,713,461,538 3,498,076,923
2014 3 0.92 21,079,881,657 17,623,890,533 3,455,991,124
2015 4 0.89 19,380,120,619 16,441,987,654 2,938,132,965
2016 5 0.85 18,634,731,364 15,809,603,513 2,825,127,851
2017 6 0.82 17,918,010,927 15,201,541,840 2,716,469,088
2018 7 0.79 17,228,856,661 14,616,867,153 2,611,989,508
2019 8 0.76 16,566,208,328 14,054,679,955 2,511,528,373
2020 9 0.73 15,929,046,469 13,514,115,342 2,414,931,128
2021 10 0.70 15,316,390,836 12,994,341,675 2,322,049,161
2022 11 0.68 14,727,298,880 12,494,559,302 2,232,739,578
2023 12 0.65 13,446,325,283 12,013,999,329 1,432,325,954
2024 13 0.62 12,929,158,926 11,551,922,432 1,377,236,494
2025 14 0.60 12,431,883,583 11,107,617,723 1,324,265,860
2026 15 0.58 11,953,734,214 10,680,401,657 1,273,332,558
2027 16 0.56 11,493,975,206 10,269,616,978 1,224,358,228
2028 17 0.53 11,051,899,237 9,874,631,709 1,177,267,527
2029 18 0.51 10,626,826,189 9,494,838,182 1,131,988,007
2030 19 0.49 10,218,102,105 9,129,652,098 1,088,450,007
2031 20 0.47 9,825,098,178 8,778,511,633 1,046,586,545
2032 21 0.46 9,447,209,786 8,440,876,570 1,006,333,216
2033 22 0.44 8,601,138,601 8,116,227,471 484,911,130
2034 23 0.42 8,270,325,578 7,804,064,876 466,260,702
2035 24 0.41 7,952,236,133 7,503,908,535 448,327,598
2036 25 0.39 7,646,380,897 7,215,296,668 431,084,229
2037 26 0.38 7,352,289,324 6,937,785,258 414,504,066
2038 27 0.36 7,069,508,966 6,670,947,363 398,561,602
2039 28 0.35 6,797,604,775 6,414,372,465 383,232,310
2040 29 0.33 6,536,158,437 6,167,665,831 368,492,606
2041 30 0.32 6,284,767,728 5,930,447,915 354,319,813
Total 379,026,707,351 335,242,499,863 43,784,207,487

< Appendix 4: NPV for Tokyo Skytree in cost-benefit analysis>
Years No. of Years
After Opening
Discount
Rate: 4% SS for Climbers
After
Discounting SS for Shoppers
After
Discounting SS for DSB
2011 1.04 -48,000,000,000 -49,920,000,000 -78,000,000,000 -81,120,000,000
2012 1 1.00 6,684,666,667 6,684,666,667 11,073,666,667 11,073,666,667 -4,500,000,000
2013 2 0.96 11,200,000,000 10,769,230,769 16,800,000,000 16,153,846,154
2014 3 0.92 11,200,000,000 10,355,029,586 16,800,000,000 15,532,544,379
2015 4 0.89 11,200,000,000 9,956,759,217 16,800,000,000 14,935,138,826
2016 5 0.85 11,200,000,000 9,573,806,940 16,800,000,000 14,360,710,409
2017 6 0.82 11,200,000,000 9,205,583,596 16,800,000,000 13,808,375,394
2018 7 0.79 11,200,000,000 8,851,522,688 16,800,000,000 13,277,284,032
2019 8 0.76 11,200,000,000 8,511,079,508 16,800,000,000 12,766,619,262
2020 9 0.73 11,200,000,000 8,183,730,296 16,800,000,000 12,275,595,444
2021 10 0.70 11,200,000,000 7,868,971,438 16,800,000,000 11,803,457,158
2022 11 0.68 11,200,000,000 7,566,318,691 16,800,000,000 11,349,478,036
2023 12 0.65 11,200,000,000 7,275,306,434 16,800,000,000 10,912,959,650
2024 13 0.62 11,200,000,000 6,995,486,955 16,800,000,000 10,493,230,433
2025 14 0.60 11,200,000,000 6,726,429,765 16,800,000,000 10,089,644,647
2026 15 0.58 11,200,000,000 6,467,720,928 16,800,000,000 9,701,581,391
2027 16 0.56 11,200,000,000 6,218,962,430 16,800,000,000 9,328,443,646
2028 17 0.53 11,200,000,000 5,979,771,568 16,800,000,000 8,969,657,352
2029 18 0.51 11,200,000,000 5,749,780,354 16,800,000,000 8,624,670,530
2030 19 0.49 11,200,000,000 5,528,634,955 16,800,000,000 8,292,952,433
2031 20 0.47 11,200,000,000 5,315,995,149 16,800,000,000 7,973,992,724
2032 21 0.46 11,200,000,000 5,111,533,797 16,800,000,000 7,667,300,696
2033 22 0.44 11,200,000,000 4,914,936,344 16,800,000,000 7,372,404,516
2034 23 0.42 11,200,000,000 4,725,900,330 16,800,000,000 7,088,850,496
2035 24 0.41 11,200,000,000 4,544,134,933 16,800,000,000 6,816,202,400
2036 25 0.39 11,200,000,000 4,369,360,513 16,800,000,000 6,554,040,769
2037 26 0.38 11,200,000,000 4,201,308,185 16,800,000,000 6,301,962,278
2038 27 0.36 11,200,000,000 4,039,719,409 16,800,000,000 6,059,579,113
2039 28 0.35 11,200,000,000 3,884,345,585 16,800,000,000 5,826,518,378
2040 29 0.33 11,200,000,000 3,734,947,678 16,800,000,000 5,602,421,518
2041 30 0.32 11,200,000,000 3,591,295,845 16,800,000,000 5,386,943,767
total 146,982,270,553 -4,500,000,000