Cost Benefit Analysis of Soil and Water Conservation ...
78
Cost Benefit Analysis of Soil and Water Conservation technologies applicable to Green Water management in the Saba Saba sub- catchment of the Upper Tana catchment in Kenya MSc Thesis Gerald Atampugre July, 2011 Environmental Economics and Natural Resource Group
Transcript of Cost Benefit Analysis of Soil and Water Conservation ...

Cost Benefit Analysis of Soil and Water Conservation technologies applicable to Green Water management in the Saba Saba sub-
catchment of the Upper Tana catchment in Kenya
MSc Thesis
Gerald Atampugre
July, 2011
Environmental Economics and Natural Resource Group

Cost Benefit Analysis of Soil and Water Conservation technologies applicable to Green Water management in the Saba Saba sub-
catchment of the Upper Tana catchment in Kenya
Master thesis Environmental Economics and Natural Resources Group and Land Degradation Development Group and submitted in partial fulfilment of the degree of Master of Science in International Development Studies at Wageningen University,
the Netherlands.
Study program: MSc International Development Studies (MID)
Course number: ENR-80433
Registration Number: 790823020130
WU thesis supervisor(s):Dr. Jan de Graaff: Land Degradation and Development group (LDD)Dr. Xueqin Zhu: Environmental Economics and Natural Resources group (ENR)
ISRIC-GWC project supervisorsDr. Sjef Kauffman (ISRIC & GWC)Drs. Godert van Lynden (ISRIC)Dr. Boro Gathuo (GWC-Kenya)Dr. John Mburu (University Of Nairobi)Mr. Boniface Mwaniki (WRMA-Embu)
Examiner: Prof. Dr. E.C. van Ierland (ENR Group)

Water Resource Management Authority (Embu Sub-Region)
University of Nairobi


I
Dedication
Dedicated to my to wife, Patricia Atampugre, my son Raphael Atampugre Ayine, my mother Alice Asabia, and to my late father, Thomson Akurigo.
II
Acknowledgements
I give all glory and thanks to God almighty for granting me the mercies and strength for this
thesis. I will also like to thank The Netherlands Organization for International Cooperation in
Higher Education (NUFFIC) for sponsoring my MSc study here in Wageningen University. I
wish to also express my appreciation to International Soil Reference and Information Centre
(ISRIC), especially to Dr. Sjef Kauffman (ISRIC & GWC) and Drs. Godert van Lynden
(ISRIC) for taking interest in this research and providing funding for its implementation. I
owe much gratitude to my Wageningen University thesis supervisors, Dr. Jan de Graaff and
Dr. Xueqin Zhu for your selfless and constructive guidance during the implementation of this
research project. You were always there to stimulate new ideas and for that I am very
grateful.
I am also gratified by the efforts Kenyan Water Resource Management Authority (WRMA),
Mr. Boniface Mwaniki (Head of WRMA-Embu), and Mr. Peter Ngufu (WRMA) put in to
make this study a success. I acknowledge the support you gave me throughout my stay in
Embu and I am thankful. To Dr. Boro Gathuo (GWC-Kenya) and Dr. John Mburu
(University of Nairobi), I say thank you for the invaluable support you gave me during my
fieldwork in Kenya. I also want to say thank you to Saba Saba Water Resource Users
Association (Saba Saba WRUA) executives for the important role they played during the
field survey. In appreciation I say thank you to ETC East Africa Ltd for supporting this
research.
Finally, to my wife Patricia and my mother Alice, I acknowledge the inconveniences I caused
you by being away when you needed me most and I say thank you and God bless you for
being understanding. To my friends, Mr. Henry Kangah, Mr. Stephen Amankwah Yeboah,
and Dr. Simon Mariwah , thank you for being supportive and caring during my study period
in The Netherlands.

III
Abtsract
In the phase of alarming soil erosion, lack of profitability of Soil and Water Conservation
(SWC) measures at the farm level transpires to be the principal reason hindering their
adoption. It is therefore imperative for promoters of SWC adoption like the Green Water
Credits and their stakeholders to understand the financial costs and benefits associated with
adopting SWC measures and how effective these methods are in solving the problem of soil
erosion. This research investigates the net welfare (net benefits) associated with adopting
Bench Terraces (BT), Contour Bunds (CB), and Napier Grass Strips (NGS) and the factors
for continuity of the Green Water Credits (GWC) project in the Saba Saba sub-catchment.
An agronomic survey and in-depth interviews were conducted in the Saba Saba sub-
catchment to obtain farm level quantitative data for the Cost Benefit Analysis (CBA) and the
discussion on the continuity of GWC project. Financial functions in excel was used to
analyse the on-site costs and benefits of adopting the SWC technologies with crops such as
maize, coffee, and tea. In this research CBA was used as a decision tool after the computation
of all cost and benefits were valued in local currency to obtain the Net Present Value (NPV)
or net welfare. The results show that investment in SWC measures may not be a feasible
short-term option from farmers’ perspective. There is a strong case for intervention,
especially in the initial years where SWC adoption yields negative returns. Bench Terrace
was found to yield relatively higher on-site net welfare. Perceived ownership of the project
on the part of up- and down-stream stakeholders was found, among others, to be one of the
most important factors for the continuity of the GWC project.
Keywords: Soil erosion, Soil and Water conservation, Bench Terraces, Contour Bunds,
Napier Grass Strips, Cost Benefit Analysis, Net welfare, Green Water Credits

IV
Table of Contents
Content Page
Dedication ................................................................................................................................. I
Acknowledgements .................................................................................................................II
Abtsract.................................................................................................................................. III
List of Tables ......................................................................................................................... VI
List of Figures.......................................................................................................................VII
Acronyms............................................................................................................................ VIII
1. Introduction..........................................................................................................................1
1.1 Problem statement ............................................................................................................3
1.2 Objective of study ............................................................................................................5
1.3 Specific objectives............................................................................................................5
1.4 Research questions ...........................................................................................................5
2. Materials and research method ..........................................................................................6
2.1 Profile of study area .........................................................................................................6
2.1.1 Location .....................................................................................................................6
2.1.2 Climate, rainfall, and drainage ..................................................................................8
2.1.3 Slope, soil and vegetation..........................................................................................8
2.1.4 Human population .....................................................................................................9
2.1.5 Land use and economic activities..............................................................................9
2.1.6 Prevailing catchment issues and management strategies ........................................10
2.2 Cost Benefit Analysis.....................................................................................................12
2.3 Data collection and analysis...........................................................................................17
3. Results and discussion .......................................................................................................21
3.1 Characteristics of smallholder farmers in Saba Saba sub-catchment.............................21
3.2 Soil and Water Conservation technologies applicable to Green Water conservation....24

V
3.3 Factors influencing the adoption of Soil and Water Conservation technologies ...........28
3.4 Financial costs and benefits from the adoption of Soil and Water Conservation
technologies..........................................................................................................................33
3.4.1 Establishment and maintenance cost .......................................................................33
3.4.2 Cash flow.................................................................................................................35
3.4.3 Financial efficiency of Soil and Water Conservation technologies ........................38
3.4.4 Sensitivity Analysis .................................................................................................40
3.5 Continuity of the Green Water Credit project from other stakeholder’s perspective ....43
4. Conclusions and recommendations..................................................................................46
References...............................................................................................................................49
Appendices..............................................................................................................................53
Appendix 1: Annual gross margin .......................................................................................53
Appendix 1a: Annual gross margin of maize production on Bench Terraces..................53
Appendix 1b: Annual gross margin of maize production on Contour Bunds (CB) .........54
Appendix 1c: Annual gross margin of maize production on Napier Grass Strips (NGS) 55
Appendix 1d: Annual gross margin of coffee production on Bench Terrace...................56
Appendix 1e: Annual gross margin of coffee production on Contour Bunds (CB) .........57
Appendix 1f: Annual gross margin of tea production on Bench Terraces .......................58
Appendix 2. Cost Benefit Analysis results (8.5% discount rate) .........................................59
Appendix 2a: NPV and IRR of the investment in Bench Terrace on maize farms ..........59
Appendix 2b: NPV and IRR of the investment in Contour Bunds on maize farms .........60
Appendix 2c. NPV and IRR of the investment in Napier Grass Strips on maize farms ..61
Appendix 2d. NPV and IRR of the investment in Bench Terrace on coffee farms.........62
Appendix 2e. NPV and IRR of the investment in Contour Bunds on coffee farms.........63
Appendix 2f. NPV and IRR of the investment in Bench Terrace on Tea farms .............64
Appendix 3: Evidence of fieldwork (pictures from the Saba Saba sub-catchment) ............65

VI
List of Tables
Table Page
Table 1: Population within the Saba Saba sub-catchment .........................................................9
Table 2: Characteristics of Soil and Water Conservation in this study ...................................15
Table 3: Respondents by Divisions and Locations ..................................................................19
Table 4 : Respondents by Soil and Water Conservation and crop type...................................19
Table 5: Household and farm characteristic (mean values).....................................................21
Table 6: Maize farms (on slopes 20% - 40%) with and without Bench Terraces ...................30
Table 7: Main occupation of farmers with and without Soil and Water Conservation (in %) 31
Table 8: Farmer’s perception of soil erosion ...........................................................................32
Table 9: An overview of gross margin and Cost Benefit Analysis..........................................40
Table 10: Responsiveness of the Net Present Value to discount rate changes (maize farms).41
Table 11: Responsiveness of the Net Present Value to discount rate changes (coffee farms) 41
Table 12: Responsiveness of the Net Present Value and Internal Rate of Return to wage rate
changes (maize farms) .............................................................................................................42
Table 13: Responsiveness of the Net Present Value and Internal Rate of Return to wage rate
changes (coffee farms).............................................................................................................42

VII
List of Figures
Figure Page
Figure 1: Green Water Credits mechanism................................................................................3
Figure 2: A farm in Saba Saba sub-catchment divided in two by erosion.................................4
Figure 3: Map of Upper Tana River catchment .........................................................................7
Figure 4: Map of Saba Saba sub-catchment ..............................................................................7
Figure 5a: Saba Saba River Figure 5b: Silted Saba Saba River .............................................11
Figure 6: Net welfare measurement of adopting Soil and Water Conservation technologies .13
Figure 7: Informal discussions with WRMA officers and Saba Saba WRUA executives ......18
Figure 8: Survey session with a female respondent.................................................................20
Figure 9: Coffee farm with Bench Terraces (BT)....................................................................25
Figure 10: Maize farm with Napier Grass Strips .....................................................................26
Figure 11: Schematic diagram of Contour Bunds....................................................................26
Figure 12: Establishment and maintenance costs of Bench Terraces, Contour Bunds, and
Napier Grass Strips in the Saba saba catchment......................................................................34
Figure 13: Comparison of cash flows from investments in Bench Terraces on maize, coffee,
and tea farms ............................................................................................................................35
Figure 14: Comparison of cash flows from investment in Contour Bunds on maize and coffee
farms ........................................................................................................................................37
Figure 15: Comparison of cash flows from investments in Bench Terraces, Contour Bunds,
and Napier Grass Strips on maize farms..................................................................................38
VIII
Acronyms
BT Bench Terrace
CB Contour Bunds
CBA Cost Benefit Analysis
FAO Food and Agriculture Organization
GW Green Water
GWC Green Water Credit
IFAD International Fund for agricultural Development
IRR Internal Rate of Return
ISRIC International Soil Reference and Information Centre
KARI Kenya Agriculture Research Institute
Kengen Kenya electricity
KES Kenyan Shillings
MD Mandays
MoA Ministry of Agriculture, Kenya
NEMA National Environmental Management Authority, Kenya
NGS Napier Grass Strips
NIB National Irrigation Board, Kenya
NPV Net Present Value
PRESA Pro-poor Rewards for Environmental Services in Africa
SSA Sub-Sahara Africa
SWC Soil and Water Conservation
TARDA Tana and Athi River Development Authority
WOCAT World Overview of Conservation Approaches and Technologies
WRMA Water Resource Management Authority, Kenya
WRUA Water Resource Users Association,
1
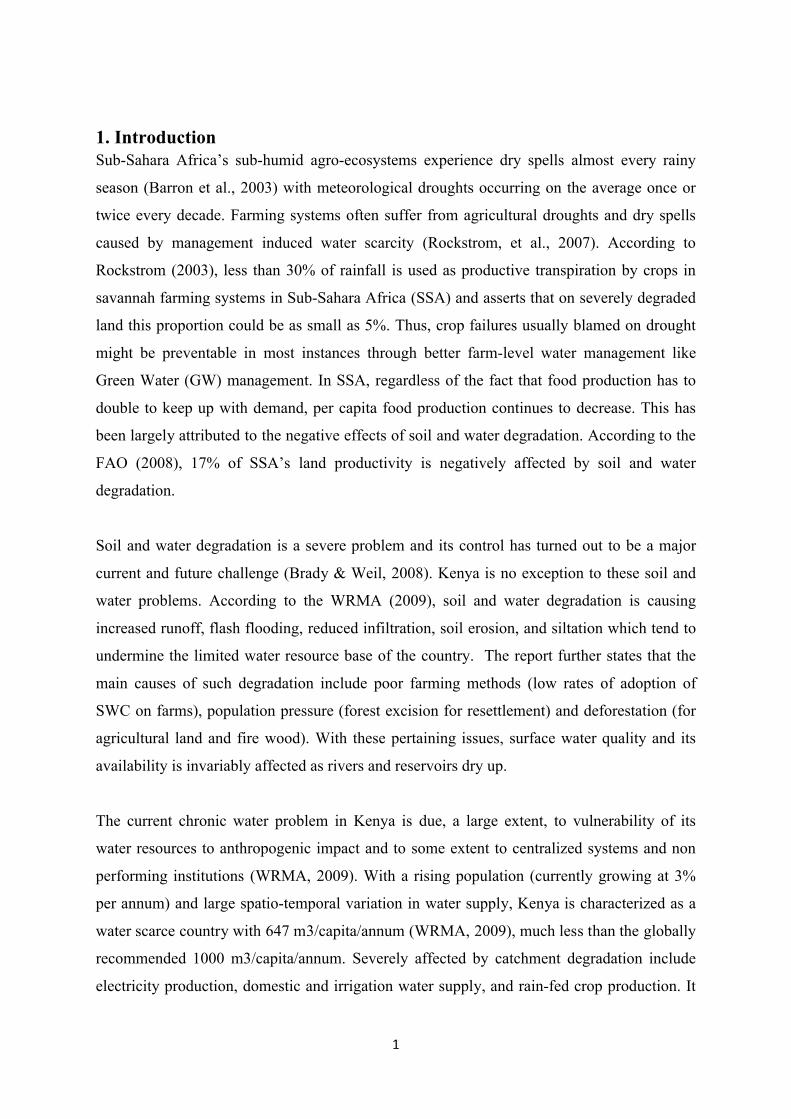
1. IntroductionSub-Sahara Africa’s sub-humid agro-ecosystems experience dry spells almost every rainy
season (Barron et al., 2003) with meteorological droughts occurring on the average once or
twice every decade. Farming systems often suffer from agricultural droughts and dry spells
caused by management induced water scarcity (Rockstrom, et al., 2007). According to
Rockstrom (2003), less than 30% of rainfall is used as productive transpiration by crops in
savannah farming systems in Sub-Sahara Africa (SSA) and asserts that on severely degraded
land this proportion could be as small as 5%. Thus, crop failures usually blamed on drought
might be preventable in most instances through better farm-level water management like
Green Water (GW) management. In SSA, regardless of the fact that food production has to
double to keep up with demand, per capita food production continues to decrease. This has
been largely attributed to the negative effects of soil and water degradation. According to the
FAO (2008), 17% of SSA’s land productivity is negatively affected by soil and water
degradation.
Soil and water degradation is a severe problem and its control has turned out to be a major
current and future challenge (Brady & Weil, 2008). Kenya is no exception to these soil and
water problems. According to the WRMA (2009), soil and water degradation is causing
increased runoff, flash flooding, reduced infiltration, soil erosion, and siltation which tend to
undermine the limited water resource base of the country. The report further states that the
main causes of such degradation include poor farming methods (low rates of adoption of
SWC on farms), population pressure (forest excision for resettlement) and deforestation (for
agricultural land and fire wood). With these pertaining issues, surface water quality and its
availability is invariably affected as rivers and reservoirs dry up.
The current chronic water problem in Kenya is due, a large extent, to vulnerability of its
water resources to anthropogenic impact and to some extent to centralized systems and non
performing institutions (WRMA, 2009). With a rising population (currently growing at 3%
per annum) and large spatio-temporal variation in water supply, Kenya is characterized as a
water scarce country with 647 m3/capita/annum (WRMA, 2009), much less than the globally
recommended 1000 m3/capita/annum. Severely affected by catchment degradation include
electricity production, domestic and irrigation water supply, and rain-fed crop production. It

2
is estimated that about 75% of the Kenyan population are either directly or indirectly
dependent upon agriculture, which makes up 24% of Kenya's GDP (Gross Domestic
Product). Soil erosion, specifically, is a hidden cost to this development. While farmers are
aware of soil and water degradation, its indicators, and the linked soil and water quality loss
(Tenege, 1992), they are handicapped when it comes to solutions to these problems.
In Kenya, especially in the Upper Tana catchment, many Soil and Water Conservation
(SWC) technologies (applicable to GW management) are available to farmers. However, in
Porras et al. (2007), it is established that SWC efforts have diminished in the last 20 years.
This is attributed to lack of stimulus on the part of farmers and non-performing and/or
overlapping institutional structures. Most environmental damage remedies entail on-site
costs. As a result little or no voluntary adoption may be expected, assuming decision agents
(farmers) are profit maximizers. External incentives are usually required, in the form of
subsidies, penalties, cross-compliance or controls (Stonehouse & Bohl, 1990). Previous
research indicates that agriculture-related externalities are monetarily much greater than on-
farm resource degradation and environmental damage costs (Crosson, 1984; Clark et al.,
1985). To avert off-site damages it is therefore only logical that external beneficiaries of
farmers’ adoption of SWC measures compensate or subsidize farmers for the costs they incur
from adoption.
The Green Water Credits (GWC) project becomes noble in this regard. The International Soil
Reference and Information Centre (ISRIC) (supported by IFAD, SDC, and the Finnish
Development Aid) are pioneering GWC, which it describes as a market-based mechanism for
direct payment to upstream resource users in return for water management activities which
are presently un-recognized and unrewarded. Benefits to poor people drive this initiative
which, at the same time, safeguards water resources and food security for everyone (Zaks &
Monfreda, 2006). The upstream land and water management practices determine the flow of
water and sediment in both the upstream and the downstream areas of the catchment (Hunink
et al., 2010). This implies downstream users’ supply of water is highly dependent on
management practices in the upstream areas. The concept is that, if downstream users
pay/subsidise the upstream water managers (farmers and other land users) for the water-
management services, then the land users upstream will be better able to safeguard water
resources for everybody while providing the much needed diversification of rural livelihoods
(Porras et al., 2007). It offers an opportunity to address the issue of free-riding by external

3
beneficiaries while enhancing ecosystem services for both farmers and downstream
stakeholders (Figure 1).
Figure 1: Green Water Credits mechanism
Source: GWC Policy Brief, 2007.
Payment to farmers by downstream users is an opportunity to improve GW management,
while alleviating poverty and ensuring the flow of ecosystem goods and services (flood
control and healthy soil) in the Upper Tana catchment. GWC aims to create a market for
farmer’s water management activities in the catchment which are at present unrecognized and
unrewarded. Subsidizing the cost of modest on-farm measures like mulching, grass strips,
conservation tillage, and small-scale water harvesting can increase infiltration by as much as
2 to 3 fold thereby increasing GW required for plant growth (Zaks & Monfreda, 2006).
1.1 Problem statementThe Upper Tana catchment is a high potential area for agricultural and water resources.
However, it is characterized by catchment degradation (Figure 2) leading to higher and faster
runoff flows and minimal infiltration. The major issues within the Upper Tana catchment
include water scarcity, climate variability, river bank encroachment, soil erosion (gross
erosion rate of 20.3 ton/ha/yr), siltation, poor underground recharge, and competing needs
targeting scarce water resources (WRMA, 2009). Most of these problems also pertain to Saba
Saba, a sub-catchment of the Upper Tana catchment. The sub-catchment suffers greatly from
destruction of surface cover, high rates of erosion, and massive sedimentation (with sediment
concentration of 800 mg/litre) coupled with low adoption of SWC measures (Saba Saba
WRUA & WRMA, 2010). This has resulted in reduced recharge, increased surface runoff
and soil erosion. The Saba Saba is a target area for improved management of water, soil,

4
crops, trees, and rangeland in the GWC project and has been marked “ALARM” (alarm
phase) by the Water Resource Management Authority (WRMA-Embu) (Figure 2). This is
due to poor water quality, low water flows during dry spells, conflicts within the system due
to poor distribution of the resource, and encroachment of wetlands and riparian areas among
other reasons (Saba Saba WRUA & WRMA, 2009).
Figure 2: A farm in Saba Saba sub-catchment divided in two by erosionSource: Fieldwork, 2011.
There has been substantial resource allocation to SWC from the late 90s until today by
governmental agencies (e.g. WRMA, NEMA, MOA, etc) and multilateral organizations (e.g.
World Bank, IFAD, etc.) but SWC techniques remain underutilized in this area for several
reasons. Lack of profitability (negative net welfare) at the farm level transpires to be the
principal (considering farmers’ objectives and opportunity cost) though by no means the only
important reason for underutilization (Stonehouse, 1995). Other reasons could be that farmers
do not recognize the losses caused by soil erosion and/or that recommended SWC techniques
are not effective (de Graaff et al., 2001). The question then is whether the benefit of a given
SWC technique is worth the cost. This is where it becomes imperative for stakeholders to
understand the financial costs and benefits associated with adopting SWC measures (such as
Bench Terraces, Contour Bunds, and Napier Grass Strips) and how effective these methods
are in solving the problem of soil and water degradation. This research sought to investigate
the net welfare associated with adopting SWC measures (using farm level data) and the
factors that could influence the continuity (from other stakeholders’ perspective) of the GWC
project in the Saba Saba sub-catchment of the Upper Tana River basin.

5
1.2 Objective of studyThis study is expected to contribute to the identification and qualification of SWC measures
applicable to green water conservation and to the GWC project in general. The main
objective of this research is to economically evaluate Bench Terraces (BT), Contour Bunds
(CB), and Napier Grass Strips (NGS) in terms of their cost and benefits and to discuss the
continuity of the GWC project in the Saba Saba sub-catchment of the Upper Tana River
basin.
1.3 Specific objectives To identify SWC technologies applicable to green water conservation
To discuss the probable factors/reason that influence the adoption of these
technologies
To investigate the on-site costs and benefits associated with the adoption of these
technologies and
To examine the continuity of the GWC project from other stakeholders’ perspective.
1.4 Research questions What are the currently used SWC technologies in the study area?
How applicable and effective are these SWC technologies in conservation of green
water?
What are the probable factors influencing the adoption of these technologies?
What are the costs and benefits associated with the adoption of these technologies?
From other stakeholders’ perspective, what factors could influence the continuity of
the GWC project?

6
2. Materials and research methodThis section describes the study area and discusses the concept of Cost Benefit Analysis
(CBA) in the evaluation of environmental remediation measures, which is the main focus of
this research (see research questions in section 1). The chapter also discusses the data
collection and analysis methods used in this study.
2.1 Profile of study area
2.1.1 LocationThe Upper Tana Catchment (Figure 2) falls approximately between the equator and 1 degree
south and between 36.5 degrees and 37.5 degrees east. It has a total area of 9,422 km2 and
among others include the catchments of the Thika (draining from the Aberdares), the Sagana
(primarily draining from the Aberdares), and the Thiba (draining from the Mount Kenya.
Administratively, it includes the districts of Embu (51% of the district), Muranga, Maragua,
Kirinyaga, Nyeri (72% of the district), Thika (45% of the district), and parts of Mbeere (42%
of the district), Machakos (20% of the district), and the greater Meru district (Meru south,
Mara, South Imenti, Central Imenti, and North Imenti). The area of interest for this study is a
sub-catchment found in Maragua. The Saba Saba sub-catchment is one of the sub-catchments
(the others are Chanya-north, Gura, Mathioya, Maragua, Upper Thika, and lower Chania) in
the Upper Tana catchment.
Saba Saba River (Figure 3) originates from Wakibugi in Mariira Sub-location in Kigumo and
drains into Sagana River at Mutabe. The River covers approximately 70 km from its source to
where it meets Sagana River covering an approximate area of 382 km2. Administratively, the
sub-catchment falls mostly within Maragua District and includes part of Thika and Machakos
Districts. Its elevation falls largely between 1300 m and 1800 m, with just the eastern limits
below a line of low hills from about 1200 m to 1300 m (Saba Saba WRUA & WRMA, 2010)

7
Figure 3: Map of Upper Tana River catchment Source: GWC (2010)
Figure 4: Map of Saba Saba sub-catchment Source: Saba Saba WRUA & WRMA, 2010.

8
2.1.2 Climate, rainfall, and drainageThe climate of the Upper Tana River catchment area is determined by two parameters. The
rainy seasons are a function of the movement of the inter-tropical convergence zone (ITCZ),
with the long rains occurring as the ITCZ moves south, and the short rains as it returns north.
However, rainfall, temperature, effective rainfall (total rainfall less evapo-transpiration), and
the length of growing seasons are all strongly influenced by altitude and topographic position.
Generally, rainfall increases with elevation as the rain bearing cloud formations are forced up
over the mountains. On the average, the catchment receives an annual rainfall of between 700
mm in Thika and 1600 mm in the upper most parts of the sub-catchment (Saba Saba WRUA
& WRMA, 2010). The area receives two rainy seasons, the long rains from March to May,
and short rains from October to December. The short rains tend to be secure. The temperature
is directly related to altitude, being low with increasing altitude. Temperature (evapo-
transpiration) is high in the lower altitudes creating semi-arid conditions (Saba Saba WRUA
& WRMA, 2010).
The Saba Saba sub-catchment contains two main drainage areas: the Saba Saba which drains
the north and centre of the sub-catchment and the Thaara which drains the south of the sub-
catchment. The Saba Saba has no major tributaries; Itherui is a small tributary which joins
from the north. By contrast the Thaara is joined by the Mutoho (which has many tributaries)
and which is the main drainage in the southern sub-catchment. The Thaara joins the Saba
Saba at the base of the escarpment. The rainfall pattern in the Saba Saba sub-catchment has
similar characteristics as the Upper Tana catchment in general.
2.1.3 Slope, soil and vegetation The slopes within the Saba Saba are modest compared to the other Aberdares catchments,
ranging between <2% and >50%, but with significant areas of lower slope (< 16%). In
Hunink et al. (2010) this sub-catchment is dominated by Nitisols with some Cambisols near
Thika. The available water capacity for this catchment ranges between 5% and 20% and the
rooting depth is between 61cm and 150 cm depending on the type of soil. The available water
content (plant extractable water) which is also a key soil hydrological property in determining
the water balance was found by Hunink et al. (2010) to be 9% for Nitisols and 14% for
Cambisols. From the land cover map in Hunink et al. (2010), the sub-catchment is mainly
covered by coffee, tea, and annual cropping with patches of mixed forest at the uppermost
and the lowermost parts.

9
2.1.4 Human populationThe Saba Saba sub-catchment has a human population of 164,689 (Table 1). Rural population
densities are relatively sparse (101 to 500 persons/km2) in the upper catchments where tea is
a major crop. Densities are maximal in the middle where coffee is a major farming enterprise
(501-1000 persons/km2) before dropping again in the lower catchment where subsistence
cropping and livestock are the major activities. The overall population density is about 430
persons/ km2.
Table 1: Population within the Saba Saba sub-catchment
Location Population (human)
Kigumo 25,000Kahumbu 19,524Gaichanjiru 9,715Muthithi 28,600Makuyu 30,000Kamahuha 24,350Kambiti 16,500Ichagaki 11,000Total 164,689
Source: Saba Saba WRUA and WRMA (2010)
2.1.5 Land use and economic activitiesSaba Saba sub-catchment is divided into three zones i.e. upper, middle, and lower. The land
within the sub catchment is mainly used for;
Agricultural purposes where cash crops like tea and coffee are grown in the upper
zone. In the middle zone a bit of coffee, horticulture and subsistence farming
(maize, cassava, beans, millet, and sorghum) is found whiles In the lower zone it is
mainly horticulture and subsistence farming.
Built-up areas (Settlements, commercial, social, and transport establishments)
Vegetative cover (forest, shrub, grass,) Bareland
The transport land use is exemplified by tarmac roads such as Saba Saba- Muranga road and
several all-weather, feeder and access roads including footpaths. Agriculture is the mainstay
of the economy within the catchment. The Saba Saba sub-catchment water resources serve
several coffee factories, industries and supplies towns within the sub-catchment with water.

10
2.1.6 Prevailing catchment issues and management strategiesAccording to the Saba Saba WRUA and WRMA (2010), the main water resource problems in
Saba Saba sub-catchment include:
Lack of awareness Corruption on water resource management Uneconomical use of water Encroachment of water bodies Water pollution Deforestation/degradation Soil erosion especially on hill slopes Inadequate water friendly trees High poverty levels Inadequate rainfall Increasing population
The prevailing attitude of watershed management in the study area is that fresh water will
always flow freely (Agwata, 2005). There is neither the urgency nor the incentive to institute
sustainable use of land and water. Economic pressure is intensifying the conversion of land
from forest to farming and farmers lack knowledge, incentives and recognition for their role
in the provision of water to rivers. This is inflicting heavy costs to downstream areas through
the siltation of reservoirs, damage to infrastructure and reduced flows during dry seasons
(NEMA, 2003). The above problems have severely hit farmers, institutions, water projects,
flora and fauna and the sub-catchment economy as a whole. Inadequate water within the sub-
catchment has impacted food security within the region as it has led to low levels of food
production (Saba Saba WRUA & WRMA, 2010). Drying up of rivers has led to loss of
aquatic life and drying of riparian vegetation exposing the land to various forms of
degradation. In order to address these problems, the Saba Saba Water Resource Users
Associations (WRUA) and Water Resource Management Authority (WRMA) believe there is
the need to adapt the integrated water resource management approach which calls for
constant collaboration with all relevant stakeholders. Some of the Strategies adopted by the
Saba Saba WRUA, WRMA, and the other stakeholders to solve the problems include:
Undertake training for farmers on appropriate farming methods e.g. Soil and water conservation measures
Improve water storage through dams and pans as well as roof water harvesting Sourcing for funds to improve water infrastructure. Planting of suitable trees in the farms to reduce soil erosion. Train farmers on integrated pest management Riparian land protection

11
River bank conservation – e.g. bamboo plantation/cover crops Conservation and protection of wet land areas.
One key management theme for Saba Saba WRUA and WRMA is to sub divide the sub-
catchment into zones for ease of management, conservation, control and regulation of the
water resource. This will help improve the capacity of the WRUA to provide the services
required to manage water resources within the sub catchment. Saba Saba WRUA falls within
the management unit 4BF. Saba Saba WRUA was formed in the year 2008 after community
sensitization by District Water Officer (DWO) together with WRMA and other key
stakeholders. The sensitization meetings brought together water users and stakeholders within
the sub-catchment which lead to the formation of the Saba Saba WRUA. Its formation was
targeted at addressing water and soil resource problems within Saba Saba sub-catchment. In
respect of this the Saba Saba WRUA acts as a lead agency in collaborative management of
water resources in Saba Saba sub-catchment. The Saba Saba WRUA has initiated registration
with the Registrar of societies. It has also initiated registration with WRMA to have a clear
mandate of managing the water resource in the sub-catchment.
One of the peculiarities of Saba Saba River is that it has a brown colour from source to outlet,
throughout the year (Figure 5a). The colour is assumed to be from sediment loading (Figure
5b) although there is no known justification. Two possible sediment sources are stream bank
erosion and erosion from hills in the mid to lower reaches of the river. The issue of sediment
load and source of sediment in the Saba Saba River is still very much unresolved and needs
further investigation.
Figure 5a: Saba Saba River Figure 5b: Silted Saba Saba River
Source: Fieldwork, 2011. Source: Fieldwork, 2011.

12
2.2 Cost Benefit AnalysisThe theoretical underpinning of CBA could be trace back to the theory of welfare economics
which developed along ‘marginalist’ revolution in microeconomic theory in the late 19th
century (Organization for Economic Co-operation and Development, 2006). This resulted in
Pigou’s Economics of Welfare in 1920 and the new welfare economics in the 1930s. Pigou’s
Economics of welfare further formalised the notion of the divergence of private and social
costs whilst the new welfare economics reconstructed welfare economics on the basis of
ordinal utility. However, theory and practice of CBA remained divergent until the late 1930s
onwards when it became imperative that costs and benefits from water-related investments be
compared (Organization for Economic Co-operation and Development, 2006). This
represents the beginning of the synthesis of new welfare economics (which is essentially
cost-benefit analysis) and practical decision-making.
CBA is a basic approach in neoclassical economics adapted by environmental economists for
the evaluation of net social or private welfare from environmental remediation/projects. It is
considered one of the basic postulates of applied welfare economics (Harberger, 1971).
There are many justifications for this, but according to Boardway (1974) the one that appeals
most to ‘objective’ economists is that aggregate monetary gains and losses measure the
efficiency of a project. If the aggregate is positive, it implies that the gainers could
compensate the losers and still be better off after the project is undertaken and vice versa.
CBA is mainly used to assess the monetary value of private and public sector investments.
According to the Organization for Economic Co-operation and Development (2006), the
essential theoretical foundations of CBA are: benefits are defined as increases in human
wellbeing (utility) and costs are reductions in human wellbeing. For a project to qualify on
cost benefit grounds its net benefits must exceed its net cost. According to de Graaff and
Kessler (2009), the eventual aim of CBA is a comparison between the present value of the
streams of benefits (positive effects) and the present value of all investment and recurrent
costs (negative effects). In a typical CBA, the costs of the inputs are assessed and compared
to the monetary estimates of total benefits that the project is expected to provide. The
evaluation process consists of several stages, each paying attention to such details as totalling
the benefits and costs accruing to different groups in different time periods.

13
CBA in the context of this research was employed to evaluate the on-site losses and gains
associated with adopting BT, CB, and NGS. The scale of the CBA in this study was farm
level and the objective was a financial analysis of the gains and losses from the adoption of
the three SWC measures. CBA is used as here as decision tool after computing all cost and
benefits valued in local currency to come up with a net welfare. Figure 6 presents a
framework which guides the measurement of the on-site net welfare associated with
technology adoption.
Figure 6: Net welfare measurement of adopting Soil and Water Conservationtechnologies
Source: Adapted from Stonehouse (1999).
To express the variables in this framework (Figure 6), the general sequence of analytical
steps in CBA as described by de Graaff and Kessler (2009) was adapted:
Evaluation criteria
The selected evaluation criterion for this study was the economic efficiency/viability measure
using CBA. A project that generates higher net benefits is more efficient than a project that
generates less or negative net benefits. This criterion was selected considering the main
objective of this research.
Identification of effects (costs and benefits)
This step involved the identification of economically relevant impacts. Here the question was
what to count. This question is bound up in new welfare economics, in particular in the
Increased crop yield Less damage bysoil erosion
Benefits
Establishment costs
Maintenance costs
Costs
Net welfare (private)
On-site

14
welfare function where the farmer is interested in maximizing profit. What are counted as
benefits in this study were increases in quantity of goods or a reduction in damages due to
soil erosion that generate positive welfare/utility. The costs include any decreases in quantity
of goods (e.g. decrease in yield). The negative effects also included using up resource (inputs
in production) in the project (establishment and maintenance investments).
The data from the agronomic survey was grouped in to benefits and costs. Costs included
labour inputs (MD), inputs for establishment and maintenance of each of the SWC measures
(BT, CB, and NGS), the net benefit in the without SWC situation and crop production cost.
The initial investment and annual maintenance costs constituted the cost on the labour and
materials inputs. The production costs include labour and materials required at the following
production stages: land preparation, planting, manuring, weeding, spraying if applicable,
composting if applicable, fertilization if applicable, harvesting, and threshing and
transportation. In this study maize, coffee, and tea were the crops considered. These are the
main crops and were mostly grown on the slopes targeted by this research. To establish costs
of soil erosion and the benefits of conservation, Tenge et al. (2005) and Pimentel et al. (1995)
argue that erosion damage could be considered to be equal to the value of the lost crop
production valued at market prices. This is comparable to the ‘with and without’ approach
used in this study to ascertain the costs associated with soil erosion and the benefits that could
accrue due to the adoption of SWC measures. Based on farmer interviews, key informants,
and literature (FAO SAFR, 2002; Tenge et al. 2005) an annual productivity decline (due to
soil erosion and in a without SWC case) of 3%, 2%, 1% were assumed for maize, coffee, and
tea respectively.
Benefits in this research refer higher gross margins. This was assumed to be due to the
increased revenue and less damage by erosion (Figure 6), holding other factors constant. The
major benefit of all the conservation measures considered in this analysis is the saved yield
due to reduction in soil erosion. Therefore the tangible benefit from these technologies is the
conserved amount of maize, coffee (berries), or green leaf tea yield multiplied by their
respective unit price during the entire period. The impact of SWC techniques on the
prevention of seed loss through soil erosion, retention of soil moisture, nutrients, and water is
an increase in crop yields and other outputs such as fodder for the livestock that the farmer
keeps. From field observations most farms were stabilized with grass risers which also served
as fodder for their livestock. This study considered maximum crop yield attained to be
15
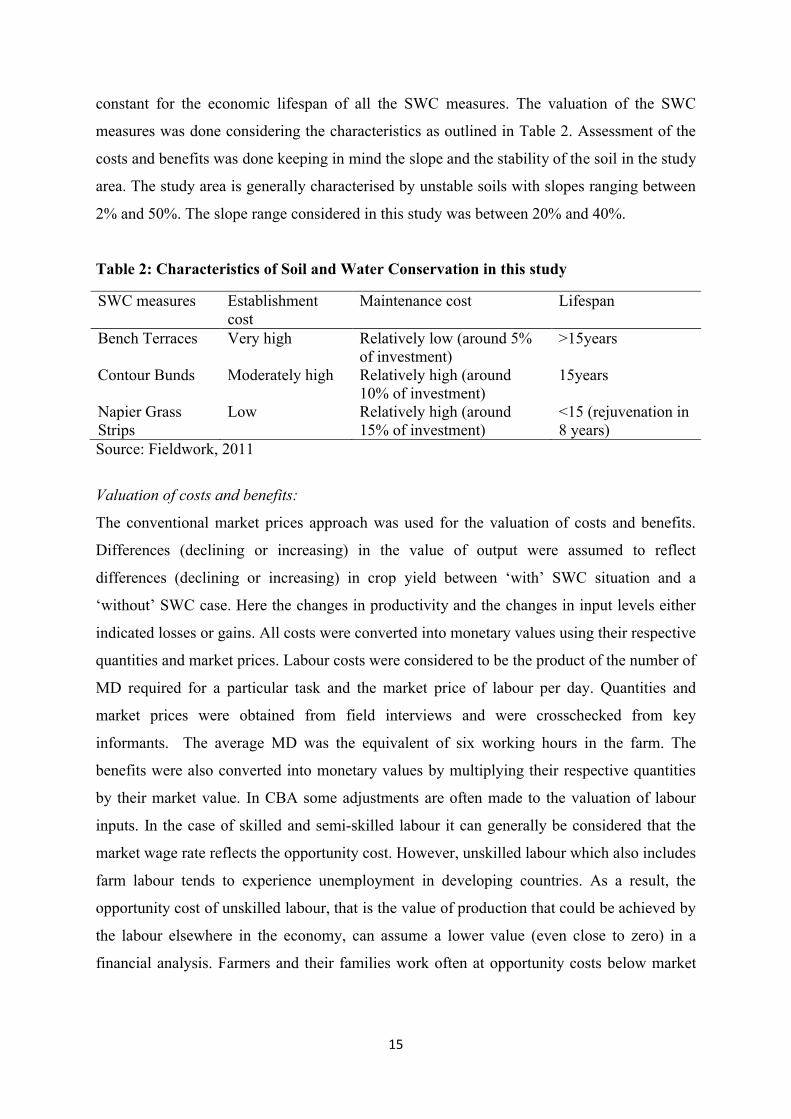
constant for the economic lifespan of all the SWC measures. The valuation of the SWC
measures was done considering the characteristics as outlined in Table 2. Assessment of the
costs and benefits was done keeping in mind the slope and the stability of the soil in the study
area. The study area is generally characterised by unstable soils with slopes ranging between
2% and 50%. The slope range considered in this study was between 20% and 40%.
Table 2: Characteristics of Soil and Water Conservation in this study
SWC measures Establishment cost
Maintenance cost Lifespan
Bench Terraces Very high Relatively low (around 5% of investment)
>15years
Contour Bunds Moderately high Relatively high (around 10% of investment)
15years
Napier Grass Strips
Low Relatively high (around 15% of investment)
<15 (rejuvenation in 8 years)
Source: Fieldwork, 2011
Valuation of costs and benefits:
The conventional market prices approach was used for the valuation of costs and benefits.
Differences (declining or increasing) in the value of output were assumed to reflect
differences (declining or increasing) in crop yield between ‘with’ SWC situation and a
‘without’ SWC case. Here the changes in productivity and the changes in input levels either
indicated losses or gains. All costs were converted into monetary values using their respective
quantities and market prices. Labour costs were considered to be the product of the number of
MD required for a particular task and the market price of labour per day. Quantities and
market prices were obtained from field interviews and were crosschecked from key
informants. The average MD was the equivalent of six working hours in the farm. The
benefits were also converted into monetary values by multiplying their respective quantities
by their market value. In CBA some adjustments are often made to the valuation of labour
inputs. In the case of skilled and semi-skilled labour it can generally be considered that the
market wage rate reflects the opportunity cost. However, unskilled labour which also includes
farm labour tends to experience unemployment in developing countries. As a result, the
opportunity cost of unskilled labour, that is the value of production that could be achieved by
the labour elsewhere in the economy, can assume a lower value (even close to zero) in a
financial analysis. Farmers and their families work often at opportunity costs below market
16
wages. In a financial analysis use is made of the market prices (local wages) and/or of break-
even opportunity costs of labour. In this analysis use was made of the local market wages.
Time horizon and discounting
The study considered the physical lifespan of the investment in SWC from the perspective of
the farmers. The lifespan for BT for instance is, in general considered to be between 25 to 30
years but the average lifespan, as given by the farmers was 15 years implying that they
reinvested (rejuvenation) every 15years (Table 2). The discounting of future costs and
benefits to their present values was done using 8.5% discount rate (10%, and 12% for
sensitivity analysis). These discount rates represented the changes in the interest rates at
which farmers were given credits in the last major season of 2010 to the end of the minor
season of 2010. These discount rates were based on average interest rates from key financial
institutions in the Embu and Muranga Districts.
Appraisal indicator
The Net Present Value (NPV) and the Internal Rate of Return (IRR) are the main appraisal
indicators used in this analysis though the Benefit Cost ratio (B/C ratio) is also shown just for
comparison purposes. These are the commonly used decision criteria for determining
profitability of a project (Kuyvenhoven & Mennes, 1989). The NPV is defined as the present
worth of the net benefits of a project. In financial analysis, it is considered to be the present
value of the net income stream accruing to the entity undertaking the project. In this research
SWC measures with NPV equals to or greater than zero is considered profitable and
economically robust to farmers. In FAO SAFR (2002) this is mathematically expressed as
(equation 1):
NPV=∑ (Bt-Ct) / (1+i)t > 0 equation 1
where Bt is the gross benefits, Ct the total cost, t is the time horizon, and ‘i’ is the discountrate (conceptually it is the discount rate but during calculation the interest rate is taken).
The Internal Rate of Return (IRR) is the discount rate at which the total discounted cash
benefits expected from a project equal the total discounted cash costs required by the
investments (FAO SAFR, 2002). The IRR can also be described as the rate of growth of an
investment which is also comparable to the opportunity cost of capital or the borrowing rate
of financing the project. When the IRR is greater than the discount rate, then the investment
is worthwhile. The IRR in this study was generated in Microsoft Excel using the IRR

17
financial function. Without excel, IRR could also be calculated manually using the following
formula (equation 2) which is more of a trial and error method (FAO SAFR, 2002):
IRR = ldr + (hdr - ldr) x NPV at ldr (NPV at ldr - NPV at hdr)where:
IRR = Internal Rate of Return
hdr = higher discount rate
ldr = lower discount rate
NPV = Net Present Value
Sensitivity analysis
The ability of each SWC measure to withstand changes in economic conditions is analysed
using the CBA results under different discount rates and market wages of labour. This was
done because of the impact these parameters have on investment decisions of farmers.
2.3 Data collection and analysisData were collected and analysed to answer the following research questions: What are the
currently used SWC technologies in the study area? How applicable and effective are these
SWC technologies in conservation of green water? What are the probable factors influencing
the adoption of these technologies? What are the costs and benefits associated with the
adoption of these technologies? From other stakeholders’ perspective, what factors could
influence the continuity of the GWC mechanism?
Desk research (literature and database reviews)
The first two research questions (see section 1.4) are discussed using information and data
from desk research on SWC technology adoption in semi-arid and sub-humid regions. Not
much research (on SWC) is done on the Saba Saba sub-catchment so it was difficult getting
much information to discuss these questions in the context of the Saba Saba sub-catchment.
In fact there was no published document on SWC measures in the sub-catchment and
unpublished documents used information collated from the Saba Saba Water Resource Users
Associations (WRUA) executive members. As a result information from unpublished
literature (documents) was complemented with information from field observations, and
informal discussions with WRUA executives during the reconnaissance visits to the study
equation 2

18
area. The WOCAT database (WOCAT, 2002) was also consulted specifically for information
regarding the classification and effectiveness of the SWC measures.
Fieldwork The unit of analysis in this study was heads of households who are farmers with or without
BT, CB, or NGS on their farms and who had farms on slopes between 20% and 40% with
unstable soils. The choice of SWC measures was based on popularity of the measure. During
discussions with WRMA officials and Saba Saba WRUA executives (Figure 7) it was
established that BT, CB, and NGS were the most preferred and popular in the sub-catchment.
In total seventy five farmers were interviewed (Table 3). This figure was purposefully
selected considering the fact that detailed information was needed for the CBA and the time
frame for the fieldwork was short. The Saba Saba sub-catchment is divided into upper,
middle, and lower and further subdivided into locations (Table 4). Based on these divisions
and locations the fieldwork was structured in a way that information or data sought would be
representative of the sub-catchment. With the help of the Saba Saba WRUA executives, 30,
25, and 20 respondents were selected from the lower Saba Saba sub-catchment (which is the
biggest of the divisions), middle and upper respectively (Table 3). But the data was later
grouped by crop type and SWC type as summarized in the Table 4.
Figure 7: Informal discussions with WRMA officers and Saba Saba WRUA executivesSource: Fieldwork, 2011.

19
Table 3: Respondents by Divisions and Locations Division Locations Sample sizeUpper Saba saba Marriira, Kariua, and Kigumo east 20
Middle Saba saba Muthithi, Kahumbu, and Gaichanjiru 25
Lower Saba saba
Total
Kamahaha, Kambiti, and part of Makuyu 30
75 Source: Fieldwork, 2011.
Table 4 : Respondents by Soil and Water Conservation and crop type
Crops\SWC Terraces Contour Bunds
Napier Grass Strips
Without SWC
Total
Maize 7 9 6 7 29Coffee 21 7 0 5 33
Tea 11 0 0 2 13Total 39 16 6 14 75
Source: Fieldwork, 2011.
Two data collection techniques were used in this study: in-depth interviews among specific
stakeholders (large farmer enterprises) and an agro-economic survey among small holder
farmers.
In-depth interviews
The In-depth Interviews (IDIs) solicited information from stakeholders other than farmers to
facilitate the discussion on the continuity of the GWC project, the role they were willing to
play in environmental remediation upstream and the gains and losses they could incur
participating or not participating in payment for environmental services. The targeted
stakeholders for the in-depth interviews were Del Monte Ltd, Kakuzi Ltd, National Irrigation
Board, Nairobi Water and Sewerage company Ltd, Kengen (Kenya electricity), and Tana and
Athi River Development Authority (TARDA). However due to tight schedules on the part of
some of the stakeholders only Del Monte Ltd and Kakuzi Ltd were interviewed. Results from
the IDIs are discussed in section 3.5 of this report.
Farm Survey
An agronomic survey was conducted on selected farms. A survey questionnaire was
administered to selected farmers within the Saba Saba sub-catchment (Figure 8). Data on the

20
following farm level issues were elicited from smallholder farmers within the sub-catchment:
household characteristics and labour resources; farm land characteristics; crop yield and
prices; crop production (i.e. investments on crop production), farmers’ knowledge of soil
erosion; and soil and water conservation practices (investments in SWC). The survey
obtained the necessary quantitative data for the CBA. The CBA aided the discussion on the
costs and benefits associated with the adoption of BT, CB, or NGS.
Figure 8: Survey session with a female respondent Source: Fieldwork, 2011.
Data processing and analysis
Data solicited from farmers were first coded and then analysed using SPSS version 17 and
Microsoft Excel 2007 version. The SPSS was used for the tabulation of frequencies whilst
Excel was used for the CBA. The data was first processed in SPSS to obtain frequencies of
farmers’ socio-demographic characteristics, farm characteristics, and average values needed
for the CBA in excel. The average values of costs and benefits, using the financial functions
in Excel, were analysed to obtain the gross margins, net welfare (NPV), IRR, and cost benefit
ratio for the various SWC measures (Appendix 2).

21
3. Results and discussion
3.1 Characteristics of smallholder farmers in Saba Saba sub-catchmentThe basic characteristics of farmers and their farms are presented in Table 5. It gives an
overview of the characteristics of the respondents in this study. The top horizontal part of
Table 5 gives the distribution of smallholder farmers among the three SWC measures chosen
for this research. Table 5 indicates that majority of respondents used BT and the least adopted
SWC measure was NGS. The uneven distribution of respondents among SWC measures is
because the survey was done on the basis of the divisions and locations in the sub-catchment
and not according to SWC technologies.
Table 5: Household and farm characteristic (mean values)
Variables BTN=39
CBN=16
NGSN= 6
Without SWCN=14
Household CharacteristicsHousehold size (persons)Age (year)Gender Male Female
Level of Education Primary Secondary Tertiary None
Farming experience (year)*
5.253
6931
42251320
30
5.352
5644
40150837
23
4.652
570.4
0.40.10.060.4
19
3.249
4555
21070072
17
Farm CharacteristicsFarm size (ha)Soil texture Sandy loam Clay loamFertility Status Low Medium High
2.4
5644
226018
1.1
6238
375112
0.6
5545
573508
0.6
5743
742600
Source: Data analysis, 2011.*Number of years in farming, CB=Contour Bunds, NGS=Napier Grass Strip, N= number of respondents

22
Farm household size
Household in this study refers to individuals living in the same dwelling. That is a basic
residential unit in which economic production, consumption, inheritance, and child rearing,
and shelter are organized and carried out. The household may or may not be synonymous
with family. The household size of those who invested in SWC measures was significantly
larger than those who did not adopt any measure (Table 5). In rain-fed agriculture, much of
farm work is done with family labour as a result the size of a family to some extent relates
directly to the availability of farm labour. For instance with Bench Terraces, Juma, et al.
(2009) found in the semi-arid lands of Kenya that a marginal increase in household
membership increased the probability that the household will adopt terracing as a means of
soil conserving and conditioning effort. This is not surprising because terracing is labour-
intensive and would favour larger households. Therefore, when households rely on family
labour, as in the Saba Saba, a larger household becomes an obvious positive factor in the
adoption of terrace adoption. The table shows that the average household size for those with
SWC measures is larger than those without SWC measures. This could imply that those who
adopted SWC measures had access to more family labour than those without.
Age and Gender
This study considers only the age and gender of the household heads, which in Kenya have a
paternalistic culture and make major decisions (including farming decisions) within the
household set up. In Table 5, household heads who invested in SWC measures, on the
average were older than those who did not. Many researchers agree that the age of a
household head may have an ambiguous influence on the adoption of SWC technologies.
Younger generations, as compared to older ones, may be more inclined to adopt new
techniques as they learned these from school and might even have a longer time horizon.
They have more understanding of soil erosion problems and thus might have more interest in
SWC. However older farmers may also have gained more knowledge through their actual
experiences in farming and thus become knowledgeable in handling soil erosion problems.
Further older farmers may have saved and are more motivated to leave something of lasting
value to their children, hence may invest in more long term asserts such as BT.
From Table 5, more male heads households adopted SWC measures while females dominated
the without case. Males have a higher chance of adopting soil conserving measures compared
to their female counterparts. This is perhaps because smallholder agriculture in the study area

23
is dominated by men and probably because men control more resources and therefore male-
headed households have a better chance to invest in SWC measures.
Education
There are three levels of education existing in the study area. These are taken in succession:
eight years of primary education, four years of secondary, and four years of tertiary
education. For education, Pender and Kerr (1998) observed in the semi-arid areas of India
that investment in SWC technologies increased by 25% of the average investment level for
every additional year of education. From Table 5, 20%, 37%, and 43% of the respondents
who invested in BT, CB, and NGS respectively, had no formal education as compared to the
72% for the group without SWC measures. From informal discussions with key informants,
better-educated households have more realistic perceptions about soil erosion problems and
more knowledge related to SWC and hence can more easily be involved in conservation
activities. From the discussions, it was intimated that farmers around lower Saba Saba sub-
catchment were better educated than upstream farmers because the downstream area is closer
to Muranga and Maragua, where more schools are available. If this assertion holds, then
education does not positively influence the adoption of SWC measures as argued in literature.
The downstream portions of the Saba Saba sub-catchment are the most affected by soil
erosion and the farmers are less inclined to SWC adoption.
Farming experience
By farming experience the study refers to the number of years a household head has been in
farming. The average number of years of farming experience for farmers with BT was 30
years followed by farmers with CB (23 years). Farmers who adopted NGS had on the average
19 years of farming experience while farmers without any SWC measure had lesser
experience (16 years). Looking at this trend, it could be said that the more experienced a
farmer is the more likely it is for him/her to adopt longer lasting techniques like BT.
Average farm size
Average parcel size in this study reflects the amount of landholding that a farmer could use as
an input in production. In this study the average farm size for farms with BT was 2.4 hectares
followed by farms with contour bunds (1.13ha). It has been argued in several literature that
the larger the landholding of a farmer the more likely it is for he/she to invest in SWC
technologies especially for structural measures (Dellink & Ruijs, 2008; Mengstie, 2009;

24
Semgalawe, 1998). This is usually because farmers with relatively larger landholdings can
spare land areas for such SWC measures.
Soil texture and Fertility status
With to soil texture in the Saba Saba sub-catchment, the proportion of farm lands with sandy
loam soils was higher under all farms with SWC measures and the without SWC measure
category. Farm land fertility was classified into three categories: low, medium and high.
From table 5, majority of farmers who used BT (60%) had soils of medium fertility while
72% of those who did not invest in any SWC measure reported low fertility. The farmers
examined/categorized the fertility of their farms considering the yield holding other
influencing factors constant. Farmers want to take better care of fields that give better yield
(Dellink & Ruijs, 2008) and this could be an explanation why fields with SWC technologies
have better soils than fields without SWC measures.
3.2 Soil and Water Conservation technologies applicable to Green Water conservation
Soil erosion, as defined by de Roo (1993), is the removal of soil by forces of nature more
rapidly than various soil-forming processes can replace it. One of the major consequences of
soil erosion is the reduced ability of cultivating possibilities on such farms and the
sedimentation of rivers, streams and dams. To reduce soil erosion to its bearable levels
farmers have been encouraged over the years to adopt SWC measures. According to Morgan
(2005), the aim of these measures is to reduce erosion to levels where unacceptable
environmental damages could be avoided. This implies reducing soil erosion to the soil loss
tolerance (limits up to which soil loss rate is acceptable) where the impacts are kept under
control, making sure land productive capacity is not exhausted.
In Figueiredo and Fonseca (2009), a conservation measure intended to reduce soil erosion
and increase green water should be:
Adequate (i.e. focused on the problems and processes identified)
Effective (i.e. able to control the problems as predicted)
Integrated (i.e. part of the activities regularly practiced)
Feasible (i.e. account for local labour and economic conditions)
Accepted (i.e. perceived as an improvement)

25
The above list implies that the selection of a conservation measure (by GWC for e.g.) should
be a very locally oriented procedure but the procedure must be informed by the principles
listed above. The adequacy and effectiveness of the measure constitute the technical aspect of
SWC while integration, feasibility, and acceptability form the socio-economic part.
Figueiredo and Fonseca (2009) argue that even though it should always start from the
technical part, in no way should socio-economic issues be kept apart when considering the
promotion of SWC measures and their implementation.
Soil and Water Conservation measures adopted by smallholder farmers in the Saba Saba sub-
catchment include Bench Terraces, Contour Bunds, Napier Grass Strips, Funya Juu, Cut-off
Drains and Mulching. From key informant interviews and field observations, these measures
constituted about 90% of the types of SWC measures used in the sub-catchment. Bench
Terraces (Figure 9), Contour Bunds (Figure 11), and Napier Grass Strips (Figure 10) were the
top three popular measures in the catchment and as a result were investigated for the purposes
of this research. The selected SWC measures, the bases of WOCAT (2002) categorization,
are classified under structural measures (Bench Terraces and Contour Bunds) and vegetative
measures (Napier Grass Strips). WOCAT (2002) categorization considers the object and the
material focus of the measures as a criterion. They categorize SWC measures into:
Agronomic measures (Management measures)
Vegetative measures
Structural measures
Figure 9: Coffee farm with Bench Terraces (BT) Source: Fieldwork, 2011.

26
Figure 10: Maize farm with Napier Grass Strips Source: Fieldwork, 2011.
Figure 11: Schematic diagram of Contour Bunds
The agronomic measures (e.g. manuring/composting, mixed cropping, contour cultivation,
mulching, etc) are associated with annual crops and are mostly repeated routinely each season
or in a rotational sequence. They do not change/affect slope profile and are normally
independent of the slope. Morgan (2005) argues that preference is always given to agronomic
measures because they are less expensive and deal directly with reducing raindrop impact,
increase infiltration (increased Green Water), reducing run-off volume, and decreasing water
velocity. These measures are more easily fitted in to existing farming systems and more
relevant to maintaining or restoring biodiversity. However, the effectiveness of agronomic
measures depends on the steepness of the slope on which cultivation is done. On steep and
very steep slopes, these measures are not adequate and effective in GW conservation without

27
structural measures. It is important to state here that for financial assessment of annual
recurrent agronomic measures gross margins or partial budget analysis is used and not CBA.
Vegetative measures (e.g. Napier Grass Strips) account for improvement in soil surface
protection by plants. These measures, for increased soil moisture, are beneficial only on
gentle to moderate slopes. Napier Grass Strips involve the use of perennial grasses, and are of
relatively short lifespan. It reduces the erosive power of runoff and as a result helps to
increase the actual water intake of the soil. They often change the slope profile and are often
aligned along the contour and are spaced according to the slope. They have relatively a low
establishment cost with relatively high maintenance cost and require reinvestment in every
six to eight years (taking into consideration the quality of establishment) (Table 2). Alone,
NGSs are not so effective on steep slopes (with unstable soils) as found in the study area.
Structural/mechanical measures such as Bench Terraces Funya Juu, Cut-off Drains, and
Contour Bunds are meant to control runoff generation and distribution along slopes (usually
moderate to very steep slopes) and to minimize its erosive power. They often lead to change
in soil profile and have long lifespan (>15 years). Bench Terraces are costly to establish
(Figure 6). They require substantial inputs in labour and/or money when first installed and
involves major earth movement. Bench Terraces sometimes create difficulties for farmers.
Unless the soils are deep, terrace construction exposes the less fertile sub-soils and may
therefore result in lower crop yields (Morgan, 2005) at least in the first years. On irregular
slopes, terraces will vary in width, making for inefficient use of farm machinery, and only
where slopes are straight in plan can this problem be overcome with parallel terrace layouts.
Further, there is a risk of terrace failure in severe storms when no proper water ways are
established. When this occurs, the sudden release of water ponded up on the hillside can do
more damage than if no terraces had been constructed. All these reasons, coupled with loss of
cultivable area, make terracing often unpopular with farmers (smallholder farmers).
Like Bench Terraces, Funya Juu is also relatively expensive to construct since it involves
earth movement and require substantial labour input. However they enhance crop yield by
conserving more rain water and also last longer. The difference between Funya juu and
Contour Bunds is that with Funya Juu there is a ditch which helps in the retention/storage of
rain water. Compared to Bench Terraces and Funya Juu, Contour Bunds have lower costs. It
plays an important role in soil and water conservation in fields with medium slopes. They act

28
as water barriers during run-off and checks water velocity thereby increasing infiltration of
water into the soil. Like Bench Terraces, Contour Bunds are also affected by a loss of
cultivable land which sometimes makes it unpopular especially with smallholder farmers. It
is recommended that mechanical measures be only applied in areas with severe erosion risk
(Figueiredo & Fonseca 2009). Permanently gullied sites and steep cut slopes are also areas
(as found in the lower Saba Saba) that could be considered for the implementation of
mechanical SWC measures. In the context of the farms considered in the Saba Saba sub-
catchment, mechanical measures are the most appropriate (because of the steep cut slopes and
severe erosion risk) though they should be complemented with agronomic and/or vegetative
measures to improve soil moisture. For the financial assessment of long term vegetative and
structural investment CBA is applied.
From agronomic to structural measures (in the order as outlined above), there is an increase
in implementation complexity, regarding the level of change in conditions and practices, as
well as in the level of investment required for adoption. Again from the agronomic to the
structural, the number of processes controlled and the effectiveness of control achieved
increases. This is not only due to the effectiveness but also the imperative combination with
other measures from more than one of the categories. It is worth also mentioning that apart
from the effectiveness of a SWC measure, erosion risk severity also provides information on
where/when to use which type of measure. Conservation tillage for instance should be a
common practice on any land under any erosion risk severity. Contrary, only when erosion
risk is very severe should structural measures (e.g. Bench Terraces and Funya Juu) be applied
as these imply important changes in landscape, and the huge investment required to establish
it can only be justified under conditions of very severe erosion risk.
3.3 Factors influencing the adoption of Soil and Water Conservation technologies
According to Drechsel, et al. (2006) any attempt to analyse the adoption SWC technologies
should be situated within a social and economic understanding of the role of the technology
and the purpose of its design. Each SWC measure requires particular biophysical conditions
(e.g. slope, soil texture, soil depth, etc) which are generally well described in most SWC
manuals and could be easily verified. However, it becomes more complex from the socio-
economic perspective. Thus, the socio-economic factors in most cases are more limiting for
technology dissemination than bio-physical.
29
In general, adoption of conservation technologies is a function of personal, physical, socio-
economic, institutional and technological factors (Bewket, 2007; Kessler, 2006; Bekele &
Drake, 2003; Tenge, 2005; Mengstie, 2009). The most commonly cited personal factors are
age and educational status (Bewket, 2007), which have implications on the farmers’ level of
knowledge/perception of soil erosion and its consequences. The effect of age combines the
effects of farming experience and planning horizons (as discussed in section 3.1). The
physical factors of adoption, also discussed in section 3.1, include such field characteristics as
slope and soil texture, which have implications on vulnerability of fields to the soil erosion.
The socio-economic and institutional factors of adoption include family size, landholding
size, access to labour, and access to capital. The technological factor refers to the perceived
profitability of adopting technologies. It is important to mention that farmers’ decision on
whether or not to adopt cannot fully be explained by profitability. Some farmers will not
adopt SWC measures even when they perceive economic benefits from doing so. In this
instance non-rational and subjective aspects of human behaviour (self-motivation) could be
possible explanation (Kessler, 2006). Below, this study discusses some adoption factors in
relation to the Saba Saba sub-catchment.
Returns to Land and Labour
The main goal of farmers is to maximize returns on investment especially for those
production factors that are in short supply (e.g. credit) but are required for the implementation
of SWC technologies. As a result the choice of measure should also be determined by
production factor requirements of the SWC measure and the relative availability of these
production factors in the farm economy of the target groups (Olaleye, et al., 2006). As a
result, it is essential to also base the analysis of SWC adoption levels on local conditions and
farmers’ seasonal perspectives of factor scarcity. For instance, returns to labour (gross
margins/ man-day) and returns to land (gross margins per hectare) are critical but often
neglected variables. (Kabubo-Mariara et al., 2006). Table 6 illustrates an example from the
Saba Saba sub-catchment where BT increased maize yield, in the second year of BT
establishment, by 835 kg/ha based on 85 MD increase in labour input (increment due to the
establishment of BT) with a 5,821 KES higher return than without BT. The return to labour
was 85 KES higher than the market wage rate of labour (100 KES) with BT while without
BT it was below the market wage rate. Returns to labour and land are good indicators.

30
However, a consideration of non-financial factors is also required to understand the actual
and potential adoption of conservation technologies.
Table 6: Maize farms (on slopes 20% - 40%) with and without Bench Terraces
Yield (Kg/ha) Gross margin (return to land) (KES/ha)
Annual Labour required (MD)
Gross margin/manday(return to labour)KES/md
With BT 1,815 10,991 259 185Without BT 980 5,170 158 97Source: Fieldwork, 2011. 1 USD=80 KES
Capital and credit availability
All the smallholder farmers (14 respondents) who did not adopt any SWC method blamed
their inability to use these measures on pesa (money). This is understandable because most of
these farmers are unable to raise sufficient funds to invest in the technologies, probably
because of lack of capital, limited access to credit, or temporary cash flow problems. This
again has to do with funds to pay extra labour when the measures require activities during the
peak seasons. In this regard, national policies or formal institutions which support
smallholders with credits can be an important SWC adoption driver to overcome the
constraints to investment in SWC measures. Formal institutions, unlike the informal savings
and credit groups (who illegally inflate their lending rates) in the Saba Saba area have been
effective in assisting farmers with credit (from discussions with WRUA executives). It should
be stated, however, that the credit accessibility should be of great importance to both
promoters and adopters of SWC technologies since it has direct implication on adoption
decisions.
Opportunity cost
The labour opportunity cost reflects the potential return to labour which he/she could have
received if labour had been used for an existing alternative. In each case with SWC measure,
significantly higher labour input is required (though differences exist in labour requirements
among the SWC measures) than in the case without SWC (Table 6). This extra labour
requirement for the adoption of SWC measures is a big hurdle for families who are short of
labour unless they can pay for hired labour or can use the system of collective action. It is
often wrongly assumed that household’s own labour input is free. However, the amount of

31
farm work a self-employed farmer is willing to do depends on a range of factors which
include; the potential gain of doing extra work, off farm job opportunities, and the farmer’s
own motivation. Table 7 shows that 59% of farmers who did not adopt any SWC measures
also engaged in off farm jobs while only 25% of farmers who adopted BT engaged in off
farm jobs. This could imply that the more farmers engage in off farm income earning
activities, the less likely they are in adopting longer lasting SWC measures (or even the less
likely they are in adopting any SWC measure). Farmers tend to adopt more SWC measures
when there are limited alternative opportunities. These opportunity costs are important in any
analysis of SWC adoption since their omission could lead to wrong conclusions.
Table 7: Main occupation of farmers with and without Soil and Water Conservation (in %)
Main occupation Terraces(N=39)
Contour Bunds (N=16)
Napier Grass Strips (N=6)
Without SWC(N=14)
Farming 86 78 71 66Government employee 04 07 10 09Trading 10 15 19 25
% of farmers with off farm jobs 25 44 53 59
Source: Fieldwork, 2011
Farmers’ perception/knowledge of soil erosion
A farmer’s perception of the extent of a given problem may influence his/her decision on
possible solutions. The same applies to farmers’ preferences for certain technologies which
could be related real experience or perceived characteristics (Bewket, 2007). If a farmer
perceives of soil erosion as detrimental to crop production and sustainable agriculture, he/she
is relatively likely to undertake adoption of conservation measures. Table 8 presents farmers’
knowledge/perception of the erosion problems in the Saba Saba sub-catchment.

32
Table 8: Farmer’s perception of soil erosion
Perception of erosion Percentage of total respondents (%)
Do you perceive soil erosion as a problem in your farm?
Yes 96.0
No 04.0
If yes to the above question, what is the severity of the problem?
Severe 74.7
Moderate 21.5
Minor 03.8
What has been the trend of severity of soil erosion over the last 10 years?
Has become more severe 71.6
Has become less severe 18.4
No change 10.0
What are the major cause of soil erosion?*
Very steep slopes 50.7
Too much Rainfall 19.1
Unstable soils/loose soils 37.4
Runoff from upslope areas 07.8
Natural process 05.0
What is the extent of impact of soil erosion on crop yields?
Severe 63.6
Moderate 30.0
Has no effect 06.4
Can soil erosion be controlled?
Yes 94.7
No 05.3
What are the major off-site impacts of soil erosion?*
No noticeable effect 08.3
Water pollution 47.0
Siltation of dams and rivers 39.1
I don’t know 05.6
Source: Fieldwork, 2011. * Some of the totals do not add up to 100% because of multiple responses. For instance, 23.7% of respondents gave water pollution and siltation of dams and rivers as major off-site impacts of soil erosion.

33
Table 8 indicates that 96% of surveyed farmers agreed that soil erosion was a problem in
their own farm. With regards to the severity of the problem, 74.7% of respondents claimed it
was severe while only 3.8% said it was a minor problem. Concerning the cause of soil
erosion, many of farmers mentioned very steep slopes (50.7% of respondents) and
unstable/loose soils (37.4% of respondents) as the main causes. The majority of the
respondents (71.6%) also claimed that there has been an increasing trend in the severity of
soil erosion over the past 10 years while 10% said there has been no change in trend of
severity. The rest of the respondents (18.4%) believed soil erosion has become less severe
over the last 10 years. The farmers were also asked to rate the impact of soil erosion on crop
yields. Sixty three percent (63.6%) of the respondents said the impact on crop yield was
severe while 6.4% claimed soil erosion had no impact at all on crop yield.
Looking at the number of respondents who rated the impact of soil erosion on crop yields as
severe to the number who rated it as moderate (30% of farmers), it could be noted that the
interplay/interaction between soil erosion and decreasing crop yield is, to some extent, not
understood by farmers in the Saba Saba sub-catchment. Informal discussions with the farmers
on soil fertility revealed that there had been a decreasing trend in fertility levels of their
parcels; however most of them linked this to intensive cropping over the years. When asked
about the major off-site impact of soil erosion, many respondents mentioned water pollution
(47%) and siltation of dams and rivers (39.1%) as the possible impacts. Only 5.6% of farmers
were not aware of any consequences of soil erosion off their farm parcels. It could be
concluded that the farmers in the Saba Saba sub-catchment are aware of soil erosion and
believe it could be controlled (94.7% of farmers). Thus, low adoption rate of SWC, in most
cases, cannot be explained by a lack of awareness. This is a conclusion shared by most
literature (Tegene, 1992; Bewket, 2001; Bewket, 2007). It is imperative to state that having
the right perception about soil erosion is a necessary condition for SWC measure adoption
but not a sufficient determinant.
3.4 Financial costs and benefits from the adoption of Soil and Water Conservation
technologies
3.4.1 Establishment and maintenance cost
The establishment and maintenance cost of all three Soil and Water Conservation measures is
the product of the mandays and the market wage of labour per day. The time needed for the
establishment of SWC is very important because it influences farmers’ technology adoption

34
decisions. It is important to note that labour requirements for construction of SWC measures
increase with increasing slope and the level of stability of soil (Tenge et al. 2005). In the
context of this research, farms are situated on slopes between 20% and 40% with unstable
soils.
0
5000
10000
15000
20000
25000
30000
BT CB NGS
Esta
blis
hmen
t. &
Mai
nten
ance
Co
st (K
ES/h
a)
SWC measures
Establishment cost Maintenance cost
Figure 12: Establishment and maintenance costs of Bench Terraces, Contour Bunds, and Napier Grass Strips in the Saba saba catchment
Source: Data analysis, 2011.Note: 1 USD = 80 KES
Figure 12 presents the establishment and the maintenance cost associated with the adoption
of BT, CB, and NGS in the Saba Saba sub-catchment. As indicated in section two of this
report, BT are relatively expensive to construct (27,900 KES) but relatively cheaper (11% of
establishment cost) to maintain. According to Tenge et al., (2005), time needed to establish
BT ranges from 66 to 592 man-days per hectare (MD/ha) depending on the slope and stability
of the soil. In this study, based on farmer level data, 279 MD/ha (see Appendix 1a) is
required for the establishment of BT. On the average, a manday is valued at 100 KES (with
food provided) or 120 KES without food. NGS is the least expensive in terms of
establishment cost (4,200 KES) (also see appendix C) but is relatively the most expensive
(21% of establishment cost) to maintain. The time needed for NGS establishment is 42
MD/ha which falls within the range (7 to 59 MD/ha) established by Tenge et al. (2005). CB is
in between these two SWC measures, with 13,400 KES (see Appendix 1b) as the
establishment cost. Annual maintenance cost of CB accounts for about19% of the
establishment cost. According to FAO SAFR (2002), the annual maintenance costs of
technologies, if implemented properly, should range from 1.5% to 5% of implementation
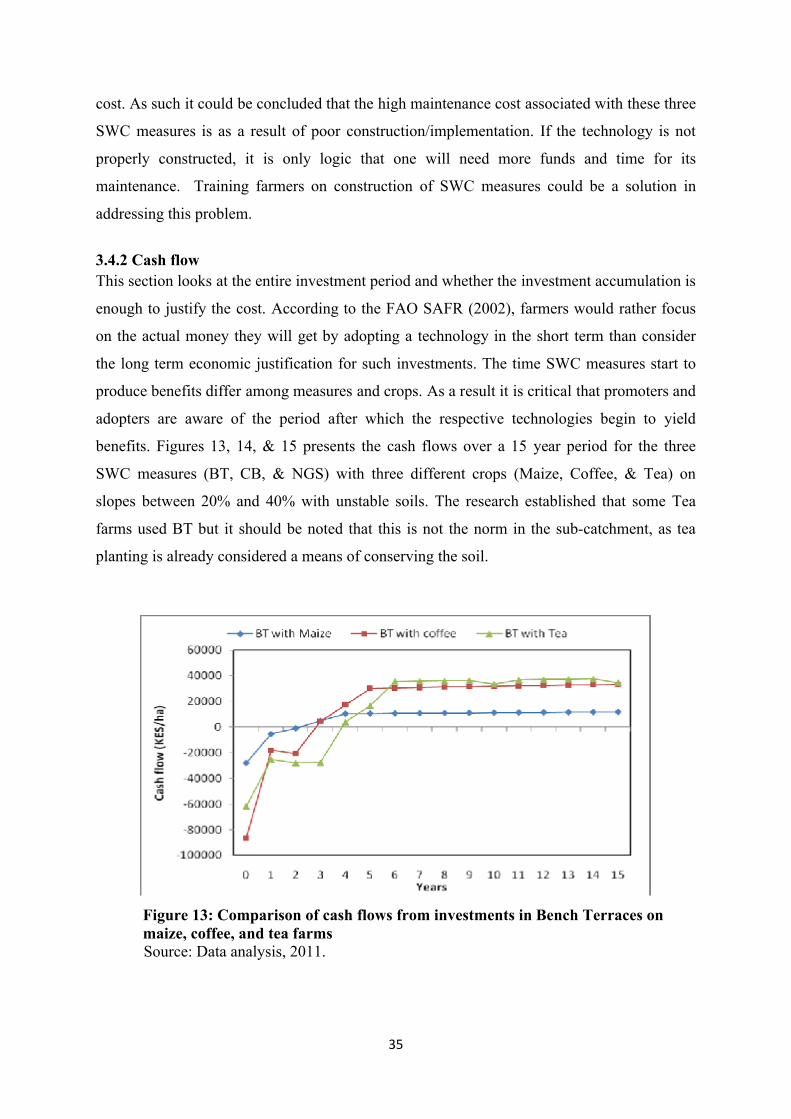
35
cost. As such it could be concluded that the high maintenance cost associated with these three
SWC measures is as a result of poor construction/implementation. If the technology is not
properly constructed, it is only logic that one will need more funds and time for its
maintenance. Training farmers on construction of SWC measures could be a solution in
addressing this problem.
3.4.2 Cash flowThis section looks at the entire investment period and whether the investment accumulation is
enough to justify the cost. According to the FAO SAFR (2002), farmers would rather focus
on the actual money they will get by adopting a technology in the short term than consider
the long term economic justification for such investments. The time SWC measures start to
produce benefits differ among measures and crops. As a result it is critical that promoters and
adopters are aware of the period after which the respective technologies begin to yield
benefits. Figures 13, 14, & 15 presents the cash flows over a 15 year period for the three
SWC measures (BT, CB, & NGS) with three different crops (Maize, Coffee, & Tea) on
slopes between 20% and 40% with unstable soils. The research established that some Tea
farms used BT but it should be noted that this is not the norm in the sub-catchment, as tea
planting is already considered a means of conserving the soil.
Figure 13: Comparison of cash flows from investments in Bench Terraces on maize, coffee, and tea farmsSource: Data analysis, 2011.
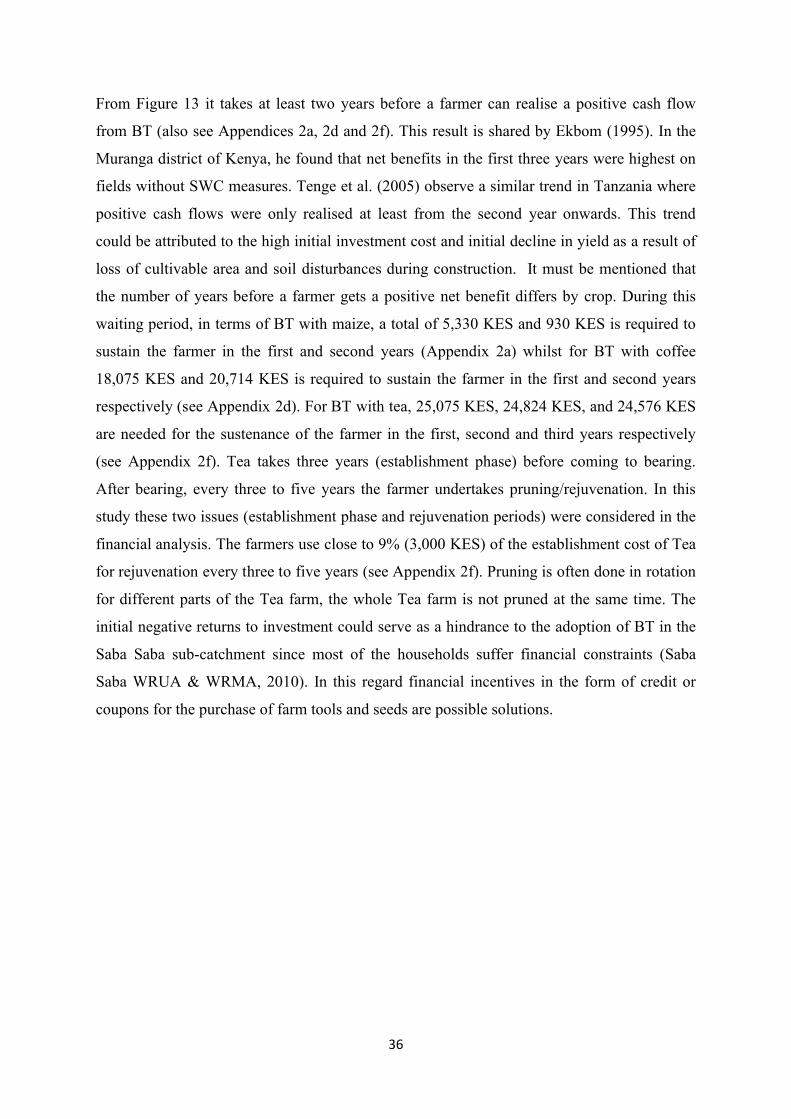
36
From Figure 13 it takes at least two years before a farmer can realise a positive cash flow
from BT (also see Appendices 2a, 2d and 2f). This result is shared by Ekbom (1995). In the
Muranga district of Kenya, he found that net benefits in the first three years were highest on
fields without SWC measures. Tenge et al. (2005) observe a similar trend in Tanzania where
positive cash flows were only realised at least from the second year onwards. This trend
could be attributed to the high initial investment cost and initial decline in yield as a result of
loss of cultivable area and soil disturbances during construction. It must be mentioned that
the number of years before a farmer gets a positive net benefit differs by crop. During this
waiting period, in terms of BT with maize, a total of 5,330 KES and 930 KES is required to
sustain the farmer in the first and second years (Appendix 2a) whilst for BT with coffee
18,075 KES and 20,714 KES is required to sustain the farmer in the first and second years
respectively (see Appendix 2d). For BT with tea, 25,075 KES, 24,824 KES, and 24,576 KES
are needed for the sustenance of the farmer in the first, second and third years respectively
(see Appendix 2f). Tea takes three years (establishment phase) before coming to bearing.
After bearing, every three to five years the farmer undertakes pruning/rejuvenation. In this
study these two issues (establishment phase and rejuvenation periods) were considered in the
financial analysis. The farmers use close to 9% (3,000 KES) of the establishment cost of Tea
for rejuvenation every three to five years (see Appendix 2f). Pruning is often done in rotation
for different parts of the Tea farm, the whole Tea farm is not pruned at the same time. The
initial negative returns to investment could serve as a hindrance to the adoption of BT in the
Saba Saba sub-catchment since most of the households suffer financial constraints (Saba
Saba WRUA & WRMA, 2010). In this regard financial incentives in the form of credit or
coupons for the purchase of farm tools and seeds are possible solutions.

37
Figure 14: Comparison of cash flows from investment in Contour Bunds onmaize and coffee farms
Source: Data analysis, 2011.
From Figure 14 coffee farmers who adopted CB only make positive net benefits in the fourth
year which implies that the farmer requires 18,075 KES, 20,414 KES, and 747 KES for
sustenance in the first to third years respectively (Appendix 2e). Unlike farmers who adopt
CB on their coffee farms, maize farmers with CB start to realise positive net benefits in the
third year of production. As a result they require an external source of sustenance for the first
two years of production. Maize farmers with CB require 5,330 KES and 1,866 KES
(Appendix 2b) in the first and second years respectively for sustenance. CB is not so
financially beneficial on maize farms (as compared to CB on coffee farms) in the Saba Saba
sub-catchment (Appendices 2b & 2e). Combined with NGS, CB did little in reducing soil
erosion in the middle and lower Saba Saba sub-catchment (from discussions with WRUA
executives). It was realized during fieldwork that CB was mainly found in areas with maize
and coffee (lower to middle Saba Saba sub-catchment). Erosion risk severity is relatively
higher in these parts than in the upper Saba Saba sub-catchment as such these farmers should
be encouraged to adopt combinations of SWC measures considering the fact that these areas
have relatively unstable soils and are on moderate to steep slopes.
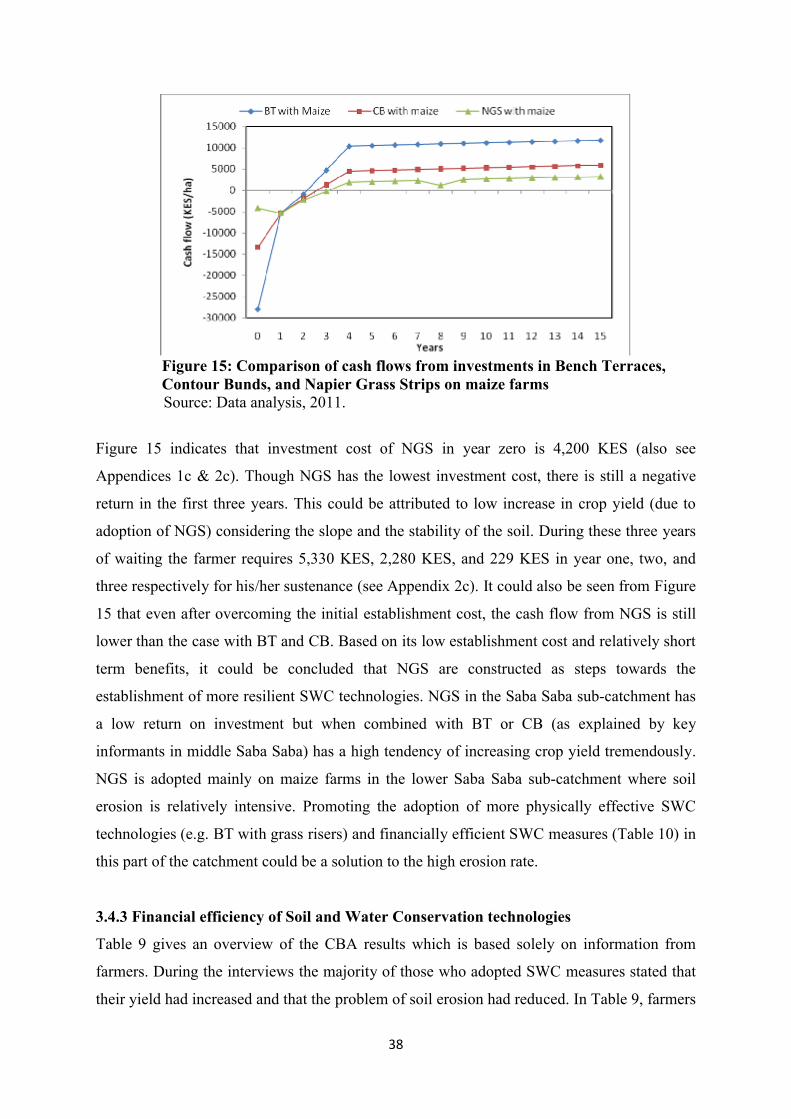
38
Figure 15: Comparison of cash flows from investments in Bench Terraces, Contour Bunds, and Napier Grass Strips on maize farms
Source: Data analysis, 2011.
Figure 15 indicates that investment cost of NGS in year zero is 4,200 KES (also see
Appendices 1c & 2c). Though NGS has the lowest investment cost, there is still a negative
return in the first three years. This could be attributed to low increase in crop yield (due to
adoption of NGS) considering the slope and the stability of the soil. During these three years
of waiting the farmer requires 5,330 KES, 2,280 KES, and 229 KES in year one, two, and
three respectively for his/her sustenance (see Appendix 2c). It could also be seen from Figure
15 that even after overcoming the initial establishment cost, the cash flow from NGS is still
lower than the case with BT and CB. Based on its low establishment cost and relatively short
term benefits, it could be concluded that NGS are constructed as steps towards the
establishment of more resilient SWC technologies. NGS in the Saba Saba sub-catchment has
a low return on investment but when combined with BT or CB (as explained by key
informants in middle Saba Saba) has a high tendency of increasing crop yield tremendously.
NGS is adopted mainly on maize farms in the lower Saba Saba sub-catchment where soil
erosion is relatively intensive. Promoting the adoption of more physically effective SWC
technologies (e.g. BT with grass risers) and financially efficient SWC measures (Table 10) in
this part of the catchment could be a solution to the high erosion rate.
3.4.3 Financial efficiency of Soil and Water Conservation technologies
Table 9 gives an overview of the CBA results which is based solely on information from
farmers. During the interviews the majority of those who adopted SWC measures stated that
their yield had increased and that the problem of soil erosion had reduced. In Table 9, farmers

39
in the Saba Saba sub-catchment could use four different financial indicators (separately or
combined) to inform their choice of SWC measure. These indicators include gross
margin/MD (see Appendices 1a to 1f), the NPV, the IRR, and the B/C ratio. For maize farms
on slopes 20% to 40% with unstable soils, the results indicate that the most financially
efficient option is BT (considering all four indicators). The less favourable option in this
regard is NGS. Considering the physical conditions of these farms, NGS is less capable of
ameliorating/reducing the impact of soil erosion and improving green water on its own,
unless used to complement other SWC measures.
For coffee farms with similar conditions, again BT is the most financially efficient measure.
It has relatively higher gross margin/MD (302 KES), NPV (53,600 KES), IRR (14%), and
B/C ratio (1.5) compared to CB on coffee farms which has lower values. Bench Terraces
profitability over CB and NGS in this analysis could be attributed to its huge influence on
crop yield especially on steep slopes with unstable soil (Table 6). BT has the highest internal
rate of return (on maize and coffee farms) which suggests that farmers who are able to adopt
BT stand a better chance of recovering their investments than with CB and NGS. Only a few
of the tea farms had a SWC measure and these few adopted BT with and without grass risers.
Tea is itself a cover crop which reduces the detachment effect of rain drops (but was not
considered in this study as a SWC measure). This could be the reason why most of the tea
farmers do not adopt SWC measures but rely on the canopy created by the tea plants.
Considering the decision criterion for NPV (33,608 KES), IRR (12%), and B/C (1.4), BT is a
financially viable for tea farmers (at 8.5% discount rate). Linking these results to the
framework in section two, in maize production, BT yields the highest net welfare considering
the existing conditions (erosion risk severity, slope, soil stability).

40
Table 9: An overview of gross margin and Cost Benefit Analysis
Crop type BT CB NGSMaize (kernel) *Gross Income
*Total cost *Gross margin*Gross margin/MD
54,45032,46921,981
185
41,64029,63112,009
152
33,84026,2597,581139
*NPV (8.5%) 33,188 10,156 2,077IRR 18% 13% 9%B/C (8.5%) 1.43 1.31 1.18
Coffee (Berries) *Gross Income*Total cost *Gross margin*Gross margin/MD
87,36037,55549,805
302
73,34434,71738,627
277*NPV (8.5%) 53,600 3679IRR 14% 9%B/C (8.5%) 1.49 1.04
Tea (green leaves) *Gross Income*Total cost *Gross margin*Gross margin/MD
103,52641,03762,489
242*NPV (8.5%) 33,608IRR 12%B/C (8.5%) 1.38
Source: Data analysis, 2011. Note: 1 USD = 80 KES (2010 rate). * All in KES
3.4.4 Sensitivity AnalysisSWC technologies like any other technologies are susceptible to changes in certain economic
variables/parameters. These changes have the tendency of directly or indirectly influencing
technology adoption and/or sustainability of an adopted measure. The World Bank (2006)
found that in both perfect and imperfect markets, interest rates (and implicit discount rates)
and household endowments of labour influenced the adoption of Soil and Land Management
(SLM) measures. This study analysed the responsiveness of the SWC measures to changes in
discount rates and labour wage. These parameters directly influence investment decisions of
farmers. The three discount rates used in Tables 10 and 11 were selected based on
information on interest rates changes during the major farming season in 2010. The study
chooses three high discount rates because they reflect the reality in the study period. This
information was provided by three financial institutions in both Muranga and Embu. Tables

41
10 and 11 gives an overview of how NPV of the various SWC measures responds to changes
in the discount rates whilst Table 12 and 13 looks at the impact of labour wage changes on
both NPV and IRR.
Table 10: Responsiveness of the Net Present Value to discount rate changes (maize farms)
1SWC measures 2Discount rate (%) NPV (KES/ha) IRR (%)BT with Maize 8.5 33188 18
10 2610312 18140
CB with maize 8.51012
1015669373343
13
NGS with maize 8.51012
2077639-942
9
Source: Data analysis, 2011.Note: 1BT = Bench Terrace, 1CB = Contour Bunds, and 1NGS = Napier Grass Strips, 2the choice of interest rates were
informed by the information from financial institutions in the Embu and Muranga districts in Kenya, 1 USD = 80 KES.
Table 11: Responsiveness of the Net Present Value to discount rate changes (coffeefarms)
1SWC measures 2Discount rate (%) NPV (KES/ha) IRR (%)BT with Coffee 8.5 53600 14
10 3467712 13558
CB with coffee 8.51012
3679-8327-21653
9
Source: Data analysis, 2011.Note: 1BT = Bench Terrace, CB = Contour Bunds, 2the choice of discount rates were informed by the information from financial institutions in the Embu and Muranga districts in Kenya, 1 USD = 80 KES.
Tables 10 and 11 suggest that, considering slope and soil stability, the NPV of BT with maize
or coffee are relatively less responsive to changes in interest rates. BT produces positive net
welfare at all level of discount rates. NPVs of NGS with maize and CB with coffee proved to
be relatively responsive to interest rate changes. When the discount rate moved from 8.5% to
10%, the NPV of CB with coffee became negative whilst the NPV of NGS with maize
became negative at discount rate 12% both indicating negative net welfare (private). This is

42
in line with what Ellis-Jones and Mason (1999) found in Bolivia where SWC technologies
were more viable in farming systems with low discount rates.
Table 12: Responsiveness of the Net Present Value and Internal Rate of Return to wagerate changes (maize farms)
1SWC measures Market wage rate (KES/MD)
NPV (KES/ha) IRR (%)
BT with Maize 100 33188 18120 -1198 6150 -36315 < 0
CB with maize 100120150
10156-18907 -23253
13< 0 < 0
NGS with maize 100120150
2077-6102 -9990
9< 0 < 0
Source: Data analysis, 2011.Note: 1BT = Bench Terrace, 1CB = Contour Bunds, and 1NGS = Napier Grass Strip, 1 USD = 80 KES.
Table 13: Responsiveness of the Net Present Value and Internal Rate of Return to wage rate changes (coffee farms)
1SWC measures Market wage rate (KES/MD)
NPV (KES/ha) IRR (%)
BT with Coffee 100 52600 14120 15556 10150 -39948 5
CB with coffee 100120150
3679-30664-82178
95
< 0 Source: Data analysis, 2011.
Note: 1 BT = Bench Terrace, 1CB = Contour Bunds, USD = 80 KES.
Table 12 indicates that the NPVs of all three SWC measures on maize farms are responsive to
wage rate changes (nominal wage rate). As shown in Table 12, an increase in labour wage
from 100 KES to 120 KES, and subsequently to 150 KES rendered the NPVs negative. The
same applied to the IRR, expect in the case of BT with maize where at wage 120 KES the
IRR was still positive but still below the discount rate. This is the same for CB with coffee
(Table 13). The investment on CB with coffee is only worthwhile at wage 100 KES. In Table
13 the responsiveness of TB with coffee is relatively better. Here the NPV and IRR for BT

43
with coffee only show non-profitability of investment at labour wage 150 KES indicating less
responsiveness.
3.5 Continuity of the Green Water Credit project from other stakeholder’s perspective
This section discusses, from other stakeholders’ perspective, the relevance of the GWC
project in the Upper Tana and its sustainability. The project recognises that there are positive
externalities from the adoption of SWC measures which are currently unrewarded. By
creating a mechanism where beneficiaries of such externalities could compensate adopters of
SWC measures, soil erosion could be reduced and water related problems ameliorated. As a
result the GWC project also identifies with several downstream stakeholders (beneficiaries of
the externalities) in the basin. Among these are Kenya Electricity (Kengen), Kenya National
Irrigation Board (NIB), large irrigation farms (e.g. Kakuzi, Del Monte, etc.), Nairobi Water
and Sewerage Company, Kenya Ministry of Agriculture (MoA), Kenya Agricultural
Research institute (KARI), University of Nairobi, Kenya Ministry of Water and Irrigation
(MWI), and Kenya Water Resources Management Authority (WRMA). The study had
interviews with only two of the above stakeholders (Kakuzi Ltd and Del Monte Ltd). This
was because it was very difficult getting respondents from the others. Several issues were
discussed in the interviews. Among these were the effects of soil and water degradation on
their production, how significant GWC would be in reducing these effects, their possible role
in the GWC mechanism, the continuity of the GWC mechanism, and what would be the costs
and benefits of their participation. Below, the interviews with Del Monte Kenya Limited and
Kakuzi Limited are discussed.
Del Monte Kenya is a subsidiary of Del Monte Royale. It operates in fruit processing and has
5500 acres of pineapple plantation with an employee population of 6,000. Del Monte Kenya
engages in drip irrigation. In the discussion with the Environmental Manager of the company,
water shortage was the biggest problem faced by company and he attributed this to water use
competition from smallholder farmers and municipal water supply. This restriction to
abstraction of water severely affects their pineapple yield which is reflected in the revenue
generated from sale of canned pineapples. Cost of production increases since they have to
pump water from distant areas and invest in de-silting and construction of new dams.
Siltation due to catchment degradation (by upstream users) has reduced the capacity of
current dams, making worse the water shortage problem. The company’s tree planting

44
activity with farmers upstream is one of their efforts to reduce catchment degradation. The
company has tree nursery where it donates trees to farmers for free. The respondent from Del
Monte Kenya claimed that the GWC project is coming in with a new perspective on
catchment management which when combined with their strategies would drastically reduce
catchment degradation.
GWC mechanism attempts to increase the adoption of SWC measures which will lead to
reduction of soil erosion upstream preventing siltation in dams and rivers. Through this the
capacity of dams for irrigation purposes downstream could be enhanced and this will go a
long way to improve the company’s production capacity. To sustain the GWC project
objective, Del Monte Kenya believes stakeholders (down and upstream stakeholders) should
be encouraged to perceive the project as their own. Again information on the benefits and
cost of stakeholder participation should be made available to all stakeholders from the onset
of the project. Through this stakeholders will realize that it will be their own interest if they
contribute to sustain GWC project objective after project lifespan. The GWC project should
also make an effort to incorporate existing Del Monte mitigation activities in their program to
avoid overlaps. For Del Monte Kenya, the benefits of working with GWC will be an
enhanced cooperate image as a ‘green’ company and reduced production cost due to reduced
cost of obtaining water for production. As a result the company is prepared to logistically
support the GWC project on the sensitization (education) of farmers on SWC measures and
tools needed by farmers for the construction of SWC measures as long as Del Monte Kenya
Ltd remains in business.
Kakuzi Limited is a Kenyan agricultural cultivation and manufacturing company. It produces
pineapples, avocado (it is Kenya’s largest exporter), forestry operations, and tea. Its parent
company is Camellia Plc and its subsidiaries include Estate services Limited, Kaguru (EPZ)
Limited, and Siret Tea Company Limited. From the interview with Kakuzi, the catchment
resources they use for their production included water (for irrigation), timber, and eucalyptus
(sold to Kenya electricity, wildlife services, and big ranches). Dry spells over the years has
led to a drastic reduction in production. Due to water scarcity the company is now operating
at half capacity and most of the dams and streams are suffering from siltation. Kakuzi claims
the water shortage is due to encroachment of stream and river banks by smallholder farmers.
These encroachment leads to collapse of the embankment causing sedimentation in streams,
dams, and rivers. They also blame sedimentation in water bodies on quarries whose activities
45
are on slopes. The company, as it stands now, is in no position to de-silt their dams since it
costs nearly twenty million Kenyan Shillings to de-silt a dam. One of the objectives of the
WRUA is effective sub-catchment water management. Kakuzi, in an attempt to ameliorate
the water problem is supporting these WRUAs through education on catchment management
best practice. According to Kakuzi, if the implementation of the GWC mechanism is an
attempt to ensure constant flow of water, then it is a good project worthy of support from
Kakuzi Limited. I asked the respondent from Kakuzi about how they intend to support GWC
project and he said:
“Kakuzi Limited is prepared to support GWC with the sensitization of farmers
and when we see that farmers are enthusiastic about adopting management
measures then the company will think of supporting farmers through GWC
with tools needed for the adoption of Soil and Water Conservation measures”.
About the continuity of the GWC project, Kakuzi believes it will be difficult if cooperate
plans or strategies of stakeholders on water management are not incorporated in the
plans/activities of the GWC project. For instance Kakuzi has a catchment water management
plan and stress that their support to the GWC mechanism will and must be in line with
Kakuzi’s management plan. This is because they perceive the GWC mechanism as an
opportunity or a complementary strategy to achieve their cooperate responsibility and to
improve their water access. Again to make GWC more sustainable the target should be the
grass root level to allow for an in-household built capacity.

46
4. Conclusions and recommendations
Conclusions
The Saba Saba sub-catchment is one of the worse affected areas in the Upper Tana catchment
in terms of soil erosion. Upstream (smallholder farmers) and downstream (e.g. large
irrigation farm) users acknowledge the existence of this problem. Currently used SWC
measures in the Saba Saba sub-catchment are Bench Terrace, Contour Bunds, Funya Juu
Napier Grass Strips, Mulching, and Cut-off Drains. The most common among these are
Bench Terrace (mainly in the upper and middle Saba Saba), Contour Bunds (mainly in the
middle and lower) and Napier Grass Strips (mainly in lower). On steep and very steep slopes
(with unstable soils) agronomic and vegetative SWC measures (Mulching and Napier Grass
Strips) alone are relatively ineffective in Green Water conservation in the study area.
Structural SWC measures (BT, CB, and Funya Juu) on these types of slopes and soils are
effective in controlling run-off generation and distribution thereby reducing the erosive
power and increasing infiltration. However, structural SWC measures should be
complemented by agronomic and vegetative measures. This is because structural measures
are ineffective in controlling the detachment impact of raindrops.
Apart from the effectiveness of a SWC measure, production factor requirements of the
measure and erosion risk severity of the farmland also provide information about the
appropriate choice of SWC measure. Probable factors influencing the adoption of SWC
measures in the Saba Saba sub-catchment are among others, returns to labour, capital and
credit accessibility, opportunity cost, and farmers’ perception of soil erosion and SWC.
Farmers’ household characteristics (e.g. gender, education and age) and farm characteristics
(e.g. farm size, slope, and soil texture) are also possible influencing factors.
The investment needed for the establishment and maintenance of SWC measures is critical to
farmers’ technology adoption decisions. The required investment varies with the type of
SWC technology. In the Saba Saba sub-catchment Bench Terraces are relatively expensive to
establish but relatively cheaper to maintain compared to Contour Bunds, and Napier Grass
Strips. Contrarily, Napier Grass Strips are relatively cheaper to construct but relatively
expensive to maintain. In general, all three measures have high maintenance costs which are
as a result of poor establishment. The time Bench Terrace, Contour Bunds, and Napier Grass
Strips start to yield benefits differ among crops. As a result it is important for adopters and

47
promoters of SWC technologies to be aware of the period after which respective measures
produce benefits. During this waiting period the farmer requires a certain amount of money
for sustenance which varies with SWC measure and crop type. The initial zero or even
negative returns to investment could be an obstacle to continued adoption of the respective
SWC measures in the sub-catchment. Thus, the investment in SWC measures may not be a
feasible short term option from farmers’ perspective. This is a strong case for intervention
especially for the initial years where SWC adoption yields negative returns. Considering the
NPV of the respective technologies, Bench Terrace yields the highest net welfare, followed
by Contour Bunds and Napier Grass Strips in that order regardless of the crop type (maize,
coffee, and tea). Compared to the NPV of Contour Bunds and Napier Grass Strips, the NPV
of Bench Terrace is relatively less responsive to changes in discount rate. However, all three
measures are very responsive to wage changes. At higher wages smallholder farmers are less
likely to hire labour which could affect their adoption of SWC measures (especially structural
measures). Again in a higher wage situation there is the possibility that farmers would prefer
to render services (using their labour endowment) to other farmers than to themselves.
Soil erosion coupled with reduction in SWC adoption efforts, makes GWC project in the
Upper Tana River catchment worthwhile. From the perspective of downstream stakeholders,
the sustainable of the project depends on the perceived ownership of the project by both
downstream and upstream stakeholders. Since stakeholders are perceived to be profit
maximizers, availability and accessibility of reliable information on the benefits and cost of
stakeholder participation could also be a determining factor of the project sustainability.
Finally, the continuity of the GWC project will also depend on how the project acknowledge
and incorporate stakeholders’ (downstream stakeholders) cooperate strategies on water
management.
Recommendations
Through sensitization/education, promoters of SWC adoption (e.g. GWC) should
encourage farmers to combine/complement SWC measures especially on steep and
very steep slopes with unstable soils. It was found from the field that Bench Terraces
with grass risers were very effective in dealing with soil erosion. It is also important
that farmers are sensitized on proper ways of constructing SWC measures. In this
study the maintenance costs of the various SWC measures were high and this is
attributed to poor construction.

48
Considering the erosion risk severity and soil stability of the Saba Saba sub-
catchment, promoting physically effective and financially efficient SWC measures
would help to improve adoption of SWC measures and the high soil erosion rates.
Stakeholders (GWC, government of Kenya, etc.) could lessen the effects (on farmers)
of the initial negative returns from investment in SWC by encouraging and supporting
diversification of farm activities.
For the continuity of the GWC project, the study recommends that downstream and
upstream stakeholders should be encouraged to perceive the project as their own, the
project should acknowledge and incorporate downstream stakeholders’ cooperate
strategies on water management in the catchment, and should endeavour to make
available to stakeholders information on the cost and benefits of stakeholder
participation (on and off site cost and benefits).
For further research, attempt should be made to investigate the interrelationship
between production factor demands of the various SWC technologies and farmers
production factor endowment. This is important because it has been established that
labour and capital availability, for instance, are key influencing factors in farmers
SWC adoption decisions. These factors are needed for both the establishment of SWC
measures and crop production.

49
References
Agwata, J. F. (2005). Water management in the Tana Basin of Kenya: Potential conflicts and
interventions. Water, Environment and Pollution, 2(2), 69-74.
Barron, J., Rockstrom, J., Gichuki, F., & Hatibu, N. (2003). Dry spell analysis and maize
yields for two semi-arid locations in East Africa. Agricultural and Forest Meteorology,
117 (1–2), 23–37.
Bekele, W. & Drake, L. (2003). Soil and water conservation decision behaviour of
subsistence farmers in the eastern highlands of Ethiopia: a case study of the Hunde-
Lafto area, Ecological Economics 46, 437–451.
Bewket, W. (2007). Soil and water conservation intervention with conventional technologies
in north-western highlands of Ethiopia: Acceptance and adoption by farmers. Land Use
Policy, 24 (2), 404-416.
Bewket, W. (2001). The need for a participatory approach to soil and water conservation
(SWC) in the Ethiopian highlands: a case study in Chemoga watershed, east Gojjam.
Eastern Africa Social Science Research Review, 17 (2), 43–68.
Boardway, R. W. (1974). The Welfare Foundations of Cost Benefit Analysis. The Economic
Journal, 84 (336), 926-939.
Brady, N. C. & Weil, R. R. (2008) The Nature and Properties of Soil. 14th edition, New
Jersey, Pearson Education Inc.
Clark, E. H., Havercamp, J. A., & Chapman, W. (1985). Eroding Soils: The On-Farm
Impacts. Washington D.C., Conservation Foundation.
Crosson, P. R. (1984). New perspectives on soil conservation policy. Journal of Soil and
Water Conservation, 39(4), 222-225.
Drechsel, P., Olaleye, A., Adeoti, A., Thiombiano, L., Barry, B., & Vohland, K. (2006).
Adoption Driver and Constraints of Resource Conservation Technologies in Sub
Saharan Africa. Retrieved from
http://westafrica.iwmi.org/Data/Sites/17/Documents/PDFs/AdoptionConstraints-
Overview.pdf .
Ekbom, A. (1995). The economics of soil conservation in Kenya: A case study of the
economic and agro-ecological implication of soil conservation on maize cultivation in
Muranga District. Woking paper I, Department of Economics, Gothenburg University,
Sweden.
50
Ellis-Jones, J. & Mason, T. (1999). Livelihood strategies and assets of small farmers in the
evaluation of soil and water management practices in the temperate inter-Andean
valleys of Bolivia, Mountain Research and Development, 19(3), 221–234.
FAO (2008). TerrAfrica Inception: Development of guidelines on selected best bet SLM
technologies and approaches for Sub Saharan Africa with the support of WOCAT.
Rome, FAO.
FAO SAFR (2002). Financial and Economic Appraisal of Irrigation Projects: Module 11 of
the Irrigation Manual of the FAO, Harare, FAO SAFR.
Figueiredo, T. de & Fonseca, F. (2009). Soil Conservation Measures: Classification and
description. In: N. Evelpidou & T. De Figueiredo (eds) (2009). Soil Protection in
sloping Mediterranean Agri-Environments, Braganca, Instituto Politecnico de
Braganca. 78-89.
Graaff, J. de & Kessler, C. A. (2009b). Cost-Benefit Analysis for Land and Water
Management. In: N. Evelpidou & T. De Figueiredo (eds) (2009). Soil Protection in
sloping Mediterranean Agri-Environments, Braganca, Instituto Politecnico de
Braganca. 91-110.
Graaff, J. de, Valk, W., & Fleskens, L. (2001). Impact assessment of land and water
management. The Netherlands, Wageningen University.
Harberger, A. C. (1971). Three Basic Postulates for Applied Welfare Economics: An
Interpretive Essay. Journal of Economic Literature, 9, 785-797.
Hunink, J. E., Immerzeel, W. W., Droogers, P., & Kaufmann, S. (2010). Green Water Credits
for the Upper Tana Basin, Kenya. Phase II pilot operations: Biophysical assessment
using SWAT. Green Water Credit report 10, Wageningen, ISRIC-World Soil
Information.
Juma, M., Nyangena, W., & Yesuf, M. (2009). Production Risk and Farm Technology
Adoption in Rain-Fed, Semi-Arid Lands of Kenya. Retrieved from
http://www.rff.org/RFF/Documents/EfD-DP-09-22.pdf.
Kabubo-Mariara J., Mwabu G., & Kimuyu P. (2006). Farm Productivity and Poverty in
Kenya: The Effect of Soil Conservation. Journal of Food Agriculture and Environment,
4(2): 291-297.
Kessler, C. A. (2006). Decisive key-factors influencing farm households’ soil and water
conservation investments, Applied Geography, 26, 40–60.

51
Kuyvenhoven, A. & Mennes, L. B. M. (1989). Guidelines for project appraisal: An
introduction to the principles of financial, economic and social cost-benefit analysis for
developing countries. The Hague, Government printing office.
Mengstie, F. A. (2009). The assessment of adoption behaviour of soil and water conservation
practices in the Koga watershed, highlands of Ethiopia. Master thesis, Cornell
University, USA.
Morgan, R. P. (2005). Soil Erosion and Conservation. Victoria, Blackwell publishing.
National Environmental Management Agency (NEMA) (2003). State of the environment
report, Kenya. Nairobi, Government printer.
Organization for Economic Co-operation and Development (OECD) (2006). Cost Benefit
Analysis and the Environment: Recent developments. Retrieved from
http://www.oecd.org/dataoecd/37/53/36190261.pdf.
Pender, J. L. & Kerr, J. M. (1998). Determinants of farmers’ indigenous soil and water
conservation investments in semi-arid India. Agricultural Economics, 19, 113–125.
Pimentel, D., Harvey, C., Resosudamo, K., Sinclair, K., Kurz, K., McNair, M., Crist, S.,
Shpritz, L., Fitton, L., Staffouri,R., & Blair, R. (1995). Environmental and economic
costs of soil erosion and conservation benefits. Science, 267, 1117–1123.
Porras, I., Grieg-Gran, M., & Meijerink, G. (2007). Farmers adoption of soil and water
conservation: potential role of payments for watershed services. Green Water Credits
report 5, Wageningen, ISRIC-World Soil Information.
Rockstrom, J., Falkenmark, M., & Lannerstad, M. (2007) Assessing the water challenge of a
new green revolution in developing countries. Proceedings of the National Academy of
Sciences of the United States of America, 104 (15), 6253–6260.
Rockstrom, J. (2003). Water for food and nature in drought-prone tropics: vapour shift in
rain-fed agriculture. Royal Society B: Biological Sciences, 358 (1440), 1997–2009.
Roo, A. P. J. de (1993). Modelling surface runoff and soil erosion in catchments using
Geographical Information Systems. Netherlands Geographical Studies, 157, 295.
Saba Saba Water Resource Users Association (Saba Saba WRUA) & Water Resources
Management Authority (WRMA) (2010). Sub-Catchment Management Plan. Region:
Tana, Water Resource Users Association, Saba Saba.
Semgalawe, Z. M. & Folmer, H. (2000). Household adoption behaviour of improved soil
conservation: the case of the North Pare and West Usambara mountains of Tanzania.
Land Use Policy, 17, 321–336.

52
Semgalawe, Z. M. (1998). Household adoption behaviour and agricultural sustainability in
the north-eastern mountains of Tanzania: the case of soil conservation in the North
Pare and West Usambara mountains. PhD Thesis, Wageningen Agricultural
University, Wageningen.
Stonehouse, D. P. (1999). Economic Evaluation of On-Farm Conservation Practices in the
Great Lakes Region of North America. Environmetrics, 10, 505-520.
Stonehouse, D. P. (1995). Profitability of soil and water conservation in Canada. Journal of
Soil and Water Conservation, 50(2), 215-219.
Stonehouse, D. P. & Bohl, M. (1990). Land degradation issues in Canadian agriculture.
Canadian Public Policy, 15(4), 418-431.
Tegene, B. (1992). Erosion: Its effects on properties and productivity of eutric nitosols in
Gununo area, southern Ethiopia, and some techniques of its control. Berne, University
of Berne.
Tenge, A. J., Graaf, J. de, & Hella, J. P. (2005). Financial efficiency of major soil and water
conservation measures in West Usambara highlands, Tanzania. Applied Geography, 25,
348–366.
Wani, S. P., Pathak, P., Jangawad, L.S., Eswaran, H., & Singh, P. (2003). Improved
management of vertisols in the semi-arid tropics for increased productivity and soil
carbon sequestration. Soil Use and Managemen,t 19 (3), 217– 222.
Water Resources Management Authority (WRMA) (2009). Tana Water Catchment Area
Management Strategy. Embu, WRMA.
World Bank (2006). Sustainable Land Management: Challenges, Opportunities, and Trade-
offs. Washington, D.C., The World Bank.
World Overview of Conservation Approaches and Technologies (WOCAT) (2002). A
Framework for the Evaluation of Soil and Water Conservation. Retrieved from
http://www.wocat.net/fileadmin/user_upload/documents/QT_andQA/TechQuestE.pdf.
Zaks, D. & Monfreda, C. (2006). Green Water and Sustainable Agriculture. Retrieved from
http://www.worldchanging.com/archives/004494.html

53
Appendices
Appendix 1: Annual gross margin
Appendix 1a: Annual gross margin of maize production on Bench Terraces.
Quant/ha Unit cost
(in MD) (KES/ha) Unit
Area 1 Ha
Saleable yield 1815 kg/ha
price 30 KES/Kg
Gross income(price*(ha*yield)) 54450 KES/Kg
Establishment cost 279 100 27900 KES/ha
Annuity of establishment cost 46 4569
Annual maintenance cost 30 100 3000 KES/ha
Cost of Labour inputsLand preparation 40 100 4000 KES/ha
Planting 28 100 2800 KES/ha
Manuring 32 100 3200 KES/ha
weeding 30 100 3000 KES/ha
Spraying 0 0 0 KES/ha
Harvesting 28 100 2800 KES/ha
compost 0 0 0 KES/ha
Fertilization 25 100 2500 KES/ha
Total cost of labour inputs 259 100 25869 KES/haAnnual labour Cost (excl. establ. cost) 213 21300 KES/ha
Farm InputsSeeds 30 50 1500 KES/hacompost 0 0 0 KES/ha
Pesticides 0 0 0 KES/ha
Fertilizer 60 60 3600 KES/ha
Transportation costs 1500 KES/ha
Total material inputs 6600 KES/ha
Total labour and material cost 32469 KES/ha
Gross margin (GIN-TVC) 21981 KES/ha
Gross margin per manday 185 KES/ha

54
Appendix 1b: Annual gross margin of maize production on Contour Bunds (CB)
Quant/ha Unit cost
(in MD) (KES/ha) Unit
Area 1 ha
Saleable yield 1388 kg/ha
price 30 KES/Kg
Gross income(price*(ha*yield)) 41640 KES/Kg
Establishment cost 134 100 13400 KES/ha
Annuity of establishment cost 20 2031 KES/ha
Annual maintenance cost 27 100 2700 KES/ha
Cost of Labour inputs
Land preparation 40 100 4000 KES/ha
Planting 28 100 2800 KES/ha
Manuring 32 100 3200 KES/ha
weeding 30 100 3000 KES/ha
Spraying 0 0 0 KES/ha
Harvesting 28 100 2800 KES/ha
compost 0 0 0 KES/ha
Fertilization 25 100 2500 KES/ha
Total cost of labour inputs 230 100 23031 KES/haAnnual labour Cost (excl. establ. cost) 210 21000 KES/ha
Farm InputsSeeds 30 50 1500 KES/ha
compost 0 0 0 KES/ha
Pesticides 0 0 0 KES/ha
Fertilizer 60 60 3600 KES/ha
Transportation costs 1500 KES/ha
Total material inputs 6600 KES/ha
Total labour and material cost 29631 KES/ha
Gross margin (GIN-TVC) 12009 KES/ha
Gross margin per manday 152 KES/ha

55
Appendix 1c: Annual gross margin of maize production on Napier Grass Strips (NGS)
Quant/ha Unit cost
(in MD) (KES/ha) Unit
Area 1 ha
Saleable yield 1128 kg/ha
price 30 KES/Kg
Gross income(price*(ha*yield)) 33840 KES/Kg
Establishment cost 42 100 4200 KES/ha
Annuity of establishment cost 5 459 KES/ha
Annual maintenance cost 9 100 900 KES/ha
Cost of Labour inputsLand preparation 40 100 4000 KES/ha
Planting 28 100 2800 KES/ha
Manuring 32 100 3200 KES/ha
weeding 30 100 3000 KES/ha
Spraying 0 0 0 KES/ha
Harvesting 28 100 2800 KES/ha
compost 0 0 0 KES/ha
Fertilization 25 100 2500 KES/ha
Total cost of labour inputs 197 100 19659 KES/haAnnual labour Cost (excl. establ. cost) 192 19200 KES/ha
Farm InputsSeeds 30 50 1500 KES/ha
compost 0 0 0 KES/ha
Pesticides 0 0 0 KES/ha
Fertilizer 60 60 3600 KES/ha
Transportation costs 1500 KES/ha
Total material inputs 6600 KES/ha
Total labour and material cost 26259 KES/ha
Gross margin (GIN-TVC) 7581 KES/ha
Gross margin per manday 139 KES/MD

56
Appendix 1d: Annual gross margin of coffee production on Bench Terrace
Quant/ha Unit cost
(in MD) (KES/ha) Unit
Area 1 ha
Saleable yield 1820 kg/ha
price 48 KES/Kg
Gross income(price*(ha*yield)) 87360 KES/Kg
Establishment cost (Terrace) 279 100 27900 KES/ha
Establishment cost of coffee 585 100 58500 KES/haAnnuity of establishment cost of terrace 46 4569 KES/haAnnuity of establishment cost of coffee 64 6386 KES/ha
Annual maintenance cost 30 100 3000 KES/ha
Cost of annual labour inputsManuring 21 100 2100 KES/ha
weeding 18 100 1800 KES/ha
Spraying 9 100 900 KES/ha
Harvesting 24 100 2400 KES/ha
composting 0 0 0 KES/ha
Fertilization 14 100 1400 KES/ha
Pruning 21 100 2100 KES/ha
Total cost of labour inputs 247 100 24655.25 KES/haAnnual labour Cost (excl. establ. costs) 137 13700 KES/ha
Farm Inputscompost 0 0 0 KES/ha
Pesticides 50 42 2100 KES/ha
Fertilizer 80 70 5600 KES/ha
Funducides 60 45 2700 KES/ha
Transportation costs & processing 2500 KES/ha
Total material inputs 12900 KES/ha
Total labour and material cost 37555.25 KES/ha
Gross margin (GIN-TVC) 49804.75 KES/ha
Gross margin per manday 302 KES/MD

57
Appendix 1e: Annual gross margin of coffee production on Contour Bunds (CB)
Quant/ha Unit cost
(in MD) (KES/ha) Unit
Area 1 ha
Saleable yield 1527 kg/ha
price 48 KES/Kg
Gross income(price*(ha*yield)) 73296 KES/Kg
Establishment cost (CB) 134 100 13400 KES/ha
Establishment cost of coffee 585 100 58500 KES/haAnnuity of establishment cost of CB) 20 2031 KES/haAnnuity of establishment cost of coffee 64 6386 KES/ha
Annual maintenance cost 27 100 2700 KES/ha
Cost of annual labour inputsManuring 21 100 2100 KES/ha
weeding 18 100 1800 KES/ha
Spraying 9 100 900 KES/ha
Harvesting 24 100 2400 KES/ha
composting 0 0 0 KES/ha
Fertilization 14 100 1400 KES/ha
Pruning 21 100 2100 KES/ha
Total cost of labour inputs 218 100 21817 KES/haAnnual labour Cost (excl. establ. costs) 134 13400 KES/ha
Farm Inputscompost 0 0 0 KES/ha
Pesticides 50 42 2100 KES/ha
Fertilizer 80 70 5600 KES/ha
Funducides 60 45 2700 KES/ha
Transportation &processing costs 2500 KES/ha
Total material inputs 12900 KES/ha
Total labour and material cost 34717 KES/ha
Gross margin (GIN-TVC) 38578.75 KES/ha
Gross margin per manday 277 KES/MD
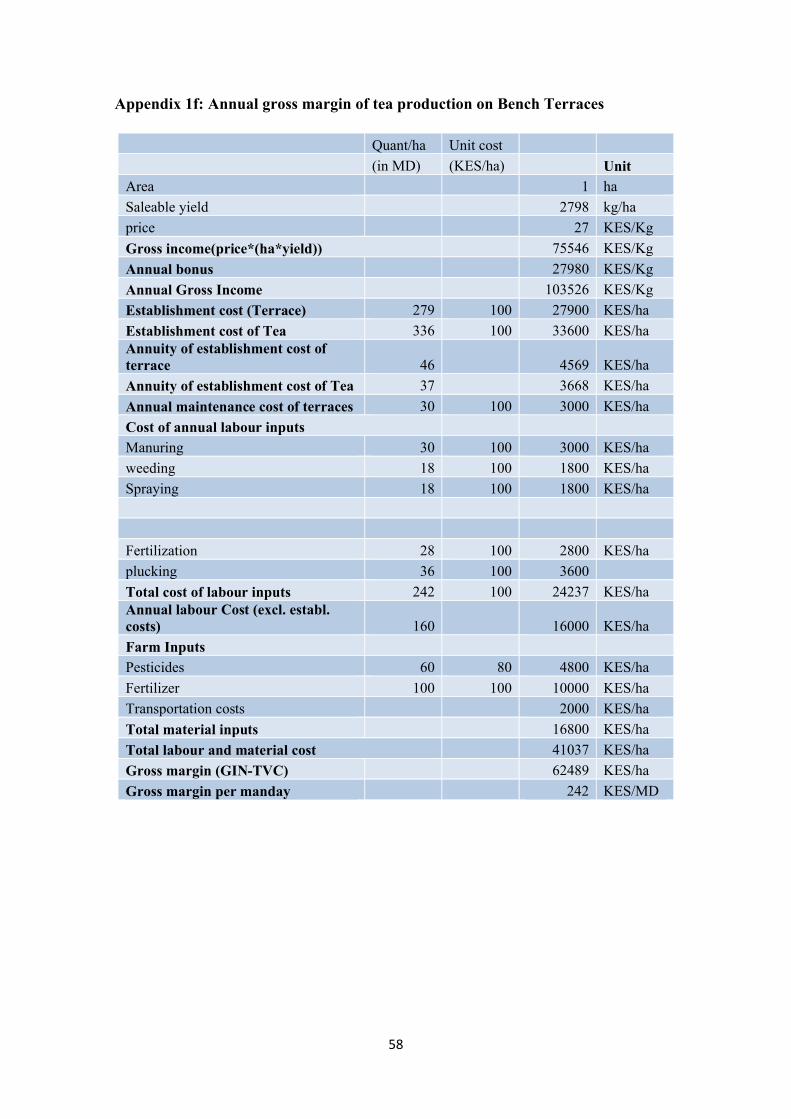
58
Appendix 1f: Annual gross margin of tea production on Bench Terraces
Quant/ha Unit cost
(in MD) (KES/ha) UnitArea 1 ha
Saleable yield 2798 kg/ha
price 27 KES/Kg
Gross income(price*(ha*yield)) 75546 KES/Kg
Annual bonus 27980 KES/Kg
Annual Gross Income 103526 KES/Kg
Establishment cost (Terrace) 279 100 27900 KES/ha
Establishment cost of Tea 336 100 33600 KES/haAnnuity of establishment cost of terrace 46 4569 KES/ha
Annuity of establishment cost of Tea 37 3668 KES/ha
Annual maintenance cost of terraces 30 100 3000 KES/ha
Cost of annual labour inputsManuring 30 100 3000 KES/ha
weeding 18 100 1800 KES/ha
Spraying 18 100 1800 KES/ha
Fertilization 28 100 2800 KES/ha
plucking 36 100 3600
Total cost of labour inputs 242 100 24237 KES/haAnnual labour Cost (excl. establ. costs) 160 16000 KES/ha
Farm InputsPesticides 60 80 4800 KES/ha
Fertilizer 100 100 10000 KES/ha
Transportation costs 2000 KES/ha
Total material inputs 16800 KES/ha
Total labour and material cost 41037 KES/ha
Gross margin (GIN-TVC) 62489 KES/ha
Gross margin per manday 242 KES/MD

59
Appendix 2. Cost Benefit Analysis results (8.5% discount rate)
Appendix 2a: NPV and IRR of the investment in Bench Terrace on maize farms
Establ. Maint. Total cost Without- With- With minus Net Discount PV PV
Year Cost cost TC SWC Benefits SWC Benefits Without Benefits Factor Cost BenefitsBT BT (C) (B) (B-C)
0 27900 27900 0 0 -27900 1 27900 0
1 0 5330 0 -5330 -5330 0.922 0 -4913
2 6750 6750 5170 10991 5821 -930 0.850 5734 4945
3 6750 6750 5015 16486 11471 4721 0.783 5285 8980
4 6750 6750 4865 21981 17116 10366 0.722 4871 12351
5 6750 6750 4719 21981 17262 10512 0.665 4489 11479
6 6750 6750 4577 21981 17404 10654 0.613 4137 10667
7 6750 6750 4440 21981 17541 10791 0.565 3813 9909
8 6750 6750 4307 21981 17674 10924 0.521 3515 9203
9 6750 6750 4178 21981 17803 11053 0.480 3239 8544
10 6750 6750 4053 21981 17928 11178 0.442 2986 7930
11 6750 6750 3931 21981 18050 11300 0.408 2751 7357
12 6750 6750 3813 21981 18168 11418 0.376 2536 6826
13 6750 6750 3699 21981 18282 11532 0.346 2338 6331
14 6750 6750 3588 21981 18393 11643 0.319 2154 5869
15 6750 6750 3480 21981 18501 11751 0.294 1985 5441
Total 77732 110919NPV 33187
33188
IRR18%
B/C ratio 1.43

60
Appendix 2b: NPV and IRR of the investment in Contour Bunds on maize farms
Establ. Maint.
Total cost Without- With-
With minus Net Discount PV PV
Year cost cost TCSWC Benefits
SWC Benefits
Without Benefits Factor Cost Benefits
CB CB (C) (B) (B-C)
0 13400 13400 0 0 -13400 1 13400 0
1 0 0 5330 0 -5330 -5330 0.922 0 -4913
2 2700 2700 5170 6005 835 -1866 0.850 2294 709
3 2700 2700 5015 9007 3992 1292 0.783 2114 3125
4 2700 2700 4865 12009 7144 4444 0.722 1948 5155
5 2700 2700 4719 12009 7290 4590 0.665 1796 4848
6 2700 2700 4577 12009 7432 4732 0.613 1655 4555
7 2700 2700 4440 12009 7569 4869 0.565 1525 4276
8 2700 2700 4307 12009 7702 5002 0.521 1406 4010
9 2700 2700 4178 12009 7831 5131 0.480 1296 3758
10 2700 2700 4053 12009 7956 5256 0.442 1194 3519
11 2700 2700 3931 12009 8078 5378 0.408 1101 3293
12 2700 2700 3813 12009 8196 5496 0.376 1014 3079
13 2700 2700 3699 12009 8310 5610 0.346 935 2878
14 2700 2700 3588 12009 8421 5721 0.319 862 2687
15 2700 2700 3480 12009 8529 5829 0.294 794 2508
Total 33333 43488
NVP 10155
10156
IRR13%
B/C ratio1.305 1.30
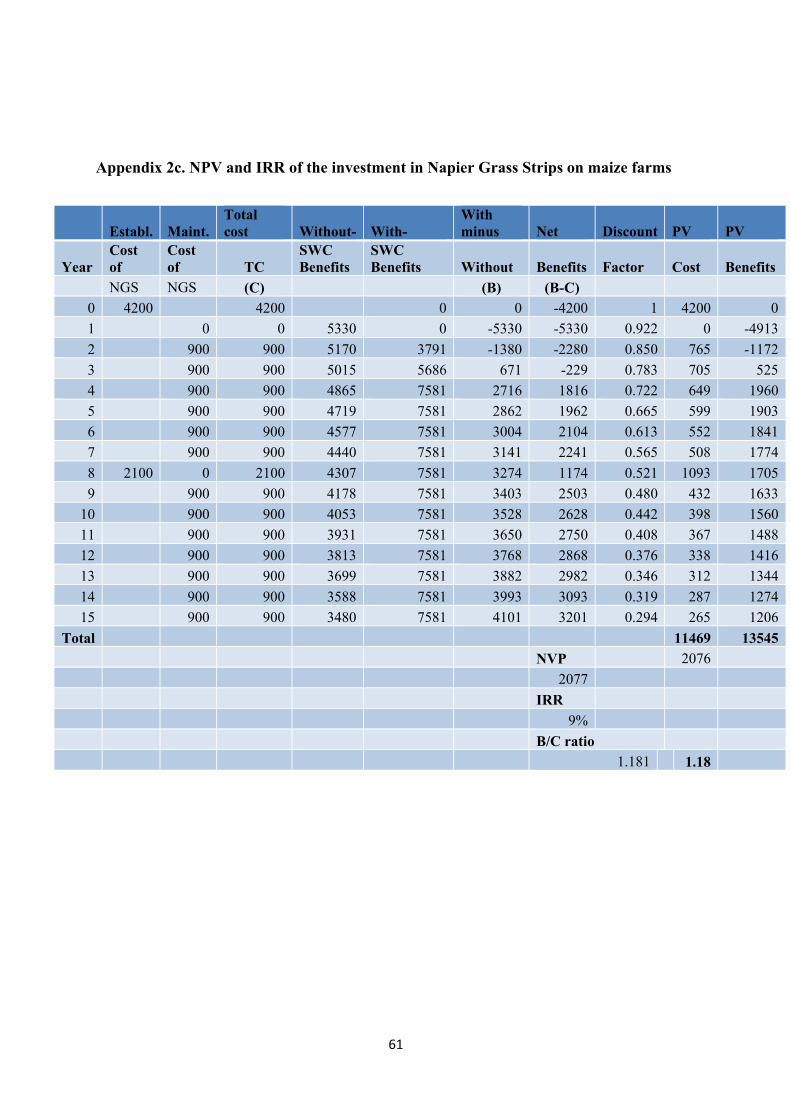
61
Appendix 2c. NPV and IRR of the investment in Napier Grass Strips on maize farms
Establ. Maint. Total cost Without- With-
With minus Net Discount PV PV
YearCostof
Costof TC
SWC Benefits
SWC Benefits Without Benefits Factor Cost Benefits
NGS NGS (C) (B) (B-C)0 4200 4200 0 0 -4200 1 4200 0
1 0 0 5330 0 -5330 -5330 0.922 0 -4913
2 900 900 5170 3791 -1380 -2280 0.850 765 -1172
3 900 900 5015 5686 671 -229 0.783 705 525
4 900 900 4865 7581 2716 1816 0.722 649 1960
5 900 900 4719 7581 2862 1962 0.665 599 1903
6 900 900 4577 7581 3004 2104 0.613 552 1841
7 900 900 4440 7581 3141 2241 0.565 508 1774
8 2100 0 2100 4307 7581 3274 1174 0.521 1093 1705
9 900 900 4178 7581 3403 2503 0.480 432 1633
10 900 900 4053 7581 3528 2628 0.442 398 1560
11 900 900 3931 7581 3650 2750 0.408 367 1488
12 900 900 3813 7581 3768 2868 0.376 338 1416
13 900 900 3699 7581 3882 2982 0.346 312 1344
14 900 900 3588 7581 3993 3093 0.319 287 1274
15 900 900 3480 7581 4101 3201 0.294 265 1206
Total 11469 13545
NVP 2076
2077
IRR
9%
B/C ratio1.181 1.18

62
Appendix 2d. NPV and IRR of the investment in Bench Terrace on coffee farms
Establ.
Establ.2 Maint.
Total cost
Without- With-
With minus Net Discount PV PV
Year cost cost cost TCSWC Benefits
SWC Benefits Without Benefits Factor Cost Benefits
BT coffee BT (C) (B) (B-C)
0 27900 585008640
0 0 0 -86400 1 86400 0
1 0 0 18075 0 -18075 -18075 0.922 0 -16660
2 3000 3000 17714 0 -17714 -20714 0.850 2549 -15048
3 3000 3000 17360 24902 7542 4542 0.783 2349 5905
4 3000 3000 17013 37354 20341 17341 0.722 2165 14678
5 3000 3000 16673 49805 33132 30132 0.665 1995 22033
6 3000 3000 16340 49805 33465 30465 0.613 1839 20511
7 3000 3000 16013 49805 33792 30792 0.565 1695 19089
8 3000 3000 15692 49805 34113 31113 0.521 1562 17763
9 3000 3000 15378 49805 34427 31427 0.480 1440 16521
10 3000 3000 15070 49805 34735 31735 0.442 1327 15363
11 3000 3000 14769 49805 35036 32036 0.408 1223 14281
12 3000 3000 14474 49805 35331 32331 0.376 1127 13274
13 3000 3000 14185 49805 35620 32620 0.346 1039 12335
14 3000 3000 13901 49805 35904 32904 0.319 957 11457
15 3000 3000 13623 49805 36182 33182 0.294 882 10641
Total 108548 162142
NVP 53594
53600
IRR14%
B/C ratio 1.494

63
Appendix 2e. NPV and IRR of the investment in Contour Bunds on coffee farms
Establ. Establ.2
Maint.
Total cost
Without- With-
With minus Net Discount PV PV
Year cost Cost cost TCSWC Benefits
SWC Benefits
Without Benefits Factor Cost Benefits
CB Coffee CB (C) (B) (B-C)0 13400 58500 71900 0 -71900 1 71900
1 0 0 18075 0 -18075 -18075 0.922 0 -16660
2 2700 2700 17714 0 -17714 -20414 0.850 2294 -15048
3 2700 2700 17360 19313 1953 -747 0.783 2114 1529
4 2700 2700 17013 28970 11957 9257 0.722 1948 8628
5 2700 2700 16673 38627 21954 19254 0.665 1796 14599
6 2700 2700 16340 38627 22287 19587 0.613 1655 13660
7 2700 2700 16013 38627 22614 19914 0.565 1525 12775
8 2700 2700 15692 38627 22935 20235 0.521 1406 11942
9 2700 2700 15378 38627 23249 20549 0.480 1296 11157
10 2700 2700 15070 38627 23557 20857 0.442 1194 10419
11 2700 2700 14769 38627 23858 21158 0.408 1101 9724
12 2700 2700 14474 38627 24153 21453 0.376 1014 9074
13 2700 2700 14185 38627 24442 21742 0.346 935 8464
14 2700 2700 13901 38627 24726 22026 0.319 862 7890
15 2700 2700 13623 38627 25004 22304 0.294 794 7354
Total 91833 95508
NVP3679 3675
IRR
9%
B/C ratio 1.04

64
Appendix 2f. NPV and IRR of the investment in Bench Terrace on Tea farms
Establ.Establ.2 Maint.
Total cost
Without- With-
With minus Net Discount PV PV
Year cost cost cost TC
SWC Benefits
SWC Benefits Without Benefits Factor Cost Benefits
BT Tea BT (C) (B) (B-C)0 27900 33600 61500 0 0 -61500 1 61500 0
1 0 0 25075 0 -25075 -25075 0.922 0 -23112
2 3000 3000 24824 0 -24824 -27824 0.850 2549 -21088
3 3000 3000 24576 -24576 -27576 0.783 2349 -19241
4 3000 3000 24330 31244.5 6915 3915 0.722 2165 4990
5 3000 3000 6000 24087 46866.8 22780 16780 0.665 3990 15149
6 3000 3000 23846 62489 38643 35643 0.613 1839 23684
7 3000 3000 23608 62489 38881 35881 0.565 1695 21964
8 3000 3000 23372 62489 39117 36117 0.521 1562 20368
9 3000 3000 23138 62489 39351 36351 0.480 1440 18885
10 3000 3000 6000 22907 62489 39582 33582 0.442 2654 17507
11 3000 3000 22678 62489 39811 36811 0.408 1223 16227
12 3000 3000 22451 62489 40038 37038 0.376 1127 15042
13 3000 3000 22226 62489 40263 37263 0.346 1039 13943
14 3000 3000 22004 62489 40485 37485 0.319 957 12919
15 3000 3000 6000 21784 62489 40705 34705 0.294 1765 11971
Total 87852 129208
NVP 41357
41363
IRR 12%
12%

65
Appendix 3: Evidence of fieldwork (pictures from the Saba Saba sub-catchment)
Training of field assistance
The Saba Saba River bank degradation
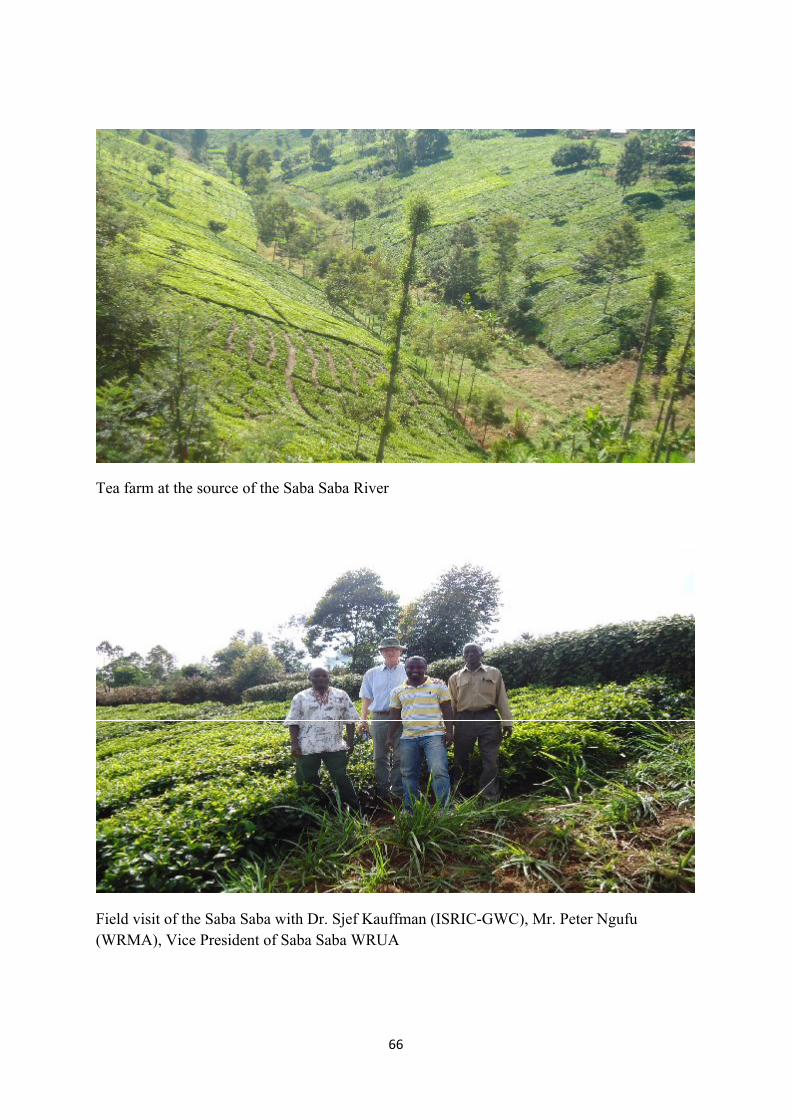
66
Tea farm at the source of the Saba Saba River
Field visit of the Saba Saba with Dr. Sjef Kauffman (ISRIC-GWC), Mr. Peter Ngufu (WRMA), Vice President of Saba Saba WRUA