COST BENEFIT ANALYSIS OF FORTIFYING THE … Cost benefit analysis of fortifying the food supply with...
78
COST BENEFIT ANALYSIS OF FORTIFYING THE FOOD SUPPLY WITH FOLIC ACID REPORT BY ACCESS ECONOMICS PTY LIMITED FOR FOOD STANDARDS AUSTRALIA NEW ZEALAND JUNE 2006
Transcript of COST BENEFIT ANALYSIS OF FORTIFYING THE … Cost benefit analysis of fortifying the food supply with...

COST BENEFIT ANALYSIS OF FORTIFYING THE FOOD SUPPLY WITH
FOLIC ACID
REPORT BY ACCESS ECONOMICS PTY LIMITED
FOR
FOOD STANDARDS AUSTRALIA NEW ZEALAND
JUNE 2006

Cost benefit analysis of fortifying the food supply with folic acid
CONTENTS
1. Introduction 1
1.1 Method — cost benefit analysis 2
2. Related experience 4
3. Neural tube defects 6
3.1 Incidence of neural tube defects 7
3.2 Treatment of terminations and still births 8
3.3 Infant survival and life expectancy 8
3.4 Disease weights 9
4. The benefits of mandatory fortification 10
4.1 Projections of the NTDs prevented 10
4.2 Burden of disease 11
4.3 Health system costs 18
4.4 Production losses 22
4.5 Other costs 26
4.6 Efficiency losses from transfer payments 28
4.7 Summary of benefits 32
5. The costs of mandatory fortification 36
5.1 Consumers 36
5.2 Industry 36
5.3 Government 47
5.4 Summary of costs 50
6. The net benefits of mandatory fortification 51
7. Conclusions 54
8. References 55
TABLES
Table 1:1: framework for CBA of proposal for mandatory fortification of bread making flour with folic acid 3
Table 3:1: Disease weights for spina bifida 9
Table 4:1: Estimated number of neural tube defect incident cases prevented per year by folic acid content of bread making flour in the final food 11
Table 4:2: Estimates of VSL, various years, US$, A$ and NZ$ 15
Table 4:3: DALYs for NTDs prevented by mandatory fortification 17
Table 4:4: Value of DALYs for NTDs prevented by mandatory fortification 17
Table 4:5: Health system expenditure for spina bifida related causes per year for a person with spina bifida, 2005 20
Table 4:6: Discounted stream of health expenditure avoided, spina bifida ($2005)a 20
Cost benefit analysis of fortifying the food supply with folic acid
Table 4:7: Health system expenditure for anencephaly and encephalocele related causes per year per person, 2005a 21
Table 4:8: Discounted stream of health expenditure avoided, anencephaly and encephalocele, 2005a 21
Table 4:9: Lifetime health costs per NTD birth, estimates from the literature 22
Table 4:10: NPV of long term productivity costs avoidable with mandatory fortification Australia (A$)a 25
Table 4:11: NPV of long term productivity costs avoidable with mandatory fortification New Zealand (NZ$) 25
Table 4:12: Expenditure on aids and modifications per person with spina bifida per year, 2005 26
Table 4:13: Discounted stream of expenditure on personal aids avoided, spina bifida, 2005a27
Table 4:14: Summary of assumptions about tax rates and efficiency losses 29
Table 4:15: efficiency loss associated with personal tax foregone 29
Table 4:16: efficiency loss associated with welfare payments 32
Table 4:17: Net value of burden of disease 33
Table 4:18: Summary of benefits of mandatory fortification, mean, 2005, Australia 34
Table 4:19: Summary of benefits of mandatory fortification, mean, 2005, New Zealand 35
Table 5:1 Sales of wheat flour within Australia 38
Table 5:2 Label redesign costs per SKU 40
Table 5:3 Labelling costs — prepackaged products 41
Table 5:4 Labelling costs — unpackaged products 41
Table 5:5 cost per year of additional equipment 42
Table 5:6 Cost of folic acid per tonne flour with 25% overage 43
Table 5:7 Total cost of folic acid added to BMF per year 43
table 5:8 Cost per year associated with folic acid premix 44
Table 5:9 Costs per year associated with analytical testing 44
Table 5:10 Other costs per year 44
Table 5:11: Costs to industry of fortification of all bread making flour, 2005 46
Table 5:12: Cost to industry of mandatory fortification, literature review 47
Table 5:13: Estimated costs of administering and enforcing the regulation, Australia (A$) 49
Table 5:14: Estimated costs of administering and enforcing the regulation, New Zealand (NZ$) 50
Table 5:15: Summary of costs of mandatory fortification of all bread making flour per year 50
Table 6:1: Net benefits of mandatory fortification, all bread making flour 52
Table 6:2: Net benefits of mandatory fortification, All bread making flour 53

i
Cost benefit analysis of fortifying the food supply with folic acid
ACKNOWLEDGEMENTS AND DISCLAIMER
Access Economics would like to acknowledge with appreciation expert input from the following:
Dr Carol Bower Medical Specialist and Head, Birth Defects Registry Clinical Professor, Centre for Child Health Research and School of Population Health, University of WA
Dr Barry Barman Epidemiologist, Wellington
Members of the spina bifida community, in particular,
Ms Kerrie Duff Immediate Past President of the Australian Spina Bifida and Hydrocephalus Association
Miss Elizabeth Lewis Neurosurgeon Board Member, Spina Bifida Foundation of Victoria
Mr Bill Shad Information Officer Spina Bifida and Hydrocephalus Association, Queensland
Mr John Symons President, Spina Bifida Foundation of Victoria
Ms Stephanie Taylor Executive Director, Spina Bifida Foundation of Victoria
Mr Lyell Thurston Immediate Past National President of New Zealand CCS
Mr Rhys Williams Board Member, Spina Bifida Foundation of Victoria
NZ and Australian flour millers, folic acid producers and bakers who provided data.
While every effort has been made to ensure the accuracy of this document, the uncertain nature of economic data, forecasting and analysis means that Access Economics Pty Limited is unable to make any warranties in relation to the information contained herein. Access Economics Pty Limited, its employees and agents disclaim liability for any loss or damage which may arise as a consequence of any person relying on the information contained in this document.
ii
Cost benefit analysis of fortifying the food supply with folic acid
GLOSSARY AND ACRONYMS
AIHW Australian Institute of Health and Welfare
Bread making flour Bread-making flour was assumed by FSANZ to be used as an ingredient in all plain, fancy, sweet, and flat breads and bread rolls, English muffins, crumpets, scones, pancakes, pikelets, crepes, yeast donuts, pizza bases and crumbed products.
Bioavailability A measure of the body’s ability to extract, absorb and metabolise a nutrient
Birth prevalence vs. incidence Birth prevalence of NTDs is the sum of cases of all NTDs occurring in live births, stillbirths and terminations of pregnancies divided by total births (live births plus stillbirths). The term birth prevalence is often used in reference to birth defects (rather than the term incidence) because it is not possible to know whether all new occurrences of a birth defect have been included. For example, not all spontaneous abortions would be examined for birth defects. However, for the purposes of this analysis, the term incidence is used.
BMF Bread making flour
BOD Burden of Disease
CBA Cost benefit analysis
DALY Life years lost due to disability (Disability Adjusted Life Year). Incorporates both years of life lost due to disability and years of life lost due to premature mortality.
Folate and folic acid Folate is a vitamin that naturally occurs in various foods such as fresh, raw or lightly cooked vegetables, raw fruit, breads, cereals, dried beans and peas. Folic acid is the synthetic form of folate. The bioavailability of folic acid in food is greater than that of natural folate. Folate has some protective effect against NTDs but less than that of folic acid.
FSANZ Food Standards Australia New Zealand
NPV Net present value
NTD Neural tube defect
Overage amounts of folic acid added in excess of the required dose to ensure compliance with the content requirements
Peri conceptional period Four weeks prior and 12 weeks after conception.
µg Microgram (one-millionth of a gram)

iii
Cost benefit analysis of fortifying the food supply with folic acid
EXECUTIVE SUMMARY
Food Standards Australia New Zealand (FSANZ) commissioned Access Economics in March 2006 to investigate the benefits and costs of fortifying flour in Australia and New Zealand with folic acid. There was a tight timeframe for the project.
The FSANZ proposal comprised two food vehicles and two doses: Mandatory fortification by flour millers of either white bread making flour or all bread making flour (BMF) such that the concentration of folic acid in the final food would be either 100µg folic acid per 100g flour, or 200µg folic acid per 100g flour.
Folate deficiency among women of child bearing age has been linked to an increase in the relative risk of occurrence of infants with neural tube defects (NTDs), including spina bifida, anencephaly and encephalocele. However, even where folic acid intake during the peri conceptional period is adequate, some proportion of NTDs may still occur because of genetic or other factors. FSANZ commissioned an assessment of the scientific evidence on the potential health effects of folic acid fortification which concluded that, at the folic acid intakes associated with the fortification program proposed by FSANZ (and analysed here), there is unlikely to be any harm. However, there was scientific uncertainty about the impact of unmetabolised circulating folic acid and a predicted possible small increase in twinning (of less than 5 per cent).
Currently in Australia there are around 338 incident cases of NTDs a year and around 72 a year in New Zealand.
Methodology
The analysis of benefits focused on the costs avoided as a result of new cases of NTDs that could be prevented in future. The costs avoided through a fall in the occurrence of NTDs include pain and suffering from disability and premature mortality, total outlays on health care and personal care, production losses, and efficiency losses that arise from lower taxation revenues and higher welfare payments.
The costs of mandatory fortification include the in-principle costs to consumers of reduced choice (although this was not estimated for this project), the costs to government of administering and enforcing mandatory fortification and the costs to industry of fortifying their product. The costs of monitoring the policy were not included based on FSANZ advice.
A number of countries (for example, the USA and Canada) have adopted mandatory fortification but few cost benefit analyses have been undertaken. However, an ex post analysis of fortification with folic acid of enriched cereal products in the US suggested that such a policy is associated with net benefits. This is consistent with the results found by Access Economics in this study.
Key findings
At a folic acid concentration of 200µg per 100g all bread making flour in the final food, the benefits outweigh the costs.
���� the incidence of live birth NTDs in Australia and New Zealand will fall delivering benefits of $25 million per year and $7 million per year respectively. These
iv
Cost benefit analysis of fortifying the food supply with folic acid
benefits exceed the ongoing costs of fortification of $1 million per year in Australia and $2 million per year in New Zealand.
���� the incidence of all NTDs (including still births and terminations prevented) will fall in Australia and New Zealand, delivering benefits of $126 million per year and $44 million per year respectively. These benefits exceed the ongoing costs of fortification of $1 million per year in Australia and $2 million per year in New Zealand.
At fortification doses of 100µg folic acid per 100g bread making flour, the benefits generally outweigh the costs — with the exception of one scenario for New Zealand.
The benefits
New cases of NTDs prevented per year through mandatory fortification were estimated by FSANZ based on nutritional modelling. The modelling relied on data from the 1995 National Nutritional Survey. Projected increases in folic acid intakes took into account that some products were already fortified voluntarily, however, there would be some variance around the projections given variation in diets and increasing voluntary use of vitamin supplements since 1995 and declining bread consumption since 1995 (eg due to low-carbohydrate diets).
���� For example, the potential fall in NTDs is higher for some demographic groups such as Indigenous people because of their poorer folate status, and lower for those regularly taking folic acid supplements. In addition, examination of Australian data by Lancaster and Hurst (2000) found that the risk of NTDs is higher for younger women, and studies referenced in Bower (2005) suggest that the risk of NTDs is higher for those in lower socioeconomic groups. However, it was not possible to disaggregate the projections by Indigenous status or other demographic classification because of lack of data.
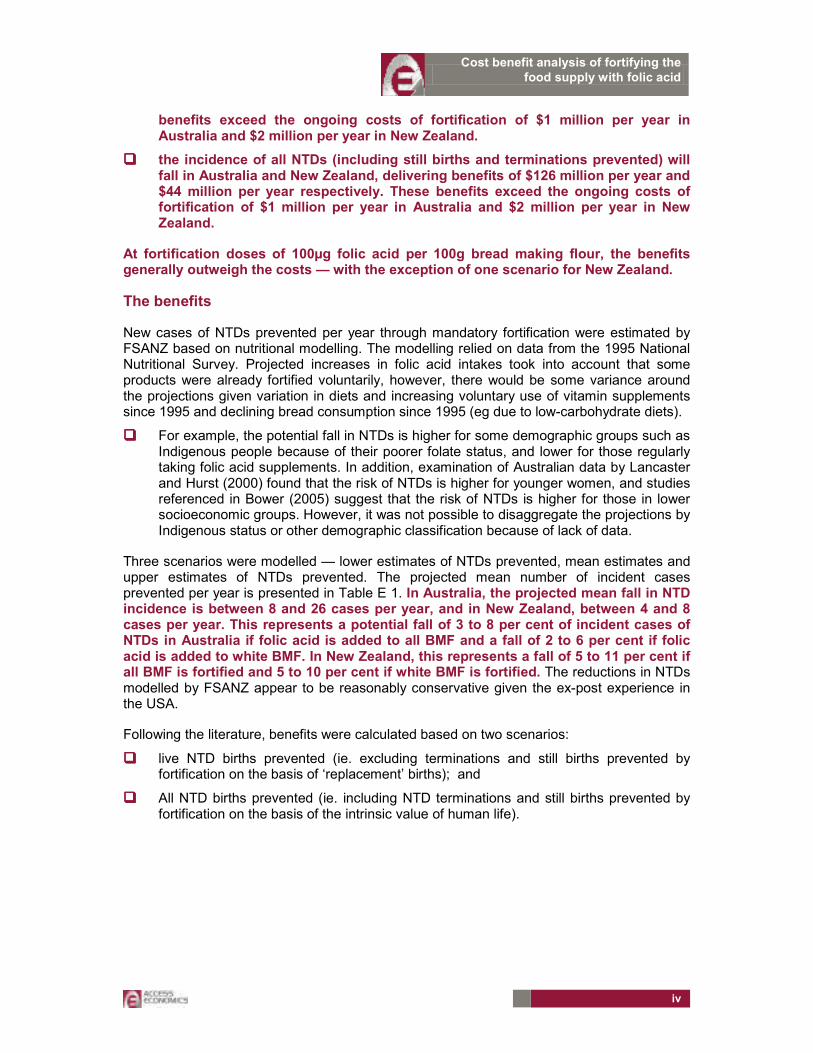
Three scenarios were modelled — lower estimates of NTDs prevented, mean estimates and upper estimates of NTDs prevented. The projected mean number of incident cases prevented per year is presented in Table E 1. In Australia, the projected mean fall in NTD incidence is between 8 and 26 cases per year, and in New Zealand, between 4 and 8 cases per year. This represents a potential fall of 3 to 8 per cent of incident cases of NTDs in Australia if folic acid is added to all BMF and a fall of 2 to 6 per cent if folic acid is added to white BMF. In New Zealand, this represents a fall of 5 to 11 per cent if all BMF is fortified and 5 to 10 per cent if white BMF is fortified. The reductions in NTDs modelled by FSANZ appear to be reasonably conservative given the ex-post experience in the USA.
Following the literature, benefits were calculated based on two scenarios:
���� live NTD births prevented (ie. excluding terminations and still births prevented by fortification on the basis of ‘replacement’ births); and
���� All NTD births prevented (ie. including NTD terminations and still births prevented by fortification on the basis of the intrinsic value of human life).

v
Cost benefit analysis of fortifying the food supply with folic acid
TABLE E 1 PROJECTED NUMBER OF NEURAL TUBE DEFECT INCIDENT CASES PREVENTED PER
YEAR (MEAN)
Food vehicle Folic acid content per 100g flour in the final
food
Total NTD incident cases
prevented (mean)
Live NTD births
prevented
Still NTD births
prevented
Termin-ations of
pregnancy prevented
µg folic acid No. per year
No. per year
No. per year
No. per year
Australia
All bread making 100 10.4 2.0 1.2 7.2
flour 200 26.0 5.0 3.0 18.0
White bread making 100 7.8 1.5 0.9 5.4
flour 200 20.8 4.0 2.4 14.4
New Zealand
All bread making 100 3.9 0.7 0.7 2.6
flour 200 7.9 1.3 1.3 5.2
White bread making 100 3.5 0.6 0.6 2.3
flour 200 7.0 1.2 1.2 4.6
Source: FSANZ modelling
The benefits are outlined for Australia in Table E 2 and for New Zealand in Table E 3 and include
���� the pain and suffering from disability and premature mortality avoided through fortification (disability adjusted life years (DALYs) avoided). The value of these in dollars is the net burden of disease.
���� Avoided outlays on health care and personal care (‘other costs’ in the table) — based on live NTD births prevented.
���� Production losses avoided through prevention of NTDs (the loss of lifetime earnings of people with NTDs who are not able to participate fully in the labour force, and of NTD pregnancies terminated or NTD still births who may otherwise have survived and accrued lifetime earnings).
���� Avoided efficiency losses that arise from lower taxation revenues and higher welfare payments as a result of the occurrence of NTDs.
The benefits of avoiding disability and premature death (the value of the net burden of disease) form the largest component of the benefits of mandatory fortification, followed by productivity losses avoided.

vi
Cost benefit analysis of fortifying the food supply with folic acid
TABLE E 2 SUMMARY OF BENEFITS OF MANDATORY FORTIFICATION, MEAN, 2005, AUSTRALIA
All bread making flour White bread making flour
Mean rise in folic acid intake
a
µg/day
40 100 30 80
Excluding still births and terminations
DALYs avoided 53 132 40 106
Net value of Burden of disease avoided (A$)
7,535,986 18,830,889 5,649,267 15,071,973
Health expenditure avoided (A$)
227,608 569,019 170,706 455,215
Avoided long term productivity loss (A$)
1,788,037 4,470,093 1,341,028 3,576,074
Other costs avoided (A$) 275,528 688,820 206,646 551,056
Efficiency loss avoided (A$) 213,904 534,760 160,428 427,808
Total (excluding still births and terminations)
10,041,063 25,093,582 7,528,075 20,082,127
Including still births and terminations
DALYs avoided 290 725 217 580
Net value of Burden of disease avoided (A$)
40,660,281 101,641,627 30,492,488 81,320,562
Health expenditure avoided (A$)
227,608 569,019 170,706 455,215
Avoided productivity loss (A$)
8,527,982 21,319,956 6,395,987 17,055,965
Other costs avoided (A$) 275,528 688,820 206,646 551,056
Efficiency loss avoided (A$) 593,700 1,484,250 445,275 1,187,400
Total (including still births and terminations)
50,285,100 125,703,672 37,711,101 100,570,198

vii
Cost benefit analysis of fortifying the food supply with folic acid
TABLE E 3 SUMMARY OF BENEFITS OF MANDATORY FORTIFICATION, MEAN, 2005, NEW ZEALAND
All bread making flour White bread making flour
Mean rise in folic acid intake
a
µg/day
65 131 57 115
Excluding still births and terminations
DALYs avoided 16 33 15 29
Net value of Burden of disease avoided (NZ$)
2,756,250 5,556,952 2,459,423 4,920,659
Health expenditure avoided (NZ$)
75,065 151,285 66,981 133,962
Avoided productivity loss (NZ$)
552,172 1,112,839 492,707 985,414
Other costs avoided (NZ$) 101,296 204,150 90,387 180,774
Efficiency loss avoided (NZ$) 46,449 93,613 41,447 82,894
Total (excluding still births and terminations)
3,531,232 7,118,839 3,150,945 6,303,704
Including still births and terminations
DALYs avoided 108 218 96 193
Net value of Burden of disease avoided (NZ$)
18,322,457 36,928,847 16,349,269 32,700,353
Health expenditure avoided (NZ$)
75,065 151,285 66,981 133,962
Avoided productivity loss (NZ$)
2,953,328 5,952,091 2,635,277 5,270,554
Other costs avoided (NZ$) 101,296 204,150 90,387 180,774
Efficiency loss avoided (NZ$) 141,535 285,248 126,293 252,586
Total (including still births and terminations)
21,593,681 43,521,621 19,268,207 38,538,229
The costs
As a result of mandatory fortification, consumers will face reduced choice and a slight increase in the price of bread. The cost of reduced choice was not quantified. It was beyond the scope of this brief to examine alternatives to mandatory fortification (such as expanding the range of voluntary fortification allowed). While in general, market based approaches are preferable to obligatory regimes, a voluntary fortification program including permissions for companies to use health claims introduced by FSANZ in the mid 1990s was found to be unsuccessful in substantially increasing consumption of folate.
Total industry compliance costs were calculated by multiplying the cost per kilo of bread making flour per year by the number of kilos of bread making flour produced per year.

viii
Cost benefit analysis of fortifying the food supply with folic acid
There is no formal measurement of bread making flour at the national level in Australia or New Zealand, and estimating production is difficult, particularly in New Zealand, where bread making flour is not a separately distinguished product. Australian millers are able to separately distinguish bread making flour by virtue of the fact that they are already required to fortify it with thiamine. Production costs were based on total production of up to 1,120,000 tonnes all bread making flour in Australia and up to 220,000 tonnes all bread making flour in New Zealand.
Separating white bread making flour for the purposes of fortification with folic acid is likely to be prohibitively expensive, and production costs were not separately estimated for this option. At least one large miller in Australia, and all of the large millers in New Zealand indicated that different flours are all derived from a white flour base. For example, in New Zealand, in most cases, bakers create wholemeal loaves by adding brans and wheat germ to white flour. In order to separately fortify white bread making flour, some Australian and all New Zealand firms would need to alter their production processes at considerable expense. The cost estimates in this study are therefore based on fortification of all bread making flour.
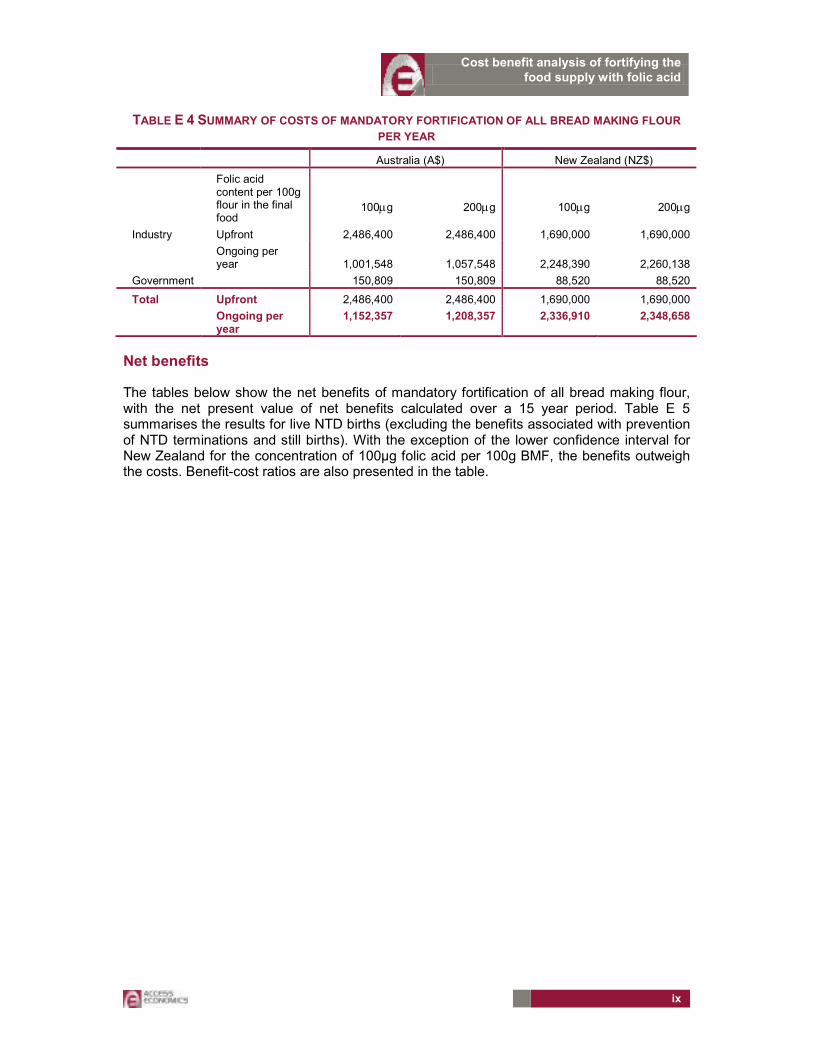
The costs to industry of mandatory fortification of all bread making flour with folic acid have been summarised in Table E 4.
Industry in both Australia and New Zealand would incur upfront costs associated with changing labelling. Changes to labelling pre-packaged products are likely to affect a large number of product lines because labelling standards require that the ingredients of a compound (such as bread making flour) be declared if the amount of the compound ingredient in the final food is 5 per cent or more by weight. New Zealand firms would also incur upfront costs associated with purchasing and installing new equipment. Feeder systems for thiamine are already in place in Australian mills, whereas there are no feeder systems currently in place in NZ. New Zealand millers also indicated that additional silos would be necessary in NZ to enable fortified and non-fortified flour to be stored separately. Upfront costs for Australian industry would be around A$2.5million, and in New Zealand, NZ$1.7million.
After the passing of these initial outlays, the recurrent costs per year (related to the purchase of folic acid, preparation of premix, analytical testing, flushing out mills, storage and administration) would fall to just over A$1million in Australia and up to NZ$2.4million in New Zealand. The higher ongoing (or yearly costs) for New Zealand firms reflect higher cost estimates provided by New Zealand millers in relation to flushing out mills to remove traces of folic acid, and also higher estimates of the cost associated with preparation of folic acid premix.
Access Economics’ estimates for the annual costs of government administration and enforcement of mandatory fortification in both Australia and New Zealand include the costs of awareness raising and training, compliance auditing, administration and enforcement (dealing with complaints). These costs are outlined in Table E 4.
ix
Cost benefit analysis of fortifying the food supply with folic acid
TABLE E 4 SUMMARY OF COSTS OF MANDATORY FORTIFICATION OF ALL BREAD MAKING FLOUR
PER YEAR
Australia (A$) New Zealand (NZ$)
Folic acid content per 100g flour in the final food
100µg
200µg
100µg
200µg
Industry Upfront 2,486,400 2,486,400 1,690,000 1,690,000
Ongoing per year 1,001,548 1,057,548 2,248,390 2,260,138
Government 150,809 150,809 88,520 88,520
Total Upfront 2,486,400 2,486,400 1,690,000 1,690,000
Ongoing per year
1,152,357 1,208,357 2,336,910 2,348,658
Net benefits
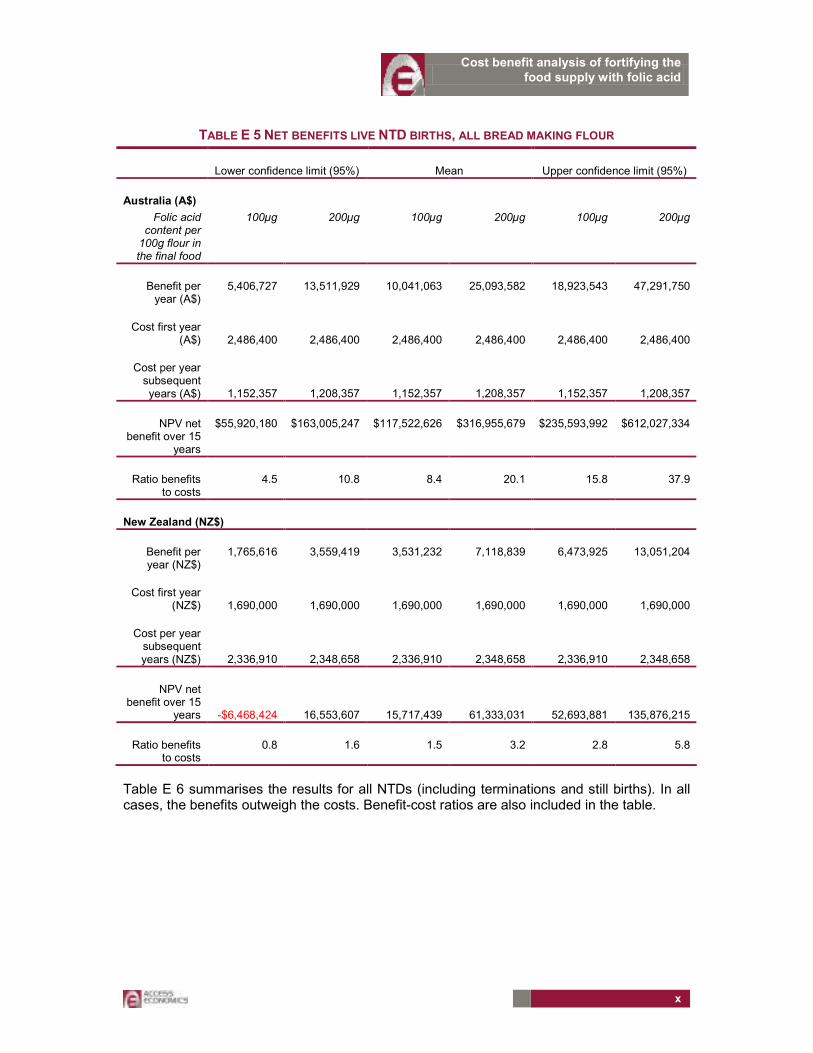
The tables below show the net benefits of mandatory fortification of all bread making flour, with the net present value of net benefits calculated over a 15 year period. Table E 5 summarises the results for live NTD births (excluding the benefits associated with prevention of NTD terminations and still births). With the exception of the lower confidence interval for New Zealand for the concentration of 100µg folic acid per 100g BMF, the benefits outweigh the costs. Benefit-cost ratios are also presented in the table.
x
Cost benefit analysis of fortifying the food supply with folic acid
TABLE E 5 NET BENEFITS LIVE NTD BIRTHS, ALL BREAD MAKING FLOUR
Lower confidence limit (95%) Mean Upper confidence limit (95%)
Australia (A$)
Folic acid content per 100g flour in the final food
100µg 200µg 100µg 200µg 100µg 200µg
Benefit per year (A$)
5,406,727 13,511,929 10,041,063 25,093,582 18,923,543 47,291,750
Cost first year (A$) 2,486,400 2,486,400 2,486,400 2,486,400 2,486,400 2,486,400
Cost per year subsequent years (A$) 1,152,357 1,208,357 1,152,357 1,208,357 1,152,357 1,208,357
NPV net benefit over 15
years
$55,920,180 $163,005,247 $117,522,626 $316,955,679 $235,593,992 $612,027,334
Ratio benefits to costs
4.5 10.8 8.4 20.1 15.8 37.9
New Zealand (NZ$)
Benefit per year (NZ$)
1,765,616 3,559,419 3,531,232 7,118,839 6,473,925 13,051,204
Cost first year (NZ$) 1,690,000 1,690,000 1,690,000 1,690,000 1,690,000 1,690,000
Cost per year subsequent years (NZ$) 2,336,910 2,348,658 2,336,910 2,348,658 2,336,910 2,348,658
NPV net benefit over 15
years
-$6,468,424 16,553,607 15,717,439 61,333,031 52,693,881 135,876,215
Ratio benefits to costs
0.8 1.6 1.5 3.2 2.8 5.8
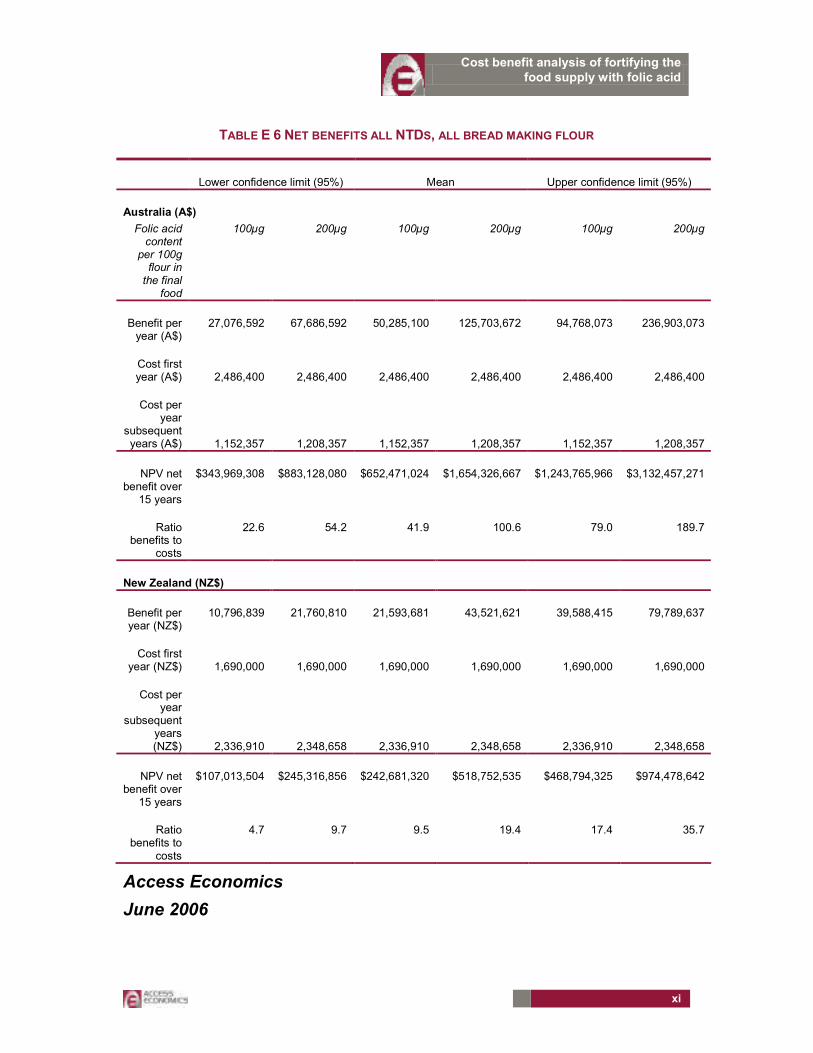
Table E 6 summarises the results for all NTDs (including terminations and still births). In all cases, the benefits outweigh the costs. Benefit-cost ratios are also included in the table.
xi
Cost benefit analysis of fortifying the food supply with folic acid
TABLE E 6 NET BENEFITS ALL NTDS, ALL BREAD MAKING FLOUR
Lower confidence limit (95%) Mean Upper confidence limit (95%)
Australia (A$)
Folic acid content
per 100g flour in the final
food
100µg 200µg 100µg 200µg 100µg 200µg
Benefit per year (A$)
27,076,592 67,686,592 50,285,100 125,703,672 94,768,073 236,903,073
Cost first year (A$) 2,486,400 2,486,400 2,486,400 2,486,400 2,486,400 2,486,400
Cost per year
subsequent years (A$) 1,152,357 1,208,357 1,152,357 1,208,357 1,152,357 1,208,357
NPV net benefit over
15 years
$343,969,308 $883,128,080 $652,471,024 $1,654,326,667 $1,243,765,966 $3,132,457,271
Ratio benefits to
costs
22.6 54.2 41.9 100.6 79.0 189.7
New Zealand (NZ$)
Benefit per year (NZ$)
10,796,839 21,760,810 21,593,681 43,521,621 39,588,415 79,789,637
Cost first year (NZ$) 1,690,000 1,690,000 1,690,000 1,690,000 1,690,000 1,690,000
Cost per year
subsequent years (NZ$) 2,336,910 2,348,658 2,336,910 2,348,658 2,336,910 2,348,658
NPV net benefit over
15 years
$107,013,504 $245,316,856 $242,681,320 $518,752,535 $468,794,325 $974,478,642
Ratio benefits to
costs
4.7 9.7 9.5 19.4 17.4 35.7
Access Economics
June 2006

Cost benefit analysis of fortifying the food supply with folic acid
1
1. INTRODUCTION
Food Standards Australia New Zealand (FSANZ) commissioned Access Economics in March 2006 to investigate the benefits and costs of fortifying white bread making flour or all bread making flour in Australia and New Zealand with folic acid.
Folic acid is the synthetic form of folate, a B group vitamin found in fresh, raw or lightly cooked vegetables, raw fruit, breads, cereals, dried beans and peas. Folate deficiency among women of child bearing age has been linked to an increase in the relative risk of occurrence of infants with neural tube defects (NTDs), including spina bifida, anencephaly and encephalocele (see for example, Grosse et al 2006). However, even where folic acid intake during the peri conceptional period is adequate, some proportion of NTDs may still occur because of genetic or other factors.
Neural tube defects develop in the first four weeks of pregnancy often before the pregnancy has been confirmed. Fortification of food was therefore proposed as a way to address the potential impacts of folate deficiency in women with unplanned pregnancies or in demographic groups who may miss public health education programs or who are unable to access folic acid supplements.
Voluntary fortification was permitted in Australia in 1995 and in New Zealand in 1996. A pilot allowing companies to make a health claim on product labels describing the link between folate intake and a reduction in the risk of development of NTDs was introduced in 1998. However, few companies added folate on a long term basis (pers. comm. FSANZ 15 March). An interim evaluation of the voluntary folate fortification policy (Abraham and Webb 2001) concluded that the public health objectives of the program were not met and participation by food industries in the program was low.
Mandatory fortification of white bread making flour or all bread making flour (see the glossary and acronyms for the products covered) was therefore proposed by FSANZ. The purpose of this study is to analyse the costs and benefits of the proposal with the following provisos:
���� Complementary or alternative interventions such as public health education programs and encouraging those in the target group to take supplements are not in the purview of the FSANZ and are therefore outside the scope of this brief. Access Economics notes a number of possible alternatives in this area, for example, in the Netherlands, information about folic acid was provided in pharmacies to women taking oral contraceptives. Research suggested this approach was associated with a relative increase in the use of folic acid by the target group (Meijer et al 2005).
���� The brief does not include consideration of other vehicles for fortification, although alternative food vehicles were suggested during discussions with industry. Some alternative vehicles being considered in other countries (such as oral contraceptives being considered in the USA) are in any case outside the purview of FSANZ.
���� While the health benefits of folic acid intake, in addition to a reduction in the occurrence of NTDs, are the topic of some research, these are not in the scope of this brief. Moreover, the potential for other benefits has not been confirmed. The health risk-benefit assessment commissioned by FSANZ found that while folate probably exerts a protective effect on cardiovascular disease, the evidence for other possible protective effects is less conclusive. In addition, it is not known whether folic acid can reduce the severity of the NTDs that occur. For example, US research suggested that the first year survival rate of infants with spina bifida improved after fortification was introduced but

Cost benefit analysis of fortifying the food supply with folic acid
2
did not for those with encephalocele (Bol et al 2006). It is therefore likely that any potential additional health benefits associated with folic acid intake, if they had been included in this cost benefit analysis, would have been valued at zero.
���� The health risk-benefit assessment commissioned by FSANZ also concluded that folic acid intakes of less than 1.0 mg per day present no risk to health. Any potential for adverse effects associated with folic acid fortification have been costed at zero.1 It is worth noting, however, that there was scientific uncertainty about the impact of unmetabolised circulating folic acid and a predicted possible small increase in twinning (of less than 5 per cent) (see the draft assessment report by FSANZ, P295).
1.1 METHOD — COST BENEFIT ANALYSIS
The cost benefit analysis in this report compares the benefits of a reduction in the occurrence of NTDs as a result of mandatory fortification of bread making flour with folic acid, with the costs to industry and government associated with mandatory fortification.
Costs avoided through decreased occurrence of NTDs (the benefits) minus Costs of mandatory fortification = Net benefit (+ or -)
The analysis of benefits focuses on the costs avoided as a result of new cases of NTDs that could be prevented in future. The costs avoided through a fall in the occurrence of NTDs include pain and suffering from disability and premature mortality, outlays on health care and personal care, production losses, and efficiency losses that arise from lower taxation revenues and higher welfare payments. These are described and estimated in chapter 4.
The costs of mandatory fortification include the costs to government of administering and enforcing mandatory fortification and the costs to industry of fortifying their product. These costs are outlined in chapter 5.
Chapter 2 summarises international experience with mandatory fortification, and chapter 3 describes the neural tube defects covered by this analysis and the assumptions made in calculating the net benefits.
A summary of the CBA method and data sources is provided in Table 1:1.
1 The assessment covered toxicity (including interactions with zinc), masking of vitamin B12 deficiency, interactions between folate and other drugs (including anti-epileptic drugs, anti-folate drugs and anti-inflammatory drugs), and associations between folate and an increased risk of cancer.

Cost benefit analysis of fortifying the food supply with folic acid
3
TABLE 1:1: FRAMEWORK FOR CBA OF PROPOSAL FOR MANDATORY FORTIFICATION OF BREAD
MAKING FLOUR WITH FOLIC ACID
Cost/Benefit category Data source Measure New case (person with NTD)
Years to life expectancy for person with
NTD
Examples of benefits due to reduced occurrence of neural tube defects (1)
$ $,$,$…
Reduced pain, suffering and premature mortality
Mathers et al 1999, & evidence of life expectancy and infant death rates
NPV of $ value of DALYs
Avoided expenditure on health care
AIHW, NZHIS, primary sources, spina bifida community
NPV of lifetime health care costs
Avoided loss in productivity (loss of labour resource because person with an NTD works fewer hours than otherwise or cannot take paid work)
ABS and Statistics NZ labour force data, spina bifida community
NPV of lifetime earnings foregone
Reduced hours of informal care (unpaid care) allowing unpaid carers to switch to paid work or housework.
ABS and Statistics NZ labour force data, spina bifida community
NPV of the carers’ earnings foregone
Avoided expenditure on other types of care, aids and modifications, etc
Primary data sources and spina bifida community
NPV of lifetime costs avoided
Avoided efficiency costs associated with raising taxes and making welfare payments
Centrelink and Ministry of Health NZ
Proportion of total welfare payments and tax revenue foregone
Examples of costs (2) Costs to flour millers of fortifying bread making flour
Data provided by industry
$
Costs to governments of administering and enforcing the regulations
Data provided by government
$
Net benefits: (2)-(1)

Cost benefit analysis of fortifying the food supply with folic acid
4
2. RELATED EXPERIENCE
This section outlines related experience with mandatory fortification in Australia and elsewhere, including other assessments of the net benefits of fortification with folic acid.
AUSTRALIA
A similar requirement to fortify all bread making flour with thiamine was introduced in Australia in 1991, but no cost benefit analysis was undertaken and there has not been a review of these regulations.
INTERNATIONAL
FSANZ initial assessment report (FSANZ 2004) outlines the mandatory fortification policies in place in Africa, the Middle East, North America, the USA, South America and South East Asia (p. 61). These involve a range of flour or grain related food vehicles and dose rates. For example, the US Food and Drug Administration required mandatory fortification of enriched2 cereal grain products with 1.4mg folic acid per kilogram cereal grain from 1 January 1998. Canada followed suit later in 1998 with a slightly higher dose (1.5mg per kilogram of flour, bread or pasta).
���� Evidence from the United States, Canada, Costa Rica and Chile suggest that mandatory fortification policies in these countries have been associated with a reduction in the incidence of spina bifida and anencephaly of approximately 30 to 50 per cent on average (Grosse et al 2006).
���� Grosse et al (2005) noted research findings that after the implementation of mandatory fortification in the US, the incidence of NTDs (including prenatally ascertained NTDs) decreased by around 30 per cent.
���� The highest proportions of NTDs prevented have been recorded in areas where dietary folate intake was initially limited and or the baseline NTD rate relatively high. For example, Liu et al (2004) found that mandatory fortification of food with folic acid in Newfoundland, Canada was associated with a reduction in NTDs of 78 per cent.
All of these studies compare NTD rates before and after fortification and attribute all of the decrease in NTDs to fortification. However, falls in NTD rates need to be attributed with care, given concerns about data quality (eg. coverage of terminations)3 and other factors which determine NTDs (genetic and environmental factors, and changes in dietary behaviour over time for example).
Few cost benefit analyses (CBAs) have been undertaken of these fortification policies. Comparisons across countries of CBAs are difficult because of differences in costing methodology, cross-country policy differences (for example, different fortification dosage requirements and food vehicles) and possible differences in industry technologies. That said,
2 In the US, enriched refers to the addition of a nutrient to a food that has been lost during the course of food processing or during normal storage and handling up to the nutrient’s level in the food before the processing storage and handling.
3 Lancaster and Hurst 2000 examined data for 1991 to 1997 and found it was not possible to determine national trends in the incidence of NTDs over time because of the variable ascertainment of terminations (Lancaster and Hurst 2000 p.16 and pers. comm. NPSU 15 March 2006).

Cost benefit analysis of fortifying the food supply with folic acid
5
other cost benefit analyses have indicated that folic acid fortification of flour in New Zealand and enriched cereal products in the US is (or would be) associated with net benefits.
���� An ex-ante cost benefit analysis undertaken in New Zealand (Singh and Elliott 1997) found that preventing one spina bifida birth per year would pay for the entire fortification proposal in New Zealand. Variable costs were estimated at $201,780 per year (based on a folic acid price of $300 per kg (compared with $30-$50 per kg currently) and a dose of 100micrograms folic acid per 35g of flour. Machinery costs were estimated at $20,000, and changes to ingredients labelling and packaging at $50,000. The average cost of each spina bifida birth (assuming 20 years of life) was $355,000 — however, this included income support payments and was not discounted. The analysis did not include productivity costs or burden of disease estimates.
���� Grosse et al (2005) undertook an ex-post cost benefit analysis of the requirement for mandatory fortification of enriched cereal grain products with folic acid in the US (see above). The large percentage reduction in NTDs (including prenatally ascertained) in the US (30 per cent) associated with mandatory fortification was attributed in part to “overages” (amounts of folic acid added in excess of the required dose to ensure compliance with the content requirements). Grosse et al (2005) concluded a net benefit of between $306 and $422 million per year. The only health benefit considered was the prevention of spina bifida and anencephaly births. NTD affected pregnancies not ending in live birth were excluded because of the relatively low direct costs and difficulties with the attribution of indirect costs as well as the issue of costs associated with replacement births. Results were calculated for two scenarios. The base case assumed that: all of the observed reduction in NTD births was attributable to folic acid fortification, there were no cases of adverse effects from fortification, and fortification costs were limited to folic acid costs and nutrition label changes (around $3 million per year). Folic acid fortification was assumed to add no extra cost to food analytic testing by manufacturers. The worst case scenario assumed that fortification was responsible for 80 per cent of the observed reduction in NTD births, that fortification was associated with 500 cases per year of adverse effects (neurological damage), and that annual fortification costs were twice those assumed in the base case scenario.

Cost benefit analysis of fortifying the food supply with folic acid
6
3. NEURAL TUBE DEFECTS
This section describes the neural tube defects covered in this analysis and their incidence, and outlines the assumptions used to calculate the benefits associated with reducing the occurrence of NTDs including: the gender split for those with an NTD, the treatment of terminations and still births, the longevity of those living with NTDs, survival rates of live born infants beyond the age of one, and disease weights.
Neural tube defects include spina bifida, anencephaly and encephalocele.
Spina bifida occurs when incomplete closure of the neural tube results in the spinal cord being exposed or protruding through a gap in the spine. This may result in the spinal nerves not developing properly. This condition can result in minor to severe impacts including:
���� leg paralysis or weakness (reducing mobility) and reduced sensation (increasing the susceptibility to burns and pressure sores);
���� lack of bowel or bladder control;
���� hydrocephalus and the Arnold Chiari malformation (resulting in a range of brain function disabilities).;
���� epilepsy and visual problems;
���� intellectual impairment (in a small proportion of cases).
Surgery is generally performed soon after birth to repair the spinal lesion and to insert a shunt where required for those with hydrocephalus. Shunts are often revised and may need replacement. Infections of the central nervous system (possibly caused by a shunt infection) and renal tract (most commonly urinary tract due to use of catheters) are also relatively frequent. Bone fractures or hip dislocation may also occur.
Anencephaly involves failure of the anterior neural tube to close, resulting in the total or partial absence of the cranial vault and brain tissue. It is always lethal and the majority of these pregnancies are terminated (Lancaster and Hurst 2000).
Encephalocele occurs less commonly than spina bifida or anencephaly and may result in a life long intellectual disability or a developmental delay. Infants with encephalocele are born with a gap in skull through which part of the brain protrudes and surgery may be required to repair the encephalocele. Hydrocephalus, cerebral palsy, epilepsy or poor vision may also be associated with encephalocele. There is little information in the literature available about the implications of this condition for quality and length of life.
Spina bifida and anencephaly accounted for 91 per cent of all cases of NTDs in Australia and New Zealand between 1999 and 2003.4
4 Based on data reported by FSANZ from South Australian, Victorian and Western Australian Birth Defects Registers and the New Zealand Ministry of Health Birth Defects Monitoring Program.

Cost benefit analysis of fortifying the food supply with folic acid
7
3.1 INCIDENCE OF NEURAL TUBE DEFECTS
It is important to include terminations in estimates of the incidence of NTDs because prenatal screening of pregnant women enables diagnosis of neural tube defects during fetal life, and prenatal diagnosis of neural tube defects often results in pregnancy termination.
The completeness of Australian data for terminations of pregnancy is uncertain in most states and territories. South Australian, Western Australian and Victorian data are the most reliable. Hence, the counts of incidence from these states are used a guide for Australia as a whole. Incidence refers to new (diagnosed) cases of NTDs.
The incidence of NTDs in SA, Victoria and WA during the period 1999–2003 was 1.32 per 1000 total births. Nearly 70 per cent of all new cases of NTDs resulted in terminations of pregnancy. For the three states combined during that period, the incidence of:
���� spina bifida was 0.64 per 1000;
���� anencephaly was 0.56 per 1000 total births; and
���� encephalocele, 0.12 per 1000.5
Applying these rates to Australia as a whole in 2002 implies incidence of around 338 NTDs that year (67 live births, 36 stillbirths and 235 terminations of pregnancy).6
The incidence of NTDs in New Zealand during the period 1999–2000 was 0.66 per 1000 live births and still births. Terminations are excluded from this rate. Expert advice obtained by FSANZ suggests it is valid to assume that terminations of pregnancy occur to a similar extent in New Zealand as in Australia, and hence the overall incidence is assumed to be the same in both countries.7 Given this assumption, there were around 72 NTDs in New Zealand in that year.
Evidence suggests that the incidence rates of NTDs vary by age of mother, socioeconomic status, Indigenous status and gender.
���� Between 1991 and 1997, the incidence of NTDs was highest among teenage mothers (Lancaster and Hurst 2000, p. 13).
���� There is evidence that the incidence of NTDs among Indigenous infants is around twice that of non-Indigenous infants (Bower et al (2004) for Western Australia, and Lancaster and Hurst (2000) for Australia — although the latter noted their finding was based on records in which Indigenous status was incompletely identified and around 80 per cent of data for terminations was missing). On the other hand, NTD rates appear similar or slightly lower in Maori compared with non-Maori populations (Barman et al. 1993).
���� Bower et al 2005 cite research finding a link between socioeconomic status and NTDs (p. 441).
���� While Lancaster and Hurst (2000) found that between 1991 and 1997 the number of females exceeded the number of males among births and among terminations of pregnancy for all types of neural tube defects, AIHW health expenditure data suggest
5 Data reported by FSANZ from South Australian, Victorian and Western Australian Birth Defects Registers.
6 It is difficult to calculate a similar number for New Zealand without requesting data. The births data available on the Statistics New Zealand web site include only live births.
7 Data reported by FSANZ from the New Zealand Ministry of Health Birth Defects Monitoring Program.

Cost benefit analysis of fortifying the food supply with folic acid
8
that in 2005, males accounted for 50 per cent of health related spina bifida expenditure between the ages 0 to 4 years. While the latter may mean that males use health services more than females, this would not be not consistent with evidence for the general population. The analysis below assumes equal prevalence of NTDs by gender, which, if it understates the proportion of females in total NTDs, could tend to understate the benefits of fortification because women tend to live longer than men.
3.2 TREATMENT OF TERMINATIONS AND STILL BIRTHS
Two scenarios will be created for the purposes of calculating burden of disease (BOD):
���� Assessment of benefits based only on live NTD births (terminations and still births will be excluded from BOD estimates on the basis of ‘replacement’ births (eg. Grosse et al 2005)); and
���� Assessment of the benefits based on all NTD births (terminations and still births will be included in BOD estimates on the basis that healthy life is of intrinsic value to the person (from utility valuations and willingness to pay literature – see Section 4.2.1)).
3.3 INFANT SURVIVAL AND LIFE EXPECTANCY
3.3.1 SPINA BIFIDA
Mathers et al (1999) based their estimates of burden of disease associated with spina bifida for 1996 on life expectancy estimates of 68.1 years for males and 73.8 years for females. Those authors suggest that these estimates may overestimate life expectancy for people with spina bifida. Access Economics was unable to verify this in the literature. We note that advances in medical technology and improvements in the quality of health care mean that there is a relatively good prognosis for those who survive beyond infancy — for example, shunts for the treatment of hydrocephalus (introduced in the 1950s), the development of antibiotics to treat central nervous system infections, and improvements in diagnostics and imaging. In addition, discussions with the spina bifida community suggested that those who survive infancy are likely to have a life expectancy close to the average.
Average life expectancy in Australia between 2001 and 2003 for males was 77.8 years and for females was 82.8 years8 and in New Zealand between 2000 and 2002 was 76.3 years for males and 81.1 years for females.9 Since the Mathers et al (1999) estimates suggest a slightly shorter life expectancy, these will be used as the basis for analysis for both countries.
The proportion of infants with spina bifida who survive beyond one year of age in both Australia and New Zealand is likely to be in the range 70 to 90 per cent.
���� In WA, during the period 1986 to 1990, 71 per cent of live born infants with spina bifida survived to one year and 70 per cent to five years (Kalucy et al 1994).
���� From the late 1990s to 2004, Australian death rates for those aged less than one with spina bifida suggest that on average, around 84 per cent of live births with spina bifida survived to at least one year of age.
8 ABS (Australian Bureau of Statistics), Deaths Australia, 2005, cat. No. 3302.0.
9 Statistics New Zealand http://www2.stats.govt.nz/domino/external/pasfull/pasfull.nsf/7cf46ae26dcb6800cc256a62000a2248/4c2567ef00247c6acc256e66008235aa?OpenDocument accessed 9 April 2006
Cost benefit analysis of fortifying the food supply with folic acid
9
���� Waitzman et al 2005 cite research suggesting an improvement in survival among infants born with spina bifida in Atlanta between 1979 and 1994. Survival to one year of age was 82.7% in the 1979-83 birth cohort, 88.5% in the 1984-88 birth cohort, and 91.0% in the 1989-94 birth cohort. Waitzman noted other research findings that observed one-year survival of 80.3% in the 1983-86 California birth cohort. The Atlanta study reported 92 per cent survival to five years of age among children who survived infancy (Waitzman et al 2005).
For the purposes of this report, Access Economics has assumed a survival rate of infants beyond the age of one year of 80 per cent.
3.3.2 ANENCEPHALY
Anencephaly is invariably fatal. In WA, between 1966 and 1990, no infant with anencephaly survived longer than 5 days, and around 76 per cent died within 24 hours (Kalucy et al 1994). Mathers et al (1999) used a life expectancy estimate of one week, which is also used here.
3.3.3 ENCEPHALOCELE
Among live born infants in Australia, 73.6% of infants with encephalocele survived at least 28 days during the period 1991 to 1997 (Lancaster and Hurst 2000). According to Kalucy et al (1994), between 1966 and 1990 in WA, around 60 per cent were alive at 12 months and 50 per cent were alive at 10 years. Discussions with a medical expert suggest that life expectancy and infant survival rates would be similar to those of people with spina bifida, and this will provide the basis for the estimates here.
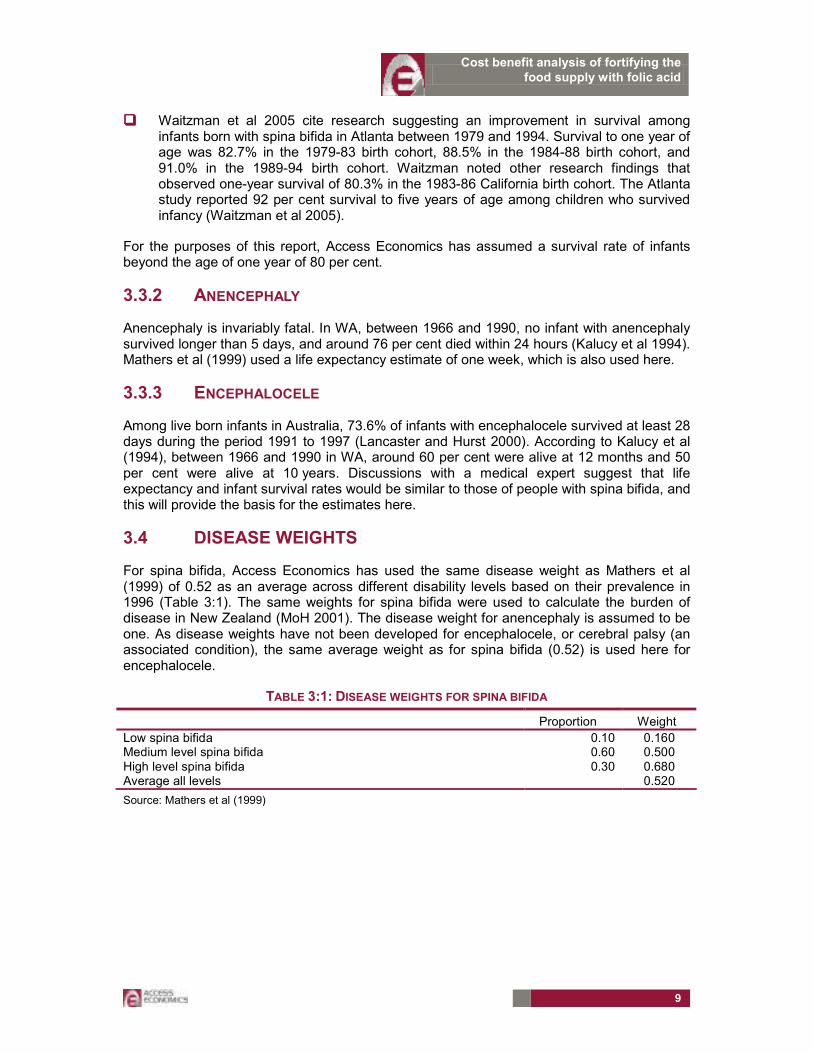
3.4 DISEASE WEIGHTS
For spina bifida, Access Economics has used the same disease weight as Mathers et al (1999) of 0.52 as an average across different disability levels based on their prevalence in 1996 (Table 3:1). The same weights for spina bifida were used to calculate the burden of disease in New Zealand (MoH 2001). The disease weight for anencephaly is assumed to be one. As disease weights have not been developed for encephalocele, or cerebral palsy (an associated condition), the same average weight as for spina bifida (0.52) is used here for encephalocele.
TABLE 3:1: DISEASE WEIGHTS FOR SPINA BIFIDA
Proportion Weight
Low spina bifida 0.10 0.160 Medium level spina bifida 0.60 0.500 High level spina bifida 0.30 0.680 Average all levels 0.520
Source: Mathers et al (1999)

Cost benefit analysis of fortifying the food supply with folic acid
10
4. THE BENEFITS OF MANDATORY FORTIFICATION
This section estimates the benefits of mandatory fortification, which (as noted in section 1.1) equate to the economic costs avoided through the prevention of NTDs. If the number of NTDs can be reduced, the resources that must be devoted to supplying medical and other care to children with NTDs can be allocated elsewhere. The economic costs per person with an NTD are estimated and then applied to projections of NTDs avoided through mandatory fortification (see projections provided by FSANZ below). The estimates of costs include:
���� the costs associated with morbidity and premature death;
���� health system expenditure;
���� losses in production due to premature death or morbidity of those affected by NTDs and their carers;
���� other non-health system costs (for example, the costs of aids and modifications);
���� efficiency losses associated with the cost of administering welfare payments, and raising additional taxes.
4.1 PROJECTIONS OF THE NTDS PREVENTED
Research and modelling undertaken by FSANZ for Australia and New Zealand suggests that the proportion of NTDs that are preventable increases from 8 to 44 per cent as folic acid intake increases from present intakes by 0.1 to 1.0 mg per day.
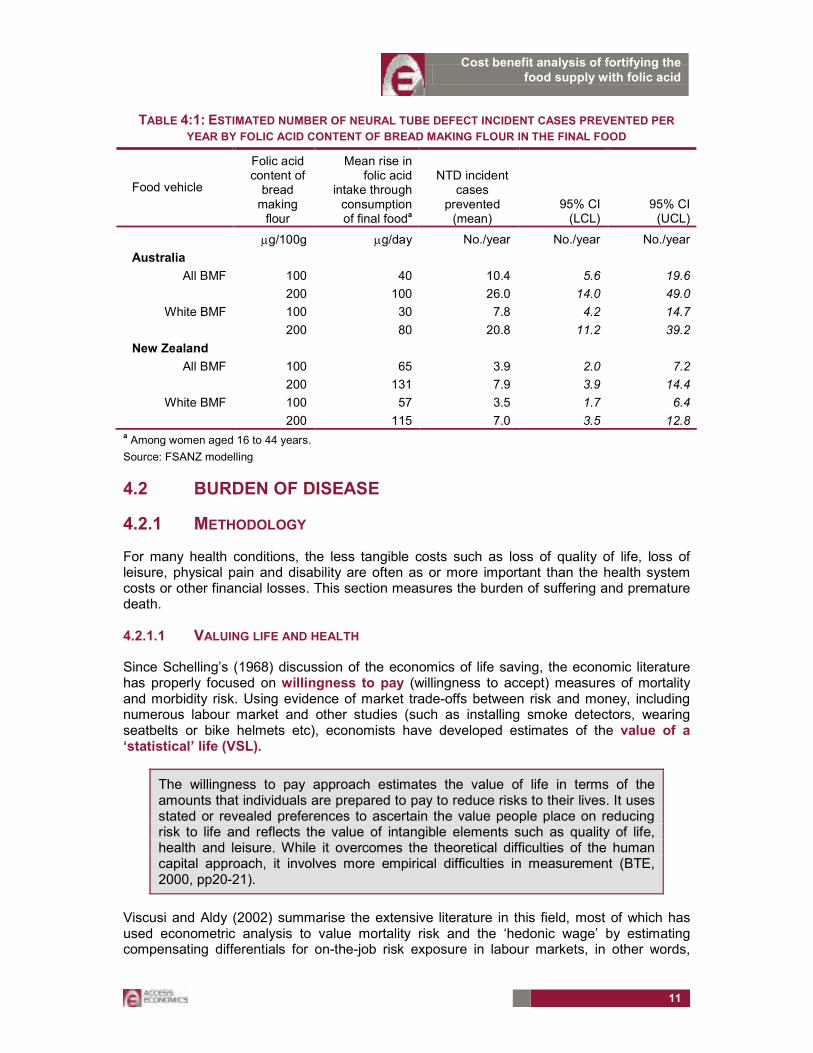
Projections of the number of neural tube defects prevented per year as a consequence of mandatory fortification were provided to Access Economics by FSANZ and are shown in Table 4:1. The estimates of NTDs prevented are based on consumption of folic acid as part of the final product.
The modelling relied on data from the 1995 National Nutritional Survey. Projected increases in folic acid intakes took into account that some products were already fortified voluntarily, however, there would be some variance around the projections given variation in diets and use of vitamin supplements.
���� The potential fall in NTDs is higher for some demographic groups such as Indigenous people because of their poorer folate status, and lower for those regularly taking folic acid supplements. However, it has not been possible to disaggregate the projections by Indigenous status.
In Australia, the projected mean fall in NTD incidence is between 8 and 26 cases, and in New Zealand, between 4 and 8 cases. This represents a potential fall of 3 to 8 per cent of incident cases of NTDs in Australia if folic acid is added to all BMF and a fall of 2 to 6 per cent if folic acid is added to white BMF. In New Zealand, this represents a fall of 5 to 11 per cent if all BMF is fortified and 5 to 10 per cent if white BMF is fortified.
In order to undertake the cost benefit analysis, the data in Table 4:1 were converted into estimates of the number of each of the three types of NTDs prevented (spina bifida, anencephaly and encephalocele) based on their proportions of NTD live births, still births and terminations respectively for each country. These estimates are provided in Appendix A.
Cost benefit analysis of fortifying the food supply with folic acid
11
TABLE 4:1: ESTIMATED NUMBER OF NEURAL TUBE DEFECT INCIDENT CASES PREVENTED PER
YEAR BY FOLIC ACID CONTENT OF BREAD MAKING FLOUR IN THE FINAL FOOD
Food vehicle
Folic acid content of bread making flour
Mean rise in folic acid
intake through consumption of final fooda
NTD incident cases
prevented (mean)
95% CI (LCL)
95% CI (UCL)
µg/100g µg/day No./year No./year No./year
Australia
All BMF 100 40 10.4 5.6 19.6 200 100 26.0 14.0 49.0
White BMF 100 30 7.8 4.2 14.7 200 80 20.8 11.2 39.2
New Zealand
All BMF 100 65 3.9 2.0 7.2 200 131 7.9 3.9 14.4
White BMF 100 57 3.5 1.7 6.4 200 115 7.0 3.5 12.8
a Among women aged 16 to 44 years.
Source: FSANZ modelling
4.2 BURDEN OF DISEASE
4.2.1 METHODOLOGY
For many health conditions, the less tangible costs such as loss of quality of life, loss of leisure, physical pain and disability are often as or more important than the health system costs or other financial losses. This section measures the burden of suffering and premature death.
4.2.1.1 VALUING LIFE AND HEALTH
Since Schelling’s (1968) discussion of the economics of life saving, the economic literature has properly focused on willingness to pay (willingness to accept) measures of mortality and morbidity risk. Using evidence of market trade-offs between risk and money, including numerous labour market and other studies (such as installing smoke detectors, wearing seatbelts or bike helmets etc), economists have developed estimates of the value of a ‘statistical’ life (VSL).
The willingness to pay approach estimates the value of life in terms of the amounts that individuals are prepared to pay to reduce risks to their lives. It uses stated or revealed preferences to ascertain the value people place on reducing risk to life and reflects the value of intangible elements such as quality of life, health and leisure. While it overcomes the theoretical difficulties of the human capital approach, it involves more empirical difficulties in measurement (BTE, 2000, pp20-21).
Viscusi and Aldy (2002) summarise the extensive literature in this field, most of which has used econometric analysis to value mortality risk and the ‘hedonic wage’ by estimating compensating differentials for on-the-job risk exposure in labour markets, in other words,
Cost benefit analysis of fortifying the food supply with folic acid
12
determining what dollar amount would be accepted by an individual to induce him/her to increase the possibility of death or morbidity by x%. They find the VSL ranges between US$4 million and US$9 million with a median of US$7 million (in year 2000 US dollars), similar but marginally higher than the VSL derived from US product and housing markets, and also marginally higher than non-US studies, although all in the same order of magnitude. They also review a parallel literature on the implicit value of the risk of non-fatal injuries.
A particular life may be regarded as priceless, yet relatively low implicit values may be assigned to life because of the distinction between identified and anonymous (or ‘statistical’) lives. When a ‘value of life’ estimate is derived, it is not any particular person’s life that is valued, but that of an unknown or statistical individual (Bureau of Transport and Regional Economics, 2002, p19).
Weaknesses in this approach, as with human capital, are that there can be substantial variation between individuals. Extraneous influences in labour markets such as imperfect information, income/wealth or power asymmetries can cause difficulty in correctly perceiving the risk or in negotiating an acceptably higher wage.
Viscusi and Aldy (2002) do not include any New Zealand studies in their meta-analysis (if they exist) but do include some Australian studies, notably Kniesner and Leeth (1991) of the Australian Bureau of Statistics (ABS) with VSL of US2000 $4.2 million and Miller et al (1997) of the National Occupational Health and Safety Commission (NOHSC) with quite a high VSL of US2000$11.3m-19.1 million (Viscusi and Aldy, 2002, Table 4, pp92-93). Since there are relatively few Australian studies and no New Zealand studies, there is also the issue of converting foreign (US) data to Australian or New Zealand dollars using either exchange rates or purchasing power parity and choosing a period.
Access Economics (2003a) presents outcomes of studies from Yale University (Nordhaus, 1999) – where VSL is estimated as US$2.66m; University of Chicago (Murphy and Topel, 1999) – US$5m; Cutler and Richardson (1998) – who model a common range from US$3m to US$7m, noting a literature range of US$0.6m to US$13.5m per fatality prevented (1998 US dollars). These researchers apply discount rates of 0% and 3% (favouring 3%) to the common range to derive an equivalent of US$75,000 to US$150,000 for a year of life gained.
4.2.1.2 DISABILITY AND QUALITY ADJUSTED LIFE YEARS (DALYS AND QALYS)
In an attempt to overcome some of the issues in relation to placing a dollar value on a human life, in the last decade an alternative approach to valuing human life has been derived. The approach is non-financial, where pain, suffering and premature mortality are measured in terms of Disability Adjusted Life Years (DALYs), with 0 representing a year of perfect health and 1 representing death (the converse of a QALY or “quality-adjusted life year” where 1 represents perfect health). This approach was developed by the World Health Organization, the World Bank and Harvard University and provides a comprehensive assessment of mortality and disability from diseases, injuries and risk factors in 1990, projected to 2020 (Murray and Lopez, 1996). Methods and data sources are detailed further in Murray et al (2001).
The DALY approach has been adopted and applied in Australia by the Australian Institute for Health and Welfare (AIHW) with a separate comprehensive application in Victoria. Mathers et al (1999) from the AIHW estimate the burden of disease and injury in 1996, including separate identification of premature mortality (YLL) and morbidity (YLD) components. In any year, the disability weight of a disease (for example, 0.18 for a broken wrist) reflects a

Cost benefit analysis of fortifying the food supply with folic acid
13
relative health state. In this example, 0.18 would represent losing 18% of a year of healthy life because of the inflicted injury.
Martin Tobias and the New Zealand Burden of Disease Study (NZBDS) team utilised the global and Australian studies to estimate the burden of disease for New Zealand (Ministry of Health, 2001). Estimates of YLL, YLD and DALYs for over 100 conditions in nine age groups for both genders and two major ethnic groups (Mäori and non-Mäori) are provided for the year 1996.
The DALY approach has been successful in avoiding the subjectivity of individual valuation and is capable of overcoming the problem of comparability between individuals and between nations, although nations have subsequently adopted variations in weighting systems. For example, in some countries DALYs are age-weighted for older people although in Australia the minority approach is adopted – valuing a DALY equally for people of all ages.
The main problem with the DALY approach is that it is not financial and is thus not directly comparable with most other cost measures. In public policy making, therefore, there is always the temptation to re-apply a financial measure conversion to ascertain the cost of an injury or fatality or the value of a preventive health intervention. Such financial conversions tend to utilise “willingness to pay” or risk-based labour market studies described above.
The Department of Health and Ageing (based on work by Applied Economics) adopted a very conservative approach to this issue, placing the value of a human life year at around A$60,000 per annum, which is lower than most international lower bounds on the estimate.
“In order to convert DALYs into economic benefits, a dollar value per DALY is required. In this study, we follow the standard approach in the economics literature and derive the value of a healthy year from the value of life. For example, if the estimated value of life is A$2 million, the average loss of healthy life is 40 years, and the discount rate is 5 per cent per annum, the value of a healthy year would be $118,000.10 Tolley, Kenkel and Fabian (1994) review the literature on valuing life and life years and conclude that a range of US$70,000 to US$175,000 per life year is reasonable. In a major study of the value of health of the US population, Cutler and Richardson (1997) adopt an average value of US$100,000 in 1990 dollars for a healthy year.
Although there is an extensive international literature on the value of life (Viscusi, 1993), there is little Australian research on this subject. As the Bureau of Transport Economics (BTE) (in BTE, 2000) notes, international research using willingness to pay values usually places the value of life at somewhere between A$1.8 and A$4.3 million. On the other hand, values of life that reflect the present value of output lost (the human capital approach) are usually under $1 million.
The BTE (2000) adopts estimates of $1 million to $1.4 million per fatality, reflecting a 7 per cent and 4 per cent discount rate respectively. The higher figure of $1.4 million is made up of loss of workforce productivity of $540,000, loss of household productivity of $500,000 and loss of quality of life of $319,000. This is an unusual approach that combines human capital and willingness to pay concepts and adds household output to workforce output.
10 In round numbers, $2,000,000 = $118,000/1.05 + $118,000/(1.05)
2 + … + $118,000/(1.05).
40 [Access
Economics comment: The actual value should be $116,556, not $118,000 even in round numbers.]

Cost benefit analysis of fortifying the food supply with folic acid
14
For this study, a value of $1 million and an equivalent value of $60,000 for a healthy year are assumed.11 In other words, the cost of a DALY is $60,000. This represents a conservative valuation of the estimated willingness to pay values for human life that are used most often in similar studies.12” (DHA, 2003, pp11-12).”
As the citation concludes, the estimate of $60,000 per DALY is very low. The Viscusi (1993) meta-analysis referred to reviewed 24 studies with values of a human life ranging between US$0.5 million and US$16m, all in pre-1993 US dollars. Even the lowest of these converted to 2003 Australian dollars at current exchange rates, exceeds the estimate adopted ($1m) by nearly 25%. The BTE study tends to disregard the literature at the higher end and also adopts a range (A$1-$1.4m) below the lower bound of the international range that it identifies (A$1.8-$4.3m).
The rationale for adopting these very low estimates is not provided. However, it is in the interests of fiscal restraint to select a relatively low estimate.
In contrast, the majority of the literature as detailed above appears to support a higher estimate for VSL, as presented in Table 4:2, which Access Economics believes is important to consider in disease costing applications and decisions. The US dollar values of the lower bound, midrange and upper bound are shown at left. The ‘average’ estimate is the average of the range excluding the high NOHSC outlier. Equal weightings are used for each study as the:
���� Viscusi and Aldy meta-analysis summarises 60 recent studies;
���� ABS study is Australian; and
���� Yale and Harvard studies are based on the conclusions of eminent researchers in the field after conducting literature analysis.
Where there is no low or high US dollar estimate for a study, the midrange estimate is used to calculate the average. The midrange estimates are converted to Australian dollars at purchasing power parity (as this is less volatile than exchange rates) of USD=0.7281AUD for 2003 as estimated by the OECD.
Access Economics concludes the VSL range in Australia lies between A$3.7m and A$9.6m13, with a mid-range estimate of A$6.5m. These estimates have not been inflated to 2005 prices, given the uncertainty levels. The VSL range in New Zealand lies between NZ$3.9 million and NZ$10.1m, with a mid-range estimate of NZ$6.9m.
Estimates at the lowest bound, A$3.7m and NZ$3.9m, are used in this study — justifiable in view of the difficulties in estimating the VSL, and in order to take a conservative approach to estimating the benefits of mandatory fortification. It is worth noting, however, that these lower bound estimates of VSL are higher than those adopted by the DHA (2003) discussed earlier.
11 The equivalent value of $60,000 assumes, in broad terms, 40 years of lost life and a discount rate of 5 per cent.
[Access Economics comment: More accurately the figure should be $58,278.]
12 In addition to the cited references in the text, see for example Murphy and Topel’s study (1999) on the
economic value of medical research. [Access Economics comment. Identical reference to our Murphy and Topel (1999).]
13 Calculated from the non-indexed studies themselves. Converting the Access Economics average estimates
from USD to AUD at PPP would provide slightly higher estimates - $3.9 million and $10.2m, with the same midrange estimate.

Cost benefit analysis of fortifying the food supply with folic acid
15
TABLE 4:2: ESTIMATES OF VSL, VARIOUS YEARS, US$, A$ AND NZ$
US$m A$m NZ$m
Lower Midrange Upper 0.7281 .6892
Viscusi & Aldy meta-analysis 2002
4 7 9 9.6 10.1
Australian: ABS 1991 4.2 5.8 6.1 NOHSC 1997 11.3 19.1 Yale (Nordhaus) 1999 2.66 3.7 3.9 Harvard (Cutler & Richardson) 1998
0.6 5 13.7 6.9 7.3
Average* 2.9 4.7 7.4 6.5 6.9
* Average of range excluding high NOHSC outlier, using midrange if no data; not inflated.
A$ and NZ$ conversions are at the OECD 2003 PPP rate.
4.2.1.3 DISCOUNT RATES
Choosing an appropriate discount rate for present valuations in cost analysis is a subject of some debate, and can vary depending on which future income or cost stream is being considered. There is a substantial body of literature, which often provides conflicting advice, on the appropriate mechanism by which costs should be discounted over time, properly taking into account risks, inflation, positive time preference and expected productivity gains.
The absolute minimum option that one can adopt in discounting future income and costs is to set future values in current day dollar terms on the basis of a risk free assessment about the future (that is, assume the future flows are similar to the certain flows attaching to a long term Government bond).
Wages should be assumed to grow in dollar terms according to best estimates for inflation and productivity growth. In selecting discount rates for this project, we have thus settled upon the following as the preferred approach for Australia.
���� Positive time preference: We use the long term nominal bond rate of 5.8% pa from recent history as the parameter for this aspect of the discount rate. If there were no positive time preference, people would be indifferent between having something now or a long way off in the future, so this applies to all flows of goods and services.
���� Inflation: The Reserve Bank has a clear mandate to pursue a monetary policy that delivers 2 to 3% inflation over the course of the economic cycle. This is a realistic longer run goal and we therefore endorse the assumption of 2.5% pa for this variable. It is important to allow for inflation in order to derive a real (rather than nominal) rate.
���� Productivity growth: The Australian Government's Intergenerational report assumed productivity growth of 1.7% in the decade to 2010 and 1.75% thereafter. We suggest 1.75% for the purposes of this analysis.
There are then three different discount rates that should be applied:
���� To discount income streams of future earnings, the discount rate is:
5.8 - 2.5 - 1.75 = 1.55%.
���� To discount health costs, the discount rate is:
5.8 – (3.2 – 1.75) – 1.75 = 2.6%
���� To discount other future streams (healthy life) the discount rate is:
5.8 – 2.5 = 3.3%

Cost benefit analysis of fortifying the food supply with folic acid
16
In selecting discount rates for New Zealand projects, we have settled upon the following as the preferred approach.
���� Positive time preference: We use the long term nominal bond rate of 6.0% pa (from recent history in trading of NZ Government 10 year bonds) as the parameter for this aspect of the discount rate. (If there were no positive time preference, people would be indifferent between having something now or a long way off in the future, so this applies to all flows of goods and services.)
���� Inflation: The Reserve Bank of New Zealand has an agreement with the New Zealand government to pursue monetary policy that delivers 1% to 3% inflation on average over the medium term. Over the past few years inflation has consistently remained in the top half of this band, and is expected to remain above 2.5% until 2008 (New Zealand Treasury) and so we use an assumption of 2.2% pa for this variable. (It is important to allow for inflation in order to derive a real, rather than nominal, rate.)
���� Productivity growth: The New Zealand Treasury expects labour productivity growth of around 2% per annum in the year to March 2007, before returning to its long-term trend of around 1.5% per annum (New Zealand Treasury, 2005). For New Zealand based disease costing, this estimate of 1.5% will be used.
There are then two different discount rates that should be applied:
���� To discount income streams of future earnings, the discount rate is:
6.0 - 2.2 - 1.5 = 2.3%.
���� To discount other future streams (healthy life) the discount rate is:
6.0 – 2.2 = 3.8%
While there may be sensible debate about whether health services (or other costs with a high labour component in their costs) should also deduct productivity growth from their discount rate, we argue that these costs grow in real terms over time significantly as a result of other factors such as new technologies and improved quality, and we could reasonably expect this to continue in the future.
Discounting the VSL of A$3.7m from Table 4:2 by the discount rate of 3.3% over an average 40 years expected life span (the average from the meta-analysis of wage-risk studies) provides an estimate of the value of a life year of A$162,561.
Annualising the VSL of NZ$3.9 million in Table 4:2 using the discount rate of 3.8% over an average 40 years expected life span provides an estimate of the value of a life year (VLY) of NZ$184,216.
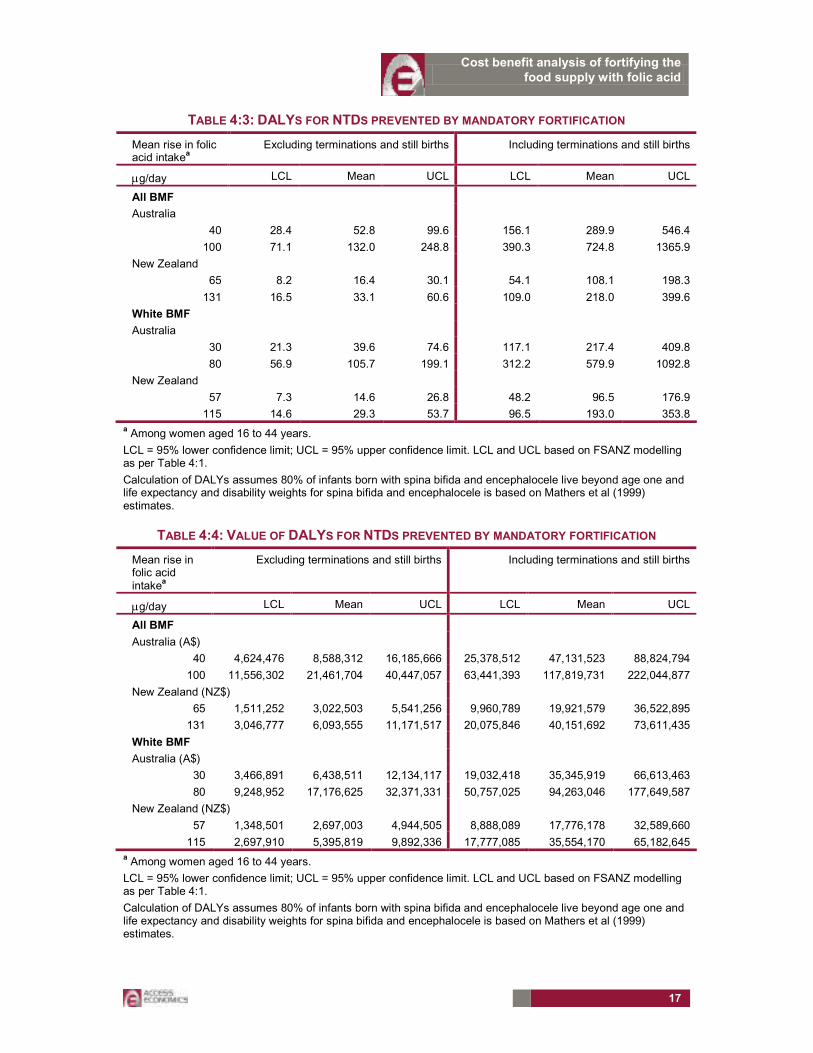
4.2.2 ESTIMATING THE BURDEN OF DISEASE AND ITS VALUE
The DALYs associated with the NTDs that could be prevented by mandatory fortification are outlined in Table 4:3. The DALYs are larger when terminations and still births are included in the analysis because of the additional life years lost. The DALYs are converted to a dollar value in Table 4:4 using the VSLs and discount rates explained in section 4.2.1.
Cost benefit analysis of fortifying the food supply with folic acid
17
TABLE 4:3: DALYS FOR NTDS PREVENTED BY MANDATORY FORTIFICATION
Mean rise in folic acid intake
a
Excluding terminations and still births Including terminations and still births
µg/day LCL Mean UCL LCL Mean UCL
All BMF
Australia
40 28.4 52.8 99.6 156.1 289.9 546.4
100 71.1 132.0 248.8 390.3 724.8 1365.9
New Zealand
65 8.2 16.4 30.1 54.1 108.1 198.3
131 16.5 33.1 60.6 109.0 218.0 399.6
White BMF
Australia
30 21.3 39.6 74.6 117.1 217.4 409.8
80 56.9 105.7 199.1 312.2 579.9 1092.8
New Zealand
57 7.3 14.6 26.8 48.2 96.5 176.9
115 14.6 29.3 53.7 96.5 193.0 353.8 a Among women aged 16 to 44 years.
LCL = 95% lower confidence limit; UCL = 95% upper confidence limit. LCL and UCL based on FSANZ modelling as per Table 4:1.
Calculation of DALYs assumes 80% of infants born with spina bifida and encephalocele live beyond age one and life expectancy and disability weights for spina bifida and encephalocele is based on Mathers et al (1999) estimates.
TABLE 4:4: VALUE OF DALYS FOR NTDS PREVENTED BY MANDATORY FORTIFICATION
Mean rise in folic acid intake
a
Excluding terminations and still births Including terminations and still births
µg/day LCL Mean UCL LCL Mean UCL
All BMF
Australia (A$)
40 4,624,476 8,588,312 16,185,666 25,378,512 47,131,523 88,824,794
100 11,556,302 21,461,704 40,447,057 63,441,393 117,819,731 222,044,877
New Zealand (NZ$)
65 1,511,252 3,022,503 5,541,256 9,960,789 19,921,579 36,522,895
131 3,046,777 6,093,555 11,171,517 20,075,846 40,151,692 73,611,435
White BMF
Australia (A$)
30 3,466,891 6,438,511 12,134,117 19,032,418 35,345,919 66,613,463
80 9,248,952 17,176,625 32,371,331 50,757,025 94,263,046 177,649,587
New Zealand (NZ$)
57 1,348,501 2,697,003 4,944,505 8,888,089 17,776,178 32,589,660
115 2,697,910 5,395,819 9,892,336 17,777,085 35,554,170 65,182,645 a Among women aged 16 to 44 years.
LCL = 95% lower confidence limit; UCL = 95% upper confidence limit. LCL and UCL based on FSANZ modelling as per Table 4:1.
Calculation of DALYs assumes 80% of infants born with spina bifida and encephalocele live beyond age one and life expectancy and disability weights for spina bifida and encephalocele is based on Mathers et al (1999) estimates.
Cost benefit analysis of fortifying the food supply with folic acid
18
4.3 HEALTH SYSTEM COSTS
There are two main methods for estimating direct health system costs.
���� ‘Top-down’ disease cost data can be derived from central data collection agencies.
���� ‘Bottom-up’ cost estimates use surveys, or other data-gathering tools to accumulate information from either a single study or multiple sources.
The advantage of the top-down methodology is that cost estimates for various diseases will be consistent, enhancing comparisons and ensuring that the sum of the parts (health system costs of each disease) does not exceed the whole (total expenditures on health care in Australia or New Zealand). The advantage of the bottom-up methodology is that it can provide greater detail in relation to specific cost elements not otherwise available from central data collection agencies.
In this study, Access Economics has been restricted by the lack of comprehensive data of either type in New Zealand, and lack of complete coverage of health sector costs by central data collections in Australia.
���� In Australia, the Australian Institute of Health and Welfare (AIHW) collects data on health expenditure from its comprehensive hospital establishments and hospital morbidity data bases, the Bettering the Evaluation and Care of Health survey of a sample of GPs (BEACH), the Australian National Health Survey and other sources (AIHW, 2005). Around 86 per cent of health expenditure gathered from these sources can be allocated by disease. The residual incudes capital expenditures, expenditure on community health, some public health programs and health administration. To account for these unallocated costs, the AIHW data are weighted by 100/86. However, for NTDs, data for outpatients, specialists, and pathology and imaging are incomplete.14 In addition, the AIHW data exclude allied health expenditure (such as physiotherapy and orthotics) which are significant outlays for those with NTDs.
���� In New Zealand there is not the extensive collection of top-down disease cost data that is compiled in Australia and it was not possible to source an existing comprehensive bottom-up study of cost elements of NTDs in New Zealand.
Access Economics has therefore utilised Australian data from the AIHW for spina bifida, encephalocele and anencephaly, supplemented by ‘bottom-up’ data for spina bifida gathered from the Medicare Benefits Schedule and other primary Australian sources (for example, health care providers) based on advice from the spina bifida community in Australia and New Zealand. Bottom-up data were gathered for spina bifida only since those with spina bifida comprise the largest proportion of live NTDs (75 per cent of live NTD births and around 87 per cent of those who survive beyond the age of one).
The Australian data were used as a guide to health costs in New Zealand. In the absence of other information, previous analysis by Access Economics of the health costs per person in 2005 associated with arthritis in New Zealand suggested that health spending per capita in New Zealand is 95 per cent of health system expenditure per person in Australia (Access Economics 2005). This finding related primarily to lower general rates of utilisation of GP services and pharmaceuticals, and lower general costs in New Zealand relative to Australia.
14 The BEACH data underestimate pathology and imaging and specialists costs for spina bifida because these
data sample only GPs, whereas specialists play a key role in ordering pathology and imaging for NTDs.

Cost benefit analysis of fortifying the food supply with folic acid
19
This finding is thus used as the basis for the estimates of health costs for NTDs in New Zealand in Table 4:5. Currencies were converted using purchasing power parity.
4.3.1 SPINA BIFIDA
‘Top-down’ data for expenditure on admitted hospital patients were obtained from the AIHW for ICD codes relevant to spina bifida (specifically, Q05 spina bifida, Q07.01 Arnold-Chiari syndrome with spina bifida, Q07.03 Arnold-Chiari syndrome with spina bifida and hydrocephalus, and Q76 spina bifida occulta). Costs associated with maternal care for a (suspected) central nervous system malformation in the fetus (for spina bifida and anencephaly, ICD code O35) were included as an estimate of any additional expenditure associated with admitted maternal care in hospital associated with NTD births.
‘Top-down’ AIHW data were also obtained for unreferred attendances, pathology and imaging and pharmaceuticals, but as noted above, are incomplete, and so were combined with ‘bottom-up’ data. The latter were calculated for an ‘average’ person with spina bifida based on the number of visits to specialists and allied health carers, and for the number of pathology and imaging tests in one year, for the management of spina bifida and its impacts. Use of bottom-up costing necessitates the development of a ‘notional average’ use rate of health services across all people with spina bifida. However, as Waitzman et al (2005) note, the location of the spina bifida lesion (thoracic/high lumbar, low lumbar, and sacral) is associated with differences in average costs. We appreciate the assistance of the spina bifida community in developing bottom-up costings for a ‘notional average’, which is the best available approach with the data available and given the scope of this brief.
���� Data on unreferred attendances (GPs) were provided by the AIHW from the BEACH data base. Very few attendances were attributed to spina bifida. (Data for people with spina bifida attending a GP with non-spina bifida related illness such as flu were excluded.) The spina bifida community advised that there are very few visits to GPs for spina bifida related illness. Symptoms such as headaches may indicate potentially serious problems, for example, a blocked shunt, and so these patients are sent to hospital accident and emergency departments (A&E). If the diagnosis in A&E is serious, the patient will be admitted to hospital, and any related expenditure will be captured in the hospital data. Any expenditures in A&E associated with the admission will be allocated to admitted costs and are also incorporated in the hospitals data. If a patient is not admitted, A&E costs are likely to be small. Since data on A&E costs are limited, these have not been included in estimates here.
���� Pharmaceuticals prescribed by GPs are included in the AIHW data via the BEACH data base. If GPs are responsible for ordering most drugs for people with spina bifida (eg. antibiotics for urinary infection) then the AIHW data will provide an adequate estimate. However, these data do not capture pharmaceuticals prescribed by specialists and where these comprise a significant proportion of drugs taken by people with spina bifida for spina bifida related conditions, the AIHW data may underestimate expenditure on pharmaceuticals.
Prenatal screening costs have not been included in the health expenditure estimates. While these are substantial, they are routine preventive interventions and are thus not considered “additional costs” associated with new cases of NTDs.
The costs of terminations have not been included in estimates of health system expenditure. For terminations less than 20 weeks gestation, it is not possible to determine the cause. For terminations at greater than 20 weeks gestation, it is likely that the health system costs of termination of pregnancy with an NTD are similar to those associated with the birth of a baby

Cost benefit analysis of fortifying the food supply with folic acid
20
without an NTD, which would be incurred if the NTD was prevented through fortification with folate. This does not take into account the significant psychic costs that can be associated with pregnancy terminations and which are not incorporated into this analysis.
There are no data for the prevalence of NTDs, but based on the spina bifida Australia web site and other sources, the number of Australians with spina bifida is in the range 2000 to 6000. Access Economics projected the prevalence of spina bifida in each age group based on NTD incidence data provided by FSANZ for Australia and New Zealand for 1999 to 2003. Estimates of health expenditure per person in each age group per year were calculated by dividing total expenditure by projections of prevalence (Table 4:5).
TABLE 4:5: HEALTH SYSTEM EXPENDITURE FOR SPINA BIFIDA RELATED CAUSES PER YEAR FOR A
PERSON WITH SPINA BIFIDA, 2005
Age group Australia (A$) New Zealand (NZ$)
0-4 13,535 13,735
5–14 4,354 4,418
15–24 3,385 3,435
25–34 3,304 3,353
35–44 2,645 2,684
45–54 2,561 2,599
55–64 2,440 2,476
65–74 2,581 2,620
Average A$3,840 NZ$3,897
Note: Expenditure related to spina bifida only, including hospital, general practice, specialists, pharmaceutical, pathology and imaging and allied health care. Includes ICD 10 codes for spina bifida (Q05, Q07.01, Q07.03 and Q76) and a proportion of maternal care for a (suspected) central nervous system malformation in the fetus (O35). Currency conversion between Australia and New Zealand using purchasing power parity, 2005, http:/www.oecd.org/std/ppp/
Source: AIHW unpublished data supplemented by data collected by Access Economics from primary sources. Projections of prevalence by age group by Access Economics.
4.3.2 ANENCEPHALY AND ENCEPHALOCELE
Live born infants with anencephaly and encephalocele comprise only a small proportion of those with NTDs who survive beyond the age of one year, so the top-down AIHW data were used as a proxy for total expenditure for these conditions. As noted earlier, the AIHW data are weighted by a factor of 100/86 to account for the residual health costs that cannot be allocated by disease. Costs associated with maternal care for a (suspected) central nervous system malformation in the fetus were included in the health costs as an estimate of any additional expenditure associated with maternal care in hospital associated with NTD births. Similar assumptions were made about the costs of prenatal screening and terminations of pregnancy as for spina bifida.
As noted earlier, there are no data for the prevalence of NTDs, so Access Economics projected the prevalence of encephalocele by age based on incidence data provided by FSANZ.
Health expenditure on anencephaly and encephalocele related conditions per person per year with these conditions has been combined because of the small number of cases (Table

Cost benefit analysis of fortifying the food supply with folic acid
21
4:6). The projected number of live births of anencephaly and encephalocele prevented are presented in the appendix — Table A 1: Australia and Table A 2: New Zealand.
TABLE 4:6: HEALTH SYSTEM EXPENDITURE FOR ANENCEPHALY AND ENCEPHALOCELE RELATED
CAUSES PER YEAR PER PERSON, 2005a
Age group Australia (A$) New Zealand (NZ$)
0-4 12,616 12,803
5–14 2,184 2,216
15–24 2,095 2,126
25–34 2,095 2,126
35–44 2,095 2,126
45–54 2,095 2,126
55–64 2,095 2,126
65–74 2,095 2,126
Average A$3,084 NZ$3,129 a Expenditure related to anencephaly and encephalocele only, including hospital, general practice, specialists, pharmaceutical, pathology and imaging. Includes ICD 10 code for anencephaly (Q00), encephalocele (Q01) and a proportion of maternal care for a (suspected) central nervous system malformation in the fetus (O35).
b Life
expectancy for anencephaly is one week in all three scenarios.
Source: AIHW unpublished data. Projections of prevalence by age group by Access Economics.
4.3.3 DISCOUNTED STREAM OF HEALTH EXPENDITURE AVOIDED FOR NTDS
PREVENTED
The stream of discounted health expenditure over the lifetime of those with NTDs that would be avoided through mandatory fortification is provided in Table 4:7.
TABLE 4:7: DISCOUNTED STREAM OF HEALTH EXPENDITURE AVOIDED, 2005a
Mean rise in folic acid intake
b
µg/day LCL Mean UCL
All bread making flour
Australia (A$)
40 122,558 227,608 428,953
100 306,395 569,019 1,072,382
New Zealand (NZ$)
65 37,532 75,065 137,619
131 75,642 151,285 277,355
White bread making flour
Australia (A$)
30 91,918 170,706 321,715
80 245,116 455,215 857,906
New Zealand (NZ$)
57 33,491 66,981 122,799
115 66,981 133,962 245,597 a Assumes 80 per cent of children with encephalocele survive beyond the age of one, with life expectancy based on Mathers et al 1999. Life expectancy for anencephaly is one week. Discount rate of 2.6 per cent per annum. b Among women aged 16 to 44 years.

Cost benefit analysis of fortifying the food supply with folic acid
22
4.3.4 COMPARISONS WITH OTHER ESTIMATES OF LIFETIME HEALTH
EXPENDITURE FOR SPINA BIFIDA
A limited number of studies have estimated the lifetime health costs (or some proportion thereof) associated with spina bifida (Table 4:8). Only one study estimated the costs associated with anencephaly. Access Economics is not aware of any studies of the health outlay associated with encephalocele. Comparisons are difficult because the scope of the estimate from each study is not identical, currency years differ, and discount rates and inflation rates are not the same. The estimates by Waitzman et al (2005) in Table 4:8, are probably the closest in scope (including only medical costs and discounted at a similar rate) to those used here. The Access Economics estimates are a little lower than those by Waitzman et al (2005), (A$130,000 compared with A$325,500 in 2005).
TABLE 4:8: LIFETIME HEALTH COSTS PER NTD BIRTH, ESTIMATES FROM THE LITERATURE
Study (currency year, country) Spina bifida Anencephaly
Waitzman et al 2005. (2002, USA) US$235,839a
(In 2005, A$325,546)
na
CIE 2004, citing US estimates by the EPA, 2002. (1996, USA)
US$485,814b na
Bower et al 1989. (1989, WA
Aust)a
A$45,075c na
Grosse et al 2005. (2002, USA) Based on Waitzman et al 2005 US$6000
Singh and Elliott 1997. (1997, NZ) NZ$355,000d na
a Using a 3 per cent discount rate for costs beyond the first year. Costs include inpatient and other medical care
only. b Not discounted.
c Bower et al (1989) estimated hospital costs for the first 10 years of life and used a
discount rate of 10 per cent. d Includes income support. Estimated over 20 years, not discounted.
4.4 PRODUCTION LOSSES
Access Economics measures the lost earnings and production due to both disability and premature death using a ‘human capital’ approach.
The human capital method estimates production losses based on expected lifetime earnings for an individual.
The lower end of such estimates includes only the ‘friction’ period until a worker can be replaced, which would be highly dependent on labour market conditions and un(der)employment levels. In an economy operating at near full capacity, as both Australia and New Zealand are at present, a better estimate includes costs of temporary work absences plus the discounted stream of lifetime earnings lost due to people with NTDs failing to participate in the workforce because of their disability or premature death (including still birth or termination of pregnancy). It is likely that, by preventing a proportion of incident cases of NTDs through mandatory fortification, those otherwise affected would participate in the labour force and obtain employment at the same rate as other Australians or New Zealanders, and earn the same average weekly earnings. The implicit and probable economic assumption is that the numbers of such people would not be of sufficient magnitude to substantially influence the overall clearing of the labour market, thus making a net addition to productive capacity.

Cost benefit analysis of fortifying the food supply with folic acid
23
4.4.1 LONG-TERM PRODUCTIVITY COSTS
4.4.1.1 EMPLOYEES
Long term productivity costs reflect the loss of labour resources resulting from the occurrence of NTDs (because of pregnancy termination, still birth, or lower rate of survival of infants with an NTD beyond the age of one year). In addition, a proportion of those with spina bifida or encephalocele are less likely to be employed (or less likely to be employed full time) than those without an NTD.
Consultation with the spina bifida community suggested that many people with spina bifida face serious barriers to participation in full time work, and most are likely to work in part-time, possibly voluntary, positions which they will hold for relatively short periods of time. As noted by CIE (2004), this may reflect both the impairment of those with an NTD as well as discrimination.
In trying to quantify the extent to which employment rates are reduced relative to the total population, a literature search revealed two relevant studies.
A UK study by Hunt and Oakeshott (2004) surveyed all babies born with spina bifida from one Cambridge hospital between 1963 and 1971. At the time of the survey there were 54 survivors (out of 117 babies), with a mean age of 35 years. Thirteen (or 24 per cent) were in competitive employment, with a further five (nine per cent) in sheltered employment. Of those in competitive employment, there were nine males (representing a 38 per cent employment rate) and four females (representing a 13 per cent employment rate). The results of this survey, while insightful, may not represent a complete picture of the employment prospects for babies born with spina bifida today. One reason is that survival rates have substantially improved (see Section 3.3). Medical advances may also have altered the mix of levels of impairment experienced by the spina bifida population. Further, employment patterns may differ between the UK, Australia and NZ.
Another approach to estimating the employment rate for people with spina bifida was made by the CIE (2004), who used the Dutch disability ratings for spina bifida to estimate the proportion of people with spina bifida that are able to work (Table 3:1). They assume that all of those people with low level spina bifida can work, and half of those people with medium level spina bifida can work. In other words, 40 per cent of all people with spina bifida were estimated to have the same employment prospects as the wider population, and 60 per cent of adults with spina bifida will not enter the workforce because of their disability (CIE 2004).
These two studies are not inconsistent. If 40 per cent of those with spina bifida have similar employment prospects to the rest of the population, and the average probability of employment for the rest of the population is 62 per cent (across both genders and all those of working age)15, those with spina bifida have an approximate 25 per cent chance of being employed. This is very similar to the proportion (24 per cent) of those with spina bifida in competitive employment estimated by Hunt and Oakeshott (2004). Based on these ball park calculations, Access Economics has assumed that the probability of employment for a person with spina bifida is around 60 per cent below average in both Australia and New Zealand.
15 Access Economics calculations based on ABS (2005) labour market statistics, cat. no. 6105.0.

Cost benefit analysis of fortifying the food supply with folic acid
24
4.4.1.2 CARERS
In addition to the loss in productivity due to those with NTDs being less likely to work, the labour force participation of their carers is also affected, leading to additional productivity losses. A significant number of people with NTDs receive informal care from family and friends. As informal care is often unpaid, it is sometimes also thought of as free. However, the time devoted by a carer is time he or she cannot use for other activities such as paid employment or leisure activities.
In this report, the time foregone by caregivers is valued at opportunity cost — the value of wages foregone. As with the approach to employees, this analysis is partial (rather than a general equilibrium approach) and an implicit principle is that the economy is operating at full capacity (and therefore carer tasks are a net resource cost).
Estimating the hours per week spent by carers of those with an NTD is difficult. There are no formal sources of information available. In addition, the number of hours of care needed per week will vary according to the level of impairment caused by the NTD, and by the person’s age. According to the spina bifida community, children with spina bifida generally require a lot of informal care and it is common that one parent will need to stay out of the workforce (or both will work part time) until the child leaves school or some time thereafter. Once a person with spina bifida reaches adulthood, he or she will typically continue to require assistance with nursing and personal hygiene, cooking, house work and maintenance, shopping, and recreational activities.
Access Economics has assumed that (in both Australia and New Zealand) one carer remains out of the workforce for 20 years in order to care for a child with an NTD. In order to calculate the value of carers’ earnings foregone, it assumed that over the 20 year period that they are caring, carers would otherwise have been working with the same probability and at the same average wage as their peers who are not caring for a child with an NTD.
The value of the long term productivity loss associated with lower employment rates of those with NTDs and their carers that could be avoided with mandatory fortification are summarised in Table 4:9 for Australia and Table 4:10 for New Zealand.
���� In Australia, the productivity loss that could be avoided through mandatory fortification per live birth with an NTD is A$894,019. The productivity cost avoided for a still birth with an NTD or a termination of pregnancy with an NTD is A$802,374.
���� In New Zealand, the productivity loss that could be avoided through mandatory fortification per live birth with an NTD is NZ$849,495. The productivity cost avoided for a still birth with an NTD or a termination of pregnancy with an NTD is NZ$738,817.

Cost benefit analysis of fortifying the food supply with folic acid
25
TABLE 4:9: NPV OF LONG TERM PRODUCTIVITY COSTS AVOIDABLE WITH MANDATORY
FORTIFICATION AUSTRALIA (A$)a
Mean rise in folic acid intake
a
Excluding terminations and still births Including terminations and still births
µg/day LCL Mean UCL LCL Mean UCL
All BMF
40 Carers 326,421 606,210 1,142,472 326,421 606,210 1,142,472
Employee 636,369 1,181,827 2,227,290 4,265,570 7,921,773 14,929,495
Total 962,789 1,788,037 3,369,762 4,591,991 8,527,982 16,071,967
100 Carers 816,052 1,515,524 2,856,180 816,052 1,515,524 2,856,180
Employee 1,590,922 2,954,569 5,568,225 10,663,925 19,804,432 37,323,737
Total 2,406,973 4,470,093 8,424,406 11,479,976 21,319,956 40,179,917
White BMF
30 Carers 244,815 454,657 856,854 244,815 454,657 856,854
Employee 477,276 886,371 1,670,468 3,199,177 5,941,329 11,197,121
Total 722,092 1,341,028 2,527,322 3,443,993 6,395,987 12,053,975
80 Carers 652,841 1,212,419 2,284,944 652,841 1,212,419 2,284,944
Employee 1,272,737 2,363,655 4,454,580 8,531,140 15,843,545 29,858,989
Total 1,925,578 3,576,074 6,739,525 9,183,981 17,055,965 32,143,934 a Net present value of the total life time costs avoided for all NTDs prevented in the year 2005.
b Among women
aged 16 to 44 years.
TABLE 4:10: NPV OF LONG TERM PRODUCTIVITY COSTS AVOIDABLE WITH MANDATORY
FORTIFICATION NEW ZEALAND (NZ$)
Mean rise in folic acid intake
a
Excluding terminations and still births Including terminations and still births
µg/day LCL Mean UCL LCL Mean UCL
All BMF
65 Carers 128,360 256,720 470,654 474,535 949,071 1,739,963
Employee 147,726 295,451 541,661 1,002,129 2,004,257 3,674,471
Total 276,086 552,172 1,012,315 1,476,664 2,953,328 5,414,434
131 Carers 258,695 517,390 948,549 956,371 1,912,742 3,506,694
Employee 297,724 595,448 1,091,655 2,019,674 4,039,349 7,405,473
Total 556,419 1,112,839 2,040,204 2,976,046 5,952,091 10,912,167
White BMF
58 Carers 114,537 229,074 419,968 423,432 846,863 1,552,582
Employee 131,817 263,634 483,328 894,207 1,788,414 3,278,759
Total 246,354 492,707 903,296 1,317,639 2,635,277 4,831,341
116 Carers 229,074 458,147 839,936 846,863 1,693,726 3,105,164
Employee 263,634 527,267 966,657 1,788,414 3,576,828 6,557,518
Total 492,707 985,414 1,806,593 2,635,277 5,270,554 9,662,682 a Among women aged 16 to 44 years.
4.4.2 SHORT-TERM PRODUCTIVITY COSTS
For those with an NTD who are employed, short term productivity costs reflect any temporary absences from work necessary because of conditions related to NTDs. Some people with spina bifida or encephalocele will take temporary leave from work without exiting the

Cost benefit analysis of fortifying the food supply with folic acid
26
workplace entirely for example, because of a urinary infection, epilepsy, or damage to a limb because of a fall. There are no data on the level of temporary absenteeism resulting from NTDs in excess of the average in either Australia or New Zealand. The spina bifida community suggested that a person with an NTD was likely to need 10 additional days temporary (sick or other) leave than a person without an NTD. If this is the case, the associated short term productivity costs are likely to be relatively small, and are not included in the analysis here.
4.5 OTHER COSTS
4.5.1 AIDS AND MODIFICATIONS
Estimates of the costs associated with personal aids (mobility, continence related and orthotics aids) and modifications to homes and cars are based on advice from the spina bifida community and other primary data sources. It has been assumed that around 40 per cent of those with spina bifida require mobility aids (crutches and or a wheelchair) and most require continence aids. This is consistent with CIE (2004) which cites research by Blum (1999). It has also been assumed that around 50 per cent of those with spina bifida require orthotics.
In relation to schools and workplaces, arguably, given legislative arrangements providing people with a disability with the right to substantive equality of opportunity in areas such as employment and education16, additional costs for spina bifida over and above current arrangements for improving access to buildings might only include equipment (for example, modified school desk and computer and similar at work). In addition, while most children with an NTD attend mainstream schools, the spina bifida community advised that many have teachers’ assistants. These costs have not been estimated here.
Table 4:11 provides estimates of costs per person per year in each age group. Some of these outlays are subsidised by governments. The costs in Table 4:11 represent the full costs.
TABLE 4:11: EXPENDITURE ON AIDS AND MODIFICATIONS PER PERSON WITH SPINA BIFIDA PER
YEAR, 2005
Age group Personal aids (A$2005)
a
Home and car (A$2005)
c
Personal aids (NZ$2005)
a,d
Home and car (NZ$2005)
c,d
0-4 2,621 0 2,800 0
5–14b 7,818 270 8,351 288
15–24b 8,020 417 8,567 445
25–34 6,654 505 7,108 539
35–44 6,654 505 7,108 539
45–54 6,654 505 7,108 539
55–64 6,654 505 7,108 539
65–74 6,654 417 7,108 445
Av. per person per year 6,712 415 7,170 443 a Personal aids include mobility aids (crutches, wheelchairs), continence aids (pads, lubricants, bowel washers and catheters) and orthotics (leg callipers, footwear and compression stockings).
b Expenditure is relatively high in
these age groups to reflect the faster changeover in orthotics aids because of individual growth. c Modifications to
home include provision of ramps and handrails and modifications to bathrooms and toilets. Modifications to cars
16 The Disability Discrimination Act 1992
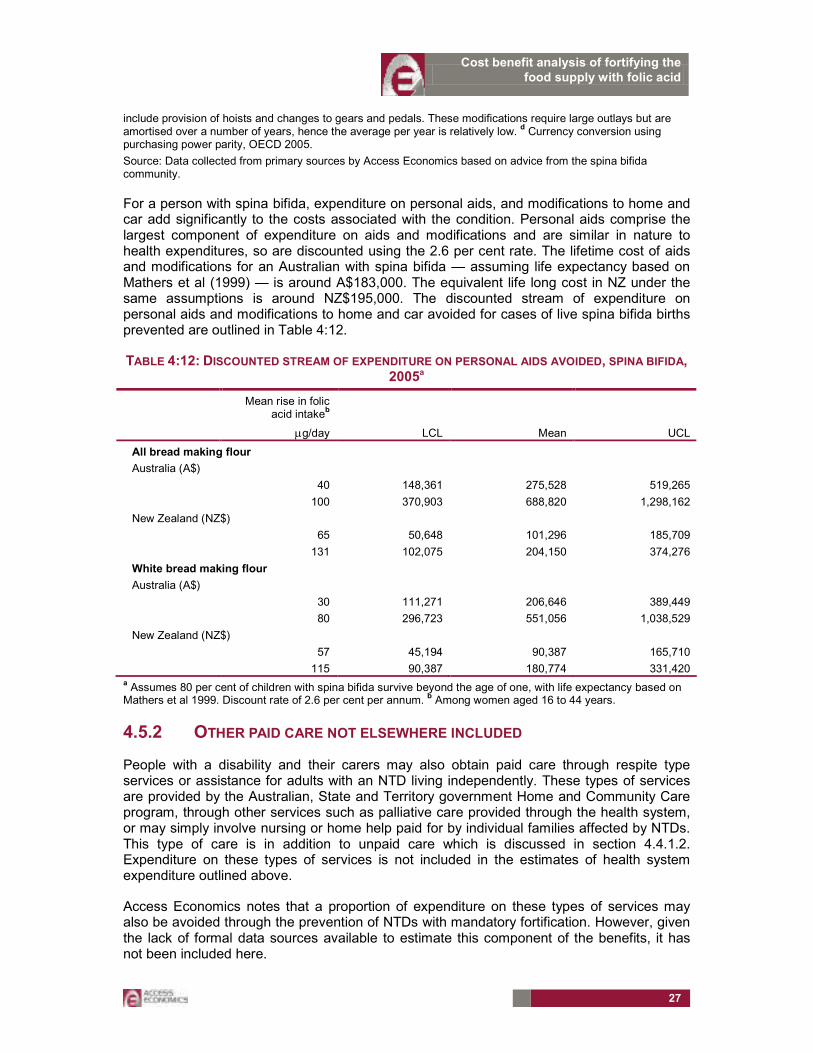
Cost benefit analysis of fortifying the food supply with folic acid
27
include provision of hoists and changes to gears and pedals. These modifications require large outlays but are amortised over a number of years, hence the average per year is relatively low.
d Currency conversion using
purchasing power parity, OECD 2005.
Source: Data collected from primary sources by Access Economics based on advice from the spina bifida community.
For a person with spina bifida, expenditure on personal aids, and modifications to home and car add significantly to the costs associated with the condition. Personal aids comprise the largest component of expenditure on aids and modifications and are similar in nature to health expenditures, so are discounted using the 2.6 per cent rate. The lifetime cost of aids and modifications for an Australian with spina bifida — assuming life expectancy based on Mathers et al (1999) — is around A$183,000. The equivalent life long cost in NZ under the same assumptions is around NZ$195,000. The discounted stream of expenditure on personal aids and modifications to home and car avoided for cases of live spina bifida births prevented are outlined in Table 4:12.
TABLE 4:12: DISCOUNTED STREAM OF EXPENDITURE ON PERSONAL AIDS AVOIDED, SPINA BIFIDA, 2005a
Mean rise in folic acid intake
b
µg/day LCL Mean UCL
All bread making flour
Australia (A$)
40 148,361 275,528 519,265
100 370,903 688,820 1,298,162
New Zealand (NZ$)
65 50,648 101,296 185,709
131 102,075 204,150 374,276
White bread making flour
Australia (A$)
30 111,271 206,646 389,449
80 296,723 551,056 1,038,529
New Zealand (NZ$)
57 45,194 90,387 165,710
115 90,387 180,774 331,420 a Assumes 80 per cent of children with spina bifida survive beyond the age of one, with life expectancy based on Mathers et al 1999. Discount rate of 2.6 per cent per annum.
b Among women aged 16 to 44 years.
4.5.2 OTHER PAID CARE NOT ELSEWHERE INCLUDED
People with a disability and their carers may also obtain paid care through respite type services or assistance for adults with an NTD living independently. These types of services are provided by the Australian, State and Territory government Home and Community Care program, through other services such as palliative care provided through the health system, or may simply involve nursing or home help paid for by individual families affected by NTDs. This type of care is in addition to unpaid care which is discussed in section 4.4.1.2. Expenditure on these types of services is not included in the estimates of health system expenditure outlined above.
Access Economics notes that a proportion of expenditure on these types of services may also be avoided through the prevention of NTDs with mandatory fortification. However, given the lack of formal data sources available to estimate this component of the benefits, it has not been included here.

Cost benefit analysis of fortifying the food supply with folic acid
28
4.6 EFFICIENCY LOSSES FROM TRANSFER PAYMENTS
Transfer payments (taxation and welfare payments) are not a net cost to society, as they represent a shift of consumption power from one group of individuals in the community to another. These payments affect the distribution of resources, rather than the amount of resources available. However, taxation generates a cost to the community because of the associated distortions to work and consumption choices and because of the need to administer the tax system. In addition, there are the costs of administering the welfare payment system and its associated distortions. These distortions and administrative costs are referred to as efficiency losses and are estimated in this section.
4.6.1 EFFICIENCY LOSSES ASSOCIATED WITH TAXATION
The relatively low levels of employment of those with an NTD mean that they not only forego income, but also pay less personal income tax. To the extent that people with lower incomes also consume a smaller set of goods and services, indirect taxes levied on consumption will also fall. Additional taxes must be raised elsewhere to cover these taxation receipts foregone.
���� Personal income tax foregone (ie. that would otherwise be collected through the prevention of a proportion of NTDs) is calculated as the product of the NPV of foregone earnings (the long term productivity losses estimated above) and the average personal income tax rate (19.6 per cent in Australia and around 22 per cent in New Zealand).
���� Indirect tax foregone is not included in the calculations here.
As discussed earlier, lost taxation revenue is not in itself a real economic cost, but a transfer payment which is nevertheless associated with an efficiency loss.
���� In Australia, a comparison of the total amounts spent and revenue raised in 2000-01, relative to the Australian Government departmental running costs, suggests that administration costs account for 1.25 per cent of each taxation dollar raised (Access Economics, 2005).
���� Even greater efficiency losses are incurred due to the distortionary impact that taxation has on workers’ work and consumption choices. In Australia, the Productivity Commission (2003, p6.15-6.16 with rationale) found the efficiency loss associated with these distortions amounts to 27.5 per cent of each tax dollar.
���� In New Zealand, studies by Diewert and Lawrence (1994, 1995, 1996) found that in 1991 the efficiency loss associated with personal income tax was 18 per cent and for consumption taxes around 14 per cent. They also noted that the efficiency losses associated with labour taxation increased from 5 per cent to over 18 per cent in the 20 years up to 1991. In this report, 18 per cent is used for the estimate of the efficiency losses in New Zealand, noting that it may be a conservative estimate in view of another study (McKeown and Woodfield, 1995) based on 1988 data that generated estimates ranging from 24.6 per cent to 146.2 per cent of taxes raised. Neither estimate includes possible efficiency losses from the taxation of income earned on capital, or administration and compliance costs. The use of 18 per cent balances the upside risk that the efficiency losses have continued to increase since 1991 against the downside risk that tax raised from non-labour sources has lower associated efficiency losses.
The assumptions about tax rates and efficiency losses are summarised in Table 4:13.

Cost benefit analysis of fortifying the food supply with folic acid
29
TABLE 4:13: SUMMARY OF ASSUMPTIONS ABOUT TAX RATES AND EFFICIENCY LOSSES
Australia New Zealand
Average personal income tax rate 19.6% 22.0%
Efficiency loss from additional taxation 28.75% 18.0%
Australian tax rates from Access Economics macro model for 2005-06. New Zealand rates from Access Economics (2005).
The efficiency loss associated with forgone taxation was calculated by applying the above rates to the productivity losses from Table 4:9 and Table 4:10.
TABLE 4:14: EFFICIENCY LOSS ASSOCIATED WITH PERSONAL TAX FOREGONE
Mean rise in folic acid intake
a
Excluding terminations and still births Including terminations and still births
µg/day LCL Mean UCL LCL Mean UCL
All BMF
Australia (A$)
40 54,253 100,756 189,886 258,759 480,552 905,655
100 135,633 251,890 474,715 646,897 1,201,380 2,264,138
New Zealand (NZ$)
65 10,933 21,866 40,088 58,476 116,952 214,412
131 22,034 44,068 80,792 117,851 235,703 432,122
White BMF
Australia (A$)
30 40,690 75,567 142,415 194,069 360,414 679,241
80 108,506 201,512 379,772 517,517 961,104 1,811,311
New Zealand (NZ$)
57 9,756 19,511 35,771 52,178 104,357 191,321
115 19,511 39,022 71,541 104,357 208,714 382,642 a Among women aged 16 to 44 years.
4.6.2 EFFICIENCY LOSSES ASSOCIATED WITH WELFARE PAYMENTS
Welfare payments to people with spina bifida and encephalocele and their carers create efficiency losses similar to those for foregone taxation as taxes are required to fund these payments. In Australia the payments for which a person with an NTD may be eligible include the Disability Support Pension (DSP), the Mobility Allowance, a Concession Card for people receiving a pension, the Pharmaceutical Allowance, the Continence Aids Assistance Scheme, as well as State based transport subsidy schemes. Carers in Australia may be eligible for the Carer Payment and/or the Carer Allowance. In New Zealand applicable welfare payments for people with NTDs include the Invalids’ Benefit, the Disability Allowance, and the Community Services Card. Parent carers in New Zealand may be eligible to receive the Domestic Purposes Benefit, the Child Disability Allowance and the Disability Allowance, depending on the degree of the child’s disability.
Detailed estimates of the value of welfare payments received by those with an NTD or their carers are not available from formal data sources, which do not collect data specifically for NTDs. In this report estimates have only been undertaken for the larger benefits (pensions) which people with NTDs and their carers may receive, and not for the smaller supplementary allowances which are available.

Cost benefit analysis of fortifying the food supply with folic acid
30
Estimation of total welfare payments
The value of welfare payments possibly avoided through mandatory fortification are calculated as the product of the proportion of people with an NTD (or caring for a person with an NTD) likely to be in receipt of welfare in excess of the average proportion for the total population, the number of NTDs that could be prevented and the average value of the welfare payment received.
People with an NTD
People with NTDs who are unable to work due to their disability may be eligible for a disability pension. This welfare benefit is known as the disability support pension (DSP) in Australia and the Invalids’ Benefit in New Zealand.
In section 4.4.1 it was assumed that 24 per cent of those with an NTD have paid work. This leaves 76 per cent of those with an NTD who are of working age (15 to 64 years) that are likely to be in receipt of a DSP (in Australia) or invalids’ benefit (in New Zealand). This compares with the proportion of the working-age population receiving the DSP in Australia — 5.2 per cent17 — and the proportion of the New Zealanders aged 18 to 59 receiving an Invalids’ Benefit — 2.5 per cent.18 The difference in the rate at which the general population in each country is in receipt of welfare payments and those with NTD who are in receipt of welfare (that is, the receipt of welfare by those with an NTD in excess of the average) is 70.8 per cent for Australia and 73.5 per cent for New Zealand. Efficiency losses are calculated on these ‘excess’ dependency rates (noting of course that the higher than average rate of receipt of welfare payments by those with an NTD reflects their greater than average need for assistance).
Before applying the above rate to the number of NTDs prevented, still births and terminations are excluded as are the proportion of live-birth NTDs that do not live to working age.
The average payment rate for the DSP is $A11,189 per annum.19 The average payment rate for the Invalids’ Benefit is $NZ14,163 per annum.20 These payments are calculated as the total expenditure on that benefit divided by the number of people receiving the benefit.
Carers of children with an NTD
In line with the assumptions made for productivity losses (Section 4.4.1.2), only transfer payments to parents who are unable to work due to their child’s disability are included in this report. In both Australia and New Zealand there are strict eligibility requirements for carer pensions/benefits — the Carer Payment in Australia and the Domestic Purposes Benefit in
17 Calculated as the number of DSP recipients (707,000. Source: DEWR Annual Report 2004-05) divided by
Australian population aged 15-64 (13,682,387. Source: ABS, June 2005, no.3201.0).
18 The Statistical Report, Ministry of Social Development, Year ending June 2004, p. 73
19 The average payment per annum for the DSP was calculated as the total administered funds for the DSP
(Source: DEWR Annual Report 2004-05, p.37) divided by the total number of DSP recipients (Source: DEWR Annual Report 2004-05, p.35)
20 The average payment per annum for the Invalids’ Benefit is calculated as total expenditure on the Invalids’
Benefit (Source: Ministry of Social Development, Annual Report 2004-05, p.156), divided by the average number of people receiving the Invalids’ Benefit in the 2004-05 year. The average number of recipients for 2004-05 was calculated as the average of the number of recipients at the end of each quarter (Source: Ministry of Social Development website, Benefit Factsheets, http://www.msd.govt.nz/media-information/benefit-fact-sheets/index.html).
Cost benefit analysis of fortifying the food supply with folic acid
31
New Zealand. In both countries, carer payments are only available if the care recipient has a severe level of disability. It is assumed that children with high level spina bifida would meet this requirement (although the assessment criteria used by Centrelink and Work and Income respectively are not available to Access Economics to confirm this).
Thirty per cent of carers of children with spina bifida would be caring for a child with high level spina bifida (Section 3.4). By comparison, the proportion of working adults on carer pensions in the general population is 0.7 per cent21 in Australia and approximately 0.2 per cent in New Zealand22. For those caring for children with spina bifida, as outlined in Section 4.4.1.2, it is assumed that one parent remains out of work to care for the child for 20 years and receives a carer pension for the full period.
The average payment rate for the Carer Payment is A$11,127.77 per annum. This is calculated as the 2004-05 actual appropriations for the Carer Payment divided by the number of recipients of the Carer Payment in 2004-05.23
The average payment for the Domestic Purposes Benefit is NZ$11,896.72 per annum. This is calculated as the 2003-04 expenditure on carers’ benefits divided by the number of people receiving a carers’ benefit.24 It is noted that this estimate is likely to be an over-estimate of the average payment which carers of children with an NTD receive because carers’ benefits primarily consist of benefits to sole parents which are payed at a higher rate than payments to people in couples.
Parents of a child with an NTD are likely to be eligible for an allowance to help them with the costs associated with the child’s disability (the Child Disability Allowance in New Zealand, and the Carer Allowance [Child] in Australia). However, these payments are less than $50 per week and, as with other supplemental allowances, are not included in our estimates.
Estimation of efficiency losses due to welfare payments
The same rates for efficiency losses are applied to welfare payments as were applied to foregone taxation (Table 4:13). The efficiency losses for welfare payments are presented in Table 4:15.
21 Calculated as the number of recipients of a carer pension (FaCS Annual Report 2004-05) as a proportion of the
working age population (ABS no. 3201.0).
22 New Zealand Government, The Statistical Report – for the year ending June 2004, Ministry of Social
Development, p.45
23 FaCS Annual Report 2004-05, http://www.facs.gov.au/annualreport/2005/part2/output3-3.html
24 The Statistical Report – for the year ending June 2004, Table 2.13 and Table 2.15.

Cost benefit analysis of fortifying the food supply with folic acid
32
TABLE 4:15: EFFICIENCY LOSS ASSOCIATED WITH WELFARE PAYMENTS
Mean rise in folic acid intake
a
Excluding terminations and still births Including terminations and still births
µg/day LCL Mean UCL LCL Mean UCL
All BMF
Australia (A$)
40 60,926 113,148 213,241 60,926 113,148 213,241
100 152,315 282,870 533,101 152,315 282,870 533,101
New Zealand (NZ$)
65 12,292 24,583 45,069 12,292 24,583 45,069
131 24,772 49,545 90,832 24,772 49,545 90,832
White BMF
Australia (A$)
30 45,694 84,861 159,930 45,694 84,861 159,930
80 121,852 226,296 426,481 121,852 226,296 426,481
New Zealand (NZ$)
57 10,968 21,936 40,216 10,968 21,936 40,216
115 21,936 43,872 80,431 21,936 43,872 80,431 a Among women aged 16 to 44 years.
4.7 SUMMARY OF BENEFITS
Net burden of disease
The gross value of the burden of disease (BOD) (outlined in Table 4:4) reflects the personal cost of suffering from NTDs. Gross BOD needs to be adjusted to avoid double counting because it incorporates all known personal costs — suffering and premature death, lost wages, out of pocket personal health costs and out of pocket costs of aids and modifications. To calculate the net BOD, the individuals’ share of outlays on health services, their lifetime disposable earnings foregone (employees’ productivity losses after tax — see Section 4.4.1) and their share of expenditure on aids and modifications are subtracted from the gross BOD. The proportion of health expenditure and aids and modifications funded by the individual is based on the shares across funding sources for health expenditure in Australia — the most recent data available suggest the individuals’ share was around 20.3 per cent in 2003-04 (AIHW 2005). The net value of the burden of disease is shown in Table 4:16.

Cost benefit analysis of fortifying the food supply with folic acid
33
TABLE 4:16: NET VALUE OF BURDEN OF DISEASE
Mean rise in folic acid intake
a
Excluding terminations and still births Including terminations and still births
µg/day LCL Mean UCL LCL Mean UCL
All BMF
Australia (A$)
40 4,057,839 7,535,986 14,202,437 21,893,997 40,660,281 76,628,992
100 10,139,710 18,830,889 35,488,983 54,730,106 101,641,627 191,555,372
New Zealand (NZ$)
65 1,378,125 2,756,250 5,053,125 9,161,228 18,322,457 33,591,172
131 2,778,476 5,556,952 10,187,745 18,464,423 36,928,847 67,702,885
White BMF
Australia (A$)
30 3,041,913 5,649,267 10,646,695 16,419,032 30,492,488 57,466,612
80 8,115,678 15,071,973 28,404,872 43,787,995 81,320,562 153,257,983
New Zealand (NZ$)
57 1,229,711 2,459,423 4,508,942 8,174,635 16,349,269 29,973,661
115 2,460,330 4,920,659 9,021,210 16,350,176 32,700,353 59,950,647 a Among women aged 16 to 44 years.
Total benefits
Table 4:17 and Table 4:18 show the contribution of each type of benefit arising from mandatory fortification to the calculation of the total benefits — based on the mean number of NTDs prevented through mandatory fortification projected by FSANZ.
���� In Australia, for live NTD births only (excluding terminations and still births), the net burden of disease avoided comprises 75 per cent of the total benefits and avoided productivity loss 18 per cent. For all NTDs (including terminations and still births), the net burden of disease avoided comprises 81 per cent of the total benefits and avoided productivity loss 17 per cent.
���� In New Zealand, for live NTD births only (excluding terminations and still births), the net burden of disease avoided comprises 78 per cent of the total benefits and avoided productivity loss 16 per cent. For all NTDs (including terminations and still births), net burden of disease avoided comprises 85 per cent of the total benefits and avoided productivity loss 14 per cent.

Cost benefit analysis of fortifying the food supply with folic acid
34
TABLE 4:17: SUMMARY OF BENEFITS OF MANDATORY FORTIFICATION, MEAN, 2005, AUSTRALIA
All bread making flour White bread making flour
Mean rise in folic acid intake
a
µg/day
40 100 30 80
Excluding still births and terminations
DALYs avoided 53 132 40 106
Net value of Burden of disease avoided (A$)
7,535,986 18,830,889 5,649,267 15,071,973
Health expenditure avoided (A$)
227,608 569,019 170,706 455,215
Avoided long term productivity loss (A$)
1,788,037 4,470,093 1,341,028 3,576,074
Other costs avoided (A$) 275,528 688,820 206,646 551,056
Efficiency loss avoided (A$) 213,904 534,760 160,428 427,808
Total (excluding still births and terminations)
10,041,063 25,093,582 7,528,075 20,082,127
Including still births and terminations
DALYs avoided 290 725 217 580
Net value of Burden of disease avoided (A$)
40,660,281 101,641,627 30,492,488 81,320,562
Health expenditure avoided (A$)
227,608 569,019 170,706 455,215
Avoided productivity loss (A$)
8,527,982 21,319,956 6,395,987 17,055,965
Other costs avoided (A$) 275,528 688,820 206,646 551,056
Efficiency loss avoided (A$) 593,700 1,484,250 445,275 1,187,400
Total (including still births and terminations)
50,285,100 125,703,672 37,711,101 100,570,198
a Among women aged 16 to 44 years.
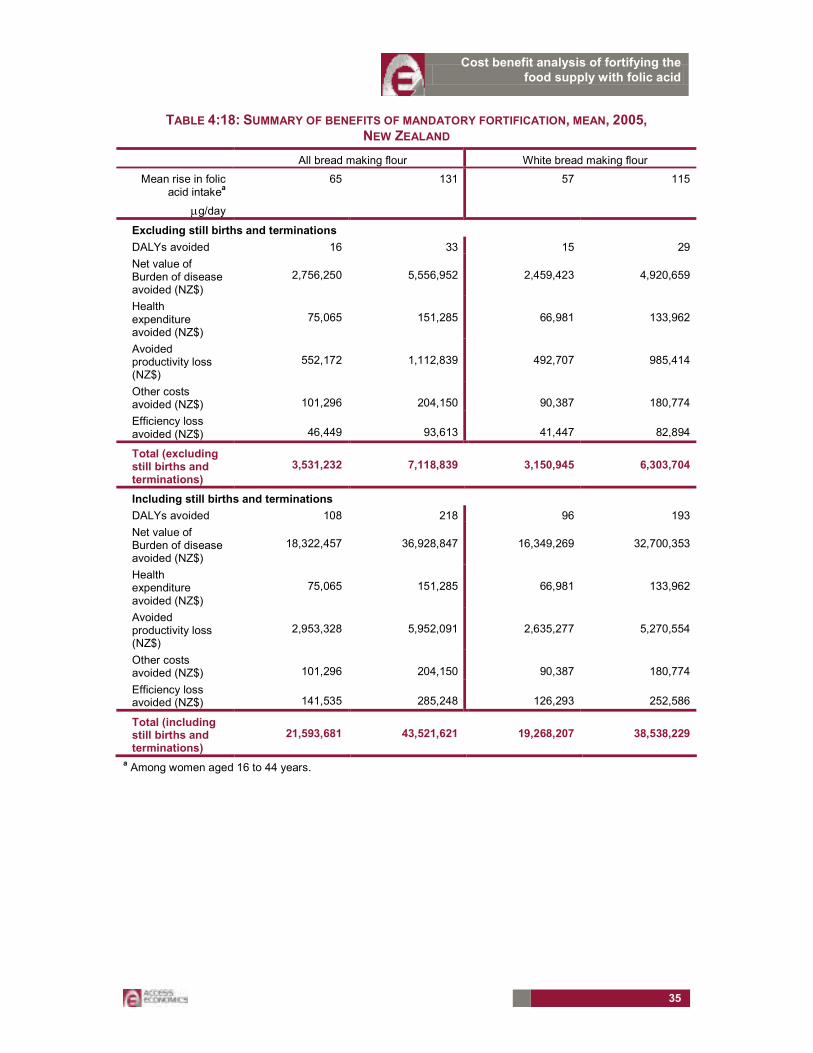
Cost benefit analysis of fortifying the food supply with folic acid
35
TABLE 4:18: SUMMARY OF BENEFITS OF MANDATORY FORTIFICATION, MEAN, 2005, NEW ZEALAND
All bread making flour White bread making flour
Mean rise in folic acid intake
a
µg/day
65 131 57 115
Excluding still births and terminations
DALYs avoided 16 33 15 29
Net value of Burden of disease avoided (NZ$)
2,756,250 5,556,952 2,459,423 4,920,659
Health expenditure avoided (NZ$)
75,065 151,285 66,981 133,962
Avoided productivity loss (NZ$)
552,172 1,112,839 492,707 985,414
Other costs avoided (NZ$) 101,296 204,150 90,387 180,774
Efficiency loss avoided (NZ$) 46,449 93,613 41,447 82,894
Total (excluding still births and terminations)
3,531,232 7,118,839 3,150,945 6,303,704
Including still births and terminations
DALYs avoided 108 218 96 193
Net value of Burden of disease avoided (NZ$)
18,322,457 36,928,847 16,349,269 32,700,353
Health expenditure avoided (NZ$)
75,065 151,285 66,981 133,962
Avoided productivity loss (NZ$)
2,953,328 5,952,091 2,635,277 5,270,554
Other costs avoided (NZ$) 101,296 204,150 90,387 180,774
Efficiency loss avoided (NZ$) 141,535 285,248 126,293 252,586
Total (including still births and terminations)
21,593,681 43,521,621 19,268,207 38,538,229
a Among women aged 16 to 44 years.
Cost benefit analysis of fortifying the food supply with folic acid
36
5. THE COSTS OF MANDATORY FORTIFICATION
The benefits associated with the NTDs prevented per annum (after any initial ramping up effects pass) are calculated in Section 4. These are compared with the costs to consumers, industry and government of fortification per annum, calculated here in Section 5. This section describes the incremental costs associated with mandatory fortification over and above voluntary fortification already occurring, including:
���� Costs to consumers;
���� Costs to industry; and
���� Costs to government.
5.1 CONSUMERS
Mandatory fortification aims to address the potential for under-consumption of folate by women of childbearing age. In a world of perfect information and foresight, where women of child-bearing age knew of the potential social (and personal) costs of under-consumption of folate in terms of an increased risk of NTDs, they would alter their dietary habits. Public health information campaigns aside (not in scope here), regulation in the form of mandatory fortification could improve consumption outcomes by increasing folate intake in this target group, since information is imperfect and does not always result in a behavioural response, and pregnancies are not always planned.
However, proposing a staple food consumed by the population as a whole (such as bread making flour) as the food vehicle for mandatory fortification results in a reduction in consumer choice for those outside the target group (ie. children, men and older women). A willingness-to-pay vehicle could be used to estimate this cost, but was not undertaken for this project.
While costs will initially fall on industry, in a competitive industry such as bread, these costs will be largely (if not entirely) passed on to consumers. That is, while the legal incidence of fortification falls on industry, the economic incidence will be on the purchasers of bread. A CBA is necessarily a partial analysis of the first round impacts of a policy change – it is beyond the scope of this analysis to estimate the second round effects as industry and consumers adjust to the increased costs of bread production. That said, we note that an across-the-board increase in the cost structure for an industry tends to be rapidly passed on to consumers. A possible exception to this is production being exported, where the scope to pass on cost increases may be less.
5.2 INDUSTRY
Costs to industry are calculated by estimating the value of resources allocated to activities that would only be undertaken in the event that mandatory fortification is introduced.
5.2.1.1 PRODUCERS OF FOLIC ACID
For the food industry, folic acid is imported into Australia and New Zealand. It costs between $115 (AUD) per kilo for European folic acid (pers. com. DSM 11 April) and around $30-$50 (AUD) per kilo from China (pers. com. BASF 21 March 2006 and DSM 11 April).
Producers of folic acid advised that the introduction of mandatory fortification would not result in the achievement of economies of scale not otherwise realised without mandatory
Cost benefit analysis of fortifying the food supply with folic acid
37
fortification. While prices may fall in future as two major manufacturers are building factories in China, this cannot be attributed to mandatory fortification in Australia and New Zealand, given their relatively small shares of the world economy.
Folic acid is sold in spray dried powder form and needs no special storage arrangements other than a cool dry place (refrigeration is not necessary). Unopened, it has a two year shelf life. After opening, the shelf life is around six months.
5.2.1.2 PRODUCERS OF BREAD MAKING FLOUR AND DOWNSTREAM PRODUCTS
Information was requested from large and small companies producing bread making flour and associated downstream products for both the Australian and New Zealand market (see the glossary for the list of products included by FSANZ as generally derived from bread making flour). In addition, costs were sought from companies in three different market segments: flour milling, companies producing packaged products made from bread making flour, and companies producing unpackaged products made from bread making flour.
The largest flour millers in Australia include Weston Milling (a division of George Weston Foods, with mills in NSW, Queensland, Victoria, WA, SA), Allied Mills (NSW, Victoria, Queensland, WA and SA), and the Manildra Group (with mills in NSW). Other smaller millers include Laucke (with mills in SA and Victoria), Tasmanian Flour Mills, and Ben Furney Flour Mills (in NSW). The largest flour millers in New Zealand include Champion Flour Mills (Division of Goodman Fielder NZ Ltd), Weston Milling (Division of George Weston Foods NZ Ltd), Canterbury Flourmills, and Milligans Food Group.
Major manufacturers of packaged bread and other products using bread making flour in Australia and New Zealand include:
���� Goodman Fielder (whose brands in Australia include Helga’s, Molenberg, Buttercup and Wonderwhite and whose brands in New Zealand include Quality Bakers, Ernest Adams, Molenberg and Vogel's [under licence]); and
���� George Weston Foods (whose brands include Tip Top, Golden, Noble Rise, Top Taste and Burgen).
Enterprises producing unpackaged products made from bread making flour include bakeries, hot bread shops and franchise chains such as Bakers Delight and Brumby’s.
Total industry compliance costs were calculated by multiplying the cost per kilo of bread making flour per year by the number of kilos of bread making flour produced per year.
Total industry compliance costs per year = (cost per kilo of bread making flour) × (number of kilos of bread making flour produced per year).
Companies were asked to provide estimates of the amount of bread making flour and (separately) white bread making flour produced or used in production for 2004-05, to facilitate calculation of the compliance cost per kilo.
Calculating the number of kilos of bread making flour and white bread making flour per year for Australia and New Zealand as a whole is difficult. There is no national data collection of the amount of bread making flour produced in either country.
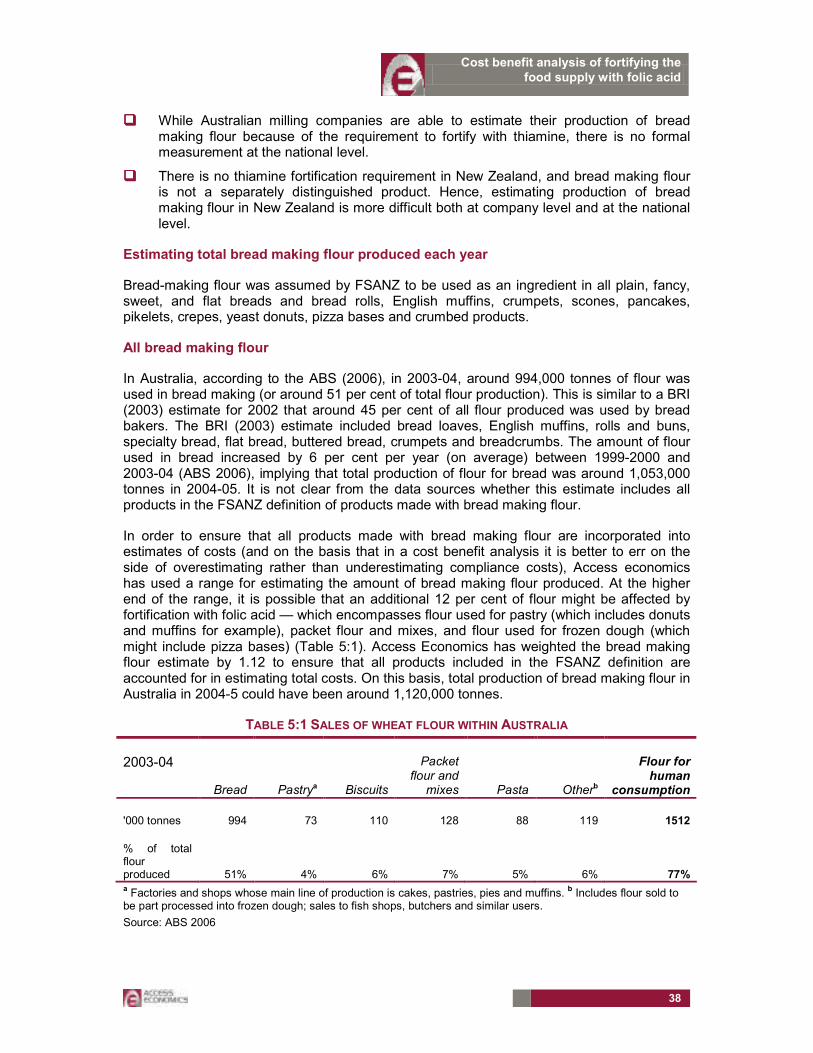
Cost benefit analysis of fortifying the food supply with folic acid
38
���� While Australian milling companies are able to estimate their production of bread making flour because of the requirement to fortify with thiamine, there is no formal measurement at the national level.
���� There is no thiamine fortification requirement in New Zealand, and bread making flour is not a separately distinguished product. Hence, estimating production of bread making flour in New Zealand is more difficult both at company level and at the national level.
Estimating total bread making flour produced each year
Bread-making flour was assumed by FSANZ to be used as an ingredient in all plain, fancy, sweet, and flat breads and bread rolls, English muffins, crumpets, scones, pancakes, pikelets, crepes, yeast donuts, pizza bases and crumbed products.
All bread making flour
In Australia, according to the ABS (2006), in 2003-04, around 994,000 tonnes of flour was used in bread making (or around 51 per cent of total flour production). This is similar to a BRI (2003) estimate for 2002 that around 45 per cent of all flour produced was used by bread bakers. The BRI (2003) estimate included bread loaves, English muffins, rolls and buns, specialty bread, flat bread, buttered bread, crumpets and breadcrumbs. The amount of flour used in bread increased by 6 per cent per year (on average) between 1999-2000 and 2003-04 (ABS 2006), implying that total production of flour for bread was around 1,053,000 tonnes in 2004-05. It is not clear from the data sources whether this estimate includes all products in the FSANZ definition of products made with bread making flour.
In order to ensure that all products made with bread making flour are incorporated into estimates of costs (and on the basis that in a cost benefit analysis it is better to err on the side of overestimating rather than underestimating compliance costs), Access economics has used a range for estimating the amount of bread making flour produced. At the higher end of the range, it is possible that an additional 12 per cent of flour might be affected by fortification with folic acid — which encompasses flour used for pastry (which includes donuts and muffins for example), packet flour and mixes, and flour used for frozen dough (which might include pizza bases) (Table 5:1). Access Economics has weighted the bread making flour estimate by 1.12 to ensure that all products included in the FSANZ definition are accounted for in estimating total costs. On this basis, total production of bread making flour in Australia in 2004-5 could have been around 1,120,000 tonnes.
TABLE 5:1 SALES OF WHEAT FLOUR WITHIN AUSTRALIA
2003-04
Bread Pastrya Biscuits
Packet flour and mixes Pasta Otherb
Flour for human
consumption
'000 tonnes 994 73 110 128 88 119 1512
% of total flour produced 51% 4% 6% 7% 5% 6% 77% a Factories and shops whose main line of production is cakes, pastries, pies and muffins.
b Includes flour sold to
be part processed into frozen dough; sales to fish shops, butchers and similar users.
Source: ABS 2006

Cost benefit analysis of fortifying the food supply with folic acid
39
According to the New Zealand Flour Millers Association (NZFMA), around 270,000 tonnes of flour was produced for all purposes in 2004-05. NZFMA estimates of the amount of flour used in bread were in the range 150,000 to 220,000 tonnes. Drawing on similar proportions in the New Zealand market compared with the Australian market, between 45 per cent25 to 51 per cent of flour is used in bread, which is consistent with the lowest NZFMA estimate of 150,000 tonnes. The higher estimate from the NZFMA (220,000 tonnes) is used as the upper limit of the range of bread making flour produced.
White bread making flour
Separating white bread making flour for the purposes of fortification with folic acid is likely to be prohibitively expensive, and production costs were not separately estimated for this option. At least one large miller in Australia, and all of the large millers in New Zealand indicated that different flours are all derived from a white flour base. For example, in New Zealand, in most cases, bakers create wholemeal loaves by adding brans to white flour. In order to separately fortify white bread making flour, some Australian and all New Zealand firms would need to alter their production processes at considerable expense. The cost estimates in this study are therefore based on fortification of all bread making flour.
5.2.1.2.1 Costs by type
An extensive search of Australian, New Zealand and international literature identified few detailed estimates of the costs to industry of mandatory fortification with folic acid — but based on the studies available, the major costs centres included labelling and packaging, capital equipment, folic acid, and analytical testing. Access Economics sought data from industry for these major cost centres, as well as other additional costs that might arise including administration, transport and storage.
Labelling and packaging
If mandatory fortification were introduced, firms would be obliged to redesign label templates to ensure compliance with labelling standards for food containing bread making flour. The redesign is likely to be relatively minor, involving a change to the ingredients list, and possibly the nutritional panel. (Ongoing costs of checking content to avoid unintentional breaches of the labelling standards are discussed below under analytical testing of content.)
���� Labelling costs faced by millers comprised replacing templates for labels on bags of flour and packages for retail flour mixes for those millers who sold directly to supermarkets or grocery stores.
���� For pre-packaged products, labelling standards require that compound ingredients26 (such as bread crumbs) be declared if the amount of the compound ingredient in the final food is 5 per cent or more by weight. In other words, if mandatory fortification is introduced, labels on products with 5 per cent or more of a compound ingredient containing fortified bread making flour will need to be altered to reflect the inclusion of folic acid (pers. comm. FSANZ, 5 May 2006).
���� If food is sold unpackaged, or made on the premises from which it is sold, or packed in the presence of the purchaser, no label is required. However, information about ingredients must be on hand if the customer asks for it. Enterprises producing
25 According to the BRI (2003), around 45 per cent of flour produced in Australian in 2002 was used by bread
bakers.
26 Compound ingredient means an ingredient of a food which is itself made from two or more ingredients.
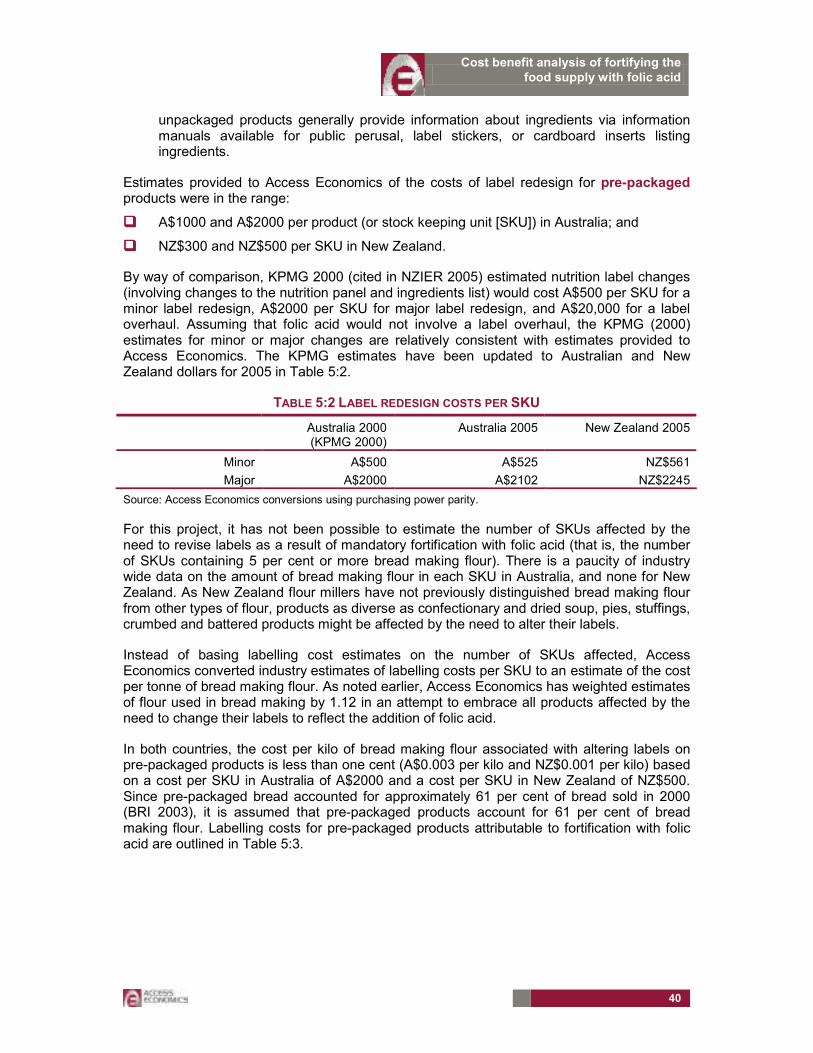
Cost benefit analysis of fortifying the food supply with folic acid
40
unpackaged products generally provide information about ingredients via information manuals available for public perusal, label stickers, or cardboard inserts listing ingredients.
Estimates provided to Access Economics of the costs of label redesign for pre-packaged products were in the range:
���� A$1000 and A$2000 per product (or stock keeping unit [SKU]) in Australia; and
���� NZ$300 and NZ$500 per SKU in New Zealand.
By way of comparison, KPMG 2000 (cited in NZIER 2005) estimated nutrition label changes (involving changes to the nutrition panel and ingredients list) would cost A$500 per SKU for a minor label redesign, A$2000 per SKU for major label redesign, and A$20,000 for a label overhaul. Assuming that folic acid would not involve a label overhaul, the KPMG (2000) estimates for minor or major changes are relatively consistent with estimates provided to Access Economics. The KPMG estimates have been updated to Australian and New Zealand dollars for 2005 in Table 5:2.
TABLE 5:2 LABEL REDESIGN COSTS PER SKU
Australia 2000 (KPMG 2000)
Australia 2005 New Zealand 2005
Minor A$500 A$525 NZ$561
Major A$2000 A$2102 NZ$2245
Source: Access Economics conversions using purchasing power parity.
For this project, it has not been possible to estimate the number of SKUs affected by the need to revise labels as a result of mandatory fortification with folic acid (that is, the number of SKUs containing 5 per cent or more bread making flour). There is a paucity of industry wide data on the amount of bread making flour in each SKU in Australia, and none for New Zealand. As New Zealand flour millers have not previously distinguished bread making flour from other types of flour, products as diverse as confectionary and dried soup, pies, stuffings, crumbed and battered products might be affected by the need to alter their labels.
Instead of basing labelling cost estimates on the number of SKUs affected, Access Economics converted industry estimates of labelling costs per SKU to an estimate of the cost per tonne of bread making flour. As noted earlier, Access Economics has weighted estimates of flour used in bread making by 1.12 in an attempt to embrace all products affected by the need to change their labels to reflect the addition of folic acid.
In both countries, the cost per kilo of bread making flour associated with altering labels on pre-packaged products is less than one cent (A$0.003 per kilo and NZ$0.001 per kilo) based on a cost per SKU in Australia of A$2000 and a cost per SKU in New Zealand of NZ$500. Since pre-packaged bread accounted for approximately 61 per cent of bread sold in 2000 (BRI 2003), it is assumed that pre-packaged products account for 61 per cent of bread making flour. Labelling costs for pre-packaged products attributable to fortification with folic acid are outlined in Table 5:3.
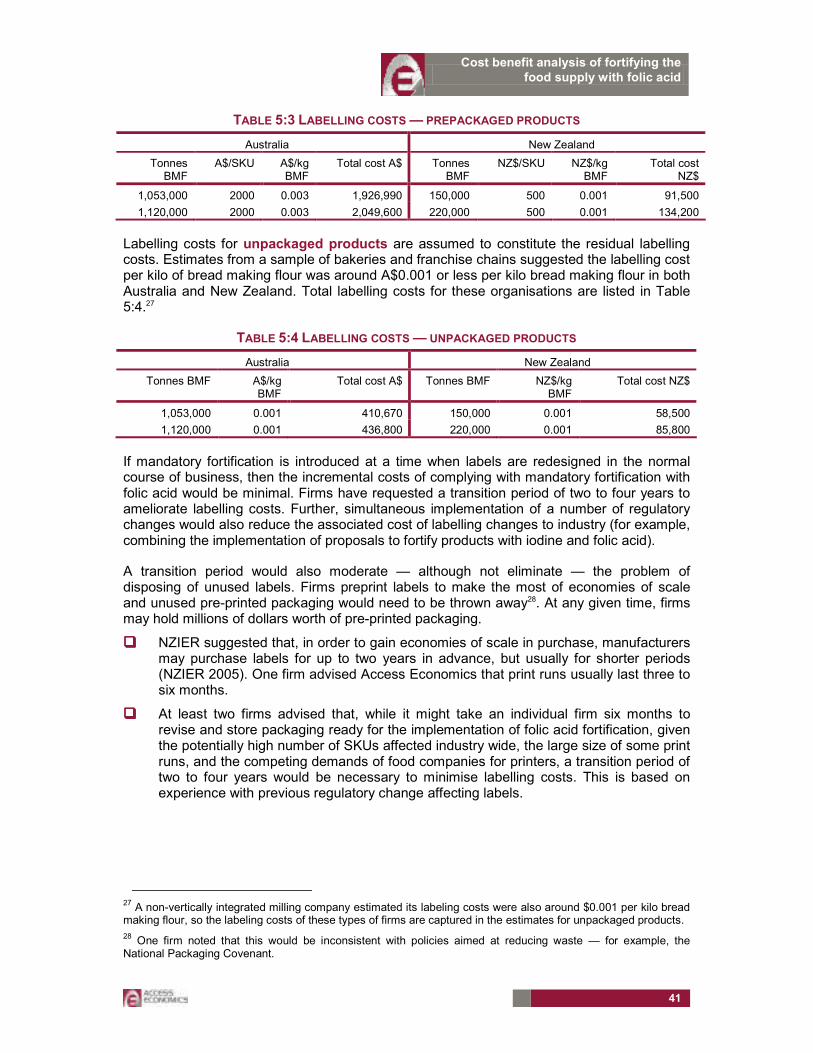
Cost benefit analysis of fortifying the food supply with folic acid
41
TABLE 5:3 LABELLING COSTS — PREPACKAGED PRODUCTS
Australia New Zealand
Tonnes BMF
A$/SKU A$/kg BMF
Total cost A$ Tonnes BMF
NZ$/SKU NZ$/kg BMF
Total cost NZ$
1,053,000 2000 0.003 1,926,990 150,000 500 0.001 91,500
1,120,000 2000 0.003 2,049,600 220,000 500 0.001 134,200
Labelling costs for unpackaged products are assumed to constitute the residual labelling costs. Estimates from a sample of bakeries and franchise chains suggested the labelling cost per kilo of bread making flour was around A$0.001 or less per kilo bread making flour in both Australia and New Zealand. Total labelling costs for these organisations are listed in Table 5:4.27
TABLE 5:4 LABELLING COSTS — UNPACKAGED PRODUCTS
Australia New Zealand
Tonnes BMF A$/kg BMF
Total cost A$ Tonnes BMF NZ$/kg BMF
Total cost NZ$
1,053,000 0.001 410,670 150,000 0.001 58,500
1,120,000 0.001 436,800 220,000 0.001 85,800
If mandatory fortification is introduced at a time when labels are redesigned in the normal course of business, then the incremental costs of complying with mandatory fortification with folic acid would be minimal. Firms have requested a transition period of two to four years to ameliorate labelling costs. Further, simultaneous implementation of a number of regulatory changes would also reduce the associated cost of labelling changes to industry (for example, combining the implementation of proposals to fortify products with iodine and folic acid).
A transition period would also moderate — although not eliminate — the problem of disposing of unused labels. Firms preprint labels to make the most of economies of scale and unused pre-printed packaging would need to be thrown away28. At any given time, firms may hold millions of dollars worth of pre-printed packaging.
���� NZIER suggested that, in order to gain economies of scale in purchase, manufacturers may purchase labels for up to two years in advance, but usually for shorter periods (NZIER 2005). One firm advised Access Economics that print runs usually last three to six months.
���� At least two firms advised that, while it might take an individual firm six months to revise and store packaging ready for the implementation of folic acid fortification, given the potentially high number of SKUs affected industry wide, the large size of some print runs, and the competing demands of food companies for printers, a transition period of two to four years would be necessary to minimise labelling costs. This is based on experience with previous regulatory change affecting labels.
27 A non-vertically integrated milling company estimated its labeling costs were also around $0.001 per kilo bread
making flour, so the labeling costs of these types of firms are captured in the estimates for unpackaged products.
28 One firm noted that this would be inconsistent with policies aimed at reducing waste — for example, the
National Packaging Covenant.
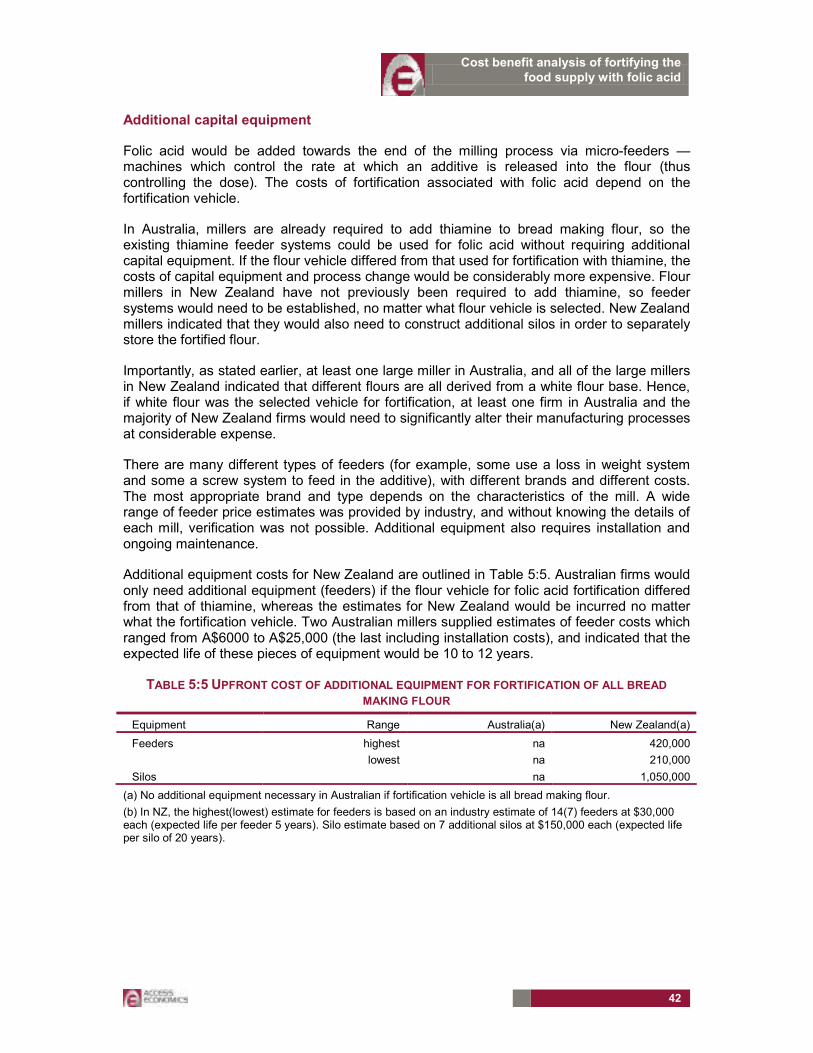
Cost benefit analysis of fortifying the food supply with folic acid
42
Additional capital equipment
Folic acid would be added towards the end of the milling process via micro-feeders — machines which control the rate at which an additive is released into the flour (thus controlling the dose). The costs of fortification associated with folic acid depend on the fortification vehicle.
In Australia, millers are already required to add thiamine to bread making flour, so the existing thiamine feeder systems could be used for folic acid without requiring additional capital equipment. If the flour vehicle differed from that used for fortification with thiamine, the costs of capital equipment and process change would be considerably more expensive. Flour millers in New Zealand have not previously been required to add thiamine, so feeder systems would need to be established, no matter what flour vehicle is selected. New Zealand millers indicated that they would also need to construct additional silos in order to separately store the fortified flour.
Importantly, as stated earlier, at least one large miller in Australia, and all of the large millers in New Zealand indicated that different flours are all derived from a white flour base. Hence, if white flour was the selected vehicle for fortification, at least one firm in Australia and the majority of New Zealand firms would need to significantly alter their manufacturing processes at considerable expense.
There are many different types of feeders (for example, some use a loss in weight system and some a screw system to feed in the additive), with different brands and different costs. The most appropriate brand and type depends on the characteristics of the mill. A wide range of feeder price estimates was provided by industry, and without knowing the details of each mill, verification was not possible. Additional equipment also requires installation and ongoing maintenance.
Additional equipment costs for New Zealand are outlined in Table 5:5. Australian firms would only need additional equipment (feeders) if the flour vehicle for folic acid fortification differed from that of thiamine, whereas the estimates for New Zealand would be incurred no matter what the fortification vehicle. Two Australian millers supplied estimates of feeder costs which ranged from A$6000 to A$25,000 (the last including installation costs), and indicated that the expected life of these pieces of equipment would be 10 to 12 years.
TABLE 5:5 UPFRONT COST OF ADDITIONAL EQUIPMENT FOR FORTIFICATION OF ALL BREAD
MAKING FLOUR
Equipment Range Australia(a) New Zealand(a)
Feeders highest na 420,000
lowest na 210,000
Silos na 1,050,000
(a) No additional equipment necessary in Australian if fortification vehicle is all bread making flour.
(b) In NZ, the highest(lowest) estimate for feeders is based on an industry estimate of 14(7) feeders at $30,000 each (expected life per feeder 5 years). Silo estimate based on 7 additional silos at $150,000 each (expected life per silo of 20 years).

Cost benefit analysis of fortifying the food supply with folic acid
43
Folic acid
The price range for folic acid is noted above. Assuming firms choose the cheapest, their outlay will be in the range A$30 to A$50 per kilo of folic acid (NZ$32 and NZ$53.4029). Most firms in Australia priced folic acid at around A$40 per kilo of folic acid (NZ$42.72).
The amount of folic acid added to the flour is likely to include an overage to ensure content is maintained at a certain level and to cover losses of folic acid in baking of between 0 and 40 per cent (pers. comm. FSANZ, 5 May 2006). One miller indicated — based on experience with thiamine and other (voluntary) additives — that overages of 25 to 100 per cent might be necessary. For the purposes of this report, an overage of 25 per cent is assumed based on advice of FSANZ (pers. comm., FSANZ, 5 May 2006). The cost of folic acid per tonne of flour with a 25 per cent overage is shown in Table 5:6. (Note that a microgram is 1/1,000,000 grams.)
TABLE 5:6 COST OF FOLIC ACID PER TONNE FLOUR WITH 25% OVERAGE
Price folic acid A$30/kg folic acid
A$50/kg folic acid
NZ$32/kg folic acid
NZ$53.4/kg folic acid
Folic acid content of flour
Australia (A$ per tonne BMF)
New Zealand (NZ$ per tonne BMF)
100µg/100g flour A$0.0375 A$0.0625 NZ$0.0401 NZ$0.0668
200µg/100g flour A$0.0750 A$0.1250 NZ$0.0801 NZ$0.1335
The total cost of folic acid under the two dosage regimes (100µg per 100g flour and 200µg per 100g flour), reflecting different assumptions about total production of bread making flour and including costs based on the industry estimate of the price of folic acid at around A$40 per kilo folic acid is shown in Table 5:7.
TABLE 5:7 TOTAL COST OF FOLIC ACID ADDED TO BMF PER YEAR
Flour folic acid content Australia New Zealand
µg/100g 1,053,000 tonnes BMF
1,120,000 tonnes BMF
150,000 tonnes BMF
220,000 tonnes BMF
Price of folic acid per kg: A$30 or NZ$32
100 A$39,488 A$42,000 NZ$6,009 NZ$8,813
200 A$78,975 A$84,000 NZ$12,017 NZ$17,625
Price of folic acid per kg: A$40 or NZ$42.72
100 A$52,650 A$56,000 NZ$8,010 NZ$11,748
200 A$105,300 A$112,000 NZ$16,020 NZ$23,496
Price of folic acid per kg: A$50 or NZ$53.4
100 A$65,813 A$70,000 NZ$10,014 NZ$14,688
200 A$131,625 A$140,000 NZ$20,029 NZ$29,375
It is difficult to feed tiny quantities of additives into flour at a consistent rate, so the folic acid would be included as part of a premix (a carrier agent such as semolina or another fine flour) which would facilitate regulation of the dose. Some millers would be able to prepare the premix ‘in-house’, thus incurring labour costs. Others would prepare the premix off the
29 Converted using purchasing power parity.

Cost benefit analysis of fortifying the food supply with folic acid
44
premises, incurring mixing, transport and packaging costs. Estimates of costs per year associated with premix are outlined in table 5:8.
TABLE 5:8 COST PER YEAR ASSOCIATED WITH FOLIC ACID PREMIX
Australia New Zealand
tonnes BMF 1,120,000 1,053,000 220,000 150,000
cost per year A$51,893 A$48,789 NZ$343,200 NZ$234,000
During consultations with FSANZ, some millers expressed concerns about the impact on worker health and safety premiums related to the need to manually add premix into the micro-feeder. However, smaller bag sizes would mitigate any health risks associated with manual handling. In addition, fortification with folic acid is unlikely to make a material difference to the amount of manual handling already involved in working at the mill (and thus no difference to assessments of occupational health and safety premiums).
Analytical testing of content
A laboratory in Victoria advised that charges for analytical testing of folic acid content in flour would range from A$100 to A$200. Most millers estimated costs on the basis of A$200 per test. The total costs of analytical testing depend on the quality assurance approach adopted by each company. One Australian miller advised that it would need to conduct two tests per month. Other companies’ cost estimates were considerably higher than this. The range of estimates of analytical testing costs are presented in Table 5:9. New Zealand costs are based on Australian estimates, converted to New Zealand dollars using purchasing power parity.
TABLE 5:9 COSTS PER YEAR ASSOCIATED WITH ANALYTICAL TESTING
Australia New Zealand
tonnes BMF 1,120,000 1,053,000 220,000 150,000
highest A$673,077 A$632,813 NZ$141,202 NZ$96,274
lowest A$282,947 A$266,021 NZ$59,358 NZ$40,472
Other ongoing costs
Other ongoing costs incurred by industry associated with mandatory fortification might include administration (training, auditing and reporting activities), flushing out mills with flour to remove traces of folic acid, and ongoing storage costs (identified by New Zealand mills associated with storing fortified and unfortified flour separately). These costs are summarised in Table 5:10.
TABLE 5:10 OTHER COSTS PER YEAR
Australia New Zealand
Flush out mill A$33,700 NZ$1,701,000
Administration A$186,878 NZ$11,200
Storage na NZ$40,040
220,578 1,752,240
5.2.1.2.2 Other issues
���� Public liability insurance premiums paid by industry. It has been assumed that these will remain unchanged as a result of folic acid fortification because the health risk-benefit assessment commissioned by FSANZ concluded that folic acid intakes of
Cost benefit analysis of fortifying the food supply with folic acid
45
less than 1.0mg per day present no risk to health. In the event that health risks were identified, insurance premiums could rise.
���� The impact on the price of bread. Bread and flour markets are highly competitive. While most millers indicated that cost increases would not be passed on to consumers, and as far as some millers could remember, cost increases were not passed on for thiamine fortification — the cost of the introduction of thiamine would have been difficult to separate from overall movements in costs and the noise in the data. It is likely that over time bread prices would rise slightly — probably less than one per cent. A change in the price of bread as a consequence of fortification could impact on the benefits associated with fortification by changing bread consumption patterns. However, demand for bread is relatively inelastic and the price change is likely to be small (a few cents perhaps), so the change in consumption of bread (if any) would probably be small.
���� Joint implementation of FSANZ proposals. A number of industry representatives noted that joint implementation of two of the FSANZ proposals currently being considered — the proposal to require mandatory fortification of flour with folic acid and the proposal relating to fortification with iodine (FSANZ proposal P230 in the event that flour is the food vehicle) — would minimise costs to industry.
5.2.1.2.3 Summary
The costs to industry of mandatory fortification of all bread making flour with folic acid (assuming the same specifications for the food vehicle as for thiamine fortification) are summarised in Table 5:11.
Industry in both Australia and New Zealand would incur upfront costs associated with changing labelling. Changes to labelling pre-packaged products are likely to affect a large number of product lines because labelling standards require that the ingredients of a compound (such as bread making flour) be declared if the amount of the compound ingredient in the final food is 5 per cent or more by weight. New Zealand firms would also incur upfront costs associated with purchasing and installing new equipment. Feeder systems for thiamine are already in place in Australian mills, whereas there are no feeder systems currently in place in NZ. New Zealand millers also indicated that additional silos would be necessary in NZ to enable fortified and non-fortified flour to be stored separately. Upfront costs for Australian industry would be around A$2.5million, and in New Zealand, NZ$1.7million.
After the passing of these initial outlays, the recurrent costs per year (related to the purchase of folic acid, preparation of premix, analytical testing, flushing out mills, storage and administration) would fall to just over A$1million in Australia and up to NZ$2.3million in New Zealand. The higher ongoing (or yearly costs) for New Zealand firms reflect higher cost estimates provided by New Zealand millers in relation to flushing out mills to remove traces of folic acid, and also higher estimates of the cost associated with preparation of folic acid premix.
The high and low estimates for Australian firms reflect differences in approaches to analytical testing. In New Zealand, the high and low estimates reflect differences in approaches to analytical testing as well as different estimates of the number of feeders required.
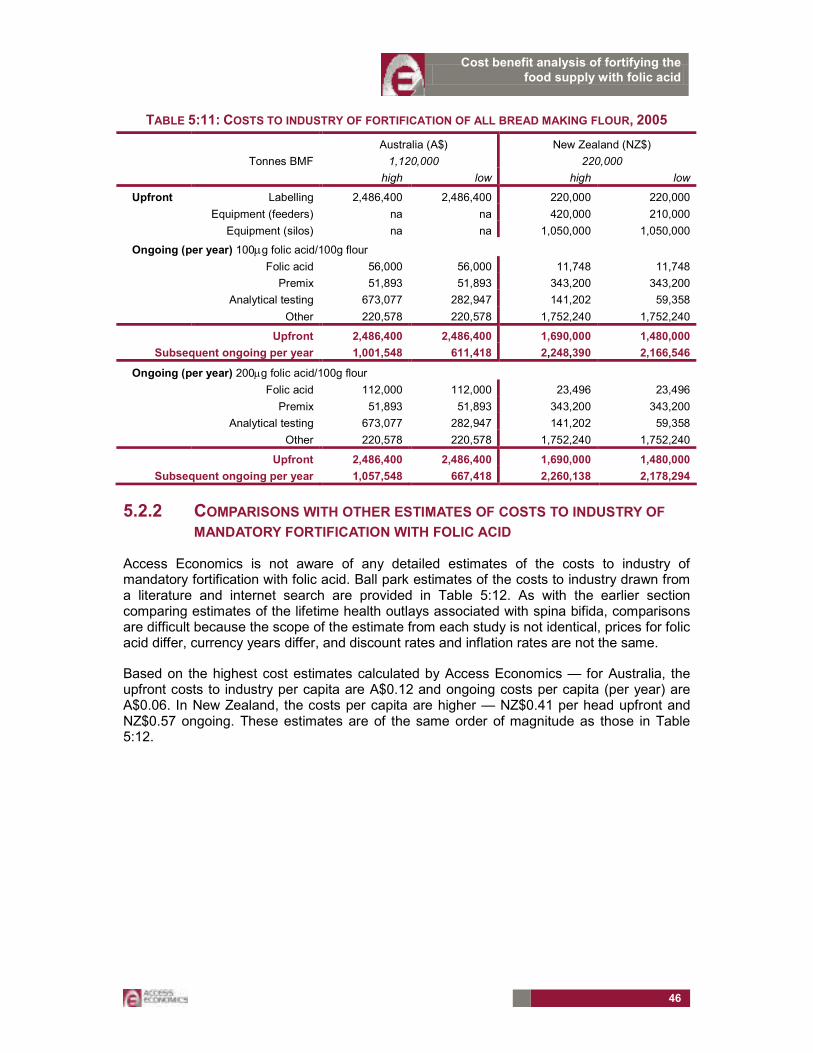
Cost benefit analysis of fortifying the food supply with folic acid
46
TABLE 5:11: COSTS TO INDUSTRY OF FORTIFICATION OF ALL BREAD MAKING FLOUR, 2005
Australia (A$) New Zealand (NZ$)
Tonnes BMF 1,120,000 220,000
high low high low
Upfront Labelling 2,486,400 2,486,400 220,000 220,000
Equipment (feeders) na na 420,000 210,000
Equipment (silos) na na 1,050,000 1,050,000
Ongoing (per year) 100µg folic acid/100g flour
Folic acid 56,000 56,000 11,748 11,748
Premix 51,893 51,893 343,200 343,200
Analytical testing 673,077 282,947 141,202 59,358
Other 220,578 220,578 1,752,240 1,752,240
Upfront 2,486,400 2,486,400 1,690,000 1,480,000
Subsequent ongoing per year 1,001,548 611,418 2,248,390 2,166,546
Ongoing (per year) 200µg folic acid/100g flour
Folic acid 112,000 112,000 23,496 23,496
Premix 51,893 51,893 343,200 343,200
Analytical testing 673,077 282,947 141,202 59,358
Other 220,578 220,578 1,752,240 1,752,240
Upfront 2,486,400 2,486,400 1,690,000 1,480,000
Subsequent ongoing per year 1,057,548 667,418 2,260,138 2,178,294
5.2.2 COMPARISONS WITH OTHER ESTIMATES OF COSTS TO INDUSTRY OF
MANDATORY FORTIFICATION WITH FOLIC ACID
Access Economics is not aware of any detailed estimates of the costs to industry of mandatory fortification with folic acid. Ball park estimates of the costs to industry drawn from a literature and internet search are provided in Table 5:12. As with the earlier section comparing estimates of the lifetime health outlays associated with spina bifida, comparisons are difficult because the scope of the estimate from each study is not identical, prices for folic acid differ, currency years differ, and discount rates and inflation rates are not the same.
Based on the highest cost estimates calculated by Access Economics — for Australia, the upfront costs to industry per capita are A$0.12 and ongoing costs per capita (per year) are A$0.06. In New Zealand, the costs per capita are higher — NZ$0.41 per head upfront and NZ$0.57 ongoing. These estimates are of the same order of magnitude as those in Table 5:12.
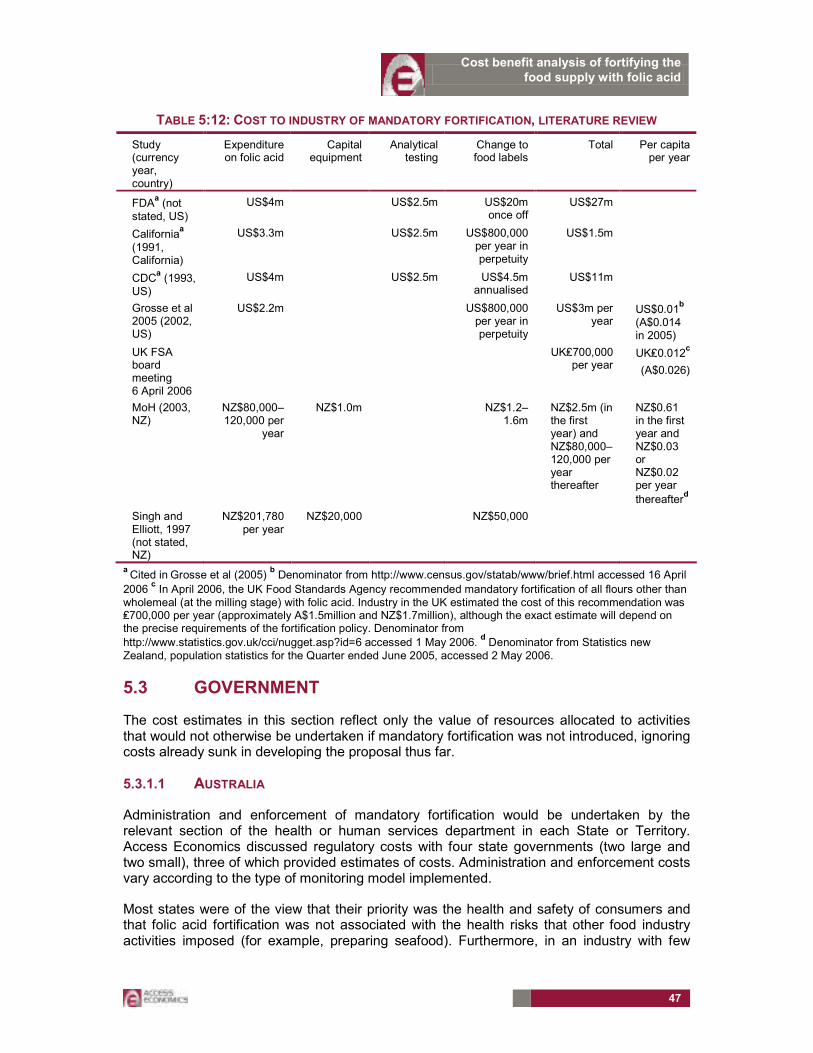
Cost benefit analysis of fortifying the food supply with folic acid
47
TABLE 5:12: COST TO INDUSTRY OF MANDATORY FORTIFICATION, LITERATURE REVIEW
Study (currency year, country)
Expenditure on folic acid
Capital equipment
Analytical testing
Change to food labels
Total Per capita per year
FDAa (not
stated, US)
US$4m US$2.5m US$20m once off
US$27m
Californiaa
(1991, California)
US$3.3m US$2.5m US$800,000 per year in perpetuity
US$1.5m
CDCa (1993,
US)
US$4m US$2.5m US$4.5m annualised
US$11m
Grosse et al 2005 (2002, US)
US$2.2m US$800,000 per year in perpetuity
US$3m per year
US$0.01b
(A$0.014 in 2005)
UK FSA board meeting 6 April 2006
UK₤700,000 per year
UK₤0.012c
(A$0.026)
MoH (2003, NZ)
NZ$80,000–120,000 per
year
NZ$1.0m NZ$1.2–1.6m
NZ$2.5m (in the first year) and NZ$80,000–120,000 per year thereafter
NZ$0.61 in the first year and NZ$0.03 or NZ$0.02 per year
thereafterd
Singh and Elliott, 1997 (not stated, NZ)
NZ$201,780 per year
NZ$20,000 NZ$50,000
a Cited in
Grosse et al (2005)
b Denominator from http://www.census.gov/statab/www/brief.html accessed 16 April
2006 c In April 2006, the UK Food Standards Agency recommended mandatory fortification of all flours other than
wholemeal (at the milling stage) with folic acid. Industry in the UK estimated the cost of this recommendation was ₤700,000 per year (approximately A$1.5million and NZ$1.7million), although the exact estimate will depend on the precise requirements of the fortification policy. Denominator from
http://www.statistics.gov.uk/cci/nugget.asp?id=6 accessed 1 May 2006. d Denominator from Statistics new
Zealand, population statistics for the Quarter ended June 2005, accessed 2 May 2006.
5.3 GOVERNMENT
The cost estimates in this section reflect only the value of resources allocated to activities that would not otherwise be undertaken if mandatory fortification was not introduced, ignoring costs already sunk in developing the proposal thus far.
5.3.1.1 AUSTRALIA
Administration and enforcement of mandatory fortification would be undertaken by the relevant section of the health or human services department in each State or Territory. Access Economics discussed regulatory costs with four state governments (two large and two small), three of which provided estimates of costs. Administration and enforcement costs vary according to the type of monitoring model implemented.
Most states were of the view that their priority was the health and safety of consumers and that folic acid fortification was not associated with the health risks that other food industry activities imposed (for example, preparing seafood). Furthermore, in an industry with few
Cost benefit analysis of fortifying the food supply with folic acid
48
firms (such as flour milling) where fortification can be accomplished via automated processes, resources devoted to compliance monitoring are likely to be relatively low (for example compared with monitoring a large number of small firms some of which may use manual processes such as bakers). In this case, the most likely approach would involve an initial compliance audit (involving random testing of product content), followed by ongoing responses to complaints, together with auditing activities that are combined with general monitoring of labels at little marginal cost. Other cost centres include: awareness raising and training, administration and enforcement (dealing with complaints). Most governments in Australia were of the view that there would be few complaints based on their experience with thiamine. The costs of prosecutions have not been included in the analysis. Prosecutions are rarely mounted on food standards compliance issues (pers. comm., FSANZ, 4 May 2006), with ‘encouragement’ being the preferred approach.
Access Economics has presented costs for the most likely monitoring scenario. Overall, given the relatively minimalist enforcement regime envisaged by state governments, the cost estimates associated with folic acid fortification are relatively low. The risk inherent in a minimalist enforcement regime are that the benefits of folic acid fortification will not be realised. Given fixed regulatory resources, however, state governments need to balance this against the other health and safety risks in their purview.
���� State estimates of the costs of awareness raising and training incorporated training for internal staff, one or two meetings between health officers and industry, two half day workshops, and time allocated to responding to one enquiry per week from industry and local government. Converting the cost in one state to a per head figure and applying this to the Australian population generates a once off cost of $208,600. To calculate the associated cost per year, the total cost has been amortised over 10 years (see Table 5:13).
���� For auditing and monitoring flour content, some states indicated that if mandatory fortification was introduced, they would either require that millers provide the results of their content analyses to government, or undertake analytical testing of output from a random sample of firms. Based on one State government estimate of the cost of surveying a sample of flour millers in that state, and converting this to a cost per head applied Australia wide, the cost of surveying and testing of product from a sample of firms would be $68,110 in 2005-06 (not including overheads). Multiplying by 1.156 to include overheads generates a per annum cost of $78,735.
In addition, depending on the type of monitoring model selected, there may be costs involved in checking labels. Only one state indicated that labels would be checked, and provided cost estimates based on a comprehensive approach — that is, during visits to food premises selling pre-packaged flour based products, health officers might spend an additional 30 minutes examining labels. Converting this to a cost per head and applying it to the Australian population results in a total cost of $2,085,680 in one year. A less comprehensive approach involving visits to 20 per cent of food premises selling pre-packaged flour based products would cost $417,136 in one year. Given that labelling templates are fixed for a number of years, it is likely that comprehensive checking would not be required after the first year, so Access Economics has adopted the second of these cost estimates. (The second estimate is equivalent to the comprehensive approach if the latter was undertaken once every five years, which is consistent with feedback provided by one Australian flour miller who suggested that five years was the approximate life cycle of its product label templates.) Given the significance of this cost in relation to the others (see Table 5:13) and the fact that only one state indicated label checking would form a component of its monitoring approach,

Cost benefit analysis of fortifying the food supply with folic acid
49
total costs to government of fortification in Australia have been calculated both including and excluding this cost.
���� States estimated that there would be little administration involved. The costs are estimated on the basis of state government estimates of 10 hours per year administration for one state. Applying the equivalent cost per head Australia wide generates a cost of $41,714 per year.
���� There would be some costs associated with addressing folate related complaints, but based on experience with thiamine, these are likely to be few. Based on the estimated costs of dealing with complaints provided by two states, (including 8 hours for processing each complaint and the costs of laboratory testing at around $100 per sample), and applying the average cost of this per head to the Australia population, the cost of dealing with complaints relating to folate might be $9500 in 2005-06.
The Australia-wide government costs associated with mandatory fortification of bread making flour with folic acid are summarised in Table 5:13. Costs per year range from A$151,000 to A$568,000, depending on the monitoring approach implemented.
TABLE 5:13: ESTIMATED COSTS OF ADMINISTERING AND ENFORCING THE REGULATION, AUSTRALIA (A$)
Type of activity 10 year cost (Australia) Cost per year
Training and awareness raising 208,600 20,860
Auditing content 78,735
Auditing labels 417,136
Administration 41,714
Complaints 9,500
Total (inc auditing of labels) 567,945
Total (exc. Auditing of labels) 150,809
5.3.1.2 NEW ZEALAND
Administration and enforcement of mandatory fortification in New Zealand would be undertaken by the New Zealand Food Safety Authority (NZFSA). The NZFSA estimates of the associated costs are outlined in Table 5:14. The major cost centres include:
���� The costs of training and awareness raising, estimated based on 100 hours for discussions with industry, 100 hours of training government staff, and 10 hours facilitating industry training;
���� Auditing, likely to be contracted out at $80,000 per year;
���� The cost of administration based on 20 hours in the first year and 10 hours per year thereafter;
���� Dealing with complaints, based on 100 hours in the first year and 10 hours per year thereafter; and
���� Enforcement. One prosecution would cost $80,000, and encouraging compliance might cost around 20 hours per year.

Cost benefit analysis of fortifying the food supply with folic acid
50
TABLE 5:14: ESTIMATED COSTS OF ADMINISTERING AND ENFORCING THE REGULATION, NEW
ZEALAND (NZ$)
10 year cost Cost per year
Awareness raising 12,000 1,200
Training 13,200 1,320
Auditing 800,000 80,000
Administration 13,200 1,320
Complaints 22,800 2,280
Compliance (including one prosecution) 104,000 10,400
Total (with prosecution)
Total (without prosecution)
965,200
885,200
96,520
88,520
5.4 SUMMARY OF COSTS
The annual costs associated with mandatory fortification of all bread making flour with folic acid are summarised in Table 5:15.
TABLE 5:15: SUMMARY OF COSTS OF MANDATORY FORTIFICATION OF ALL BREAD MAKING FLOUR
PER YEAR
Australia (A$) New Zealand (NZ$)
100µg/100g 200µg/100g 100µg/100g 200µg/100g
Industry First year 2,486,400 2,486,400 1,690,000 1,690,000
Ongoing per year 1,001,548
1,057,548
2,248,390
2,260,138
Government 150,809 150,809 88,520 88,520
Total Upfront 2,486,400 2,486,400 1,690,000 1,690,000
Ongoing per year 1,152,357 1,208,357 2,336,910 2,348,658

Cost benefit analysis of fortifying the food supply with folic acid
51
6. THE NET BENEFITS OF MANDATORY FORTIFICATION
The tables below in section 6.1 and 6.2 show the net benefits of mandatory fortification, with the net present value of net benefits calculated over a 15 year period. The full calculations for the mean scenarios are presented in the appendix tables at the end of this document in landscape format.
6.1 LIVE NTD BIRTHS
Table 6:1 summarises the results for live NTD births (excluding the benefits associated with preventing NTD terminations and still births). With the exception of the lower confidence interval for New Zealand for the dose of 100µg folic acid per 100g flour, the benefits outweigh the costs.

Cost benefit analysis of fortifying the food supply with folic acid
52
TABLE 6:1: NET BENEFITS OF MANDATORY FORTIFICATION, ALL BREAD MAKING FLOUR
Lower confidence limit (95%) Mean Upper confidence limit (95%)
Australia (A$)
Folic acid content per 100g flour in the final food
100µg 200µg 100µg 200µg 100µg 200µg
Benefit per year (A$)
5,406,727 13,511,929 10,041,063 25,093,582 18,923,543 47,291,750
Cost first year (A$) 2,486,400 2,486,400 2,486,400 2,486,400 2,486,400 2,486,400
Cost per year subsequent years (A$) 1,152,357 1,208,357 1,152,357 1,208,357 1,152,357 1,208,357
NPV net benefit over 15
years
$55,920,180 $163,005,247 $117,522,626 $316,955,679 $235,593,992 $612,027,334
Ratio benefits to costs
4.5 10.8 8.4 20.1 15.8 37.9
New Zealand (NZ$)
Benefit per year (NZ$)
1,765,616 3,559,419 3,531,232 7,118,839 6,473,925 13,051,204
Cost first year (NZ$) 1,690,000 1,690,000 1,690,000 1,690,000 1,690,000 1,690,000
Cost per year subsequent years (NZ$) 2,336,910 2,348,658 2,336,910 2,348,658 2,336,910 2,348,658
NPV net benefit over 15
years
-$6,468,424 16,553,607 15,717,439 61,333,031 52,693,881 135,876,215
Ratio benefits to costs
0.8 1.6 1.5 3.2 2.8 5.8
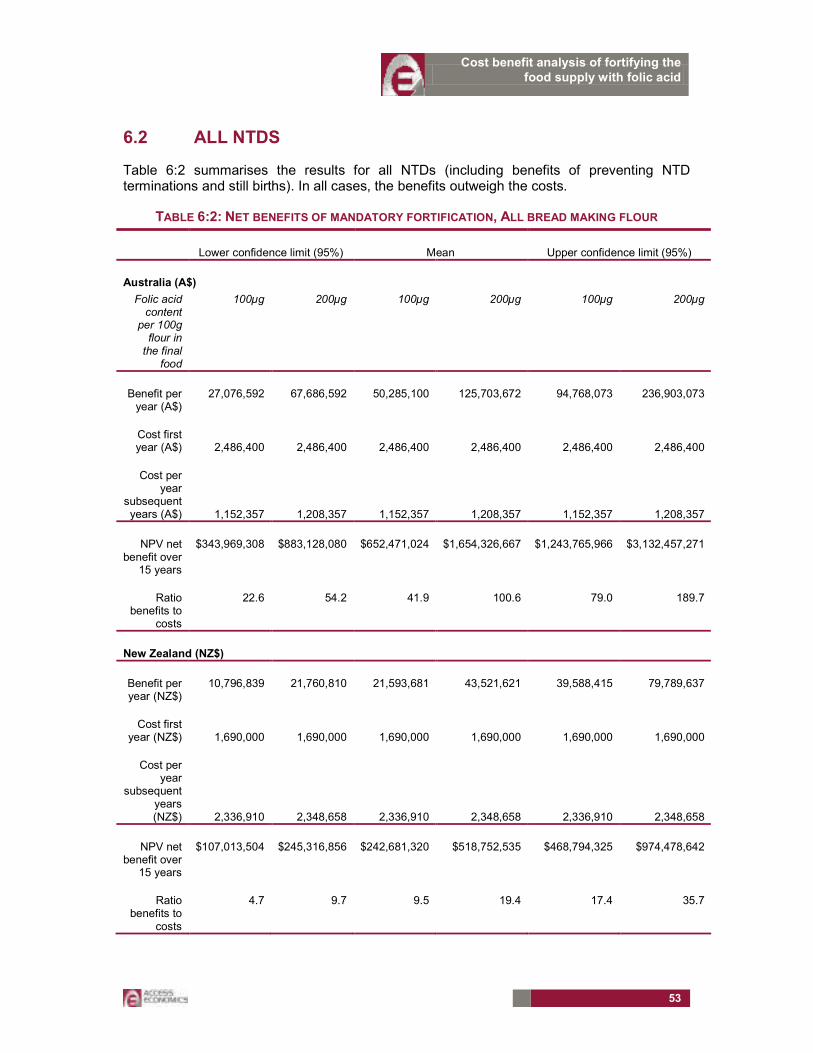
Cost benefit analysis of fortifying the food supply with folic acid
53
6.2 ALL NTDS
Table 6:2 summarises the results for all NTDs (including benefits of preventing NTD terminations and still births). In all cases, the benefits outweigh the costs.
TABLE 6:2: NET BENEFITS OF MANDATORY FORTIFICATION, ALL BREAD MAKING FLOUR
Lower confidence limit (95%) Mean Upper confidence limit (95%)
Australia (A$)
Folic acid content
per 100g flour in the final
food
100µg 200µg 100µg 200µg 100µg 200µg
Benefit per year (A$)
27,076,592 67,686,592 50,285,100 125,703,672 94,768,073 236,903,073
Cost first year (A$) 2,486,400 2,486,400 2,486,400 2,486,400 2,486,400 2,486,400
Cost per year
subsequent years (A$) 1,152,357 1,208,357 1,152,357 1,208,357 1,152,357 1,208,357
NPV net benefit over
15 years
$343,969,308 $883,128,080 $652,471,024 $1,654,326,667 $1,243,765,966 $3,132,457,271
Ratio benefits to
costs
22.6 54.2 41.9 100.6 79.0 189.7
New Zealand (NZ$)
Benefit per year (NZ$)
10,796,839 21,760,810 21,593,681 43,521,621 39,588,415 79,789,637
Cost first year (NZ$) 1,690,000 1,690,000 1,690,000 1,690,000 1,690,000 1,690,000
Cost per year
subsequent years (NZ$) 2,336,910 2,348,658 2,336,910 2,348,658 2,336,910 2,348,658
NPV net benefit over
15 years
$107,013,504 $245,316,856 $242,681,320 $518,752,535 $468,794,325 $974,478,642
Ratio benefits to
costs
4.7 9.7 9.5 19.4 17.4 35.7

Cost benefit analysis of fortifying the food supply with folic acid
54
7. CONCLUSION
In both Australia and New Zealand, at fortification doses of 200µg folic acid per 100g bread making flour, the benefits of mandatory fortification of all bread making flour with folic acid outweigh the costs.
At fortification doses of 100µg folic acid per 100g bread making flour, the benefits generally outweigh the costs — with the exception of one scenario for New Zealand. In New Zealand, if the benefits associated with preventing terminations and still births are excluded, based on the lower estimate of NTDs prevented, the costs outweigh the benefits.
The benefits of avoiding disability and premature death constitutes the largest component of the benefits of fortification, with preventing the loss of lifetime earnings of people with NTDs who are not able to participate fully in the labour force the second largest component reflect.
On the cost side, separating white bread making flour for the purposes of fortification with folic acid is likely to be prohibitively expensive, and production costs were not separately estimated for this option. At least one large miller in Australia, and all of the large millers in New Zealand indicated that different flours are all derived from a white flour base. For example, in New Zealand, in most cases, bakers create wholemeal loaves by adding brans to white flour. In order to separately fortify white bread making flour, some Australian and all New Zealand firms would need to alter their production processes at considerable expense. The cost estimates in this study are therefore based on fortification of all bread making flour.
The costs of fortification on a per capita basis are higher in New Zealand than Australia because Australian mills already have feeder systems in place for adding thiamine (which become mandatory in 1991). New Zealand mills on the other hand, need to purchase and install new feeders and silos to accommodate the addition of folic acid.
The upfront costs of changes to labelling pre-packaged products is large because a large number of product lines are likely to be affected. The cost to industry of the proposal could be minimised by introducing proposals with impacts for labelling simultaneously with a transition period that allows labelling changes to be undertaken in accordance with the labelling/packaging cycle. In addition, a number of industry representatives suggested that joint implementation of two of the FSANZ proposals currently being considered — the proposal to require mandatory fortification of flour with folic acid and the proposal relating to fortification with iodine (FSANZ proposal P230 in the event that flour is the food vehicle) — would minimise their costs.
The occurrence of NTDs among Australian Indigenous people seems relatively high (although there are data quality issues). In addition, examination of Australian data by Lancaster and Hurst (2000) found that the risk of NTDs is higher for younger women, and studies referenced in Bower (2005) suggest that the risk of NTDs is higher for those in lower socioeconomic groups. This study has not been able to examine the impact of the FSANZ proposal by demographic group because of lack of data.

Cost benefit analysis of fortifying the food supply with folic acid
55
8. REFERENCES
Abraham B and Webb K, 2001, Interim evaluation of the voluntary folate fortification policy, Australian food and nutrition monitoring unit, Commonwealth Department of Health and Aged Care.
ABS (Australian Bureau of Statistics), Deaths Australia, 2005, cat. no. 3302.0.
_____________________________, Population by Age and Sex, Australian States and Territories, Jun 2005, Table 9, cat. no. 3201.0.
_____________________________, Australian Labour Market Statistics, 2005, cat. no. 6105.0.
_____________________________, Year Book Australia, 2006, cat. no. 1301.0.
Access Economics 2003 Exceptional returns: the value of investing in health R&D in Australia, Prepared for the Australian Society for Medical Research, September.
Access Economics 2005 The economic cost of arthritis in New Zealand, Report by Access economic Pty Limited for Arthritis New Zealand.
Access Economics 2005 Arthritis – the bottom line: The economic impact of arthritis in Australia, Report for Arthritis Australia, Canberra, January.
AIHW (Australian Institute of Health and Welfare) 2005, Health expenditure Australia 2003–04. AIHW Cat. No. HWE 32 (Health and Welfare Expenditure Series No. 25). Canberra: AIHW.
Bol KA, Collins JS, Kirby RS, 2006, National Birth Defects Prevention Network Survival of infants with neural tube defects in the presence of folic acid fortification Pediatrics. Mar;117(3):930-2.
Botto L, Lisi A, Robert-Gnansia E, Erickson JD, Vollset S, Mastroiacovo P, Botting B, Cocchi G, de Vigan C, de Walle H, Feijoo M, Irgens L, McDonnell B, Merlob P, Ritvanen A, Scarano G, Siffel C, Metneki J, Stoll C, Smithells R, Goujard J, 2005, International retrospective cohort study of neural tube defects in relation to folic acid recommendations: are the recommendations working? BMJ, 330, pp. 571-
Bower C, Hobbs M, Carney A, Simpson D, 1984, Neural tube defects in Western Australia 1966-81 and a review of Australian data 1942-81, Journal of Epidemiology and Community health, 38, pp. 208-213.
Bower C, Eades S, Payne J, D’Antoine H, Stanley F, 2004, Trends in neural tube defects in Western Australia in Indigenous and non-Indigenous populations, Paediatric and perinatal epidemiology, 18, pp. 277-280.
Bower C, Miller M, Payne J, Serna P, 2005, Promotion of folate for the prevention of neural tube defects: who benefits? Paediatric and perinatal epidemiology, 19, pp. 435-444.

Cost benefit analysis of fortifying the food supply with folic acid
56
Bower C, Goldblatt J, Hagan R, Knowles S, 1989, Recommendations for screening for neural tube defects in Western Australia using maternal serum alpha-feto-protein estimation, Occasional paper 39 Health Department of Western Australia.
Bowman, R. M., McLone, D. G., Grant, J. A., Tomita, T., & Ito, J. A. (2001). Spina bifida outcome: A 25-year prospective. Pediatric Neuro surg 34(3), pp. 114-120.
Busby A, Abramsky L, Dolk H, Armstrong B, 2005, Preventing neural tube defects in Europe: population based study, BMJ, 330, p. 574.
Bureau of Transport and Regional Economics (2002) Rail Accident Costs in Australia, Report 108, Commonwealth of Australia, Canberra.
Bureau of Transport Economics (2000) Road Crash Costs in Australia, Bureau of Transport Economics, Report 102, Canberra.
BRI (Bread Research Institute) 2003, A profile of the Australian Baking Industry.
CIE (Centre for International Economics), 2004, Child Health Research, Estimating the contribution of ICHR, prepared for the Telethon Institute of Child Health Research (ICHR)
Cutler DM and Richardson E (1998) The Value of Health: 1970-1990, JCPR Working Paper 28, prepared for the AEA session on “What we get for health care spending” downloadable from www.jcpr.org/wpfiles/value.pdf
Department of Employment and Workplace Relations, Annual Report 2004-05, http://www.dewr.gov.au/dewr/Publications/AnnualReports/2004-05/
Department of Family and Community Services, Annual Report 2004-05, http://www.facs.gov.au/annualreport/2005/toc.html
Department of Health and Ageing (2003) Returns on investment in public health: An epidemiological and economic analysis, Report to the Australian Department of Health and Ageing by Applied Economics.
Diewert WE and DA Lawrence (1994) The Marginal Costs of Taxation in New Zealand, Report, Report prepared by Swan Consultants (Canberra) Pty Ltd for the New Zealand Business Round Table.
Diewert WE and DA Lawrence (1995) “The Excess Burden of Taxation in New Zealand”, Agenda 2(1):27-34.
Diewert WE and DA Lawrence (1996) “The Deadweight Costs of Taxation”, Canadian Journal of Economics 29:S658-S673.
FSANZ (Food Standards Australia New Zealand), 2004, Initial assessment report, Proposal P295, Consideration of mandatory fortification with folic acid, FSANZ, Canberra.
Grosse S, Waitzman N, Romano, M, Mulinare J, 2005, Reevaluating the benefits of folic acid fortification in the United States: Economic analysis, regulation and public health, American Journal of Public Health, November, 95(11), pp. 1917-1922.
Cost benefit analysis of fortifying the food supply with folic acid
57
Grosse S, Hopkins D, Mulinare J, Llanos A, Hertrampf E, 2006, Folic acid fortification and birth defects prevention: lessons from the Americas, by courtesy of the author, awaiting publication.
Hunt, G. M., and Oakeshott, P., “Lifestyle in adults aged 35 years who were born with open spina bifida: prospective cohort study.”, in Cerebrospinal Fluid Research, 1(4), 2004.
Kalucy M, Bower C, Stanley F, Burton P, 1994, Survival of infants with neural tube defects in Western Australia 1966-1990, Paediatric and Perinatal Epidemiology, 8, pp. 334-351.
Kniesner TJ and Leeth JD (1991) “Compensating wage differentials for fatal injury risk in Australia, Japan and the United States” Journal of Risk and Uncertainty 4(1), 75-90.
Lancaster P, Hurst T, 2000, Trends in neural tube defects in Australia, National perinatal Statistics Unit, AIHW, University of NSW
Liu S, West R, Randell E, Longerich L, O’Connor K, Scott H, Crowley M, Lam A, Prabhakaran V, McCourt C, 2004, A comprehensive evaluation of food fortification with folic acid for the primary prevention of neural tube defects, BMC Pregnancy and Childbirth, 4:20
Mathers C, Vos T, and Stevenson C, 1999, The burden of disease and injury in Australia. AIHW cat. no. PHE 17. Canberra AIHW.
McKeown PC and Woodfield AE (1995) “The welfare cost of taxation in New Zealand following major welfare reforms” New Zealand Economic Papers Vol 29(1):41-62.
Meijer W, de Smit D, de Jong-van den Berg L, 2005, a proactive approach to increase the peri conceptional use of folic acid works, rapid response to Botto et al 2005.
Miller P, Mulvey C, Norris K (1997) “Compensating differentials for risk of death in Australia” Economic Record 73(223), 363-372.
MoH (Ministry of Health New Zealand) 2001, The burden of disease and injury in New Zealand, Wellington, http://www.moh.govt.nz/moh.nsf/0/a313645fbc60bf02cc2569f400791b9b/$FILE/BurdenofDisease.pdf accessed 9 April 2006.
_________________________________ 2003, Improving folate intake in New Zealand: Policy implications. Wellington: Ministry of Health.
Ministry of Social Development, Annual Report 2004-05, http://www.msd.govt.nz/documents/publications/msd/annual-report-2004-2005.pdf
________________________, 2004, The Statistical Report – year ending June 2004, http://www.msd.govt.nz/documents/work-areas/csre/statistical-report-2004.pdf
________________________, Benefit Factsheets, http://www.msd.govt.nz/media-information/benefit-fact-sheets/index.html, Accessed April 10 2006.
Murphy KM and Topel R (1999) The Economic Value of Medical Research, University of Chicago Business School.

Cost benefit analysis of fortifying the food supply with folic acid
58
Murray C & Lopez A (1996) The Global Burden of Disease: a comprehensive assessment of mortality & disability from diseases, injuries & risk factors in 1990 & projected to 2020, Volume 1, Global Burden of Disease & Injury Series, Harvard: Harvard School of Public Health.
Murray C, Lopez A, Mathers C, Stein C (2001) The Global Burden of Disease 2000 Project: aims, methods and data sources, Discussion Policy Paper No. 36, WHO, November.
New Zealand Flour Millers Association (2004) Submission to Food Standards Australia New Zealand on Initial Assessment Report Proposal P295 Consideration of Mandatory Fortification with Folic Acid, 20 December.
New Zealand Treasury (2005) Budget Economic and Fiscal Update 2005, Wellington, May.
Nordhaus W (1999) The Health of Nations: The Contribution of Improved Health to Living Standards, research papers presented at a conference sponsored by Lasker/Funding First, December, Department of Economics, Yale University, downloaded 2 April 2003 from www.laskerfoundation.org/reports/pdf/healthofnations.pdf
NZIER (2005) COOl Revisited, Benefit cost analysis of country of origin labelling, prepared for Food Standards Australia New Zealand, 21st September.
NHMRC (National Health and Medical Research Council) 1995, Folate fortification, Report of the expert panel on folate fortification, endorsed at the 117th session of the NHMRC, Sydney 1-2 June 1994, Australian Government Publishing Service.
Productivity Commission (2003) “Evaluation of the Pharmaceutical Industry Investment Program” Research Report, AusInfo, Canberra.
Schelling TC (1968) “The life you save may be your own” in SB Chase (ed) Problems in public expenditure and analysis, Brookings Institution, Washington DC, p127-162.
Singh S, Elliott R, 1997, Prevention of spina bifida in New Zealand, Auckland, University of Auckland (unpublished).
Tseng, Y., and Wilkins, R. (May 2002) Reliance on Income Support in Australia: Prevalence and Persistence, Working Paper No. 6/02, Melbourne Institute of Applied Economic and Social Research
Rosenberg KD, Gelow JM, Sandoval AP. Pregnancy intendedness and the use of periconceptional folic acid. Pediatrics. 2003;111:1142–1145.
Viscusi WK (1993) “The value of risks to life and health” Journal of Economic Literature, 13:1912-46.
Viscusi and Aldy (2002) “The value of a statistical life: a critical review of market estimates throughout the world” Discussion Paper No. 392, Harvard Law School, Cambridge MA, November, downloadable from www.law.harvard.edu/programs/olin_center/
Waitzman NJ, Romano PS, Grosse S, (2005) Half-life of cost of illness estimates: the case of spina bifida. In: Wyszynski DF, ed. Neural Tube Defects: From Origin to Treatment. New York, NY: Oxford University Press; 2005:342–351.
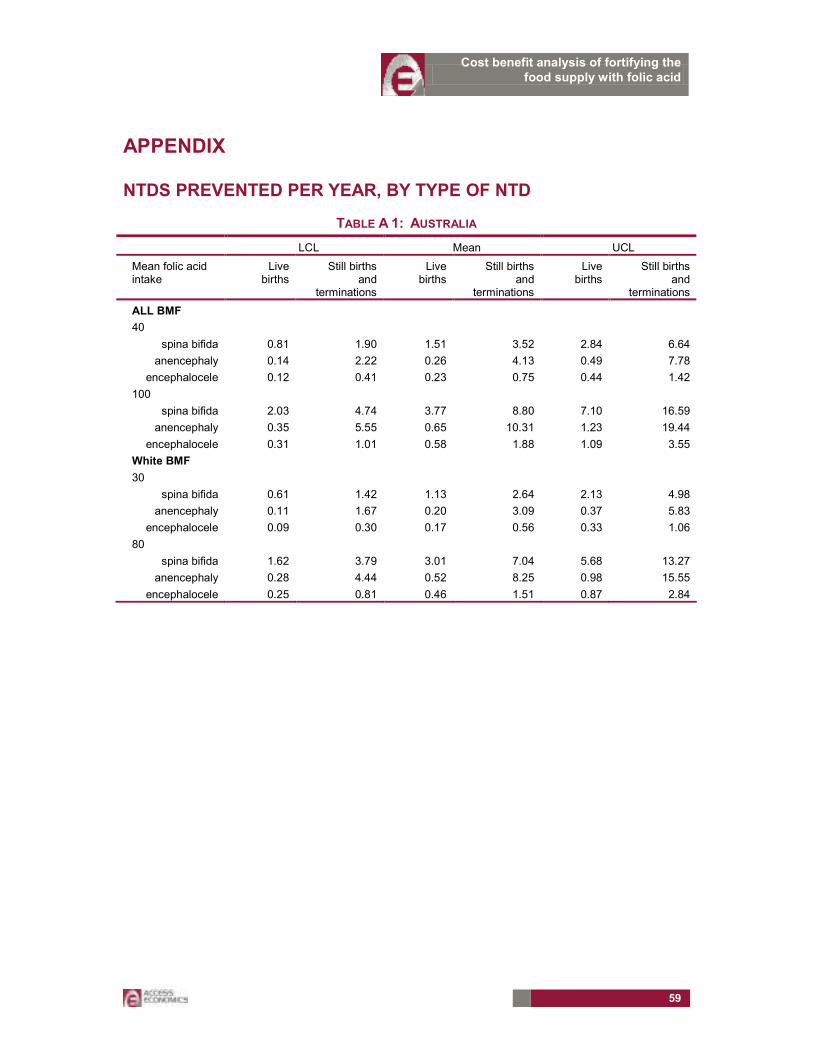
Cost benefit analysis of fortifying the food supply with folic acid
59
APPENDIX
NTDS PREVENTED PER YEAR, BY TYPE OF NTD
TABLE A 1: AUSTRALIA
LCL Mean UCL
Mean folic acid intake
Live births
Still births and
terminations
Live births
Still births and
terminations
Live births
Still births and
terminations
ALL BMF
40
spina bifida 0.81 1.90 1.51 3.52 2.84 6.64
anencephaly 0.14 2.22 0.26 4.13 0.49 7.78
encephalocele 0.12 0.41 0.23 0.75 0.44 1.42
100
spina bifida 2.03 4.74 3.77 8.80 7.10 16.59
anencephaly 0.35 5.55 0.65 10.31 1.23 19.44
encephalocele 0.31 1.01 0.58 1.88 1.09 3.55
White BMF
30
spina bifida 0.61 1.42 1.13 2.64 2.13 4.98
anencephaly 0.11 1.67 0.20 3.09 0.37 5.83
encephalocele 0.09 0.30 0.17 0.56 0.33 1.06
80
spina bifida 1.62 3.79 3.01 7.04 5.68 13.27
anencephaly 0.28 4.44 0.52 8.25 0.98 15.55
encephalocele 0.25 0.81 0.46 1.51 0.87 2.84
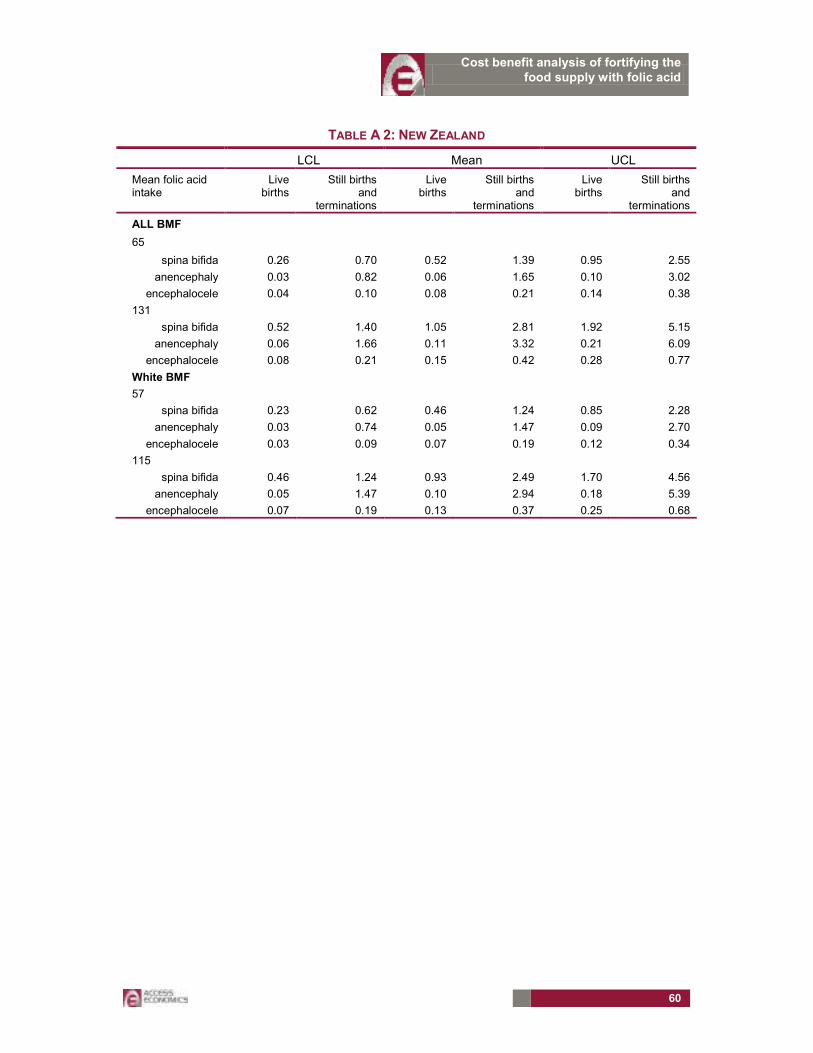
Cost benefit analysis of fortifying the food supply with folic acid
60
TABLE A 2: NEW ZEALAND
LCL Mean UCL
Mean folic acid intake
Live births
Still births and
terminations
Live births
Still births and
terminations
Live births
Still births and
terminations
ALL BMF
65
spina bifida 0.26 0.70 0.52 1.39 0.95 2.55
anencephaly 0.03 0.82 0.06 1.65 0.10 3.02
encephalocele 0.04 0.10 0.08 0.21 0.14 0.38
131
spina bifida 0.52 1.40 1.05 2.81 1.92 5.15
anencephaly 0.06 1.66 0.11 3.32 0.21 6.09
encephalocele 0.08 0.21 0.15 0.42 0.28 0.77
White BMF
57
spina bifida 0.23 0.62 0.46 1.24 0.85 2.28
anencephaly 0.03 0.74 0.05 1.47 0.09 2.70
encephalocele 0.03 0.09 0.07 0.19 0.12 0.34
115
spina bifida 0.46 1.24 0.93 2.49 1.70 4.56
anencephaly 0.05 1.47 0.10 2.94 0.18 5.39
encephalocele 0.07 0.19 0.13 0.37 0.25 0.68

Cost benefit analysis of fortifying the food supply with folic acid
61
NET PRESENT VALUE OF NET BENEFITS OVER 15 YEARS
AUSTRALIA LIVE NTDS ONLY (MEAN)
Discount rate for benefits 1.55%
Discount rate for costs 3.3%UpfrontCosts
labelling $'000 2,486
equipment $'000 0
Total initial outlay $'000 2,486
100
Year 0 1 2 3 4 5 6 7 8 9 10 11 12 13 14 15
undiscounted benefits $'000 0 10,041 10,041 10,041 10,041 10,041 10,041 10,041 10,041 10,041 10,041 10,041 10,041 10,041 10,041 10,041undicounted costs $'000 2,486 1,152 1,152 1,152 1,152 1,152 1,152 1,152 1,152 1,152 1,152 1,152 1,152 1,152 1,152 1,152
NPV benefits $'000 133,472
NPV costs $'000 15,949
NET BENEFIT $'000 117,523
Ratio benefits/costs 8.4
200
Year 0 1 2 3 4 5 6 7 8 9 10 11 12 13 14 15undiscounted benefits $'000 0 25,094 25,094 25,094 25,094 25,094 25,094 25,094 25,094 25,094 25,094 25,094 25,094 25,094 25,094 25,094
undicounted costs $'000 2,486 1,208 1,208 1,208 1,208 1,208 1,208 1,208 1,208 1,208 1,208 1,208 1,208 1,208 1,208 1,208NPV benefits $'000 333,559
NPV costs $'000 16,604
NET BENEFIT $'000 316,956
Ratio benefits/costs 20.1

Cost benefit analysis of fortifying the food supply with folic acid
62
NEW ZEALAND LIVE NTDS ONLY (MEAN)
Discount rate for benefits 2%
Discount rate for costs 4%Upfront costs
labelling $'000 220
equipment $'000 1,470
Total initial outlay $'000 1,690
Year 0 1 2 3 4 5 6 7 8 9 10 11 12 13 14 15undiscounted benefits $'000 0 3,531 3,531 3,531 3,531 3,531 3,531 3,531 3,531 3,531 3,531 3,531 3,531 3,531 3,531 3,531
undicounted costs $'000 1,690 2,337 2,337 2,337 2,337 2,337 2,757 2,337 2,337 2,337 2,337 2,757 2,337 2,337 2,337 2,337
NPV benefits $'000 44,372
NPV costs $'000 28,654
NET BENEFIT $'000 15,717
Ratio benefits/costs 1.5
200
Year 0 1 2 3 4 5 6 7 8 9 10 11 12 13 14 15undiscounted benefits $'000 0 7,119 7,119 7,119 7,119 7,119 7,119 7,119 7,119 7,119 7,119 7,119 7,119 7,119 7,119 7,119
undicounted costs $'000 1,690 2,349 2,349 2,349 2,349 2,349 2,349 2,349 2,349 2,349 2,349 2,349 2,349 2,349 2,349 2,255NPV benefits $'000 89,452
NPV costs $'000 28,119
NET BENEFIT $'000 61,333
Ratio benefits/costs 3.2

Cost benefit analysis of fortifying the food supply with folic acid
63
AUSTRALIA ALL NTDS
discount rate for benefits 1.55%discount rate for costs 3.3%Upfront costs
labelling $'000 2,486
equipment $'000 0Total initial outlay $'000 2,486
Year 0 1 2 3 4 5 6 7 8 9 10 11 12 13 14 15undiscounted benefits $'000 0 50,285 50,285 50,285 50,285 50,285 50,285 50,285 50,285 50,285 50,285 50,285 50,285 50,285 50,285 50,285
undicounted costs $'000 2,486 1,152 1,152 1,152 1,152 1,152 1,152 1,152 1,152 1,152 1,152 1,152 1,152 1,152 1,152 1,152NPV benefits $'000 668,420
NPV costs $'000 15,949NET BENEFIT $'000 652,471
Ratio benefits/costs 41.9
200Year 0 1 2 3 4 5 6 7 8 9 10 11 12 13 14 15
undiscounted benefits $'000 0 125,704 125,704 125,704 125,704 125,704 125,704 125,704 125,704 125,704 125,704 125,704 125,704 125,704 125,704 125,704undicounted costs $'000 2,486 1,208 1,208 1,208 1,208 1,208 1,208 1,208 1,208 1,208 1,208 1,208 1,208 1,208 1,208 1,208
NPV benefits $'000 1,670,930NPV costs $'000 16,604
NET BENEFIT $'000 1,654,327
Ratio benefits/costs 100.6

Cost benefit analysis of fortifying the food supply with folic acid
64
NEW ZEALAND ALL NTDS
Discount rate for benefits 2%
Long term nominal bond rate 4%Upfront cost
labelling $'000 220
equipment $'000 1,470
Total initial outlay $'000 1,690
100
Year 0 1 2 3 4 5 6 7 8 9 10 11 12 13 14 15
undiscounted benefits $'000 0 21,594 21,594 21,594 21,594 21,594 21,594 21,594 21,594 21,594 21,594 21,594 21,594 21,594 21,594 21,594undicounted costs $'000 1,690 2,337 2,337 2,337 2,337 2,337 2,757 2,337 2,337 2,337 2,337 2,757 2,337 2,337 2,337 2,337
NPV benefits $'000 271,336
NPV costs $'000 28,654
NET BENEFIT $'000 242,681
Ratio benefits/costs 9.5
200
Year 0 1 2 3 4 5 6 7 8 9 10 11 12 13 14 15
undiscounted benefits $'000 0 43,522 43,522 43,522 43,522 43,522 43,522 43,522 43,522 43,522 43,522 43,522 43,522 43,522 43,522 43,522undicounted costs $'000 1,690 2,349 2,349 2,349 2,349 2,349 2,349 2,349 2,349 2,349 2,349 2,349 2,349 2,349 2,349 2,255
NPV benefits $'000 546,871
NPV costs $'000 28,119
NET BENEFIT $'000 518,753
Ratio benefits/costs 19.4