Cost and Time Overruns for Major Defense Acquisition Programs
17
Defense-Industrial Initiatives Group Center for Strategic & International Studies Cost and Time Overruns for Major Defense Acquisition Programs An Annotated Brief Authors: Project Directors: Joachim Hofbauer David Berteau Gregory Sanders Guy Ben-Ari Jesse Ellman Contributing Researcher: David Morrow Nicholas Lombardo April 2011 Center for Strategic and International Studies 1800 K Street NW Washington DC, 20006 David Berteau 202-775-3183 [email protected] This material is based upon work supported by the Naval Postgraduate School Acquisition Research Program (Grant No.N00244-10-1-0020)
Transcript of Cost and Time Overruns for Major Defense Acquisition Programs

Defense-Industrial Initiatives Group Center for Strategic & International Studies
Cost and Time Overruns for Major Defense Acquisition Programs An Annotated Brief
Authors: Project Directors: Joachim Hofbauer David Berteau Gregory Sanders Guy Ben-Ari Jesse Ellman Contributing Researcher: David Morrow Nicholas Lombardo April 2011
Center for Strategic and International Studies 1800 K Street NW Washington DC, 20006 David Berteau 202-775-3183 [email protected]
This material is based upon work supported by the Naval Postgraduate School Acquisition Research Program (Grant No.N00244-10-1-0020)

2 | P a g e
Abstract Cost and time overruns in Major Defense Acquisition Programs (MDAPs) have become a high-profile
problem attracting the interest of Congress, government and watchdog groups. According to the GAO,
the 98 MDAPs from FY2010 collectively ran $402 billion over budget and were an average of 22 months
behind schedule since their first full estimate. President Obama’s memorandum on government
contracting of 4 March 2009 also highlighted this issue.
This paper presents findings of research on the root causes of cost and schedule delays for 92 MDAP
active in 2010 and 12 cancelled programs. The results do not establish causality but do indicate multiple
notable correlations. Inaccurate cost estimates are responsible for the strongest correlation with net
cost growth changes and are associated with 40 percent of the accumulated cost overruns. In addition,
the start year has little impact on the compound annual growth rate of cost overruns. This suggests that
relatively better performance of newer programs may prove illusionary as programs age. Finally, fixed
price contracts appear to have relatively smaller overruns, although this may tell us more about which
programs are likely to receive fixed price contracts rather than what effect fixed price contracts may
have on program performance.

3 | P a g e
Introduction Cost and time overruns in Major Defense Acquisition Programs (MDAPs) have become a high-profile
problem attracting the interest of Congress, government and watchdog groups. According to the GAO,
the 98 MDAPs from FY2010 collectively ran $402 billion over budget and were an average of 22 months
behind schedule since their first full estimate. President Obama’s memo on government contracting of 4
March 2009 also highlighted this issue.
This paper presents findings of research on the root causes of cost and schedule delays for MDAPs,
incorporating 2010 SAR data.
Figure 1: Relative cost overruns versus absolute cost overruns for FY2009 MDAPs
Note: The sample includes 92 FY2010 MDAPs with a baseline estimate beyond Milestone B in the June 2010 SAR as well as twelve additional cancelled programs, notably including the Future Combat System (FCS).
Source: Selected Acquisition Reports; analysis by CSIS Defense-Industrial Initiatives Group
(20)
-
20
40
60
80
100
120
-200% 0% 200% 400%
Re
al c
ost
ove
rru
ns
(in
201
0 b
illio
ns,
qu
anti
ty a
dju
ste
d)
Real cost overruns (in percent, quantity adjusted)
F-35
CHEM DEMIL-ACWA
FCS
(2)
-
2
4
6
8
10
-25% 0% 25% 50%

4 | P a g e
Problem Definition Past studies on this topic either have not offered rigorous data analysis or were focused on a critical but
still narrow aspect of the problem, such as technical maturity. Meanwhile, Congressional leadership
often focuses on different issues such as contract type and competition. As a result, acquisition reform
efforts like the Weapon Systems Acquisition Reform Act of 2009 are hampered by an insufficient
analytical basis.
For instance, in its annual assessment of selected weapon systems, the Government Accountability
Office predominantly focuses on knowledge-based factors such as technology maturity and associated
program decisions as causes for these problems. Former Under Secretary of Defense for Acquisition
Technology & Logistics John Young claimed in a memorandum on March 31, 2009, that many of the
allegations of the GAO are based on inadequate analytical methods and that consequently many of the
results are misleading.
This disagreement is exemplary of the diverging set of opinions that exists regarding the root causes of
MDAP cost overruns and schedule delays. The result amplifies disagreement regarding potential fixes.
On the government side Senator McCain identified the usage of cost plus contracts as a major source for
cost increases and Secretary Gates pointed towards the contract structures as a key source of cost and
schedule overruns in some MDAPs. Defense contractors, on the other hand, regularly cite the altering of
requirements in advanced program stages as an important factor for cost increases.
The currently ongoing process of reforming and fixing the defense acquisition system still lacks the
foundation of a detailed evaluation of the causality chain of cost overruns and program delays of
MDAPs. This lack of understanding of underlying mechanisms makes the design of adequate solutions
inherently difficult and renders them potentially ineffective. This study directly aims at developing the
urgently needed knowledge base that will better guide efforts to correct the growing trends of cost
increases and schedule overruns.
Methodology This report analyzes a series of variables – namely realism of baseline program cost estimates,
government management and oversight, the role of contractors and lead military services, levels of
competition, and contract structures – to determine what factors might contribute to or be correlated
with the observed cost overruns in the execution of MDAPs.
This research draws on three primary data sources:
Selected Acquisition Reports (SARs): The SARs track Major Defense Acquisition Programs, reporting on
their schedule, unit counts, total spending, and progress through milestones. The unit of analysis is the
programs themselves, making it the ideal source for top level analysis.

5 | P a g e
Federal Procurement Data System (FPDS): The FPDS is a database of every government contract, with
millions of entries each year. Each entry has extensive data on the contractors, contract type,
competition, place of performance, and a variety of other topics as mandated by Congress. Cross-
referencing individual contracts with MDAPs is possible using the system equipment codes (which match
up with those of MDAPs). This source provides the most in-depth data on the government contracting
process.
Department of Defense budget documents: In addition to budget data, these documents provide
topical information on each MDAP and its subcomponents. They will primarily be used to categorize
projects as well as to support and double check spending figures from the other two sources.
The report focuses on MDAPs from the FY2010 MDAP list. Within this sample group the analysis is
limited to 104 MDAPs with cost estimates set at Milestone B or beyond, including MDAPs that were
cancelled between 1999 and today. That gate is meant to be a hurdle that requires programs to reach a
certain level of technological maturity. As a result Milestone B “is normally the initiation of an
acquisition program.”1 This common starting point ensures that only programs in a relatively mature
acquisition phase are compared. Cancelled programs are included to avoid the selection bias that results
from excluding several of the worst performing proposals from analysis. Figure 1 provides an overview
of the cost overruns of these 104 programs.
Unfortunately, full data are not available on all 104 MDAPs when examining contract type and
competition, because not all of the programs have at least 50 percent of the SARs contract value
accounted for in 2004-2009 FPDS data. As a result, the ‘unclear’ category is used to signify this missing
data in competition and contract type findings. In addition, FPDS totals for program spending are
sometimes higher than the funding status according to the SARs. In those cases, the SAR totals are
treated as the more reliable figure.
These snapshots provide an adequate starting point for detecting correlations between a series of
potentially relevant factors and cost growth. The charts reflect the basic information; arranged across a
variety of data elements, but they do not constitute a sufficient basis for establishing causality or policy
changes, for which further analysis would be needed.
1 “Acquisition History Project Working Paper #3: The Evolution of DoD Directive 5000.1 Acquisition Management
Policy 1971-2003.” Defense Acquisition History Project. http://www.history.army.mil/acquisition/research/working3.html, Accessed 5/25/2010.

6 | P a g e
Analysis This analysis focuses on examining the impact of baseline cost estimates, quantity and schedule changes, as well as engineering problems, the extent of competition, contract structure, lead branch of military service, and identity of prime contractor on the cost performance on MDAPs.
Figure 2: Functional reasons for cost overruns
Source: Selected Acquisition Reports; analysis by CSIS Defense-Industrial Initiatives Group
Breaking down cost growth by functional areas as provided in the SARs identifies variances in the
estimating process as the primary driver for cost growth, being responsible for $202.8 billion in cost
growth for the 104 MDAPs analyzed.
Another noteworthy observation from Figure 2 is the fact that the cost savings achieved through
quantity changes equals approximately two thirds of the cost growth originating from changes in unit
numbers. This is not encouraging, as for programs with upfront research and development costs,
reducing the number of units lowers the overall program cost but it increases the per-unit cost,
effectively curtailing the government’s buying power. In turn, cost increases deriving from increases in
the number of units require a higher overall program budget but lower the price per unit.
Nunn-McCurdy breaches, for instance, are based on the growth in the per-unit acquisition cost rather
than overall program cost in order to account for this fact. This presentation therefore focuses on
quantity-adjusted cost changes. The Selected Acquisition Reports do not list the exact methodology for
quantity adjustments; unfortunately, the adjustment is not equivalent to the sum of cost adjustments
that are not attributed to quantity changes. This complicates analysis of the functional reasons for cost
growth.
$124
$50 $63
$203
$51$3
-$86
-$3 -$4-$16
-$3 $0
21%
2% 4%
9% 8%
0%
3%3% 4%
13%
3%0%
-15%
0%
15%
30%
$(120)
$(60)
$-
$60
$120
$180
$240
Quantity Schedule Engineering Estimating Support Other
Re
al c
ost
ove
rru
ns
(in
pe
rce
nt)
Re
al c
ost
ove
rru
ns
(in
201
0 b
illio
ns)
Cost Increase Cost Decrease Average Increase Baseline-Weighted Average Increase
Cost Increase
Cost Decrease

7 | P a g e
Figure 3: Time-cost correlation
Source: Selected Acquisition Reports; analysis by CSIS Defense-Industrial Initiatives Group
The next explanatory variable examined for its impact on program performance is the time-cost growth
correlation. If cost increases accrue over time, then programs with an older baseline estimate would
tend to accumulate relatively higher cost increases. The data for the analyzed programs show that older
programs indeed experience larger overruns.
However, Figure 3 shows that when measured in compound annual growth rate2 rather than aggregate
relative cost growth, the time-cost growth correlation is almost constant. The C-130 AMP project is
distorting this trend, because its estimate was not changed when it was given a new baseline in 2010.
Notwithstanding C-130 AMP, this growth correlation not only provides further evidence for the
assertion that cost growth occurs steadily throughout the program lifespan, but it also suggests that
younger programs are not performing better than older programs.
2 The compound annual growth rate describes the average year-to-year cost growth of a program spending since
its baseline. Thus if comparing two programs with same percentage of cost growth since their baseline estimate, the program with an earlier baseline year would have a smaller compound annual growth rate.
-20%
0%
20%
40%
60%
80%
100%
120%
140%
160%
1985 1990 1995 2000 2005 2010
Re
al c
om
po
un
d a
nn
ual
co
st g
row
th r
ate
(in
pe
rce
nt,
ad
just
ed
for
qu
anti
ty c
han
ges)
Year of last baseline estimate
C-130 AMP
EFV

8 | P a g e
Figure 4: Cost overruns by lead service (I)
Source: Selected Acquisition Reports; analysis by CSIS Defense-Industrial Initiatives Group
The analysis on the correlation between the lead branch of military service responsible for MDAPs and
cost growth patterns reveals that programs led by the Army appear to have fewer, smaller overruns,
followed by the Navy and then the Air Force, while DoD-wide programs tend to accrue significant larger
cost overruns. The picture alters slightly when utilizing baseline-weighted averages with the Navy
showing the least overruns followed by the Army, the Air Force, and DoD-wide programs. The
considerable difference for the Army’s results – 11 percent on average versus 20 percent for baseline-
weighted averages – is driven by the cancelled Future Combat System. It is important to note that DoD-
wide includes both programs managed by DoD agencies and joint programs such as the Joint Strike
Fighter.
The outcome of this data analysis might be skewed based on the relatively small sample group utilized in
this analysis. For instance, it appears that the DoD-wide category might be heavily influenced by the
negative cost developments in the Joint Strike Fighter program. As for the other components, further
analysis with larger sample groups are required to validate observed trends.
Any conclusions from Figure 4 identifying superior program management of existing programs by service
are premature, even if additional data and analysis were to confirm this variation in cost performance
based on lead service. A number of other factors may explain the differences, such as a tendency toward
less risk-prone MDAPs. Further research will be needed to analyze the underlying causality and detect
the true root causes for these trends.
(20)
-
20
40
60
80
100
120
-100% 0% 100% 200% 300%
Re
al c
ost
ove
rru
ns
(in
201
0 b
illio
ns,
qu
anti
ty a
dju
ste
d)
Real cost overruns (in percent, quantity adjusted,
service averages are unweighted)
F-35
CHEM DEMIL-ACWA
FCS
(2)
-
2
4
6
8
10
-25% 0% 25% 50%Air Force ArmyNavy DoD-wideAir Force Average Army AverageNavy Average DoD-wide Average
9 | P a g e
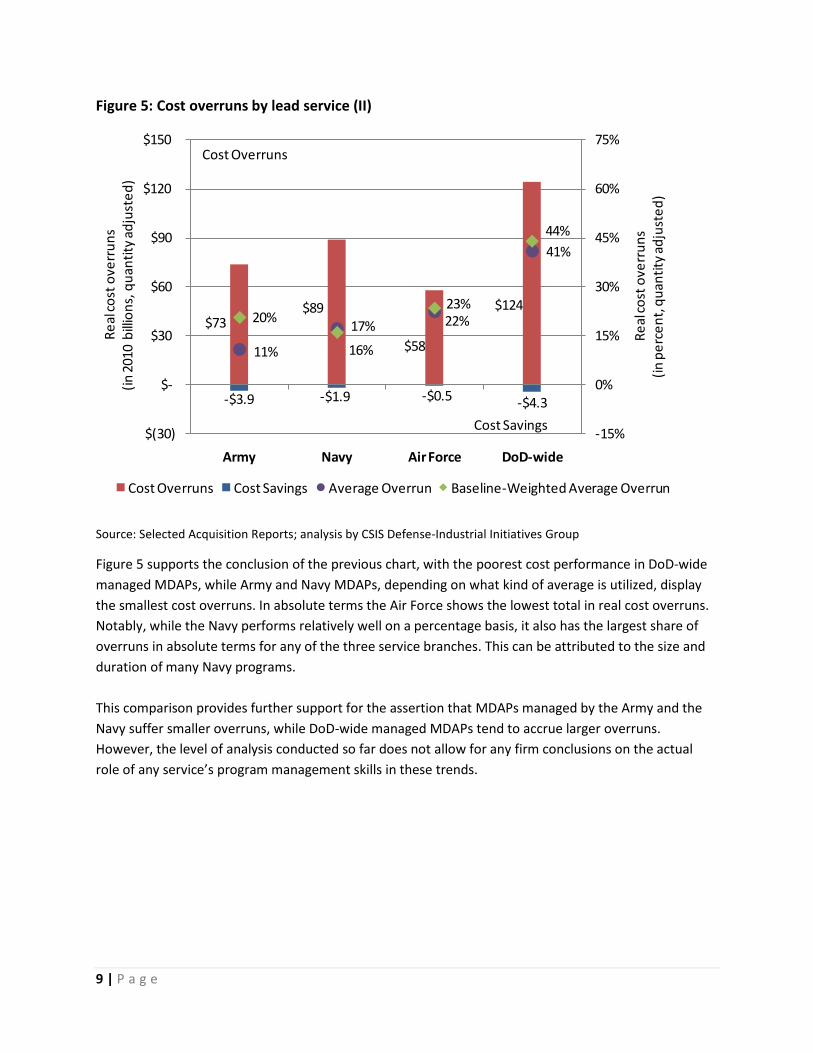
Figure 5: Cost overruns by lead service (II)
Source: Selected Acquisition Reports; analysis by CSIS Defense-Industrial Initiatives Group
Figure 5 supports the conclusion of the previous chart, with the poorest cost performance in DoD-wide
managed MDAPs, while Army and Navy MDAPs, depending on what kind of average is utilized, display
the smallest cost overruns. In absolute terms the Air Force shows the lowest total in real cost overruns.
Notably, while the Navy performs relatively well on a percentage basis, it also has the largest share of
overruns in absolute terms for any of the three service branches. This can be attributed to the size and
duration of many Navy programs.
This comparison provides further support for the assertion that MDAPs managed by the Army and the
Navy suffer smaller overruns, while DoD-wide managed MDAPs tend to accrue larger overruns.
However, the level of analysis conducted so far does not allow for any firm conclusions on the actual
role of any service’s program management skills in these trends.
$73$89
$58
$124
-$3.9 -$1.9 -$0.5 -$4.3
11%
17% 22%
41%
20%
16%
23%
44%
-15%
0%
15%
30%
45%
60%
75%
$(30)
$-
$30
$60
$90
$120
$150
Army Navy Air Force DoD-wide
Re
al c
ost
ove
rru
ns
(in
pe
rce
nt,
qu
anti
ty a
dju
ste
d)
Re
al c
ost
ove
rru
ns
(in
201
0 b
illio
ns,
qu
anti
ty a
dju
ste
d)
Cost Overruns Cost Savings Average Overrun Baseline-Weighted Average Overrun
Cost Overruns
Cost Savings

10 | P a g e
Figure 6: Cost overruns by prime contractor (I)
Source: Selected Acquisition Reports; analysis by CSIS Defense-Industrial Initiatives Group
Another predictor for program performance could be the identity of the prime contractor for a given
program. One striking trend in Figure 6 that is visible for the “big five” U.S. defense companies is the fact
that Raytheon on average appears to be associated with significantly better cost performance outcomes
than other defense companies. Due to a lack of data granularity, the other companies category includes
joint ventures and projects that are split between multiple contractor.
The preliminary character of the analysis does not fully validate any findings of superior management or
outcomes. In addition, even if confirmed, it would be premature to start praising any company for
better program execution, as other factors such as specialization in technologically more mature
program areas might be the true drivers behind this trend. As was the case for the breakdown by lead
service, further research will be needed to analyze the underlying causality.
(2)
-
2
4
6
8
10
-25% 0% 25% 50%
Boeing Average General Dynamics Average
Lockheed Martin Average Northrop Grumman Average
Raytheon Average Other Average
(20)
-
20
40
60
80
100
120
-100% 0% 100% 200% 300%
Re
al c
ost
ove
rru
ns
(in
201
0 b
illio
ns,
qu
anti
ty a
dju
ste
d)
Real cost overruns (in percent, quantity adjusted, prime averages unweighted)
Boeing General Dynamics Lockheed Martin
Northrop Grumman Raytheon Other
F-35
CHEM DEMIL-ACWA
FCS

11 | P a g e
Figure 7: Cost overruns by prime contractor (II)
Source: Selected Acquisition Reports; analysis by CSIS Defense-Industrial Initiatives Group
The comparison between the share of cost growth and the share of contract value for MDAPs,
aggregated by prime contractor, correlates with the finding that MDAPs for which Raytheon is the prime
contractor appear to exhibit the best cost performance amongst the “big five” defense companies.
When it comes to the remainder of the “big five,” Figure 7 shows that their average performance varies
based on the means used to measure it with different results when the programs are weighted by the
baseline estimate than if all of the MDAPs are treated as having an equal weight. Again, this variance
gives reason to be cautious in extrapolating from these results.
$90
$37
$132
$26$9
$50
-$0.1-$6.5
-$0.9 -$1.6 -$0.3 -$1.2
31%
13%
19%
14%
9%
24%30%
20%
29%
17%13%
17%
-10%
0%
10%
20%
30%
40%
50%
$(30)
$-
$30
$60
$90
$120
$150
Boeing General Dynamics
Lockheed Martin
Northrop Grumman
Raytheon Other
Re
al c
ost
ove
rru
ns
(in
pe
rce
nt,
qu
anti
ty a
dju
ste
d)
Re
al c
ost
ove
rru
ns
(in
201
0 b
illio
ns,
qu
anti
ty a
dju
ste
d)
Cost Overruns Cost Savings Average Overrun Baseline-Weighted Average Overrun
Cost Overruns
Cost Savings

12 | P a g e
Figure 8: Cost overruns by type of competition
Source: Selected Acquisition Reports; analysis by CSIS Defense-Industrial Initiatives Group
The type of contract award process could potentially also be correlated with cost performance of
MDAPs. The findings in Figure 8 are decidedly mixed. In absolute dollar terms, competitive contracts
produce less cost growth than contracts awarded with no competition or under unclear circumstances.
This is driven by the comparative scarcity of competed contract dollars in the sample. As a result, when
comparing relative cost overrun rates the results are different. Only partial competition3 with multiple
bidders displays a notably better outcome.
Perhaps surprisingly, full and open competition with multiple bidders performs on average worse than
no or unclear competition. Only when considering baseline-weighted averages does full and open
competition with multiple bidders perform better than no or unclear competition. Based on the SAR’s
data, this can be attributed to full and open competition with multiple bidders having the highest
percentage of estimating variance of any of the categories. This result is consistent with the hypothesis
that bidders may propose lower costs in order to win price-based competitions. However, further study
would be needed to determine whether full and open competitions also suffer from a selection bias or
other unexplained cause.
3 Partial competition refers to forms of competition other than full and open because the number of bidders is
legally limited.
$19 $2 $5 $6 $6
$167
$209
-$2.5 $0.0 -$0.1 $0.0 $0.0 -$0.9-$6.5
32%
18%
9%
31%
26%23%
19%22% 19%
9%
35%
15%
31% 31%
-10%
0%
10%
20%
30%
40%
50%
60%
$(40)
$-
$40
$80
$120
$160
$200
$240
Full comp. (2+ bids)
Full comp. (1 bid)
Partial comp.
(2+ bids)
Partial comp.
(1 bidder)
Follow on to
competed
action
No comp. Unclear comp.
No
min
al C
ost
Ove
rru
ns
(I
n p
erc
en
t, w
eig
hte
d b
y p
erc
en
t o
f MD
AP
ac
cou
nte
d fo
r in
FP
DS,
qu
anti
ty a
dju
ste
d)
No
min
al c
ost
ove
rru
ns
(in
the
n y
ear
bill
ion
s, q
uan
tity
ad
just
ed
)
Cost Overruns Cost Savings Average Overrun Baseline-Weighted Average Overrun
Cost Overruns
Cost Savings

13 | P a g e
Figure 9: Cost overruns by contract type
* Cost (all other) includes time and materials contracts as well as labor hours contracts. Source: Selected Acquisition Reports; analysis by CSIS Defense-Industrial Initiatives Group
Contract structure provides another possible determining factor for the performance of MDAPs. One
key observation from Figure 9 is that fixed price contracts appear to have on average less cost growth
and the cost all other contract types appear to have more, when comparing the share of cost growth
and the share of contract value for MDAPs. An interesting finding is the fact that unspecified contract
types, while responsible for the majority of cost overruns in absolute terms, perform best when
measured based on baseline-weighted averages.
Acquisition reformers often point toward cost-plus contracts as a factor driving cost overruns. This
argument is supported by the high average cost overruns percentages of both categories of cost plus
contracts. The type of fee structure used also appears relevant, as cost-plus award/incentive contracts
have lower relative cost growth than all other forms of cost reimbursement contracting, although this is
driven in part by the outsized influence of the F-35 project which falls within the cost (all other)
category. However, fixed price contracts are more commonly the vehicle of choice for mature
technology in full rate production, which are generally considered low risk.
$67
$20
$69 $52
$211
-$1.2 $0.0 -$2.2 -$0.1 -$6.5
20%
27%
28%
35%
19%20%
28%
32%
44%
31%
-5%
0%
5%
10%
15%
20%
25%
30%
35%
40%
45%
$(25)
$-
$25
$50
$75
$100
$125
$150
$175
$200
$225
Fixed price Combination Cost-plus award/incentive
Cost (all other*) Unspecified
No
min
al C
ost
Ove
rru
ns
(I
n p
erc
en
t, w
eig
hte
d b
y p
erc
en
t o
f M
DA
P
acco
un
ted
for
in F
PD
S, q
uan
tity
ad
just
ed
)
No
min
al c
ost
ove
rru
ns
(in
the
n y
ear
bill
ion
s, q
uan
tity
ad
just
ed
)
Cost Overruns Cost Savings Average Overrun Baseline-Weighted Average Overrun
Cost Savings
Cost Overruns

14 | P a g e
Findings This report provides a foundation for future researchers and reformers grappling with the problem of
cost overruns in major defense acquisition projects. The results discussed below have been validated by
the two most recent Selected Acquisition Reports and together with the underlying data and
methodology provide a roadmap for future work.
The strongest correlation with net cost growth is shown in Figure 2: changes in cost estimates are
responsible for around 40 percent of the accumulated cost overruns. Of similarly importance, Figure 3
shows that the start year has little impact on the compound annual growth rate of cost overruns. This
suggests that relatively better performance of newer programs may prove illusionary as programs age.
Finally, figure 9 shows that fixed price contracts appear to have relatively smaller overruns, although this
may tell us more about which programs are likely to receive fixed price contracts rather than what effect
fixed price contracts may have on program performance.
There are three logical avenues for future research to build on these results. First, additional factors
could be added to the mix to help allocate responsibility to underlying characteristics of an MDAP versus
the methods chosen to implement it. Second, the dataset could be steadily expanded to include
completed projects and to widen the historical scope and sample size of the project. Third, researchers
could examine cost growth throughout the history of a select number of programs and also better
control for the effects of updated baselines on older projects. Finally, the government could facilitate all
three approaches and enable a range of assessments by allowing outside researchers to access the data
that underlies the Selected Acquisition Reports.
Reformers and others studying this issue can take the next step by accessing the data, which will be
posted at the Defense-Industrial Initiatives Group website (http://www.csis.org/diig) in time for the May
2011 Naval Post-Graduate School conference. The authors intend to stay fully engaged with this issue as
the root causes underlying the crisis in MDAP cost growth are being identified and addressed.

15 | P a g e
Biographies David J. Berteau is a Senior Adviser and Director of the CSIS Defense-Industrial Initiatives Group,
covering defense management, programs, contracting, and acquisition. His group also assesses national
security economics and the industrial base supporting defense. Mr. Berteau is an adjunct professor at
Georgetown University, a member of the Defense Acquisition University Board of Visitors, a director of
the Procurement Round Table, and a fellow of the National Academy of Public Administration. He also
serves on the Secretary of the Army’s Commission on Army Acquisition and Program Management in
Expeditionary Operations.
Guy Ben-Ari is Deputy Director of the Defense-Industrial Initiatives Group at the Center for Strategic
International Studies, where he works on projects related to the U.S. technology and industrial bases
supporting defense. His current research efforts involve defense R&D policies, defense economics, and
managing complex defense acquisition programs.
Mr. Ben-Ari holds a Bachelor’s degree in political science from Tel Aviv University, a Master’s degree in
international science and technology policy from the George Washington University, and is currently a
PhD candidate (ABD) at the George Washington University.
Joachim Hofbauer is a fellow with the Defense-Industrial Initiatives Group at the Center for Strategic
and International Studies (CSIS). He specializes in U.S. and European defense acquisition and industrial
base issues and their impact on the transatlantic defense market.
Before joining CSIS, Mr. Hofbauer worked as a freelance defense analyst in Germany and the United
Kingdom. His analysis has been published in several U.S. and German defense publications. Mr.
Hofbauer holds a B.A. in European studies from the University of Passau and a M.A. with honors in
security studies, with a concentration in defense analysis, from Georgetown University.
Gregory Sanders is a fellow with the Defense-Industrial Initiatives Group at CSIS, where he gathers and
analyzes data on U.S. defense acquisition and contract spending as international defense budgetary and
trade trends. He has also studied data visualization and ways to use complex data collections to create
succinct and innovative tables, charts, and maps.
Mr. Sanders holds an M.A. in international relations from the University of Denver and a B.A. in
government and politics, as well as a B.S. in computer science, from the University of Maryland.
16 | P a g e
Jesse Ellman is a research associate with the Defense-Industrial Initiatives Group at the Center for
Strategic and International Studies (CSIS). He specializes in U.S. defense acquisition issues, with a
particular focus on recent U.S. Army modernization efforts. Mr. Ellman holds a B.A. in Political Science
from Stony Brook University, and a M.A. with honors in Security Studies, with a concentration in Military
Operations, from Georgetown University
David Morrow is a research associate with the Defense-Industrial Initiatives Group (DIIG) at CSIS, where
he focuses on federal professional services contracting, U.S. naval shipbuilding, and private security
contracting. Previously, Mr. Morrow interned at the U.S. Department of State’s Office of European
Security and Political Affairs and at the U.S.-Russia Business Council. He holds a B.A. in international
affairs from James Madison University and an M.A. in European and Eurasian Studies from the George
Washington University.

17 | P a g e
About CSIS
At a time of new global opportunities and challenges, the Center for Strategic and International Studies
(CSIS) provides strategic insights and policy solutions to decisionmakers in government, international
institutions, the private sector, and civil society. A bipartisan, nonprofit organization headquartered in
Washington, DC, CSIS conducts research and analysis and develops policy initiatives that look into the
future and anticipate change.
Founded by David M. Abshire and Admiral Arleigh Burke at the height of the Cold War, CSIS was
dedicated to finding ways for America to sustain its prominence and prosperity as a force for good in the
world.
Since 1962, CSIS has grown to become one of the world’s preeminent international policy institutions,
with more than 220 full-time staff and a large network of affiliated scholars focused on defense and
security, regional stability, and transnational challenges ranging from energy and climate to global
development and economic integration.
Former U.S. senator Sam Nunn became chairman of the CSIS Board of Trustees in 1999, and John J.
Hamre has led CSIS as its president and chief executive officer since April 2000.
CSIS does not take specific policy positions; accordingly, all views expressed in this presentation should be
understood to be solely those of the author(s).