COST AND PERFORMANCE REPORT FOR HARACTERIZATION · PDF fileCOST AND PERFORMANCE REPORT FOR...
47
COST AND PERFORMANCE REPORT FOR HARACTERIZATION AND REMEDIATION LNAPL C Multi-Phase Extraction and Dual-Pump Recovery of LNAPL at the BP Former Amoco Refinery, Sugar Creek, MO March 2005
-
Upload
trinhkhanh -
Category
Documents
-
view
225 -
download
1
Transcript of COST AND PERFORMANCE REPORT FOR HARACTERIZATION · PDF fileCOST AND PERFORMANCE REPORT FOR...

COST AND PERFORMANCE REPORT FOR HARACTERIZATION
AND REMEDIATION LNAPL C
Multi-Phase Extraction and Dual-Pump Recovery of LNAPL at the BP Former Amoco Refinery, Sugar Creek, MO
March 2005

Office of Solid Waste EPA 542-R-05-016 and Emergency Response March 2005 (5102G) www.epa.gov/tio
Cost and Performance Report for LNAPL Recovery
Multi-Phase Extraction and Dual-Pump Recovery of LNAPLat the BP Former Amoco Refinery,
Sugar Creek, MO

DISCLAIMER
This case study represents the views and opinions of the authors and those who participated in its development. It has been subjected to U.S. Environmental Protection Agency (EPA) expert review, however it does not necessarily reflect the views of the EPA or any other federal government agency. The information is not intended, nor can it be relied upon, to create any rights enforceable by any party in litigation with the United States or any other party. Reference herein to any specific commercial product, process, or service by trade name, trademark, manufacturer, or otherwise does not imply its endorsement or recommendation for use. The information provided maybe revised periodically without public notice.

BP Products North America, Inc., Former Refinery, Sugar Creek, MO
CONTENTSSection Page
EXECUTIVE SUMMARY .......................................................................................................... 5
1.0 INTRODUCTION................................................................................................................. 7
2.0 SITE INFORMATION .......................................................................................................... 7
2.1 BACKGROUND.............................................................................................. 7
2.1.1 Lower Refinery Area ............................................................. 9
2.1.2 Crawford Area ..................................................................... 12
3.0 MATRIX DESCRIPTION AND LNAPL CHARACTERISTICS........................................... 15
3.1 MATRIX CHARACTERISTICS AND OPERATING PARAMETERS AFFECTING TECHNOLOGY COST OR PERFORMANCE .............................................. 15
3.1.1 Dual-Pump Recovery .......................................................... 15
3.1.2 Multi-Phase Extraction ........................................................ 16
3.2 LNAPL CHARACTERIZATION .................................................................... 16
3.2.1 Dual-Pump Recovery Area ................................................. 17
3.2.2 Multi-Phase Extraction Area ............................................... 18
3.3 LNAPL SPECIFIC THICKNESS................................................................... 18
3.4 LNAPL CHARACTERIZATION .................................................................... 21
3.5 LNAPL VOLUME ESTIMATES .................................................................... 21
4.0 REMEDIATION GOALS AND PERFORMANCE OBJECTIVES ...................................... 22
4.1 LNAPL REMEDIATION GOAL ..................................................................... 22
4.2 DUAL-PUMP RECOVERY AND MULTI-PHASE EXTRACTION PROTECTION GOALS .......................................................................................................... 22
4.3 DEFINING APPROPRIATE ENDPOINTS ................................................... 23
4.3.1 API Distribution and Recovery Modeling ............................ 23
5.0 RECOVERY SYSTEMS DESCRIPTION, PERFORMANCE, AND COST ....................... 26
5.1 DUAL-PUMP RECOVERY SYSTEM ........................................................... 26
5.1.1 Dual-Pump Recovery System Description.......................... 26
5.1.2 Dual-Pump Recovery System Performance ....................... 26
5.1.3 Dual-Pump Recovery System Costs................................... 31
5.1.4 Dual-Pump Recovery System Observations and Lessons Learned 32
5.2 MULTI-PHASE EXTRACTION SYSTEM ..................................................... 33
5.2.1 Multi-Phase Extraction System Performance ..................... 33
5.2.2 Multi-Phase Extraction System Costs................................. 34
5.2.3 Multi-Phase Extraction System Observations and Lessons Learned ............................................................................................ 35
U.S. Environmental Protection Agency March 2005 Office of Solid Waste and Emergency Response Technology Innovation and Field Services Division 1
BP Products North America, Inc., Former Refinery, Sugar Creek, MO
5.3 COMPARISON OF DUAL-PUMP RECOVERY TO MULTI-PHASE EXTRACTION...................................................................................................................... 35
5.4 TECHNOLOGY PERFORMANCE AND COST ........................................... 36
5.4.1 Meeting Protection Goals and Endpoints ........................... 36
5.4.2 Cost per Gallon of LNAPL Removed .................................. 36
6.0 OBSERVATIONS AND LESSONS LEARNED ................................................................. 37
7.0 REFERENCES.................................................................................................................. 41
8.0 SITE CONTACTS ............................................................................................................. 43
9.0 ACKNOWLEDGEMENTS ................................................................................................. 44
U.S. Environmental Protection Agency March 2005 Office of Solid Waste and Emergency ResponseTechnology Innovation and Field Services Division 2

BP Products North America, Inc., Former Refinery, Sugar Creek, MO
FIGURES
Figure Page
1 Site Map: BP Products North America, Inc. Former Refinery, Sugar Creek, Missouri .......... 7 2 Dual-Pump Recovery System Location Map ......................................................................... 9 3 Dual-Pump Recovery Flow Diagram ...................................................................................... 9 4 Multi-Phase Extraction System Location Map...................................................................... 13 5 Multi-Phase Extraction Flow Diagram .................................................................................. 13 6 LNAPL Schematic in a Typical Monitoring Well .................................................................. 18 7 LNAPL Recovery for Dual-Pump Recovery System: Modeled vs Actual ............................ 24 8 Predicted Yearly LNAPL Recovery from the Dual-Pump Recovery System........................ 25 9 Dual-Pump Recovery System Annual LNAPL Recovery ..................................................... 28 10 Lower Refinery Recovery Well Network Cumulative LNAPL Recovery............................... 28 11 Dual-Pump Recovery System Annual Groundwater Recovery............................................ 29 12 Well R-007 Fluid Level Measurements and Weekly LNAPL Recovery for 2003 ................. 31 13 Multi-Phase Extraction LNAPL Recovery Compared to API Modeled Results .................... 34
TABLES Table Page
1 Dual-Pump Recovery Well Status ........................................................................................ 10 2 Dual-Pump Recovery Well Construction Details.................................................................. 11 3 Multi-Phase Extraction Construction Details ........................................................................ 12 4 Matrix Characteristics and Operating Parameters Affecting Technology Cost or
Performance of Dual-Pump Recovery ........................................................................... 14 5 Matrix Characteristics and Operating Parameters Affecting Technology Cost or
Performance of the Multi-Phase Extraction System ...................................................... 15 6 LNAPL Saturations versus Depth for the Dual Pump Recovery Area ................................ 16 7 LNAPL Saturations versus Depth for the Multi-Phase Extraction Area .............................. 17 8 Comparison of Measured versus Specific LNAPL Thickness (Do) ...................................... 19 9 Comparison of LNAPL Characteristics for the Dual-Pump Recovery and Multi-Phase
Extraction Areas............................................................................................................. 2010 Dual-Pump Recovery Annual Water and LNAPL Recovery................................................. 27 11 Measured LNAPL Thicknesses in Dual-Pump Recovery System Observation Wells ......... 30 12 Dual-Pump Recovery System Estimated Capital Costs....................................................... 31 13 Dual-Pump Recovery System Estimated O&M Costs.......................................................... 32 14 Multi-Phase Extract System Estimated Capital Costs.......................................................... 34 15 Multi-Phase Extraction System Estimated O&M Costs........................................................ 35
U.S. Environmental Protection Agency March 2005 Office of Solid Waste and Emergency ResponseTechnology Innovation and Field Services Division 3

BP Products North America, Inc., Former Refinery, Sugar Creek, MO
ACRONYMS AND ABBREVIATIONS
µm micrometer amsl above mean sea level API American Petroleum Institute ASTM American Society for Testing and Materials bgs below ground surface cm/sec centimeters per second CMS Corrective Measures Study cp centipoise former refinery BP Former Amoco Refinery gpm gallons per minute GC gas chromatograph LNAPL light non-aqueous phase liquid mm millimeters non-VOC non-volatile organic compound POTW publicly owned treatment works PTS PTS Laboratories, Inc. psi pounds per square inch psig pounds per square inch gauge RCRA Resource Conservation and Recovery Act RFI RCRA Facility Investigation Report ROC radius of capture ROI radius of influence SVOC semi-volatile organic compound USCS Unified Soil Classification System VOC Volatile Organic Compound
U.S. Environmental Protection Agency March 2005 Office of Solid Waste and Emergency Response Technology Innovation and Field Services Division 4

BP Products North America, Inc., Former Refinery, Sugar Creek, MO
EXECUTIVE SUMMARY
This case study was prepared to summarize the recovery of light non-aqueous phase liquid (LNAPL) at two locations at the BP Products of North America, Inc. Former Amoco Refinery (former refinery) in Sugar Creek, Missouri. The purpose of this case study was to evaluate the cost and performance of two remediation systems - one innovative (high-vacuum multi-phase extraction) and one comprised of a more traditional approach (dual-pump LNAPL and groundwater recovery). Two locations were selected for the case study based on differing soil lithology, hydrogeologic and LNAPL characteristics, and remedial approach. This case study illustrates the benefits of using site characterization and LNAPL recovery data to predict the effectiveness and longevity of the technologies. In addition, a cost comparison is made between the two LNAPL recovery technologies: dual-pump recovery applied in sand and multi-phase extraction applied in silt.
Dual-Pump Recovery
Dual-pump recovery has been applied at the Lower Refinery Area to recover LNAPL beginning with three wells in 1982, expanding to 15 wells in 1988. System optimization and asymptotic recovery has resulted in a reduction in the number of operating wells to six by 2004. The geology of the Lower Refinery Area consists of silty to fine sand with 11 to 69 percent fines, and hydraulic conductivity ranging from 10-3 to 10-4 centimeters/second (cm/sec). Measured LNAPL saturations in the dual-pump recovery area were as high as 36 percent of the pore volume and averaged between 7 and 10-percent per soil core. The dual-pump recovery wells have collectively recovered approximately 1.82 million gallons of LNAPL and 183.5 million gallons of groundwater from 1982 through 2003 and recovered another 79,500 gallons of LNAPL and 12 millions gallons of groundwater during 2004. The total groundwater to LNAPL recovered ratio for the dual-pump recovery system is 109:1.
Multi-Phase Extraction
Multi-phase extraction technology was applied in a portion of the former refinery known as the Crawford Area. Multi-phase extraction involves application of a high vacuum to the subsurface to recover LNAPL and groundwater and control migration of LNAPL from seeping into Sugar Creek, a small stream that bisects the former refinery property. The Crawford Area site geology is silt loess, with 92 to 98-percent fines, and is characterized by low hydraulic conductivity on the order of 10-6
cm/sec. Measured LNAPL thicknesses in monitoring wells in the Crawford Area were up to 16 feet, but soil core analyses indicated the LNAPL was discontinuous and limited in volume with a maximum LNAPL saturation of only 1.4 percent of the pore volume. The multi-phase extraction system was operated from January 2001 until January 2003. Over two years of operation, it operated at 26-inches of mercury vacuum and recovered only 151 gallons of LNAPL and 216,000 gallons of groundwater. The total groundwater to LNAPL recovered ratio for the multi-phase extraction system is 1,430:1.
Cost and Performance
The dual-pump recovery system has recovered 1.899 million gallons of LNAPL and is predicted to recover an additional 321,900 gallons of the estimated source volume of 1.1 million gallons over the next six years. Overall, the dual pump recovery system is expected to recover a total of 2.25 million gallons of LNAPL, which is equal to 67-percent of the estimated recoverable LNAPL source volume, based on the API Model-estimated LNAPL specific thickness over the plume area. The percent recovery of the initial LNAPL spill volume is unknown, due to lack of spill data, and does not take into account additional LNAPL in the unsaturated zone, smear zone or outside each recovery well’s radius of capture. Additional LNAPL likely exists outside of influence of the pumping radius of capture. By comparison, the total LNAPL recovery for the multi-phase extraction system amounted to less than 10-percent of the original estimated in-place LNAPL volume.
U.S. Environmental Protection Agency March 2005 Office of Solid Waste and Emergency Response Technology Innovation and Field Services Division 5
BP Products North America, Inc., Former Refinery, Sugar Creek, MO
Each remedial system’s performance and associated cost are very dependent on the different soil matrices (silt versus sand). Although the total cost of the dual-pump recovery system ($3,554,349) was much greater than the cost of the multi-phase extraction system ($183,053), the normalized cost per gallon of LNAPL recovered was significantly less, with dual-pump recovery equal to only $1.87 per gallon compared to multi-phase extraction at $1,212 per gallon. The dual-pump recovery system continues to recover significant quantities of LNAPL, and recovered an additional 79,500 gallons in 2004. The multi-phase extraction system was shutdown in January 2003 due to no LNAPL recovery over its last six months of operation.
Observations and Lessons Learned
Overall, the large difference in LNAPL recovery and performance of the two systems indicates that LNAPL recovery is much more effective from higher-permeability sands than low-permeability silts and clays, irrespective of the remediation technology. Although dual-pump recovery proves to be continually effective at recovering LNAPL from sand, it is not expected to be an appropriate technology for LNAPL recovery in silts and clays. Therefore, protection goals and LNAPL endpoints should reflect the technical limitations of remediation technologies and soil type, with appropriate performance expectations, operational timeframes, and shutdown criteria. This case study suggests that LNAPL recovery for the purpose of source removal and migration control is a viable remediation goal in sands whereas LNAPL source control and containment is more attainable and an appropriate remediation goal in silts and clays.
U.S. Environmental Protection Agency March 2005 Office of Solid Waste and Emergency Response Technology Innovation and Field Services Division 6

BP Products North America, Inc., Former Refinery, Sugar Creek, MO
1.0 INTRODUCTION
Remediation of light non-aqueous phase liquid (LNAPL) in contaminated media is a particularly challenging problem at large-scale sites. At former petroleum refineries, for example, LNAPL may consist of volatile organic compounds (VOCs), semi-volatile organic compounds (SVOCs), non-volatile organic compounds and trace metals. When released into the subsurface, they can release dissolved contaminants to groundwater or VOCs into subsurface gas and potentially indoor air for an extended period of time. In addition, if sites have low-permeability soils, characterization and remediation of LNAPL is particularly difficult. No single technology has been identified as the best solution for all sites and all soil types contaminated with LNAPL.
This case study summarizes the application of two LNAPL remedial technologies at two different locations at a large former petroleum refinery, the BP Products North America, Inc. Former Amoco Refinery in Sugar Creek, Missouri. This case study focuses on two LNAPL remediation systems at the former refinery, a multi-phase extraction system and a dual-pump recovery system. The locations of the two systems are in portions of the refinery known as the Crawford Area and the Lower Refinery Area, which are shown on Figure 1. The remedial systems were initially selected as interim measures based on their performance in two different soil matrices (i.e., silt/clay versus sand).
The purpose of this case study is to evaluate the cost and performance of the two LNAPL remediation systems and highlight how soil type can have a considerable effect on LNAPL recovery, cost, and performance. Remediation goals, LNAPL recovery, performance, lessons learned, data collection needs, modeling approaches, and LNAPL endpoint strategies are also discussed herein.
2.0 SITE INFORMATION
2.1 BACKGROUND
From 1904 to 1982, the Standard Oil Company and then Amoco Oil Company operated a petroleum refinery along the southern bank of the Missouri River east of Kansas City and north of Independence, Missouri in the township of Sugar Creek, Missouri. The former refinery property occupies approximately 500 acres of the southern floodplain and bluffs along the Missouri River (Figure 1), and Sugar Creek is a small urban stream that bisects the former refinery property and discharges to the Missouri River.
Refining operations ceased in 1982 and most tanks, process equipment, and buildings were dismantled by 1989. Petroleum products refined at the Sugar Creek refinery included gasoline, jet fuel, kerosene, furnace oil, liquified petroleum gases, petroleum coke, sulfur, and propylene polymers. Presently, BP Products North America, Inc. (BP) owns the refinery property and the only active industrial operations include a bulk storage and pipeline terminal for petroleum products, and an asphalt terminal. The majority of the former refinery property is currently inactive. The only residential use is off-site in the surrounding community of Sugar Creek.
Upon mutual agreement with United States Environmental Protection Agency (U.S. EPA) Region 7 and the Missouri Department of Natural Resources (MDNR), the site was divided into ten parcels for RCRA Corrective Action (Figure 1), based on prior refining use, proposed land use, geography, contaminants of concern, and soil conditions. In each area, various interim measures technologies have been applied including horizontal well total fluids extraction, vacuum truck enhanced fluid recovery, biosparging, hydraulic control pumping, multi-phase extraction, dual-pump LNAPL recovery, and gravity-draining interceptor trenches. In general, interim measures are designed and operated to abate imminent threats to human health and the environment. These technologies have been applied with varying degrees of success, and, based on their performance, are proposed for final corrective measures for the former refinery. Two interim measures technologies discussed in this case study include the Lower Refinery Recovery Well Network (i.e., dual-pump recovery) and Crawford Multi-Phase Extraction System (i.e., multi-phase extraction), are shown on Figure 1 and discussed in the following sections.
U.S. Environmental Protection Agency March 2005 Office of Solid Waste and Emergency Response Technology Innovation and Field Services Division 7

BP Products North America, Inc., Former Refinery, Sugar Creek, MO
The overall remediation goal of both systems is source reduction through LNAPL recovery to reduce mobility and risk to the environment. Prior to implementation, LNAPL seeps and sheens were periodically observed in Sugar Creek. Therefore, the goal of the interim measures systems was to eliminate LNAPL seeps and sheens while reducing LNAPL sources to the practical limit of recovery.
Based on the historical performance of the systems, the dual-pump recovery system was proposed as a final corrective measure for the Lower Refinery Area, while the multi-phase extraction system was determined not to be effective as a long-term remedy for the Crawford Area. The multi-phase extraction system was replaced with a hydraulic control pumping network in 2003, and presently both proposed final corrective measures technologies are currently under review as final remedies by U.S. EPA Region 7 and MDNR.
Figure 1. Site Map: BP Products North America, Inc. Former Refinery, Sugar Creek, Missouri
U.S. Environmental Protection Agency March 2005 Office of Solid Waste and Emergency Response Technology Innovation and Field Services Division 8

BP Products North America, Inc., Former Refinery, Sugar Creek, MO
2.1.1 Lower Refinery Area
Initial operations at the refinery began in the Lower Refinery Area in 1904, and, over the course of its operation, included numerous process units and storage tanks. Process units in the Lower Refinery consisted of the coke, crude, and pressure stills, an acid treating plant, a clay plant, a batch agitator, oil/water separator box, and storage tank area. Expansion added a naphtha sweetening plant, a paraffin plant, cracking unit separator, pipe stills, and a heater oil treating plant. In addition, there were three separate loading areas, a tetraethyl lead storage and blending area, and a total of 97 storage tanks in the Lower Refinery Area. The tanks were used to store crude feedstocks, intermediates, heater oil, fuel oil, diesel oil, gasoline oil, jet fuel, caustic, coalescer, prefractionator bottoms, slop oil, and process water. Currently, the only remaining storage tanks include Tank 95R, which is used for recovered LNAPL storage for the dual-pump recovery system, and two asphalt storage tanks.
Historically, LNAPL has been observed in 41 observation and monitoring wells in the Lower Refinery Area (RETEC, 2004a). The LNAPL observed in the Lower Refinery Area is thought to be the result of historical releases from process units and storage tanks present in the Lower Refinery Area dating back to the start of the Amoco Refinery in 1904. Historic LNAPL releases at the surface may have migrated vertically through the subsurface silty clay/clayey silt via macropores or preferential pathways (RETEC, 2004a). Upon reaching the deeper lithology sand and gravel, the LNAPL would have migrated laterally due to its larger pore sizes and greater permeability. In general, groundwater flow is to the north towards the Missouri River and to the west towards Sugar Creek. However, the sand and gravel are below the water table for most of the year, and the LNAPL is therefore under pressure in a semi-confined condition and is immobile under natural gradients. The LNAPL’s initial lateral migration was limited by the pressure head of LNAPL at the time of release, and the LNAPL has not migrated beyond the Lower Refinery Area since its release. This semi-confined phenomenon is believed to be the reason LNAPL in the Lower Refinery Area has not migrated downgradient to the Riverfront Area, Sugar Creek or the Missouri River (Figure 1). The conceptual site model for the presence of LNAPL and the hydrogeology of the Lower Refinery Area is discussed further in Section 3.
The presence of LNAPL in monitoring wells installed in the Lower Refinery Area in the early 1980s prompted the installation of the first phase of the recovery well network (Woodward-Clyde, 1989). The first three recovery wells (R-001, R-002, and R-003) were installed in 1982. Recovery well R-003 was replaced by R-004 in 1984. Alternatives for expanding the recovery well system followed. Beginning in 1987, six additional recovery wells (R-005, R-006, R-007, R 008, R-009, and R-010) were added to the area. Six other recovery wells (R-011 to R-016) were installed in 1988. The newer recovery wells were placed in areas of significant LNAPL accumulation (i.e., greater than two feet thick) (Woodward-Clyde, 1987). The recovery wells (active and inactive) and their status are outlined in Table 1. Well construction specifications are included in Table 2.
Today, only seven of the original 16 wells still operate. The other recovery wells were shut down due to minimal LNAPL recovery, borehole collapse, or biological fouling. Six of the seven remaining operating recovery wells are used to recover LNAPL from the subsurface and the seventh (R-015) is used solely for hydraulic control of an LNAPL seep location along Sugar Creek (SCOP-08) (RETEC, 2004c). Thus, recovery well R-015 is not discussed further in this case study.
In early 2002, it appeared that many of the recovery wells were not operating as originally designed, primarily due to the age of the system, and the equipment was modified or replaced to increase the efficiency of the active recovery wells. The remaining six recovery wells (R-001, R-002, R-006, R-007, R008, and R 009) constitute the dual-pump recovery system evaluated in this case study. The six remaining operational recovery wells are shown in Figure 2, and a schematic of one of the recovery wells and the dual-pump recovery flow diagram is provided in Figure 3. Groundwater is transferred to a Clarifier Tank and batch treated via air stripper and discharged to the local Publicly Owned Treatment Works (POTW), while LNAPL is transferred to Tank 95R for eventual recycling at an off-site facility.
U.S. Environmental Protection Agency March 2005 Office of Solid Waste and Emergency Response Technology Innovation and Field Services Division 9

BP Products North America, Inc., Former Refinery, Sugar Creek, MO
Figure 2. Dual-Pump Recovery System Location Map
Figure 3. Dual-Pump Recovery Schematic
U.S. Environmental Protection Agency March 2005 Office of Solid Waste and Emergency Response Technology Innovation and Field Services Division 10

BP Products North America, Inc., Former Refinery, Sugar Creek, MO
Table 1. Dual-Pump Recovery Well Status
Recovery Well
Date Installed Status Comments
R-001 1982 Modified and replaced equipment in 2003 to increase efficiency Operational
R-002 1982 Modified and replaced equipment in 2003 to increase efficiency Operational
R-003 1982 Limited operation from December 1982 to March 1984
Borehole collapse and suspected screen damage prevented adequate recovery and allowed silt to build up. Replaced with R-004 in 1984.
R-004 1984 Shut down in 1996
Excessive biological growth caused shut down; current vacuum liquid recovery location.
R-005 1987 Shut down in 1992 Shut down due to minimal LNAPL recovery.
R-006 1987 Modified and replaced equipment in 2003 to increase efficiency Operational
R-007 1988 Modified and replaced equipment in 2002 to increase efficiency Operational
R-008 1988 Modified and replaced equipment in 2002 to increase efficiency Operational
R-009 1987
Modified and replaced equipment in 2002 to increase efficiency. Placed in skimmer mode in April 2004 for testing purposes Operational
R-010 1987 Temporarily shut down in 2002
Temporarily shut down due to minimal LNAPL recovery. See Corrective Measures Study for more information.
R-011 1988 Shut down in 1992 Shut down due to minimal LNAPL recovery.
R-012 1988 Shut down in 1995 Shut down due to minimal LNAPL recovery.
R-013 1988 Shut down in July 2002 Shut down due to minimal LNAPL recovery.
R-014 1988 Shut down in 1995 Shut down due to minimal LNAPL recovery.
R-015 1988 Hydraulic Barrier System
Acting as a hydraulic barrier system; no longer part of the recovery well network.
R-016 1988 Shut down in 1995 Shut down due to minimal LNAPL recovery.
U.S. Environmental Protection Agency March 2005 Office of Solid Waste and Emergency Response Technology Innovation and Field Services Division 11

BP Products North America, Inc., Former Refinery, Sugar Creek, MO
Table 2. Dual-Pump Recovery Well Construction Details
Elev. Elev. Approx. Recovery Top of Ground Screened
Well Casing Surface Casing Screen Interval Number (ft amsl) (ft amsl) Material Material (ft bgs) R-001 743.2 741.9 Steel Stain. Steel 11-46 R-002 743.2 743.2 PVC SCH.80 PVC SCH.80 15-50 R-003 NA NA PVC SCH.80 PVC SCH.80 N/A R-004 742.8 740.8 PVC SCH.80 Galv. Steel 17.5-52.5 R-005 743.1 740.6 Carbon Steel Stain. Steel 20-55 R-006 743.9 741.4 Carbon Steel Stain. Steel 11-46 R-007 743.3 740.9 Carbon Steel Stain. Steel 19-54 R-008 744.3 741.3 Carbon Steel Stain. Steel 22-57 R-009 743.4 741.3 Carbon Steel Stain. Steel 25-60 R-010 743.5 741.7 Carbon Steel Stain. Steel 19-54 R-011 739.2 736.7 Carbon Steel Stain. Steel 16-51 R-012 741.6 736.2 Carbon Steel Stain. Steel 14-49 R-013 738.8 739.0 Carbon Steel Stain. Steel 14-49 R-014 744.5 741.7 Carbon Steel Stain. Steel 16-51 R-015 745.8 743.5 Carbon Steel Stain. Steel 5-40 R-016 748.7 745.6 Carbon Steel Stain. Steel 5-40
Notes: ft. amsl – feet above mean sea level ft. bgs – feet below ground surface
All recovery wells are 12-inches in diameter and have a 20 slot screen size. Each recovery well is equipped with an automated dual-pump system: one dedicated for groundwater and the other for LNAPL. A cone of depression develops around the recovery well when the water pump extracts water from the well and LNAPL within the cone of depression is drawn toward the well. Each well has a dedicated LNAPL pump which removes the LNAPL automatically after it reaches a predetermined thickness. Meters are attached to each water and LNAPL pump to record the quantity of liquids removed. The system automatically adjusts for fluctuations in groundwater elevations, maintaining a constant groundwater elevation in the well. All LNAPL is pumped to Tank 95R for storage and eventual recycling.
Field personnel record the volume of extracted LNAPL and groundwater and the fluid level measurements weekly. The elevation of the Missouri River is also recorded on a weekly basis, due to its effect on LNAPL and groundwater recovery. These monitoring requirements are outlined in the Interim Measures Work Plan (Woodward-Clyde, 1989) and the data are provided in Quarterly Progress Reports (BP, 1989 through 2004). Each recovery well has an associated observation well, typically installed within 30 feet of the recovery wells, used to monitor LNAPL thicknesses. The depths to LNAPL and groundwater in the observation wells are measured on a monthly basis.
2.1.2 Crawford Area
The Crawford Area is located in the south-central portion of the refinery along the western bank of Sugar Creek, as shown in Figure 1. The Crawford Area was part of the refinery’s major expansion efforts in the 1920s and 1930s on a tract of land west of Sugar Creek (Figure 1). Refining operations began in the Crawford Area in 1921 and continued until the late 1950s. Currently there are no active petroleum operations or tank storage in the Crawford Area.
LNAPL has been observed in monitoring wells and piezometers in the Crawford Area (RETEC, 2004b). Groundwater flow is from the Crawford Area east towards Sugar Creek. Sugar Creek is a gaining stream
U.S. Environmental Protection Agency March 2005 Office of Solid Waste and Emergency Response Technology Innovation and Field Services Division 12

BP Products North America, Inc., Former Refinery, Sugar Creek, MO
although average base flows are only 720 gallons per minute (gpm) (i.e., 1.6 cubic feet per second). Based on the hydraulic conductivity and gradient, the estimated groundwater seepage rate from the Crawford Area into Sugar Creek is only 0.14 gpm, which is approximately 0.02 percent of the average base flow rate of 720 gpm for Sugar Creek (RETEC, 2004b).
Isolated and periodic LNAPL seeps were observed in Sugar Creek which are believed to be from historical releases in the Crawford Area (RETEC, 2004b). To abate the seeps and due to the fine-grained low-permeability soils in the Crawford Area, multi-phase extraction was selected as an interim measure to extract LNAPL and groundwater under high vacuum. The system was pilot tested in 1998 and then full-scale operation on six extraction wells was started in January 2001. The extraction wells, MW-078, SC-14, SC-15, SC-16, SC-24, and SC-25, are shown in Figure 4, and a process flow diagram of the multi-phase extraction system is provided in Figure 5. Table 3 provides construction information on the multi-phase extraction wells. The multi-phase extraction system was cycled for four months, and then it was determined that more LNAPL recovery could be achieved through full-time extraction from one well, MW-078, which was operated until January 2003. Total fluids were extracted via a 10 horsepower high-vacuum liquid ring vacuum pump, separated in a knockout tank and water was discharged to an oil water separator and to the POTW. Vapors were treated with granular activated carbon drums and discharged to the atmosphere. LNAPL was periodically transferred to the Tank 95R.
Table 3. Multi-Phase Extraction Well Details
Well ID Date
Completed
Top of Casing
(ft. amsl)
Ground elev.
(ft. amsl)
Well Diameter (inches)
Casing Material
Total Boring Depth
(ft. bgs)
Screen Interval (ft. bgs)
MW-078 4/12/1995 764.87 763.09 2 SCH 40 PVC 30.5 13.5-28.5 SC-14 8/13/1999 764.44 763.03 0.75 SCH 40 PVC 24 9-24 SC-15 8/13/1999 763.92 762.63 0.75 SCH 40 PVC 24 9-24 SC-16 8/13/1999 764.27 762.23 0.75 SCH 40 PVC 28 8-28 SC-24 8/29/2000 763.81 762.69 1 SCH 40 PVC 28 8-28 SC-25 8/29/2000 763.91 762.87 1 SCH 40 PVC 28 8-28
Notes: ft. amsl – feet above mean sea level ft. bgs – feet below ground surface
U.S. Environmental Protection Agency March 2005 Office of Solid Waste and Emergency Response Technology Innovation and Field Services Division 13

BP Products North America, Inc., Former Refinery, Sugar Creek, MO
Figure 4. Multi-Phase Extraction System Location Map
Figure 5. Multi-Phase Extraction Flow Diagram
U.S. Environmental Protection Agency March 2005 Office of Solid Waste and Emergency Response Technology Innovation and Field Services Division 14

BP Products North America, Inc., Former Refinery, Sugar Creek, MO
3.0 MATRIX DESCRIPTION AND LNAPL CHARACTERISTICS
Matrix characteristics and operating parameters can affect the cost or performance of a treatment technology. This section evaluates the key parameters that affect cost or performance of dual-pump recovery and multi-phase extraction. The matrix characteristics documented in this section include soil types, soil properties, hydrogeology, LNAPL characteristics, and LNAPL volume estimates. The operating parameters include system parameters, such as pumping rates and applied vacuum.
3.1 MATRIX CHARACTERISTICS AND OPERATING PARAMETERS AFFECTING TECHNOLOGY COST OR PERFORMANCE
3.1.1 Dual-Pump Recovery
Unconsolidated sediments in the Lower Refinery Area consist of colluvium overlying alluvial deposits within the floodplains of both the Missouri River and Sugar Creek. The upper lithologic zone (Zone A) exists from ground surface to approximately 25 to 35 feet bgs. Zone A is described on Lower Refinery Area boring logs as silty clay or clayey silt with occasional fine sand (RETEC, 2004a). Zone B extends to bedrock (approximately 60 feet bgs) and pinches out to the south. Zone B is described as a silty to coarse sand which coarsens with depth in the Lower Refinery Area (RETEC, 2004a).
Table 4 lists the matrix characteristics of the soil in the Lower Refinery Area which affect the cost or performance of the dual-pump recovery system.
Table 4. Matrix Characteristics and Operating Parameters Affecting Technology Cost or Performance of Dual-Pump Recovery (RETEC, 2004a)
Soil Classification
Parameter Zone A: silty clay or clayey silt with occasional fine sand. Zone B: silty fine to coarse sand with a small percentage of fine to coarse gravel.
Value
Clay Content and/or Particle Size Distribution
Zone A: 69 to 99 percent fines Zone B: 4 to 68 percent fines
Hydraulic conductivity
Air Permeability
Zone A: 1x10⁻⁴ to 4x10⁻⁴ cm/sec Zone B: 7x10⁻⁴ to 6x10⁻³ cm/sec Not measured
Porosity Zone A: 43 to 73% Zone B: 32 to 56%
Depth of groundwater below ground surface 25 feet (average pre-pumping) – in Zone A 33 feet (average pumping) – at Zone A/B interface
Total Organic Carbon Zone A: 1.7% Zone B: 0.4%
Groundwater Pumping Rate
R-001: 1.8 gpm (avg.), 4.6 gpm (max.) R-002: 3.2 gpm (avg.), 8.0 gpm (max.) R-006: 3.6 gpm (avg.), 7.9 gpm (max.) R-007: 8.7 gpm (avg.), 12.5 gpm (max.) R-008: 6.2 gpm (avg.), 9.1 gpm (max.) R-009: 2.7 gpm (avg.), 7.7 gpm (max.)
Notes: cm/sec – centimeters per secondgpm – gallons per minute
U.S. Environmental Protection Agency March 2005 Office of Solid Waste and Emergency Response Technology Innovation and Field Services Division 15

BP Products North America, Inc., Former Refinery, Sugar Creek, MO
3.1.2 Multi-Phase Extraction
LNAPL in the Crawford Area is located in unconsolidated deposits consisting of fill; silt, clayey silt to silty clay; and silt loess (RETEC, 2004b). Loess, consisting of windblown silt and clay, is the predominant soil lithology in the Crawford Area. Lithologic data collected in the Crawford Area describe the loess as poorly sorted silts and clayey silts with low to high plasticity, very stiff when unsaturated to soft when saturated.
Table 5 lists the matrix characteristics and operating parameters of the soil in the Crawford Area which affects the cost or performance of the multi-phase extraction system.
Table 5. Matrix Characteristics and Operating Parameters Affecting Technology Cost or Performance of Multi-Phase Extraction at the Former Refinery (RETEC, 2004b)
Parameter Value
Soil Classification Reworked loess and colluvium derived from the upland bluffs, consisting of clayey silt to silty clay sediments with occasional sands and gravels
Clay Content and/or Particle Size Distribution Loess: 89 to 94% silt/clay content Hydraulic conductivity 2x10⁻⁶ cm/sec Air Permeability K = 0.03 darcies Porosity 38 to 58%
Depth of groundwater below ground surface 9.7 feet (pre-pumping) 17 feet (during MPE)
Total Organic Carbon 2% to 3% Operating Pressure/Vacuum Maximum: 27 inches of mercury
Average: 26 inches of mercury Air Flow Rate Maximum: 98 acfm
Average: 13 acfm Groundwater Pumping Rate Maximum: 3.8 gpm
Average: 0.52 gpm Notes: cm/sec – centimeters per secondacfm – actual feet per minute gpm – gallons per minute
Overall, the soils in the multi-phase extraction area are predominantly cohesive silts and clays, and classified as fine-grained soils. Overall they have less air permeability and lower hydraulic conductivity than the soils in the dual-pump recovery area, which is reflected in the differences in groundwater pumping rate. Even at a vacuum-enhanced 26-inches of mercury, the multi-phase extraction system only averaged 0.52 gpm, while the dual-pump recovery wells average between 1.8 and 8.7 gpm per well (RETEC, 2004d).
3.2 LNAPL CHARACTERIZATION
The following sections provide information on LNAPL characterization, LNAPL saturation, and distribution at the dual-pump recovery and multi-phase extraction systems.
U.S. Environmental Protection Agency March 2005 Office of Solid Waste and Emergency Response Technology Innovation and Field Services Division 16

BP Products North America, Inc., Former Refinery, Sugar Creek, MO
3.2.1 Dual-Pump Recovery Area
Table 6 provides the LNAPL pore fluid saturations for the dual-pump recovery area. Sample identification (i.e., “ID”) is by soil boring ID and core interval in feet below ground surface (bgs). Sample locations are shown in Figure 2.
Table 6. LNAPL Saturations versus Depth for the Dual Pump Recovery Area (RETEC, 2004d)
MOISTURE DENSITY POROSITY, % Pore Fluid SAMPLE DEPTH, CONTENT BULK GRAIN AIR Saturations %
ID ft. (% wt) (g/cc) (g/cc) TOTAL FILLED WATER NAPL LRSB-4A/20-22.5' 21.0 45.4 1.09 2.61 58.3 7.4 87.3 ND<0.1 LRSB-4A/20-22.5' 22.0 47.5 1.07 2.62 59.3 8.6 85.4 0.1 LRSB-4A/22.5-25' 23.0 91.7 0.71 2.62 73.0 8.0 88.1 0.9 LRSB-4A/22.5-25' 24.1 38.1 1.26 2.60 51.5 3.2 92.5 1.2 LRSB-4A/25-27.5' 26.0 26.9 1.39 2.63 47.1 8.8 81.3 ND<0.1 LRSB-4A/25-27.5' 27.0 22.5 1.42 2.61 45.5 11.6 54.4 20.1 LRSB-4A/27.5-30' 28.0 31.4 1.31 2.55 48.8 7.8 84.0 0.1 LRSB-4A/27.5-30' 29.0 34.6 1.26 2.59 51.4 7.3 79.4 6.4 LRSB-4A/30-32' 30.5 23.3 1.45 2.69 46.1 11.8 67.6 6.8 LRSB-4A/30-32' 31.5 13.8 1.50 2.68 44.0 22.0 34.6 15.3
LRSB-4A/32-32.5' 32.4 38.0 1.17 2.63 55.5 26.3 38.7 14.0 LRSB-4A/32.5-35' 33.5 19.0 1.52 2.66 42.9 12.6 53.3 17.3 LSRB-5A/32.5-35' 33.0 20.0 1.48 2.61 43.2 13.0 56.2 13.6 LSRB-5A/32.5-35' 34.1 22.5 1.41 2.56 44.7 11.5 49.4 24.9 LSRB-5A/35-37 35.5 17.0 1.62 2.61 37.7 8.1 70.8 7.9 LSRB-5A/35-37 36.6 20.4 1.52 2.63 58.3 26.8 53.9 ND<0.1 LRSB-5A/37-39' 37.5 18.1 1.54 2.64 41.8 13.8 66.4 0.6 LRSB-5A/37-39' 38.5 13.8 1.66 2.64 37.4 14.2 61.9 ND<0.1
LSRB-5A/39-40.5' 39.25 19.1 1.52 2.63 63.2 33.7 46.7 ND<0.1 LSRB-5A/39-40.5' 40.25 12.7 1.79 2.63 31.8 9.0 70.6 1.0
LRSB-5A/40.5-42.5' 41.0 14.5 1.75 2.64 33.9 8.2 74.0 1.8 LRSB-5A/40.5-42.5' 42.0 12.6 1.81 2.65 31.7 8.8 71.9 0.3 LRSB-6A/30-32.5' 31.0 29.7 1.30 2.61 50.3 11.5 75.1 2.2 LRSB-6A/30-32.5' 32.1 26.7 1.31 2.62 50.1 13.3 53.5 19.9 LRSB-6A/32.5-35' 33.0 28.9 1.27 2.62 51.6 13.9 61.4 11.7 LRSB-6A/32.5-35' 34.1 27.6 1.29 2.63 51.0 14.0 55.5 17.1 LRSB-6A/35-37.5' 35.5 28.4 1.23 2.62 53.0 16.4 54.4 14.7 LRSB-6A/35-37.5' 36.9 26.4 1.36 2.62 48.1 10.4 61.4 17.0 LRSB-6A/37.5-40' 38.5 24.7 1.40 2.64 46.8 11.5 70.8 4.5 LRSB-6A/37.5-40' 39.5 23.9 1.43 2.64 45.7 11.2 75.2 0.3 LRSB-6A/40-42' 40.5 15.2 1.63 2.64 38.4 13.3 64.9 0.4 LRSB-6A/40-42' 41.5 12.2 1.75 2.64 33.8 12.2 63.7 0.2
U.S. Environmental Protection Agency March 2005 Office of Solid Waste and Emergency Response Technology Innovation and Field Services Division 17

BP Products North America, Inc., Former Refinery, Sugar Creek, MO
Table 6. LNAPL Saturations versus Depth for the Dual Pump Recovery Area, continued (RETEC, 2004d)
SAMPLE ID
SC-80B/5-7'SC-80B/7-8.5'
SC-80B/10-11.5'SC-80B/11.5-13'SC-80B/15-16'SC-80B/16-17'SC-80B/20-22'SC-80B/25-27'
SC-80B/30-31.5'SC-80B/30-31.5'SC-80B/31.5-33'SC-80B/35-36.5'SC-80B/35-36.5'SC-80B/36.5-37'SC-80B/40-41.5'
SC-80B/41.5-42.5'
DEPTH, ft. 5.5 8.2
11.25 12.7 15.5 16.5 21.5 26.5
30.25 31.25 32.75 35.2 36.2 37.7
40.25 42.0
MOISTURE CONTENT
(% wt) 26.7 21.4 21.8 21.8 19.7 24.9 21.5 20.5 25.5 24.9 14.2 7.4 11.9 14.8 12.9 20.3
DENSITY POROSITY, % Pore Fluid BULK GRAIN AIR Saturations % (g/cc) (g/cc) TOTAL FILLED WATER NAPL 1.46 2.54 42.4 3.1 90.8 2.0 1.43 2.57 44.4 13.7 68.9 0.2 1.40 2.58 45.7 14.3 56.5 12.3 1.39 2.63 47.2 16.2 55.1 10.7 1.46 2.60 44.0 14.8 61.1 5.4 1.44 2.60 44.7 8.5 77.5 3.5 1.40 2.61 46.3 16.2 63.3 1.8 1.42 2.62 45.9 15.6 53.0 13.0 1.40 2.61 46.6 9.4 60.0 19.9 1.47 2.60 43.5 6.8 84.2 0.1 1.69 2.64 36.0 10.1 36.1 35.9 1.85 2.63 29.6 15.1 32.2 16.8 1.79 2.62 31.7 9.6 57.4 12.3 1.80 2.63 31.6 3.9 70.3 17.4 1.80 2.64 31.8 8.6 72.8 ND<0.1 1.62 2.65 38.9 5.6 84.4 1.2
3.2.2 Multi-Phase Extraction Area
Table 7 provides the LNAPL pore fluid saturations for the multi-phase extraction system, and the soil boring location is shown on Figure 4.
Table 7. LNAPL Saturations versus Depth for the Multi-Phase Extraction Area (RETEC, 2004b)
Sample ID SC-24/4.6’SC-24/5.5’SC-24/5.6’SC-24/6.2’SC-24/7.8’SC-24/8.5’SC-24/8.9’SC-24/9.5’SC-24/9.8’SC-24/11.9’
Depth (ft.)
Moisture Content
%
4.6 24.3 5.5 24.1 5.6 22.1 6.2 20.4 7.8 23.3 8.5 22.3 8.9 20.2 9.5 25.8 9.8 26.3 11.9 24.4
Density Bulk (g/cc)
Grain (g/cc)
1.53 2.63 1.56 2.64 1.6 2.63
1.53 2.48 1.62 2.65 1.51 2.63 1.63 2.65 1.48 2.63 1.51 2.61 1.54 2.64
Porosity
Total Air
Filled 41.8 4.6 40.9 3.4 39.1 3.5 38.1 6.7 38.9 1.3 42.6 9 38.4 5.4 43.8 5.6 42.2 2.8 41.7 4.1
Pore Fluid Saturation,
% Pore Volume
Water LNAPL 89.8 0.1 90.6 1.4 92.1 <0.1 83.6 <0.1 99.9 <0.1 82.0 <0.1 88.5 <0.1 87.8 0.1 96.7 <0.1 91.5 <0.1
3.3 LNAPL SPECIFIC THICKNESS
Traditionally, the conceptual model for the occurrence of LNAPL in the subsurface pictured an LNAPL layer, “pool”, or “pancake” floating on a depressed representation of the capillary fringe or water table
U.S. Environmental Protection Agency March 2005 Office of Solid Waste and Emergency Response Technology Innovation and Field Services Division 18

BP Products North America, Inc., Former Refinery, Sugar Creek, MO
(Ballestero et al. 1994). This was based on laboratory experience in highly uniform sand or glass beads (idealized porous media), because those conditions are easiest to replicate in bench scale tests and can be performed rapidly. The concept of measured LNAPL thickness in an observation well equalizing with the LNAPL layer within the capillary fringe of the soil (even though the LNAPL saturation in the soil may be low), made it possible to explain large (5 or more ft) accumulations of LNAPL in observations wells while LNAPL recovery attempts in those conditions often resulted in recovery of little LNAPL.
Adamski, et al. (2004) explains the differences between LNAPL in homogenized sand versus fine-grained soils like those in the multi-phase extraction area. Counter-intuitive behaviors include the fact that a very small and discontinuous volume of LNAPL observed in the surrounding soil may result in several feet of LNAPL in an observation well; very low LNAPL recovery volumes when large LNAPL accumulations are present in neighboring wells; and apparent LNAPL migration below the water table. Because these observations did not fit with the traditional understanding of LNAPL in ideal porous media, LNAPL volumes were estimated based on a revised conceptual model for LNAPL in the subsurface.
To accurately estimate the quantity of LNAPL in the subsurface, the LNAPL specific thickness (i.e., “Do”) must be estimated from soil core or monitoring well data. Do is the integral of the LNAPL saturation over the depth of a soil column. It represents the total thickness of LNAPL that occurs as disseminated and discontinuous pockets of LNAPL throughout the LNAPL-impacted porous medium (i.e., subsurface soil). Therefore, Do is defined as the specific thickness of LNAPL, which is representative of the amount of LNAPL in a formation. For example, if you had a core of soil separated into its respective media (i.e., air, water, LNAPL, and soil), Do is a normalized volume of LNAPL (feet3/feet2) per unit surface area, but is expressed as a thickness (in units of feet). At equilibrium, due to capillary forces in soil, the measured LNAPL thickness in a monitoring well is always greater than Do.
The following schematic shows a conceptualization of a typical monitoring well in the subsurface with groundwater and LNAPL:
Figure 6. LNAPL Schematic in a Typical Monitoring Well (Charbeneau et al., 1999)
zao
zow
zaw
bo
Water Table
LNAPL Layer
The LNAPL thickness is located between the air-NAPL interface zao and the NAPL-water interface zow. The total monitoring well LNAPL thickness is bo. The elevation of the water table, zaw, provides the datum for fluid levels. While the water table is not measured in a monitoring well because of the LNAPL layer, its elevation is determined from the elevations zao and zow, and the LNAPL specific gravity.
U.S. Environmental Protection Agency March 2005 Office of Solid Waste and Emergency Response Technology Innovation and Field Services Division 19

BP Products North America, Inc., Former Refinery, Sugar Creek, MO
The relationship between measured monitoring well LNAPL thickness, bo, and the specific LNAPL volume, Do, may be calculated from the following equation:
z max
b D ( )( ) = ∫ dz z S n o o o zow
Where: Zmax = height of oil
Zow = height of the oil/water interface So = saturation of oil n = soil porosity
The function Do(bo) may be approximated piecewise by a linear function integration of soil core LNAPL saturations with depth. LNAPL specific thickness. Do. is calculated as follows:
Do = LNAPL % * porosity * soil core interval (ft.)
Where:
LNAPL % = oil saturation (in % of pore volume) porosity = site-specific total porosity (in %) soil core interval = interval of LNAPL impacted core (in feet)
Tables 6 and 7 summarize soil core data for both the Lower Refinery and Crawford Area monitoring wells. Table 8 provides the results of measured LNAPL thickness in wells compared to the integrated specific thickness Do. The results demonstrate that the specific thickness of LNAPL in the soil (expressed in units of feet) is a small fraction of the measured LNAPL thickness in monitoring wells.
Table 8. Comparison of Measured versus Specific LNAPL Thickness (Do) (RETEC, 2004b, 2004d)
bo Measured
Location Monitoring
Well Soil Type
(USCS Code)
LNAPL Thickness
(ft.) Do
(ft3/ft2Ratio of bo/Do
Remediation Technology )
0.09
0.51
0.24
Crawford SC-24 Loess (CL) 15 164 MPE Lower
Refinery MW-178 Silty Sand (SM) 4.16 8 DPR Lower
Refinery ROW-006A Silty Sand (SM) 5.6 23 DPR Lower
Refinery MW-179 Silty Sand (SM) 3.69 0.5 7 DPR Lower
Refinery SC-80B Fine Sand (SW) 9.35 1.55 6 DPR Notes: USCS – Unified Soil Classification System (CL – Clay, SM – silty sand, SW – well graded sand) Do is defined as the integral of the LNAPL saturation over the depth of the soil column, also known as the specific thickness of LNAPL over a given soil column area. MPE – Multi-Phase Extraction DPR – Dual Pump Recovery
For this case study, relative change in measured LNAPL thickness from observation wells within the Lower Refinery Area is used as a measurable indicator of recovery well performance (i.e., LNAPL recovery over time). This comparative relationship is valid only because of the consistency in soil and fluid properties within this area. Note that any measured LNAPL thickness presented throughout this evaluation is not indicative of actual LNAPL thickness in the subsurface. In addition, measured LNAPL
U.S. Environmental Protection Agency March 2005 Office of Solid Waste and Emergency Response Technology Innovation and Field Services Division 20

BP Products North America, Inc., Former Refinery, Sugar Creek, MO
thickness alone is not indicative of potential recoverability or the true volume of LNAPL in the subsurface. Soil and fluid properties must also be known to make accurate estimates of these values.
3.4 LNAPL CHARACTERIZATION
Table 9 compares characteristics of LNAPL at the dual-pump recovery and multi-phase extraction areas.
Table 9. LNAPL Characterization for the Dual-Pump Recovery and Multi-Phase Extraction Areas (RETEC, 2004b, 2004d)
LNAPL Type
Parameter light crude oil, slightly to moderately weathered
Dual-Pump Recovery Area middle distillate range diesel or fuel oil, heavily weathered
Multi-Phase Extraction Area
LNAPL Specific Thickness (Do)
LNAPL Pore Fluid Saturations LNAPL Density LNAPL Viscosity Interfacial Tension (LNAPL/Water) Surface Tension (Air/LNAPL) Benzene Percentage of Total LNAPLTEX Percentage of Total LNAPL
initially: unknown Presently: 0.70 feet (avg.) <0.1 to 35.9% 0.81 grams per milliliter (g/mL) 1.18 to 1.49 centipoise 14.3 to 20.5 dynes/cm 25.1 to 25.4 dynes/cm 2.82%
25.0%
Initially: 0.09 feet Presently: 0.04 feet <0.1 to 1.4% 0.92 grams per milliliter (g/mL) 6.3 to 13.9 centipoise 17.3 to 20.2 dynes/cm 27.4 to 30.7 dynes/cm 0.36%
1.12% Note: TEX – Toluene, Ethylbenzene, and Xylenes
The LNAPL in the multi-phase extraction system is less volatile, more viscous, and more degraded than in the dual-pump recovery area, which limits the effectiveness of a high-vacuum extraction technology. To overcome these factors, a 10 horsepower liquid ring vacuum pump was utilized to provide 26-inches of mercury vacuum to the subsurface to enhance groundwater and LNAPL recovery rates.
3.5 LNAPL VOLUME ESTIMATES
Even though up to 15 feet of LNAPL were measured at multi-phase extraction wells in the Crawford Area, the Do specific thickness equals only 0.09 ft3/ft2. For an estimate of LNAPL volume, the estimated plume extent equals approximately 50 ft. by 50 ft. is multiplied by Do specific thickness. Under these assumptions, the estimated volume of LNAPL in the Crawford Area was approximately 1,700 gallons.
In the dual-pump recovery area, LNAPL volume was estimated using an average Do from all soil cores in the Lower Refinery Area (Table 8, equal to 0.70 ft3/ft2) and a total plume size estimated at 5 acres. The current in-place LNAPL volume estimate within each recovery well’s radius of capture is 1.1 million gallons, which is significantly higher than in the multi-phase extraction area. Additional LNAPL exists in the unsaturated zone and outside of each well’s radius of capture. The larger amount of LNAPL in the dual-pump recovery area is due to a larger plume size, larger pore size, higher permeability soils and higher LNAPL saturations (see Table 6 and Table 7).
U.S. Environmental Protection Agency March 2005 Office of Solid Waste and Emergency Response Technology Innovation and Field Services Division 21

BP Products North America, Inc., Former Refinery, Sugar Creek, MO
4.0 REMEDIATION GOALS AND PERFORMANCE OBJECTIVES
Remediation goals and performance objectives for the former refinery are individual for each interim measure, but are designed and operated to abate imminent threats to human health and the environment. The overall remediation goal of both multi-phase extraction and dual-pump recovery systems is source reduction through LNAPL recovery to reduce mobility and risk to the environment.
During the technology evaluation process in the CMS, particular technologies are evaluated as potential final corrective measures technologies if they have a likelihood of meeting proposed LNAPL remediation goals and endpoints in a reasonable timeframe. Remediation goals and performance objectives provide a decision-making framework to guide a practicable and attainable approach for RCRA Corrective Action and long-term management of contaminated media and LNAPL in the subsurface.
The Handbook of Groundwater Protection and Cleanup Policies for RCRA Corrective Action (U.S. EPA, 2004) provides guidance on defining short, intermediate and long-term protection goals, as well as a timeframe for reaching endpoints at large RCRA corrective action sites. Overall protection goals are broad objectives, while endpoints are specifically identified to measure the progress towards meeting the goals. Short-term goals focus on immediate or imminent threats to human health and the environment, which are characterized under Groundwater and Human Health Environmental Indicators (EIs) (U.S. EPA, 2001) and, at RCRA sites, are typically addressed under RCRA interim measures. The short-term protection goal has been demonstrated through the issuance of the Human Health (U.S. EPA, 2002) and Groundwater (U.S. EPA, 2004b) EIs, which indicates that current human exposures and contaminated groundwater are under control at the former refinery. Intermediate protection goals are broader and longer-term than short-term goals and, for the former refinery, were defined for final corrective measures which have reachable and measurable endpoints in a tangible time frame. Long-term protection goals include final cleanup goals that ensure long-term protection of human health and the environment, control the source of releases, and achieve media cleanup objectives.
4.1 LNAPL REMEDIATION GOAL
The overall remediation goal for LNAPL at the former refinery is to recover LNAPL to the maximum extent reasonably, technically, and economically feasible and consistent with prudent engineering practices (i.e., reduce LNAPL to its practicable limit of recoverability). For both the multi-phase extraction and dual-pump recovery systems, the American Petroleum Institute’s (API) LNAPL Distribution and Recovery Model (Charbeneau, 2003) was used to define the practical limit of LNAPL recovery.
4.2 DUAL-PUMP RECOVERY AND MULTI-PHASE EXTRACTION PROTECTION GOALS
The former refinery is currently an interim status facility under RCRA, although final protection goals have been proposed to U.S. EPA and MDNR and are currently under review. The proposed protection goals for the LNAPL include the following:
Short-term protection goals:
• Eliminating LNAPL seeps to Sugar Creek (source/boundary control)
Intermediate protection goals:
• Eliminating LNAPL in the subsurface that may serve as a risk to surface water
Long-term protection goals:
• Reducing interior sources of LNAPL such that dissolved-phase hydrocarbon contaminants migrating from groundwater to surface water meet ECOTOX criteria in surface water (U.S. EPA, 1996)
U.S. Environmental Protection Agency March 2005 Office of Solid Waste and Emergency Response Technology Innovation and Field Services Division 22

BP Products North America, Inc., Former Refinery, Sugar Creek, MO
4.3 DEFINING APPROPRIATE ENDPOINTS
Endpoints are defined as site-specific, measurable criteria and milestones that demonstrate progress towards meeting protection goals. The following subsection outlines the proposed endpoints for shutdown of the dual-pump recovery and multi-phase extraction systems. The multi-phase extraction system was shutdown in January 2003 after six-months of no LNAPL recovery.
4.3.1 API Distribution and Recovery Modeling
Dual-pump recovery is designed to meet the intermediate protection goal of LNAPL source reduction to the practicable limit of LNAPL recovery. In order to define the practicable limit of LNAPL recovery, the API LNAPL Distribution and Recovery Model (Charbeneau, 2003) was used to predict LNAPL recovery from the dual-pump recovery system. The API modeling process includes two steps, distribution modeling of LNAPL in the subsurface, and recovery modeling under dual-pumping conditions, as summarized below. The API model results are then used to predict long-term LNAPL recovery to propose shutdown criteria (endpoints) for the dual-pump recovery system.
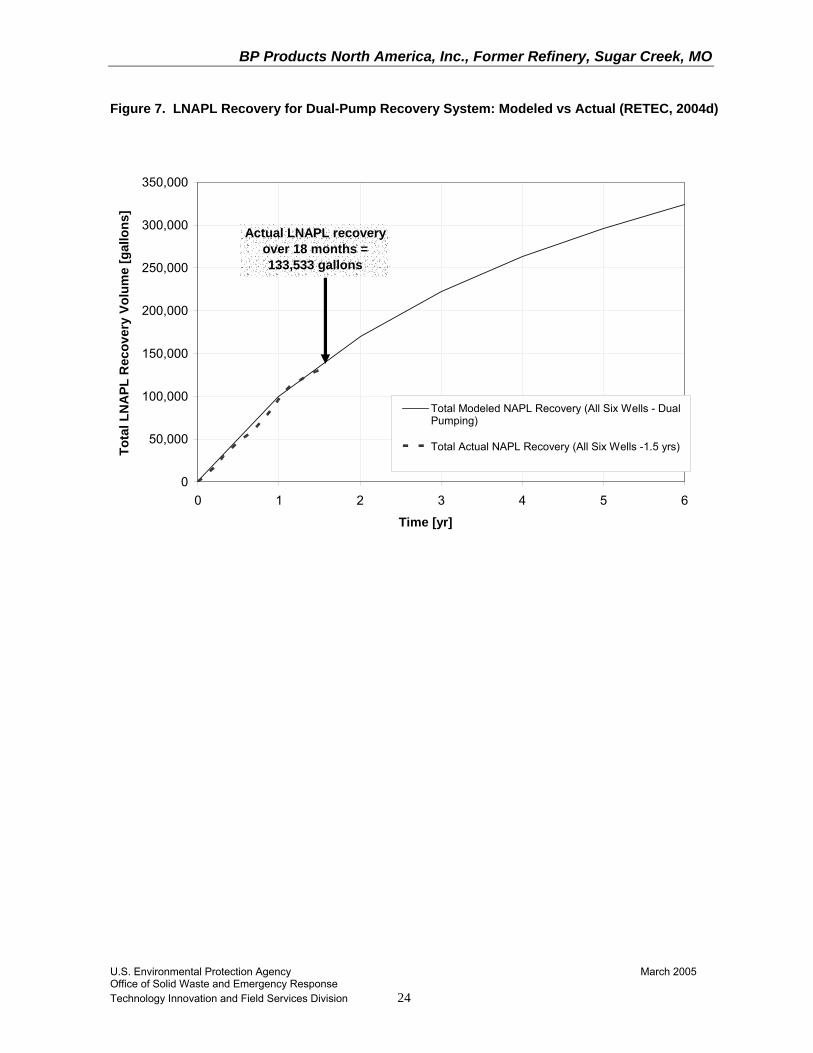
The distribution portion of the model predicts LNAPL saturation and permeability based on measured LNAPL thickness in a monitoring well and several site-specific soil, fluid (i.e., LNAPL and groundwater), and soil-fluid interaction parameters. Using the results of the distribution model, the recovery portion of the API model predicts LNAPL recovery from individual wells over time. After predicting LNAPL recovery for each recovery well, the model results were validated against one year of actual LNAPL recovery data (Figure 7) (RETEC, 2004d).
Inputs necessary to run the API distribution model include the following:
• Measured LNAPL thickness
• Soil input parameters: porosity, the van Genuchten parameters “N” and “α,” irreducible water saturation, and residual LNAPL saturation in the vadose and saturated zones
• Fluid input parameters: LNAPL density, air/water surface tension, air/LNAPL surface tension, and LNAPL/water surface tension
These parameters were taken from field measurements and observations, the results of the lab analysis of the soil plug samples and the fluid samples, or were based on professional judgment. The results from the API distribution model for each recovery well are then used as the basis for the API recovery model.
For recovery modeling, the data required to predict LNAPL recovery over time includes the radius of capture (ROC) for the well, radius of influence (i.e., cone of drawdown), the LNAPL viscosity, and water production rate. For a water-enhanced system, the effective depth of penetration of the well into the aquifer must also be specified. The API recovery model gives estimates of the total volume of LNAPL within the radius of capture of each recovery well, the amount of LNAPL that is recoverable at each well, the rate of recovery, the total time in which that LNAPL can be recovered, the measured LNAPL thickness over time in the recovery well, and the LNAPL recovery rate over time.
The API model was applied at the six remaining operational dual-pump recovery wells. Validation was performed using 18 months of actual LNAPL recovery data (from June 2003 to December 2004). The total LNAPL recovery of all six wells from June 2003 to December 2004 was equal to 133,533 gallons, which is approximately 6-percent less than the API model prediction of 141,500 gallons. Modeled results for the system, along with the first year validation are shown in Figure 7. Overall the API model results show good calibration to actual LNAPL recovery results.
U.S. Environmental Protection Agency March 2005 Office of Solid Waste and Emergency Response Technology Innovation and Field Services Division 23
BP Products North America, Inc., Former Refinery, Sugar Creek, MO
Figure 7. LNAPL Recovery for Dual-Pump Recovery System: Modeled vs Actual (RETEC, 2004d)
350,000
300,000
250,000
200,000
150,000
100,000
50,000
0
]
l i l
A
133,533 gallons
Tota
l LN
APL
Rec
over
y Vo
lum
e [g
allo
ns
Tota Modeled NAPL Recovery (All S x Wells - DuaPumping)
Total Actual NAPL Recovery (All Six Wells -1.5 yrs)
ctual LNAPL recovery over 18 months =
0 1 2 3 4 5 6
Time [yr]
U.S. Environmental Protection Agency March 2005 Office of Solid Waste and Emergency Response Technology Innovation and Field Services Division 24
BP Products North America, Inc., Former Refinery, Sugar Creek, MO
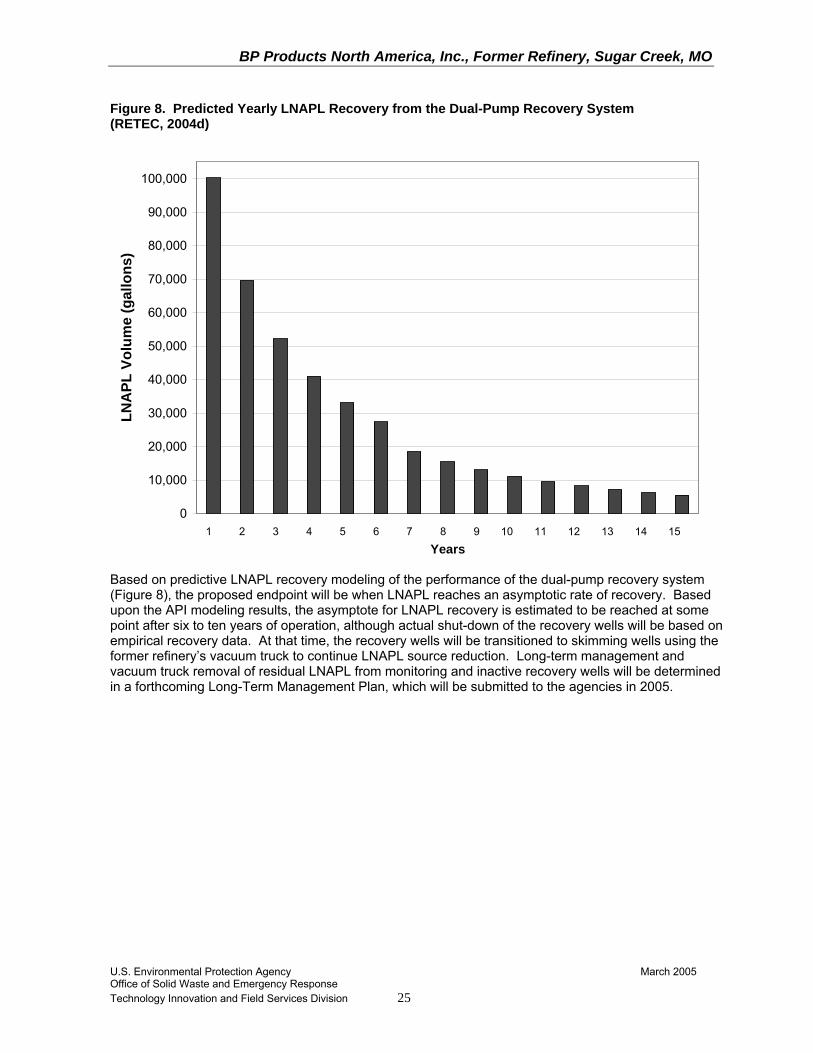
Figure 8. Predicted Yearly LNAPL Recovery from the Dual-Pump Recovery System (RETEC, 2004d)
LNA
PL V
olum
e (g
allo
ns)
100,000
90,000
80,000
70,000
60,000
50,000
40,000
30,000
20,000
10,000
0
Years
Based on predictive LNAPL recovery modeling of the performance of the dual-pump recovery system (Figure 8), the proposed endpoint will be when LNAPL reaches an asymptotic rate of recovery. Based upon the API modeling results, the asymptote for LNAPL recovery is estimated to be reached at some point after six to ten years of operation, although actual shut-down of the recovery wells will be based on empirical recovery data. At that time, the recovery wells will be transitioned to skimming wells using the former refinery’s vacuum truck to continue LNAPL source reduction. Long-term management and vacuum truck removal of residual LNAPL from monitoring and inactive recovery wells will be determined in a forthcoming Long-Term Management Plan, which will be submitted to the agencies in 2005.
1 2 3 4 5 6 7 8 9 10 11 12 13 14 15
U.S. Environmental Protection Agency March 2005 Office of Solid Waste and Emergency Response Technology Innovation and Field Services Division 25

BP Products North America, Inc., Former Refinery, Sugar Creek, MO
5.0 RECOVERY SYSTEMS DESCRIPTION, PERFORMANCE, AND COST
The following section provides a summary of the performance and cost of the dual-pump recovery and multi-phase extraction systems at the former refinery. Lessons learned and comparative performance are also discussed herein.
5.1 DUAL-PUMP RECOVERY SYSTEM
The dual-pump recovery system has operated at the former refinery for more than 20 years. Over that period of time, recovery well equipment has been replaced and modified following internal evaluations to optimize the system and improve system performance. This section primarily concentrates on the recovery well system performance since the system modifications were implemented, with pertinent historical information provided as appropriate. This section also includes items that affect the system as a whole; individual active recovery well performance is discussed in the next section.
5.1.1 Dual-Pump Recovery System Description
LNAPL recovered via the recovery well system is pumped directly from each well to LNAPL storage Tank 95R. Recovered LNAPL is stored in Tank 95R until it is sent off site for recycling. The Tank 95R gauge is used to measure the quantity of water and LNAPL within the tank on a weekly basis. These measurements are used to check the LNAPL mass balance.
The water treatment system includes a water totalizer, clarifier tank, and air stripper. Recovered groundwater is piped from each active recovery well to the clarifier tank prior to batch-transfer to the air stripper. Groundwater from the air stripper is discharged to the City of Independence publicly owned treatment works (POTW) for final treatment and disposal.
5.1.2 Dual-Pump Recovery System Performance
Based on historical records presented in the Quarterly Progress Reports (BP, 2004), the dual-pump recovery system has recovered 1.82 million gallons of LNAPL and over 200 million gallons of groundwater between 1982 and 2003. The following table provides annual totals of numbers of operating recovery wells, water recovery and LNAPL recovery.
Table 10. Dual-Pump Recovery System Annual Water and LNAPL Recovery (RETEC, 2004c)
Year 1982 1983 1984 1985 1986 1987 1988 1989 1990 1991 1992 1993
No. of Operating Recovery
Wells 2 2 3 3 3 3
15 15 15 15 13 13
Water Recovery (gallons)
81,700 81,700
122,600 122,600 122,600 122,600 612,910
13,594,543 22,555,415 20,718,219 18,537,399 12,283,788
LNAPL Recovery (gallons)
12,000 12,000 18,000 15,000 15,000 15,000 92,365
179,799 180,000 180,000 180,000 150,000
Gallon water / gallon LNAPL
6.8 6.8 6.8 8.2 8.2 8.2 6.6 76 125 115 103 82
U.S. Environmental Protection Agency March 2005 Office of Solid Waste and Emergency Response Technology Innovation and Field Services Division 26
BP Products North America, Inc., Former Refinery, Sugar Creek, MO
Year 1994 1995 1996 1997 1998 1999 2000 2001 2002 2003 2004
No. of Operating Recovery
Wells 13 10 9 9 9 9 9 9 7 6 6
Water Recovery (gallons)
LNAPL Recovery (gallons)
Gallon water / gallon LNAPL
3,823,121 50,927 75 13,810,350 119,552 116 15,687,000 134,672 116 10,745,430 68,492 157 13,531,570 94,239 144 13,609,270 95,286 143 11,573,710 72,301 160
8,421,900 50,362 167 2,607,390 11,186 233
12,100,000 73,500 165 12,462,984 79,500 157
Total = 207,328,799 1,899,181 Total Water/LNAPL ratio = 109.2
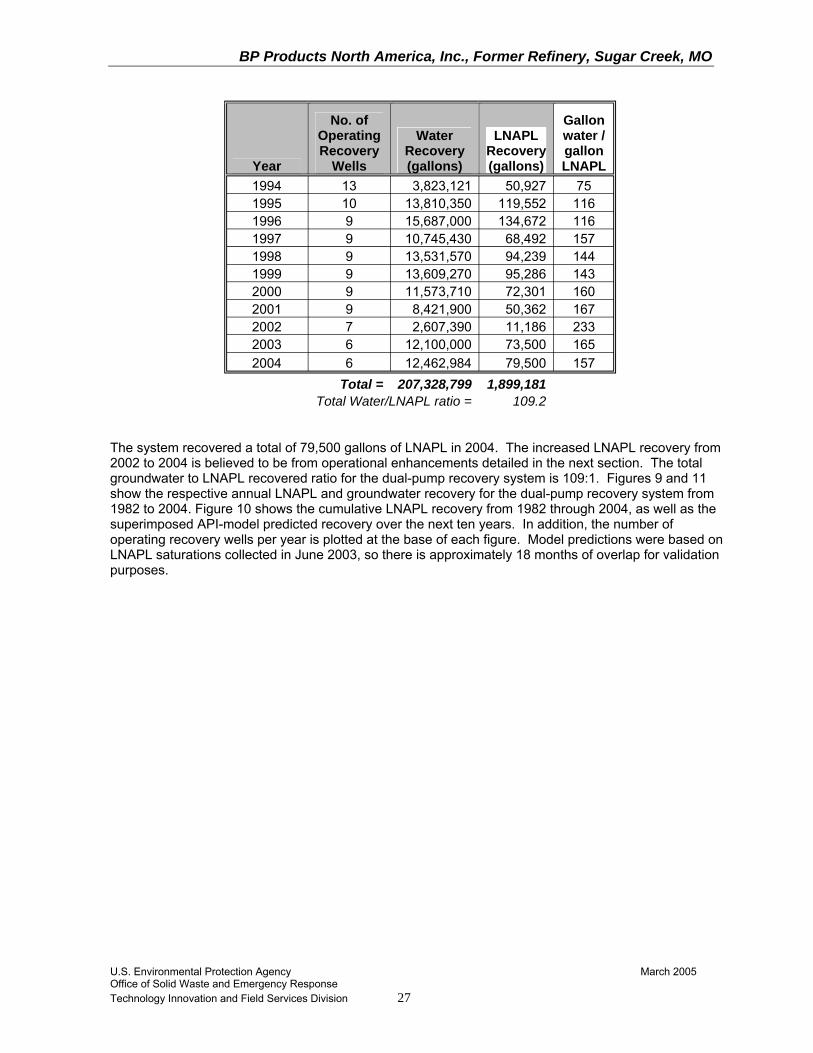
The system recovered a total of 79,500 gallons of LNAPL in 2004. The increased LNAPL recovery from 2002 to 2004 is believed to be from operational enhancements detailed in the next section. The total groundwater to LNAPL recovered ratio for the dual-pump recovery system is 109:1. Figures 9 and 11 show the respective annual LNAPL and groundwater recovery for the dual-pump recovery system from 1982 to 2004. Figure 10 shows the cumulative LNAPL recovery from 1982 through 2004, as well as the superimposed API-model predicted recovery over the next ten years. In addition, the number of operating recovery wells per year is plotted at the base of each figure. Model predictions were based on LNAPL saturations collected in June 2003, so there is approximately 18 months of overlap for validation purposes.
U.S. Environmental Protection Agency March 2005 Office of Solid Waste and Emergency Response Technology Innovation and Field Services Division 27

BP Products North America, Inc., Former Refinery, Sugar Creek, MO
Figure 9. Dual-Pump Recovery System Annual LNAPL Recovery (RETEC, 2004c)
0
()
10,000
20,000
30,000
40,000
50,000
60,000
70,000
80,000
90,000
100,000
110,000
120,000
130,000
140,000
150,000
160,000
170,000
180,000
190,000
200,000 LN
APL
Rec
over
yga
llons
1982
1983
1984
1985
1986
1987
1988
1989
1990
1991
1992
1993
1994
1995
1996
1997
1998
1999
2000
2001
2002
2003
2004
2 2 3 3 3 3 15 15 15 15 13 13 13 10 9 9 9 9 9 9 7 6 6
Number of Wells in Operation
Figure 10. Lower Refinery Recovery Well Network Cumulative LNAPL Recovery
0
)
500,000
1,000,000
1,500,000
2,000,000
2,500,000
LNA
PL R
ecov
ered
(gal
.
J-14J-13J-12J-11J-10J-09J-08J-07J-06J-05J-04J-03J-02J-01J-00J-99J-98J-97J-96J-95J-94J-93J-92J-91J-90J-89J-88J-87J-86J-85J-84J-83J-82
Year
( lCumulative LNAPL Recovery gal.) Mode -Predicted Future Recovery (gal.)
U.S. Environmental Protection Agency March 2005 Office of Solid Waste and Emergency ResponseTechnology Innovation and Field Services Division 28

BP Products North America, Inc., Former Refinery, Sugar Creek, MO
Figure 11. Dual-Pump Recovery System Annual Groundwater Recovery (RETEC, 2004c)
10,000
100,000
1,000,000
10,000,000
100,000,000 G
roun
dwat
er R
ecov
ery
(gal
lons
)
1982
1983
1984
1985
1986
1987
1988
1989
1990
1991
1992
1993
1994
1995
1996
1997
1998
1999
2000
2001
2002
2003
2004
2 2 3 3 3 3 15 15 15 15 13 13 13 10 9 9 9 9 9 9 7 6
Number of Wells in Operation
The effectiveness of LNAPL source recovery is indicated in reductions in measured LNAPL thickness over time. Table 11 shows measured LNAPL thickness reductions over time in monitoring wells in the dual-pump recovery network.
U.S. Environmental Protection Agency March 2005 Office of Solid Waste and Emergency ResponseTechnology Innovation and Field Services Division 29
6

BP Products North America, Inc., Former Refinery, Sugar Creek, MO
Table 11. Measured LNAPL Thicknesses Reductions in Dual-Pump Recovery System Observation Wells over Time (RETEC, 2004d)
Well Well 1986/ 1987
1989/ 1990
1992/ 1993
1996/ 1997
1999/ 2000
2003/ 2004
in LNAPL
A-014 NA 0.07 0.8 0 0.24 0.02 0 100% A-015 5.54 NM NM 2.1 NM NM 62% A-015A 10.87 NM NM 4.51 NM NM 59% A-038 NA 6.27 0 0.2 2.74 0.27 0 100% A-039 2.25 NM NM 1.62 NM 0 100% A-040 0.26 NM NM 0 NM NM 100% A-041 NA 1.77 NM NM 0.72 NM 0.55 69%
NA NM NM NM 0.84 NM NM NA MW-179 NA NM NM NM NM NM 7.12 NA
NM 7.3 0 NM NM NM 100% NM NM NM NM NM 4.99 NA NM 8.7 10.3 9.35 4.83 4.42 49% NM 7.8 9.3 10.65 6.65 3.29 58% NM 7.6 7.1 3.71 0.01 0 100% NM 10.3 3.7 0 0.09 NM 99%
Measured LNAPL Thickness (feet)
Observation Recovery % Decrease
Thickness
R-001 R-001
R-002 R-005
HB-005
ROW-006 R-006 ROW-006A R-006 ROW-007 R-007 ROW-008 R-008 ROW-009 R-009 ROW-010 R-010
Notes: NM – Not Measured % Decrease in LNAPL thickness is calculated using 2003/2004 data, if it exists. Earlier numbers are used in some cases.
The data in Table 11 demonstrates that initial LNAPL thickness measurements averaged 7 feet before source reduction and system optimization in 2002 (RETEC, 2002). Measured LNAPL thickness has been significantly reduced over time in each observation well located within the vicinity of the recovery well network. The observation wells show a minimum 49 percent and average 83 percent decrease in measured LNAPL in 2003/2004 when compared to initial measurements (Table 11), with many of the wells showing no measurable LNAPL during the most recent gauging events. The decrease in measured LNAPL thickness in the observation wells indicates that the dual-pump recovery system is successfully removing LNAPL volume and reducing saturation in the subsurface.
The recovery well system optimization (RETEC, 2002) determined that groundwater elevation and LNAPL thickness in the recovery wells should be maintained at approximately 705 feet above mean sea level (amsl) to increase LNAPL recovery rates. This corresponds to the interface between lithologic Zones A and B, and was considered to be the optimum groundwater level for LNAPL recovery in the recovery wells (RETEC, 2002). As the Missouri River elevation increases above 705 feet amsl, the gradient to the dual-pump recovery wells is increased and LNAPL recovery is increased. Figure 12 shows an example of LNAPL recovery at recovery well R-007 when the water level was maintained at 705 ft. amsl from January to July 2003 and lowered to 699 ft. amsl from July through December 2003. The chart shows that LNAPL recovery increased with pump elevations lowered to 699 ft. amsl, which corresponds with the lowest elevation the pumps can be placed in recovery well R-007.
U.S. Environmental Protection Agency March 2005 Office of Solid Waste and Emergency Response Technology Innovation and Field Services Division 30

BP Products North America, Inc., Former Refinery, Sugar Creek, MO
Figure 12. Well R-007 Fluid Level Measurements and LNAPL Recovery for 2003 (RETEC, 2004c)
l
(l)
0
l (
)
( / ) l ( l) l ( l)
R-007 Fluid Level Measurements
695
697
699
701
703
705
707
709
711
Jan-03 Feb-03 Apr-03 May-03 Ju -03 Sep-03 Oct-03 Dec-03
Date
Elev
atio
nfe
et a
ms
200
400
600
800
1,000
1,200
1,400
Wee
ky
LNAP
L R
ecov
ery
gal
LNAPL Recovered gal week Water E ev. ft. ams LNAPL E ev. ft. ams
Based on the LNAPL/water recovery ratio, well R-007 is one of the most effective recovery wells in the system. It has the greatest daily LNAPL recovery rate at approximately 97 gallons, although it also has the greatest daily water recovery rate at 9,900 gallons. In 2004, it recovered over 42,000 gallons of LNAPL, which is greater than the estimated LNAPL recovery of all other recovery wells combined.
5.1.3 Dual-Pump Recovery System Costs
The following capital costs were estimated for the dual-pump recovery system, based on installation dates of dual-pump recovery wells:
Table 12. Dual-Pump Recovery System Estimated Capital Costs
Year
No. of Wells Drilled
Drilling Cost per
well Pump cost
per well 1982 3 $ 10,000 $ 2,000 1984 1 $ 12,000 $ 2,400 1987 4 $ 14,000 $ 2,800 1988 8 $ 15,000 $ 3,000
Electrical Controls per well
$ 6,000 $ 8,000 $ 10,000 $ 11,000
Labor per well
$ 4,000 $ 5,000 $ 7,000 $ 8,000
Design/ Oversight
(25%) $ 5,500 $ 6,850 $ 8,450 $ 9,250
Subtotal per well
Subtotal (per year)
$ 27,500 $ 82,500 $ 34,250 $ 34,250 $ 42,250 $ 169,000 $ 46,250 $ 370,000
Total = $ 655,750 NPV = $ 1,258,514
Note: Net Present Value (NPV) estimated at a 3.5 percent discount rate
U.S. Environmental Protection Agency March 2005 Office of Solid Waste and Emergency Response Technology Innovation and Field Services Division 31

BP Products North America, Inc., Former Refinery, Sugar Creek, MO
In addition, the following are estimated annual O&M Costs:
Table 13. Dual-Pump Recovery System Estimated O&M Costs
Year 1982 1983 1984 1985 1986 1987 1988 1989 1990 1991 1992 1993 1994 1995 1996 1997 1998 1999 2000 2001 2002 2003 2004
No. of Operating Recovery
Wells 2 2 3 3 3 3 15 15 15 15 13 13 13 10 9 9 9 9 9 9 7 6 6
Annual O&M Costs $ 20,000 $ 20,000 $ 30,000 $ 30,000 $ 30,000 $ 30,000 $ 150,000 $ 150,000 $ 150,000 $ 150,000 $ 130,000 $ 130,000 $ 130,000 $ 100,000 $ 90,000 $ 90,000 $ 90,000 $ 90,000 $ 90,000 $ 90,000 $ 90,000 $ 142,000 $ 100,000
POTW Water
Disposal Costs
$ 163 $ 163 $ 245 $ 245 $ 245 $ 245 $ 1,226 $ 27,189 $ 45,111 $ 41,436 $ 37,075 $ 24,568 $ 7,646 $ 27,621 $ 31,374 $ 21,491 $ 27,063 $ 27,219 $ 23,147 $ 16,844 $ 5,215 $ 24,200 $ 25,125
Oil Sale ($0.50/gallon) $ (6,000) $ (6,000) $ (9,000) $ (7,500) $ (7,500) $ (7,500) $ (46,183) $ (89,900) $ (90,000) $ (90,000) $ (90,000) $ (75,000) $ (25,464) $ (59,776) $ (67,336) $ (34,246) $ (47,120) $ (47,643) $ (36,151) $ (25,181) $ (5,593) $ (36,750) $ (52,933)
Subtotal O&M Costs $ 14,163 $ 14,163 $ 21,245 $ 22,745 $ 22,745 $ 22,745 $ 105,043 $ 87,290 $ 105,111 $ 101,436 $ 77,075 $ 79,568 $ 112,183 $ 67,845 $ 54,038 $ 77,245 $ 69,944 $ 69,576 $ 76,997 $ 81,663 $ 89,622 $ 129,450 $ 72,192
Total O&M = $1,574,083 NPV = $2,295,835
Notes: Annual O&M costs include labor, electricity, replacement materials. Annual O&M costs from 1982 to 2002 are estimated based O&M cost per well and number of wells operating. NPV = Net Present Value at a 3.5 percent discount rate
Based on the estimated capital cost ($1,258,514) and O&M cost ($2,295,835), the total cost of the dual-pump recovery system, accounting for inflation, is equal to $3,554,349. Assuming 1.899 million gallons of LNAPL have been recovered to date, the cost per gallon to recover LNAPL using dual-pump recovery is $1.87 per gallon.
5.1.4 Dual-Pump Recovery System Observations and Lessons Learned
Originally, tracking water levels in the dual-pump recovery system with the Missouri River stage was proposed in the Interim Measures Work Plan (Woodward-Clyde, 1989). This procedure was used until 2002 but now is not considered the most efficient method of running the system. It now appears that the most effective method to run the system is to maintain pump levels at an elevation of 699 ft. (instead of 705) amsl and let the Missouri River fluctuations fluctuate, seasonally developing a large gradient between the recovery system and the river. At an elevation of 709 feet amsl, for example, LNAPL
U.S. Environmental Protection Agency March 2005 Office of Solid Waste and Emergency Response Technology Innovation and Field Services Division 32

BP Products North America, Inc., Former Refinery, Sugar Creek, MO
recovery was low (i.e., approximately 18 gallons a week on average). The Missouri River elevation, however, affected the recovery because the river stage was lower than the elevation of the groundwater pump and no groundwater gradient could be generated. For example, when the pump in recovery well R-007 was set at an elevation of 699 ft amsl the average LNAPL recovery increased to over 1000 gallons a week. Maintaining drawdown at an elevation of 699 ft. amsl is limited by the capacity of the groundwater recovery well pump capacity, available drawdown (i.e., the elevation of the bottom of the well), and the treatment system capacity. In June 2004, for example, higher-than-normal Missouri River elevations and limited treatment system capacity forced raising the pumps to an elevation of 709 ft. amsl. In September 2004, the pump in R-007 was lowered back to an elevation of 699 ft. amsl.
5.2 MULTI-PHASE EXTRACTION SYSTEM
Multi-phase extraction is a remediation process that applies a high vacuum (i.e., 26-inches of mercury) to wells or extraction points to remove LNAPL, impacted groundwater, and vapor from subsurface soil. From January 2001 to April 2001, the multi-phase extraction system was cycled on six extraction points (SC-14, SC 15, SC-16, SC-24, SC-25, and MW-078). From April 2001 to January 2003, the multi-phase extraction system operated full-time on well MW-078. In January 2003, due to the asymptotic and low LNAPL recovery, the system was shut off. Initially, LNAPL was periodically recovered from six wells and piezometers: MW-078, SC-14, SC-15, SC-16, SC-24 and SC-25. Multi-phase extraction operations cycled for 15 minutes on three well pairs, and then the system shutdown for 15 minutes every hour.
Collected groundwater was treated and discharged to the city of Independence POTW. LNAPL was transferred to Tank 95R for eventual recycling off site at an approved facility. Overall, application of a high-vacuum multi-phase extraction system successfully recovered LNAPL to the practicable limit of its technology.
5.2.1 Multi-Phase Extraction System Performance
During its two-year operation, the Crawford multi-phase extraction system recovered a total of 151 gallons of LNAPL and 215,000 gallons of groundwater. The total groundwater to LNAPL recovered ratio for the multi-phase extraction system was 1,430:1. Performance monitoring data for the Crawford multi-phase extraction system and LNAPL recovery over time for 2001 and 2002 is shown on Figure 13. During the calendar year 2001, approximately 148 gallons of LNAPL were recovered from the multi-phase extraction system. However, LNAPL recovery reached an asymptote after a few months of operation, and only 2.5 gallons of additional LNAPL was recovered from the multi-phase extraction system in 2002. Overall, the multi-phase extraction system was not effective at removing any addition LNAPL from the area and the system was shutdown on January 3, 2003.
U.S. Environmental Protection Agency March 2005 Office of Solid Waste and Emergency Response Technology Innovation and Field Services Division 33

250
BP Products North America, Inc., Former Refinery, Sugar Creek, MO
Figure 13. Actual Multi-Phase Extraction LNAPL Recovery Compared to API Model Results (RETEC, 2004b)
LNA
PL R
ecov
ered
(gal
)
200
150
100
50
0
13-Jan-01 13-Apr-01 12-Jul-01 10-Oct-01 8-Jan-02 8-Apr-02 7-Jul-02 5-Oct-02 3-Jan-03 3-Apr-03 2-Jul-03
April
May 22, 2001 System Begins Continuous Operation
Oct 2 to 25 June 19-20
10 to 25 System off for Pulse
- System Down Model (15 ft case) LNAPL Recovered (gal)
5.2.2 Multi-Phase Extraction System Costs
The following capital costs were estimated for the multi-phase extraction system:
Table 14. Multi-Phase Extract System Estimated Capital Costs
Capital Costs Well Installation $ 10,000 Pilot Test/Design $ 10,000 MPE Equipment $ 53,000 Startup/Shakedown $ 15,000
Total Capital = $ 88,000 NPV = $ 101,478
U.S. Environmental Protection Agency March 2005 Office of Solid Waste and Emergency Response Technology Innovation and Field Services Division 34

BP Products North America, Inc., Former Refinery, Sugar Creek, MO
In addition, the following O&M costs were estimated for the multi-phase extraction system:
Table 15. Multi-Phase Extraction System Estimated O&M Costs
O&M Costs 2001 O&M $ 36,000 2002 O&M $ 36,000
Total O&M = $ 72,000 NPV = $ 81,575
Notes: Annual O&M costs include labor, electricity, replacement materials. NPV = Net Present Value at a 3.5 percent discount rate
Accounting for inflation, the multi-phase extraction system had a capital cost ($101,478) and O&M cost ($81,575) equal to a total cost of $183,053. Assuming a total of 151 gallons of LNAPL have been recovered to date, the cost per gallon to recover LNAPL using multi-phase extraction is estimated at $1,212 per gallon.
5.2.3 Multi-Phase Extraction System Observations and Lessons Learned
Although the multi-phase extraction system reached its remediation goal (i.e., the practicable limit of LNAPL recovery), the lack of significant LNAPL recovery confirmed that it is not effective at removing LNAPL in areas of limited LNAPL saturation because of the low permeability of the silty loess soils, the low percentage of LNAPL saturation (maximum of 1.4 percent), and discontinuous nature of LNAPL in the subsurface. Even with high-vacuum enhancement (i.e., 26-inches of mercury vacuum), the system was only able to recover 148 gallons of LNAPL in the first year, and only 2.5 gallons in the second year. The total LNAPL recovery amounted to less than 10-percent of the original estimated in-place LNAPL volume, with indicates that the majority of the LNAPL is unrecoverable by vacuum enhanced extraction and not recoverable via in-situ technologies.
After LNAPL removal via multi-phase extraction reached an asymptote, the system was shutdown. Within months after shutdown additional LNAPL accumulated in wells adjacent to Sugar Creek over time, indicating a potential for LNAPL seeps in Sugar Creek. Therefore, an alternative remediation system was installed to control and contain LNAPL seeps. In 2003, a series of hydraulic control pumps were installed adjacent to Sugar Creek to reverse the hydraulic gradient and mitigate the seeps.
5.3 COMPARISON OF DUAL-PUMP RECOVERY TO MULTI-PHASE EXTRACTION
Dual-pump recovery has over 20 years of operational history and performance monitoring at the site, recovering 1.9 million gallons of LNAPL over that time. The continuing success of dual-pump LNAPL recovery, with 79,500 gallons of LNAPL recovered in 2004, underscores its longevity and effectiveness as a source removal technology at the former refinery site. However, multi-phase extraction was less successful, removing only 151 gallons of LNAPL over two years. The groundwater/LNAPL recovery ratio of the dual-pump recovery system (109:1) is also much more effective than the multi-phase extraction system (1,430:1).
It should be noted that dual-pump recovery is not expected to be more effective in fine-grained soils than multi-phase extraction, based on lower permeability soils and lower groundwater recovery rates. However, it was determined that a hydraulic control submersible pump could achieve the protection goal of no LNAPL seeps to Sugar Creek at lower O&M and capital costs. Due to the fine-grained (i.e., silt and clay) soils at the site, multi-phase extraction was determined to not be an effective LNAPL remediation technology.
U.S. Environmental Protection Agency March 2005 Office of Solid Waste and Emergency Response Technology Innovation and Field Services Division 35

BP Products North America, Inc., Former Refinery, Sugar Creek, MO
5.4 TECHNOLOGY PERFORMANCE AND COST
5.4.1 Meeting Protection Goals and Endpoints
Overall the dual-pump recovery system has recovered significant quantities of LNAPL compared to multi-phase extraction, although the initial source LNAPL volume estimate was orders of magnitude greater in the dual-pump recovery area (1,700 gallons compared to 3.4 million gallons). The dual-pump recovery system has recovered 1.899 million gallons of LNAPL to date and is model-predicted to recover an additional 321,900 gallons of the remaining 1.1 million gallons over the next six years. The LNAPL recovery has been corrected for small amounts of water recovered through the LNAPL skimming pumps which is removed from Tank 95R. In addition, centrifuge tests performed on samples of the recovered LNAPL from the recovery well skimmer pumps and Tank 95R do not show any entrained or emulsified water in the recovered LNAPL. Therefore, BP has high confidence in the total recovered quantity of LNAPL (1.9 million gallons).
Overall, the dual pump recovery system is expected to recover a total of 2.25 million gallons of LNAPL, which is equal to 67-percent of the estimated LNAPL source volume within the recovery wells radius of capture, based on the API Model-estimated LNAPL specific thickness over the plume area (3.34 million gallons). The percent recovery of the initial LNAPL spill volume is unknown, due to lack of spill data, and does not take into account additional LNAPL in the unsaturated zone, smear zone or outside each recovery well’s radius of capture. By comparison, the total LNAPL recovery for the multi-phase extraction system accounted for less than 10-percent of the original estimated in-place LNAPL volume.
For the dual-pump recovery system, predicting remediation lifespan and time to reach endpoints was done using the API Distribution and Recovery Model. Modeling results suggest that the remaining LNAPL may be close to residual saturation and effectively immobile in the subsurface after 6 to 10 years of additional dual-pump recovery. When recovery data indicates that the system reaches an asymptote and a point of diminishing returns for dual-pump LNAPL recovery, the recovery wells will be transitioned to LNAPL skimming wells and LNAPL recovery will take place using the site vacuum truck. The frequency and duration of vacuum truck events will be determined at that time.
The multi-phase extraction system met its shutdown criteria (i.e., asymptotic LNAPL recovery) after two years of operation, through asymptotic LNAPL recovery (e.g., the system was only able to recover 2.5 gallons of LNAPL over the calendar year 2002). To meet the additional protection goal of no LNAPL seeps to Sugar Creek, hydraulic control pumps were installed in 4-inch diameter monitoring wells adjacent to the creek to reverse the hydraulic gradient away from the creek. Overall the hydraulic control pump requires less maintenance and oversight. The hydraulic control system has been successful at reversing the gradient and the short term protection goals for the Crawford Area have been met (RETEC, 2004b).
5.4.2 Cost per Gallon of LNAPL Removed
Although the total cost of the dual-pump recovery system ($3,554,349) was much greater than the cost of the Crawford multi-phase extraction system ($183,053), the normalized cost per gallon to recover LNAPL from the Lower Refinery Area ($1.87 per gallon) was significantly less than the Crawford Area ($1,212). The cost performance indicates that LNAPL is much more effectively recovered from higher-permeability sand and gravel than low-permeability silt and clay.
U.S. Environmental Protection Agency March 2005 Office of Solid Waste and Emergency Response Technology Innovation and Field Services Division 36

BP Products North America, Inc., Former Refinery, Sugar Creek, MO
6.0 OBSERVATIONS AND LESSONS LEARNED
The purpose of this evaluation was to provide a comprehensive evaluation of the cost and performance of the multi-phase extraction system and dual-pump recovery system, and show how soil type can have a considerable effect of LNAPL recovery, cost and performance. Lessons learned are also discussed herein.
Based on this case study, the following observations are made regarding the dual-pump recovery system:
• The dual-pump recovery system has collectively recovered approximately 1.899 million gallons of LNAPL and over 200 million gallons of groundwater from 1982 through 2004.
• The measured LNAPL thickness has significantly reduced over time (i.e., average of 83 percent) in each observation well in the vicinity of the recovery well network. The decreasing trend of measured LNAPL thickness in the observation wells suggests that the system is successfully removing LNAPL at the former refinery.
• If groundwater drawdown in a recovery well is maintained at a consistent level below the Missouri River stage, LNAPL recovery is proportional to the river stage. This is due to the increased groundwater gradient created by higher river stages. Since the river stage changes seasonally, changes in LNAPL recovery are anticipated and the system adjusted accordingly to increase LNAPL recovery rates.
• Groundwater drawdown is necessary to optimize LNAPL recovery in a dual-pump system. However, excessive groundwater drawdown will lead to increased groundwater disposal costs. Thus, groundwater pumping rates at each recovery well were evaluated to determine the optimal rate and level for each recovery well to ensure efficient operation of the system.
• Constant drawdown minimizes maintenance of the system and does not appear to negatively impact LNAPL recovery. Constant drawdown also allows personnel to more readily determine if a well and/or its equipment are not functioning properly during routine data review. Recovery wells are operated to create the optimal groundwater drawdown to maximize LNAPL recovery.
• The API Distribution and Recovery Model predicted six to ten more years of dual-phase pumping before asymptotic rates of LNAPL recovery are achieved, although actual shutdown will be based on empirical LNAPL recovery data. At that time, recovery wells will be transitioned to skimming wells using the site’s vacuum truck.
• The estimated total capital cost ($1,258,514) and O&M cost ($2,295,835) for the dual-pump recovery system, accounting for inflation, is equal to $3,554,349. The cost to recover 1.899 million gallons of LNAPL using dual-pump recovery is approximately $1.87 per gallon.
• The dual-pump recovery system should continue to operate under current conditions because it still meets the objective of LNAPL recovery and source removal. The system recovered 79,500 gallons of LNAPL in 2004.
As determined from this evaluation, the dual-pump recovery system is operating effectively, recovering significant quantities of LNAPL, and making progress toward achieving LNAPL remediation goals and long-term protection goals and endpoints.
U.S. Environmental Protection Agency March 2005 Office of Solid Waste and Emergency Response Technology Innovation and Field Services Division 37

BP Products North America, Inc., Former Refinery, Sugar Creek, MO
The following conclusions were made regarding the multi-phase extraction system:
• Based on the soil type in the Crawford Area (silt loess), a multi-phase extraction system was required to remove LNAPL and groundwater from the subsurface.
• During its two-year operation, the Crawford multi-phase extraction system operated at 26-inches of mercury vacuum and only recovered 151 gallons of LNAPL and 215,000 gallons of groundwater. During the calendar year 2002, the system only recovered 2.5 gallons of LNAPL. The system reached an asymptote of impractical LNAPL recovery and was shut down on January 3, 2003.
• Cycling had little to no effect on increasing LNAPL recovery rates from multiple multi-phase extraction wells, and the system was switched to full-time operation on one extraction well.
• Application of a high-vacuum multi-phase extraction system successfully recovered LNAPL from low-permeability soils over a short period of time, and the system met its LNAPL remediation goal of asymptotic recovery. However, the system was unable to extract all recoverable LNAPL and eliminate potential seeps to Sugar Creek. At that time, an alternative more cost-effective remediation system (i.e., hydraulic control pumping) was implemented to control LNAPL seeps.
• The multi-phase extraction system had a capital cost ($101,478) and O&M cost ($81,575) equal to a total cost of $183,053. The cost to recover total of 151 gallons of LNAPL using multi-phase extraction is approximately $1,212 per gallon.
The comparison of the two systems provides the following key conclusions and recommendations:
• Measured LNAPL thickness in a monitoring well does not necessarily correspond to the actual amount of LNAPL in the subsurface. To determine accurate estimates of LNAPL volume in the subsurface, soil cores and LNAPL saturations need to be quantitatively analyzed by a specialized laboratory. Initial estimates of LNAPL volume and soil type will greatly influence remediation technology selection, recovery performance, remediation goals and endpoints.
• Site soil characteristics should be considered before implementing remediation technologies, and in the prioritization of remediation efforts at a site. Overall, the permeability and grain size of soils can greatly influence the distribution and recoverability of LNAPL at a site.
• The groundwater/LNAPL recovery ratio of the dual-pump recovery system (109:1) is more effective than the multi-phase extraction system (1,430:1), because LNAPL recovery and source removal is significantly more technically feasible in coarser grained materials, such as sands, irrespective of the remediation technology. Although dual-pump recovery proves to be continually effective at recovering LNAPL from sand, it is not expected to be an appropriate technology for LNAPL recovery in silts and clays.
• The dual-pump recovery system recovered 1.899 million gallons of LNAPL to date and is predicted to recover an additional 321,900 gallons of the remaining estimated in-place volume of 1.1 million gallons. Overall, the dual pump recovery system is expected to recover a total 2.25 million gallons of LNAPL, which is equal to approximately 67-percent of the estimated LNAPL source volume, based on the API Model-estimated LNAPL
U.S. Environmental Protection Agency March 2005 Office of Solid Waste and Emergency Response Technology Innovation and Field Services Division 38

BP Products North America, Inc., Former Refinery, Sugar Creek, MO
specific thickness over the plume area (3.34 million gallons). The percent recovery of the initial LNAPL spill volume is unknown, due to lack of spill data, and does not take into account additional LNAPL in the unsaturated zone, smear zone or outside each recovery well’s radius of capture. By comparison, the total LNAPL recovery for the multi-phase extraction system accounted for less than 10-percent of the original estimated in-place LNAPL volume.
• At the Sugar Creek site, LNAPL recovery using dual-pump recovery in coarser grained materials, had a cost per gallon differential of almost three orders of magnitude (i.e., $1,212 per gallon for multi-phase extraction, compared to only $1.87 per gallon for dual-pump recovery). Although the capital and O&M cost of the dual-pump recovery system is greater than the multi-phase extraction system, the cost effectiveness for LNAPL source removal using dual-pump wells in sand is much greater than multi-phase extraction in silt/clay.
• Although multi-phase extraction is believed to be the most effective and demonstrated technology to remediate LNAPL from silt and clay, it was not effective for Crawford Area at the former refinery. The dual-pump recovery network was not a viable alternative in silt and clay soils at the Crawford Area. Therefore, alternative remediation and protection goals such as LNAPL source control and containment in silt and clay soils may be more appropriate rather than LNAPL source reduction.
Overall, protection goals and LNAPL endpoints for remediation at large-scale RCRA sites must reflect the technical limitations of remediation technologies applied in each soil type and the LNAPL distribution in the subsurface, with appropriate performance expectations, remediation timeframes, and shutdown criteria. The case study demonstrates that LNAPL source reduction and recovery is a viable remediation goal in sands whereas LNAPL source control and containment may be more attainable in silts and clays. However, site-specific factors must be considered in the design and implementation of any in-situ remediation system for LNAPL source reduction.
U.S. Environmental Protection Agency March 2005 Office of Solid Waste and Emergency Response Technology Innovation and Field Services Division 39

BP Products North America, Inc., Former Refinery, Sugar Creek, MO
This page is intentionally left blank.
U.S. Environmental Protection Agency March 2005 Office of Solid Waste and Emergency Response Technology Innovation and Field Services Division 40

BP Products North America, Inc., Former Refinery, Sugar Creek, MO
7.0 REFERENCES
Adamski, M., V. Kremesec, R. Kolhatkar, C. Pearson, and B. Rowan, 2001. “LNAPL Saturation, Distribution, and Recovery in Fine Grained Soils,” Proceedings of the Petroleum Hydrocarbons and Organic Chemicals in Ground Water Conference and Exposition, pp.178–192. November 14–16, 2001.
Ballestero, T.P., Fiedler, F.R., and Kinner, N.E., 1994, An Investigation of the Relationship Between Actual and Apparent Gasoline Thickness in a Uniform Sand Aquifer, Ground Water, v. 32, no. 5, pp. 708-718
BP Products North America, Inc., (1989-2004). Quarterly Progress Reports, Amoco Oil Company Former Refinery, Sugar Creek, Missouri, RCRA Docket No. VII-89-H-0028. Submitted quarterly.
Charbeneau, R.J., R.T. Johns, L.W. Lake, and M.J. McAdams, 1999. “Free-Product Recovery of Petroleum Hydrocarbon Liquid.” American Petroleum Institute, Publication No. 4682. Ground Water Monitoring & Remediation, 20(3), Summer, pp. 147-158. June 1999.
Charbeneau, R.J., 2003. “Models for Design of Free-Product Recovery Systems for Petroleum Hydrocarbon Liquids.” American Petroleum Institute. www.api.org/lnapl
RETEC, 2002. Lower Refinery Recovery Well System Evaluation, Amoco Former Refinery, Sugar Creek, Missouri. The RETEC Group, Inc. Draft, October 4, 2002.
RETEC, 2004a. Volume 9 – Lower Refinery RCRA Facility Investigation Report, Revision 1, Amoco Former Refinery, Sugar Creek, Missouri. The RETEC Group, Inc. January 30, 2004.
RETEC, 2004b. Corrective Measures Study for the Crawford and Sugar Creek Area, Revision 2, Amoco Former Refinery, Sugar Creek, Missouri. The RETEC Group, Inc. March 8, 2004.
RETEC, 2004c. Annual Interim Measures Performance Monitoring Summary, 2003, Amoco Former Refinery, Sugar Creek, Missouri. Golden, CO: The RETEC Group, Inc. March 24, 2004.
RETEC, 2004d. Corrective Measures Study for the Lower Refinery Area, Amoco Former Refinery, Sugar Creek, Missouri. The RETEC Group, Inc. pending November 5, 2004.
ThermoRetec, 2000. Interim Measures Work Plan, Sugar Creek. Amoco Oil Company, Former Refinery, Sugar Creek Missouri. January 24, 2000.
U.S. EPA. 1996. OSWER Ecotox Thresholds, Eco Update 32, EPA 540/F 95/038. Tier II Secondary Chronic Value from Suter and Tsao. United States Environmental Protection Agency. 1996.
U.S. EPA, 2002. Human Health Environmental Indicator Determination, Interim Final – RCRA Environmental Indicator (EI) RCRIS code (CA725). Amoco Sugar Creek former refinery. Facility ID #MOD007161425. October 3, 2002.
U.S. Environmental Protection Agency March 2005 Office of Solid Waste and Emergency Response Technology Innovation and Field Services Division 41

BP Products North America, Inc., Former Refinery, Sugar Creek, MO
U.S. EPA, 2004. Issuance of the Groundwater Environmental Indicator for BP Sugar Creek – RCRA Environmental Indicator (EI) RCRIS code (CA750). Amoco Sugar Creek former refinery. Facility ID #MOD007161425. March 1, 2004.
U.S. EPA, 2004. Handbook of Groundwater Protection and Cleanup Policies for RCRA Corrective Action, for Facilities Subject to Corrective Action Under Subtitle C of the Resource Conservation Recovery Act. EPA/530/R-01/015. United States Environmental Protection Agency, Office of Solid Waste and Emergency Response. April 2004.
Woodward-Clyde, (1987). Refinery-Wide Geology, Hydrology, and Groundwater Investigation, Amoco Oil Company, Sugar Creek former refinery, Sugar Creek, Missouri. May 29, 1987.
Woodward-Clyde, (1989). Interim Measures Work Plan, Amoco Oil Company, Former Refinery, Sugar Creek, Missouri. Amended November 3, 1989.
U.S. Environmental Protection Agency March 2005 Office of Solid Waste and Emergency Response Technology Innovation and Field Services Division 42

BP Products North America, Inc., Former Refinery, Sugar Creek, MO
8.0 SITE CONTACTS
BP Sugar Creek Site Contact: Lloyd DunlapBP Products North America, Inc. 1000 N. Sterling Road Sugar Creek, MO 64054 (816) 836-6044 Email: [email protected]
Technology System and Remediation Design Contact:Christopher J. Pearson, P.E. The RETEC Group, Inc. 1726 Cole Boulevard Building 22, Suite 150 Golden, CO 80401 (303) 271-2100 E-mail: [email protected]
EPA Regulatory Contact: Robert E. Aston Project Manager U.S. EPA Region 7 (913) 551-7392 E-mail: [email protected]
State Regulatory Contact: Brian McCurren Project Manager Missouri Department of Natural Resources (573) 751-4130 Email: [email protected]
U.S. Environmental Protection Agency March 2005 Office of Solid Waste and Emergency Response Technology Innovation and Field Services Division 43

BP Products North America, Inc., Former Refinery, Sugar Creek, MO
9.0 ACKNOWLEDGEMENTS
This report was prepared for the U.S. Environmental Protection Agency's Office of Solid Waste and Emergency Response, Office of Superfund Remediation and Technology Innovation. Assistance was provided by The RETEC Group, inc.
U.S. Environmental Protection Agency March 2005 Office of Solid Waste and Emergency Response Technology Innovation and Field Services Division 44