Cortical regions supporting reading comprehension skill ...
12
Contents lists available at ScienceDirect Brain and Language journal homepage: www.elsevier.com/locate/b&l Cortical regions supporting reading comprehension skill for single words and discourse K. Ryherd a,b,e , K. Jasinska g,b , J.A. Van Dyke b,e , Y.-H. Hung b , E. Baron b , W.E. Mencl b,f , J. Zevin b,d , N. Landi a,b,c,e, ⁎ a Department of Psychological Sciences, University of Connecticut, Storrs, CT, United States b Haskins Laboratories, New Haven, CT, United States c Yale Child Study Center, Yale University, New Haven, CT, United States d Departments of Psychology and Linguistics, University of Southern California, Los Angeles, CA, United States e CT Institute for the Brain and Cognitive Sciences, Storrs, CT, United States f Department of Linguistics, Yale University, New Haven, CT, United States g Department of Linguistics and Cognitive Science, University of Delaware, United States ARTICLE INFO Keywords: Reading comprehension fMRI Modality Processing level Partial Least Squares Correlation (PLSC) Naturalistic design ABSTRACT A substantial amount of variation in reading comprehension skill is explained by listening comprehension skill, suggesting tight links between printed and spoken discourse processing. In addition, both word level (e.g., vocabulary) and discourse–level sub-skills (e.g., inference-making) support overall comprehension. However, while these contributions to variation in comprehension skill have been well-studied behaviorally, the under- lying neurobiological basis of these relationships is less well understood. In order to examine the neural bases of individual differences in reading comprehension as a function of input modality and processing level, we ex- amined functional neural activation to both spoken and printed single words and passages in adolescents with a range of comprehension skill. Data driven Partial Least Squares Correlation (PLSC) analyses revealed that comprehension skill was positively related to activation in a number of regions associated with discourse comprehension and negatively related to activation in regions associated with executive function and memory across processing levels and input modalities. 1. Introduction While the contributors to variation in reading comprehension ability in both children and adults have been well-studied behaviorally, the underlying neurobiological basis of this variation is less well un- derstood. Progress in this area has been hindered by a reliance on off- line measures of reading comprehension, such as standardized assess- ments or comprehension questions, which do not support the investigation of comprehension processes as they unfold. In addition, such measures likely recruit other strategic test-taking or problem sol- ving skills which may not be intrinsic to comprehension processes themselves. The current study addresses this gap by tracking neural activity (BOLD signal) during natural text comprehension in a task-free environment so that task processing demands cannot artificially drive relations among the dimensions of interest. Research on variability in reading comprehension skill has been heavily influenced by the Simple View of Reading (Gough & Tunmer, 1986), which suggests that reading comprehension is the product of decoding (word and non-word reading) and listening comprehension. Indeed, regression models testing the Simple View have been found to account for as much as 77% of variance in reading comprehension (e.g., Adlof, Catts, & Little, 2006; Braze, Tabor, Shankweiler, & Mencl, 2007; García & Cain, 2014; Joshi, Ji, Breznitz, Amiel, & Yulia, 2015; Sparks & Patton, 2016; Tunmer & Chapman, 2012). A natural extension of this view is the notion that once word decoding is mastered, reading com- prehension ability will be solely determined by an individual’s oral language ability (i.e., listening comprehension). This is consistent with high correlations observed between reading and oral language com- prehension (r = .50–.75; Braze et al., 2007; Diakidoy, Stylianou, Karefillidou, & Papageorgiou, 2005; Tighe & Schatschneider, 2014; Tunmer & Chapman, 2012; Wise, Sevcik, Morris, Lovett, & Wolf, 2007). A wealth of behavioral evidence supports this approach. To begin with, listening comprehension has a strong influence on reading com- prehension ability throughout development (Hogan, Adlof, & Alonzo, https://doi.org/10.1016/j.bandl.2018.08.001 Received 30 May 2017; Received in revised form 16 July 2018; Accepted 2 August 2018 ⁎ Corresponding author at: Department of Psychological Sciences, University of Connecticut, Director of EEG Research, Haskins Laboratories, United States. E-mail address: [email protected] (N. Landi). Brain and Language 186 (2018) 32–43 Available online 11 September 2018 0093-934X/ © 2018 Elsevier Inc. All rights reserved. T
Transcript of Cortical regions supporting reading comprehension skill ...

Contents lists available at ScienceDirect
Brain and Language
journal homepage: www.elsevier.com/locate/b&l
Cortical regions supporting reading comprehension skill for single wordsand discourseK. Ryherda,b,e, K. Jasinskag,b, J.A. Van Dykeb,e, Y.-H. Hungb, E. Baronb, W.E. Menclb,f, J. Zevinb,d,N. Landia,b,c,e,⁎
a Department of Psychological Sciences, University of Connecticut, Storrs, CT, United StatesbHaskins Laboratories, New Haven, CT, United Statesc Yale Child Study Center, Yale University, New Haven, CT, United StatesdDepartments of Psychology and Linguistics, University of Southern California, Los Angeles, CA, United Statese CT Institute for the Brain and Cognitive Sciences, Storrs, CT, United StatesfDepartment of Linguistics, Yale University, New Haven, CT, United Statesg Department of Linguistics and Cognitive Science, University of Delaware, United States
A R T I C L E I N F O
Keywords:Reading comprehensionfMRIModalityProcessing levelPartial Least Squares Correlation (PLSC)Naturalistic design
A B S T R A C T
A substantial amount of variation in reading comprehension skill is explained by listening comprehension skill,suggesting tight links between printed and spoken discourse processing. In addition, both word level (e.g.,vocabulary) and discourse–level sub-skills (e.g., inference-making) support overall comprehension. However,while these contributions to variation in comprehension skill have been well-studied behaviorally, the under-lying neurobiological basis of these relationships is less well understood. In order to examine the neural bases ofindividual differences in reading comprehension as a function of input modality and processing level, we ex-amined functional neural activation to both spoken and printed single words and passages in adolescents with arange of comprehension skill. Data driven Partial Least Squares Correlation (PLSC) analyses revealed thatcomprehension skill was positively related to activation in a number of regions associated with discoursecomprehension and negatively related to activation in regions associated with executive function and memoryacross processing levels and input modalities.
1. Introduction
While the contributors to variation in reading comprehensionability in both children and adults have been well-studied behaviorally,the underlying neurobiological basis of this variation is less well un-derstood. Progress in this area has been hindered by a reliance on off-line measures of reading comprehension, such as standardized assess-ments or comprehension questions, which do not support theinvestigation of comprehension processes as they unfold. In addition,such measures likely recruit other strategic test-taking or problem sol-ving skills which may not be intrinsic to comprehension processesthemselves. The current study addresses this gap by tracking neuralactivity (BOLD signal) during natural text comprehension in a task-freeenvironment so that task processing demands cannot artificially driverelations among the dimensions of interest.
Research on variability in reading comprehension skill has beenheavily influenced by the Simple View of Reading (Gough & Tunmer,
1986), which suggests that reading comprehension is the product ofdecoding (word and non-word reading) and listening comprehension.Indeed, regression models testing the Simple View have been found toaccount for as much as 77% of variance in reading comprehension (e.g.,Adlof, Catts, & Little, 2006; Braze, Tabor, Shankweiler, & Mencl, 2007;García & Cain, 2014; Joshi, Ji, Breznitz, Amiel, & Yulia, 2015; Sparks &Patton, 2016; Tunmer & Chapman, 2012). A natural extension of thisview is the notion that once word decoding is mastered, reading com-prehension ability will be solely determined by an individual’s orallanguage ability (i.e., listening comprehension). This is consistent withhigh correlations observed between reading and oral language com-prehension (r= .50–.75; Braze et al., 2007; Diakidoy, Stylianou,Karefillidou, & Papageorgiou, 2005; Tighe & Schatschneider, 2014;Tunmer & Chapman, 2012; Wise, Sevcik, Morris, Lovett, & Wolf, 2007).
A wealth of behavioral evidence supports this approach. To beginwith, listening comprehension has a strong influence on reading com-prehension ability throughout development (Hogan, Adlof, & Alonzo,
https://doi.org/10.1016/j.bandl.2018.08.001Received 30 May 2017; Received in revised form 16 July 2018; Accepted 2 August 2018
⁎ Corresponding author at: Department of Psychological Sciences, University of Connecticut, Director of EEG Research, Haskins Laboratories, United States.E-mail address: [email protected] (N. Landi).
Brain and Language 186 (2018) 32–43
Available online 11 September 20180093-934X/ © 2018 Elsevier Inc. All rights reserved.
T

2014). It is related to reading comprehension over and above readingfluency in first grade, a time when word reading skill is still developing(Kim, Park, & Wagner, 2014). Reading and listening comprehension arehighly correlated and the skills important for both are largely over-lapping (Adams, Bourke, & Willis, 1999; Verhoeven & van Leeuwe,2008). These include both word-level processing skills (phonologicaland lexical-semantic processing) and higher-level linguistic skills suchas word-to-text integration, parsing, and inference making (Babayigit &Stainthorp, 2014; Diakidoy, et al., 2005). In addition, a few studiessuggest that functional activation during comprehension is largelymodality-independent, especially for complex sentences or passages(Braze et al., 2011; Constable et al., 2004). Despite these findings, therehas only been one exploration of the relationship between readingcomprehension skill and neural activation as a function of processingmodality (spoken versus printed).
Shankweiler et al. (2008) examined how activation during listeningand reading comprehension relates to many different reading-relatedskills. Their participants listened to or read sentences in the scanner.They found that convergence in activation across modalities increasedwith reading comprehension skill in dorsal IFG, such that more-skilledcomprehenders showed similar activation while reading and listeningwhile less-skilled comprehenders showed more modality-specific acti-vation in this region. This effect persisted even after taking into accountindividual differences in listening comprehension, decoding, and vo-cabulary. However, another goal of this study was to investigate effectsrelated to processing syntactically and pragmatically anomalous sen-tences. Thus, the stimuli were somewhat artificial in nature. In thepresent study, we seek to replicate and extend this study by examininghow reading comprehension skill relates to neural activation duringcomprehension of naturalistic spoken and printed texts.
An important component in any such investigation is examining themultiple different levels at which variation may occur. Many skills atmultiple levels of processing contribute to reading comprehensionability. For example, decoding skill often explains significant variancein reading comprehension ability, especially in young readers(Kendeou, van den Broek, White, & Lynch, 2009; Perfetti & Hogaboam,1975). However, even after decoding has been taken into account,many other skills make significant contributions to reading compre-hension ability. These include other word-level abilities, such as voca-bulary (Braze et al., 2007; Cain & Oakhill, 2014) and morphosyntax(Chik, man, Ho, C. S. han, Yeung, P. sze, Wong, Y. kai, Chan, D. W. ock,Chung, K. K. hoa, & Lo, L. yan. , 2012) as well as higher-level anddomain-general skills such as inference-making (Cain, Oakhill, &Bryant, 2004) and executive function (Sesma, Mahone, Levine, Eason, &Cutting, 2009). These skills each account for unique variance in readingcomprehension across the distribution of comprehension ability(Language and Reading Research Consortium, & Logan, 2017), sug-gesting that individual differences in reading comprehension could berelated to processing ability at any or all of these different levels.Consequently, the goal of the current study is twofold. First, we seek toidentify common and distinct neural bases for comprehension acrossmodalities (speech versus print) and processing levels (single words vs.passages). Second, we explore how individual differences in readingcomprehension (measured offline) are associated with activation as afunction of these processing levels and modalities.
Multiple regions support passage comprehension. Comparisons oftext comprehension to rest, a simple perceptual baseline, or to un-connected text (e.g., word lists) most consistently show activation inbilateral middle and superior temporal gyri (MTG/STG) and bilateralanterior temporal lobe (ATL) across studies (Ferstl, Neumann, Bogler, &von Cramon, 2008). A meta-analysis of studies looking at semantic andsyntactic comprehension in spoken and written tasks found that studiesmost often showed activation in regions in and around the left inferiorfrontal gyrus (IFG), including pars opercularis, pars triangularis, andprecentral gyrus, This study also found activation in left MTG extendinginto the left STG (Rodd, Vitello, Woollams, & Adank, 2015). These two
meta-analyses indicate that comprehension across modalities includestemporal and frontal regions, with text comprehension showing morebilateral activation.
Similarly, recent meta-analyses indicate overlapping regions forcomprehension of language across processing levels. Houdé et al.,(2010) conducted a meta-analysis on 16 studies where participantscompleted a variety of reading-related tasks at various levels of pro-cessing while in the scanner. These studies revealed many regionsconsistently activated during reading in the left frontal, temporopar-ietal, and occipitotemporal regions. Specifically, the putative VisualWord Form Area (VWFA) in left occipitotemporal (OT) cortex wasconsistently activated across all studies. In addition, IFG and precentralgyrus were implicated. Regions in the inferior, middle, and superiortemporal gyri as well as inferior parietal gyrus show consistent acti-vation, as does a cluster in bilateral supplementary motor area (SMA). Alater meta-analysis looking at activation during various reading tasks atthe word and sentence levels in both adults and children showed similarconsistency in patterns of activation (Martin, Schurz, Kronbichler, &Richlan, 2015). Studies of both adults and children exhibited con-vergent activation in left OT, left IFG (specifically pars opercularis andpars triangularis), bilateral SMA, and left posterior parietal cortex.Temporal activation was seen more in children than adults, specificallyin STG. Adults showed more convergence than children in left frontalregions, left middle occipital gyrus, cerebellum, and ventral OT. Theseresults indicate that word and sentence/passage reading involves acti-vation in left OT, left IFG, bilateral SMA, and left posterior parietalcortex.
Despite the wealth of behavioral studies investigating individualdifferences in reading comprehension and recent studies looking at theneural bases of comprehension, relatively few studies have explored theneural bases of individual differences in reading comprehension skill.However, some existing work supports the view that variation inspoken language processing skill and variation in reading comprehen-sion skill are linked at the neurological level. For example, amount ofactivation in regions that have been associated with language proces-sing (e.g., IFG, STG, MTG) during both listening and reading compre-hension tasks is related to overall reading comprehension ability. Inparticular, reading comprehension skill has been shown to be related toprint-speech activation overlap in IFG (Shankweiler et al., 2008). Ac-tivation during spoken narrative comprehension in left inferior frontalgyrus (IFG) is correlated with reading comprehension ability(Horowitz-Kraus, Vannest, & Holland, 2013). Reading comprehensionskill is also associated with activation in left middle and superiortemporal gyri (MTG/STG) during printed sentence and passage pro-cessing (Aboud, Bailey, Petrill, & Cutting, 2016; Van Ettinger-Veenstra,McAllister, Lundberg, Karlsson, & Engström, 2016; Yarkoni, Speer, &Zacks, 2008). These neural findings converge with behavioral resultsshowing great overlap between spoken and printed comprehension atthe passage level.
Studies of brain-behavior relationships for single word processinghave identified similar regions, suggesting that individual differences inreading comprehension skill similarly modulate neural activationacross the sentence, passage, and word levels. For example, one studyfound that reading comprehension is negatively related to activation inleft IFG and left fusiform gyrus when processing semantically-relatedprinted words (Malins et al., 2016). In addition, Welcome and Joanisse(2012) found that during word reading, activation in the left MTG isnegatively related to reading comprehension skill. Further, individualswith particularly poor reading comprehension despite typical decodingskill have been found to have atypical functional connectivity betweenIFG and parahippocampal regions during a lexical decision task(Cutting et al., 2013). Thus, across studies, the regions that link offlinereading comprehension skill and online single word and passage com-prehension are largely overlapping.
The studies summarized here implicate associations betweenreading comprehension skill and neural activation during both word
K. Ryherd et al. Brain and Language 186 (2018) 32–43
33

and passage processing in regions that are important for languageprocessing, but not specifically linked to reading. However, untanglingthe relationships between reading comprehension skill and activationacross processing level (word versus passage) and modality (speechversus print) currently requires cross-study comparisons. Only onestudy to date has directly compared activation for both single wordsand passages in relation to reading comprehension skill, and anotherhas compared input modalities in relation to reading comprehensionskill (Shankweiler et al., 2008). To address the first contrast, Aboudet al. (2016) found that connectivity was greater between left dorso-lateral prefrontal cortex (DLPFC; a region involved in executive func-tion) and left angular gyrus (AG; a key region for semantic processing)during passage relative to single word processing. This relationship wasstronger in more-skilled comprehenders. By directly comparing word-and passage-level processing, this approach revealed a tighter link be-tween executive and semantic regions for better comprehenders, spe-cifically for passage-level comprehension (Aboud et al., 2016). Thus,direct comparisons of processing level can show relationships that maynot be found by comparing across studies. The current research buildsupon this work by comparing processing levels as well as modalityusing a data-driven, whole-brain approach to compare activationmodulated by both modality and processing level in relation to readingcomprehension skill.
The goal of the current work is to determine whether individualdifferences in reading comprehension, listening comprehension, andword-level processing have a common neural basis. To address thisgoal, we use a naturalistic, task-free design to examine the relationshipbetween reading comprehension skill (assessed offline) and functionalneural activation to spoken and printed single words and passages.Naturalistic reading and story listening paradigms have recently beenadopted across a number of studies to explore the neural circuitry forcomprehension. These paradigms, and the analyses associated withthem, provide more ecological validity as well as the ability to probemultiple aspects of discourse without the need for highly constrainedcontrasting stimuli. Studies using naturalistic designs have been able toseparate regions responsible for semantic and syntactic processing(Wehbe et al., 2014) and to investigate the relationship between syn-tactic constructions and activation over time (Brennan, Stabler, VanWagenen, Luh, & Hale, 2016; Hale, Lutz, Luh, Brennan, & Arbor, 2015).Other studies have used naturalistic designs to investigate regions in-volved in strategy use during text reading (Moss & Schunn, 2015). Thus,naturalistic designs are ideal for revealing the relationship betweenneural activation during comprehension and individual differences inreading comprehension skill. One reason for this is that participants areable to engage in passage comprehension without unnatural breaks dueto task demands. Thus, our naturalistic and task-free passage task al-lows us to measure brain function that is as similar as possible to whatoccurs during passage comprehension in the real world. To complementour passage task, we developed a task-free single word processing task.Previous reports note that comparing word- and passage-level proces-sing across studies presents confounds due to differing task demands(Wang et al., 2015). Thus, our single word processing task is passiveand task-free to allow for the most valid comparison of processing levelbetween our passage and word processing tasks.
While our primary goal is to use a data-driven partial least squarescorrelation (PLSC) approach to identify common and distinct sets ofregions for these processes as well as their relations to reading com-prehension skill, we also test some specific hypotheses. First, givenstrong correlations between listening comprehension and readingcomprehension, we predict substantial overlap in activation for thesetwo processes regardless of reading comprehension skill. We expect tosee activation in frontal and temporal regions associated with passagecomprehension, including bilateral STG, MTG, and left IFG. Second, wepredict that reading comprehension skill will be associated with similarpatterns of activation for spoken and printed passages. We expect to seethat activation in STG, MTG, and IFG is related to reading
comprehension skill, indicating differential use of the regions typicallyassociated with passage-level processing as comprehension skill varies.Finally, given that individuals who struggle with reading comprehen-sion tend also to have word-level weaknesses in vocabulary and otherlexical-semantic processing tasks (e.g., semantic priming; Catts, Adlof,& Weismer, 2006; Nation & Snowling, 1999; Silva & Cain, 2015), wepredict that the relationship between comprehension skill and activa-tion will be similar for both single word and passage processing. Thus,we predict that activation will be related to reading comprehensionskill similarly for both single word and passage processing.
2. Methods
2.1. Participants
A total of 32 adolescent monolingual English participants were in-cluded in this study (M Age= 17, SD=1.62, range= 13.75–18.75, 14males, 72% right-handed). Six subjects not included in the final 32analyzed here had unusable fMRI data due to movement artifact, de-fined below. In accordance to the Yale University Human InvestigationCommittee, all participants over 18 gave informed consent. Writtenconsent of a parent or guardian was also provided for participantsunder 18.
2.2. Behavioral assessments of skill
Sensory testing confirmed that all participants had normal hearingand vision. Participants completed assessments of reading comprehen-sion, nonword decoding, and performance IQ. The Kaufman Test ofEducational Achievement Second Edition (KTEA-II) reading compre-hension test (Kaufman & Kaufman, 2004) was used as the primarymeasure of reading comprehension. This task assesses comprehensionas a whole and cannot differentiate between comprehension componentprocesses. Participants read short passages and answered comprehen-sion questions about them. The Word Attack (WA) subtest of theWoodcock-Johnson III (Woodcock, McGrew, Mather, & Schrank, 2001)was the measure of nonword decoding and the Wechsler AbbreviatedScale of Intelligence II (WASI; Wechsler & Hsiao-pin, 2011) provided ameasure of performance IQ.
In order to isolate variability in reading comprehension above andbeyond the influence of decoding or general cognitive ability, we ranonly participants with normal decoding ability (defined here as at orabove a standard score of 95 on WA) and normal cognitive function(defined here as at or above standard score of 80 on WASI). Our par-ticipants had a mean standardized reading comprehension score of105.3 (SD=18.91), ranging from 76 to 146. The distribution ofreading comprehension ability was normal, as confirmed by aD’Agostino normality test (omnibus χ2 = 3.21, p= .20). Mean de-coding skill was 108.3 (SD=9.02, range= 96–124). Finally, meanperformance IQ was 107.9 (SD=17.84, range= 81–142).
2.3. fMRI tasks
2.3.1. Passage taskParticipants completed a modified version of the story task de-
scribed in Wang et al. (2015). In the scanner, participants passivelyread or listened to four stories by Hans Christian Andersen across fourscan runs. We used unusual and relatively unpopular stories, chosen sothat participants would not have prior experience with them. Each runwas divided into blocks of printed and spoken conditions. During theprinted condition (PPass), story portions were presented phrase byphrase in the center of the screen. For the spoken condition (SPass),portions of the stories were narrated to the participants throughheadphones.
This experiment utilized a mini-block design paradigm. Each runlasted about 372 s and consisted of 6 blocks: 2 printed condition blocks,
K. Ryherd et al. Brain and Language 186 (2018) 32–43
34
2 spoken condition blocks, and 2 blocks of rest. Each block had a meanduration of 52 s. During PPass, each phrase was presented for 2 s, withan average of 96 phrases and 12 words per phrase. Each phrase ap-peared on the screen for 2000ms. The rate of presentation of the stimuliwithin SPass blocks was matched to the rate of presentation in PPass.Spoken stimuli were presented in a continuous speech stream.Presentation of PPass and SPass alternated within the story, such thatsome sentences were spoken and some were printed. The average wordfrequency in this task was 10.61 (log-transformed, Lund & Burgess,1996).
2.3.2. Word taskParticipants passively read or listened to four conditions of rapidly
presented visual and auditory stimuli. The conditions included printedreal words (PWord), printed false font tokens (FalseFont), spoken realwords (SWord), and vocoded spoken words (Vocod; stimulus details areprovided below).
An event-related design was used for this experiment. In each trial,subjects received a group of 4 different tokens from the same condition(tetrads), rapidly presented at a rate of 450ms per stimulus. There wasa jittered ITI of 4–7 s between trials, with occasional “null” trials up to13 s long. Participants received two runs of this task while in thescanner, for a total duration of 302 s. Each run had 12 trials of eachcondition randomly presented, for a total of 48 trials per run and 24trials per condition.
All stimuli in PWord and SWord were one-syllable medium- to high-frequency words. Word frequency was established by the EnglishLexicon Project (Balota et al., 2007). Average word frequency was10.59 (log-transformed; Lund & Burgess, 1996). There was no sig-nificant difference in log-transformed word frequency between thePassage and Word task, t(653) = 0.14, p= .88. FalseFont stimuli werereal words presented using the Wingdings typeface, making them ap-pear as a string of unrelated symbols; any letter-like symbols were notused. Vocod stimuli was created using Praat (Boersma & van Heuven,2001). Stimuli were first divided into three bands: 0.14–3.13 Bark;3.13–6.12 Bark; 6.12–9.11 Bark. For each band, root mean square in-tensity was computed and those intensity values were used to modulateGaussian noise. We then replaced the original signal in each band withthe noise to create 3-channel vocoded speech. Three channels wereutilized to ensure that the speech was unintelligible.
2.4. fMRI acquisition
Anatomical and functional imaging was performed on a Siemens3.0T Trio Tim System at the Yale University School of Medicine.Scanning sessions utilized a 12-channel coil. Functional activationimages were acquired at thirty-two axial-oblique anatomic imagesprescribed parallel to the intercommissural line using single shot, gra-dient echo, echo planar sequence with the following parameters:FA=80◦; TE=30ms; TR=2000ms; FOV=220; 4mm slice thick-ness, no gap; matrix size 64×64; 3.4 mm in-plane resolution. Highresolution, 1mm isotropic, T1-weighted MP-RAGE structural imageswere also gathered for registration with the following parameters:FA=7◦; TE= 3.66; TR=2530ms; FOV=256; 1mm slice thickness,no gap; matrix size 256×256.
2.5. fMRI analysis
2.5.1. Image processingSingle subject data were processed using the AFNI suite of programs
(Cox, 1996). Anatomic images were skull stripped. The first six TRsfrom each run were removed to allow for scanner stabilization. Func-tional images were then corrected for slice acquisition time, motioncorrected, normalized into standard Talairach space, and thensmoothed with an 8mm FWHM Gaussian filter. Any TRs with greaterthan 10% outlier voxels or more than 3mm of movement were removed
and not included in our analyses. Data were submitted to a multipleregression analysis (3dDeconvolve) with explanatory variables re-presenting conditions of interest (stimulus types); and nuisance re-gressors representing movement (3 rotation and 3 translation para-meters) and drift (1st and 2nd order polynomial). The hemodynamicresponse was modeled using a gamma function for the word task and aduration-modulated BLOCK function for the passage task. This resultedin two sets of activation maps from each subject (beta images): twomaps from the Passage Task (SPass minus rest, and PPass minus rest)and four maps from the Word Task: (simple evoked response to SWord,to PWord, to Vocod, and to FalseFont).
2.5.2. Group analysisScans from each subject were normalized into the N27 standard
space template (Talairach & Tournoux, 1988) for subsequent groupanalysis. Group analysis used 3dttest++ to apply one-sample t-tests oneach condition in the two tasks to find regions of significant activationacross all subjects (p= .001, FDR corrected).
2.5.3. Partial least squares correlation analysis (PLSC)We utilized PLSC analysis to investigate the relationships between
patterns of brain activation, our experimental manipulations, andcomprehension skill. PLSC is a multivariate approach that allows for theanalysis of complex relationships between brain and behavior by usingdata from the whole brain across conditions simultaneously (Krishnan,Williams, McIntosh, & Abdi, 2011; McIntosh, Bookstein, Haxby, &Grady, 1996). In addition, PLSC is a bottom-up, data-driven approachthat can identify relationships between brain and experimental designas well as brain and behavior without requiring a priori contrasts to bebuilt into the model. PLSC can be compared conceptually to principalcomponents analysis (PCA), in that both techniques look for sharedvariance across sets of data. In the case of PLSC, the relevant data typesare brain activation, behavioral measures, and experimental conditions.Specifically, we used two types of PLSC: task and behavioral. Task PLSCwas used to determine the relationship between brain activation andthe experimental conditions of the word and passage tasks. BehavioralPLSC was used to determine how reading comprehension skill relates toactivation across conditions.
PLSC results are reported in the form of latent variables that accountfor the maximum amount of covariance between two data matrices (Xand Y), similar to the factors produced by a PCA. The X matrix corre-sponds to brain activation values; here, the subject activation maps(pre-processed beta images, containing beta weights rather than rawactivation data for each voxel). Each subject contributes a beta imagefor each condition. The Y matrix varies according to the type of analysisbeing done. In task PLSC, the Y matrix represents the experimentalconditions. In behavioral PLSC, the Y matrix represents behavioralperformance (i.e., participants’ scores on the KTEA). For behavioralPLSC, the X matrix (containing brain activation values) is organizedinto condition-wise sub-matrices representing experimental conditions(e.g. speech followed by print). Crucially, a priori relationships betweenconditions are not present in the matrices (e.g. PWord and FalseFont,both printed conditions, are not explicitly linked). The resulting cov-ariance matrix is created by crossing the X and Y matrices and is sub-sequently decomposed into orthogonal latent variables (LVs) usingsingular value decomposition. In both task and behavioral PLSC, thelatent variable loadings to the brain activity maps (in the X matrix) arecalled brain scores. Again, brain scores can be related to the factorloadings found in a PCA; both indicate how strongly a measure or voxelexpresses a given factor or LV. In PLSC, the actual value of the brainscores matters less than its direction. Brain scores going in the samedirection indicate that within a given voxel, different experimentalconditions or behavioral measures relate to brain activation in the sameway.
Each LV accounts for some amount of the covariance between thebrain data and the behavioral or design information. Significance of the
K. Ryherd et al. Brain and Language 186 (2018) 32–43
35

LVs is determined using permutation tests in which the Y matrix israndomly reordered and the analysis is re-run. The significance of theoriginal LV comes from the probability that a singular value from thepermuted data is larger than that of the original analysis. Bootstrapresampling is used to determine standard error. Bootstrapping alsoprovides confidence intervals (CIs) for brain scores that can be used tocompare conditions.
We used the Partial Least Squares software for our PLSC analyses(McIntosh & Bookstein, 2015). We used mean-centered PLSC. Sig-nificance of LVs was determined by 1000 permutations and 1000bootstraps using the process described above. Significant voxels foreach LV had a bootstrap ratio with an absolute value of greater than orequal to 3. Bootstrap ratios are the ratios of each voxel’s brain score toits standard error. This threshold is standard in PLSC analyses. Clustercorrection was not used because the multivariate methods used in PLSC(specifically, resampling at the whole-brain level) make it in-appropriate.
3. Results
3.1. Basic contrasts
While our primary analyses consist of our multivariate PLSC re-ported below, we first report activations to speech and print across theword and passage tasks using conventional analyses to verify that ourtasks were accurately tapping spoken and printed language processingregions (see Supplemental Fig. 1).
Passage Task: One-sample t-tests were performed to determine sig-nificant activation in the passage comprehension task for PPass or SPassminus rest (see Supplemental Table 1). Both PPass and SPass activatedmany regions bilaterally. Across subjects, PPass elicited significant ac-tivation (p= .001, FDR corrected) in bilateral fusiform and lingual gyri,while SPass elicited significant activation (p= .001, FDR corrected)bilaterally in the STG. Both PPass and SPass showed significant acti-vation (p= .001, FDR corrected) in the bilateral MTG, left IFG, andbilateral superior frontal gyrus. Deactivations were largely similaracross the two conditions, with significance (p= .001, FDR corrected)bilaterally in cuneus, cingulate gyrus, supramarginal gyrus, superiorfrontal gyrus, and insula.
Word Task: One-sample t-tests were also performed to determinesignificant activation in the word task (see Supplemental Table 1).PWord elicited significant activation (p= .001, FDR corrected) in bi-lateral fusiform and extrastriate cortex, inferior and middle occipitalgyri, bilateral precentral gyrus, and bilateral IFG. SWord showed sig-nificant activation (p= .001, FDR corrected) in bilateral STG, bilaterallingual gyrus, and bilateral cuneus. Both PWord and SWord showedsignificant activation (p= .001, FDR corrected) in precuneus, and bi-lateral middle frontal gyrus. While SWord showed very little deacti-vation, the PWord showed significant deactivation (p= .001, FDRcorrected) in bilateral STG.
3.2. PLSC analyses
3.2.1. Task PLSCTo analyze the relationships between brain activity and task con-
ditions, we used a mean-centered task PLSC. The task PLSC examinedhow whole brain activation covaried with the six experimental condi-tions (PPass, SPass, PWord, SWord, FalseFont, and Vocod). Three LVswere significant. The first LV had a singular value of 351.3 and ac-counted for 50.93% of the covariance (p < .001). This LV dissociatedprinted conditions from spoken conditions (see Fig. 1a for design scoreplots). Print conditions (PWord, FalseFont, PPass) showed more acti-vation in bilateral fusiform and extrastriate cortex. Speech conditions(SWord, Vocod, SPass) showed more activation in bilateral STG(Fig. 1b). 95% confidence intervals indicate that PPass [−237.7,−184.8] expresses the LV more strongly than PWord [−112.8, −84.8]
and false font [−118.6, −90.9], which are equivalent. SPass [135.4,192.4], SWord [117.8, 142.8], and Vocod [112.6, 136.8] express thepattern equally.
The second significant LV had a singular value of 311.5 and ac-counted for 41.33% of the covariance (p < .001). It differentiatedpassage conditions from word conditions (see Fig. 1c). Both PPass andSPass showed more activation in bilateral MTG and left inferior frontalgyrus (IFG) pars orbitalis. 95% CIs reveal that SPass [168.6, 223.2] andPPass [146.8, 208.2] show the pattern to the same extent. All wordconditions (SWord, PWord, FalseFont, and Vocod) showed more acti-vation in anterior and posterior cingulate cortex (ACC, PCC; Fig. 1d).PWord [−125.2, −94.5] and FalseFont [−130.7, −97.8] conditionsexpress the LV more strongly than SWord [−91.6, −51.3] and Vocod[−89.7, −63.0].
The third significant LV had a singular value of 123.3 and accountedfor 6.28% of the covariance (p= .001) (see Supplemental Fig. 2a). ThisLV dissociated SPass, PWord, and FalseFont from PPass, SWord, andVocod. While this LV is significant, it appears as though the wordconditions are driving the effect. Areas showing more activation forSPass, PWord, and FalseFont include bilateral fusiform and extrastriatecortex, whereas areas showing more activation for PPass, SWord, andVocod include bilateral STG (see Supplemental Fig. 2b). Because thefirst two LVs already account for 91% of the covariance, leaving only asmall percentage of the covariance for this LV, we will limit our in-terpretation.
The results of the task PLSC suggest that the tasks are indeed pickingup on the differential processing that tasks place for words vs. texts andspoken vs. printed stimuli. Much of the covariance between brain ac-tivation and experimental design was explained by latent variables thatreflect our main experimental manipulations: modality (spoken vs.written) and processing level (word vs. passage). The experimentaldesign matrix in a task PLSC only tells the analysis which trials belongto each condition without any a priori information about how theconditions relate (e.g. the three auditory conditions are not linked).Thus, the analysis looks for similar activation patterns across conditionswithout the need for prespecified contrasts. The analysis’ production oflatent variables dissociating between modality and processing levelsupports the validity of these tasks’ ability to evoke processing at dif-ferent levels and in different modalities. For more detailed informationon the results of the task PLSC analysis, see Table 1.
3.2.2. Behavioral PLSCTwo behavioral PLSC analyses were conducted. We used non-ro-
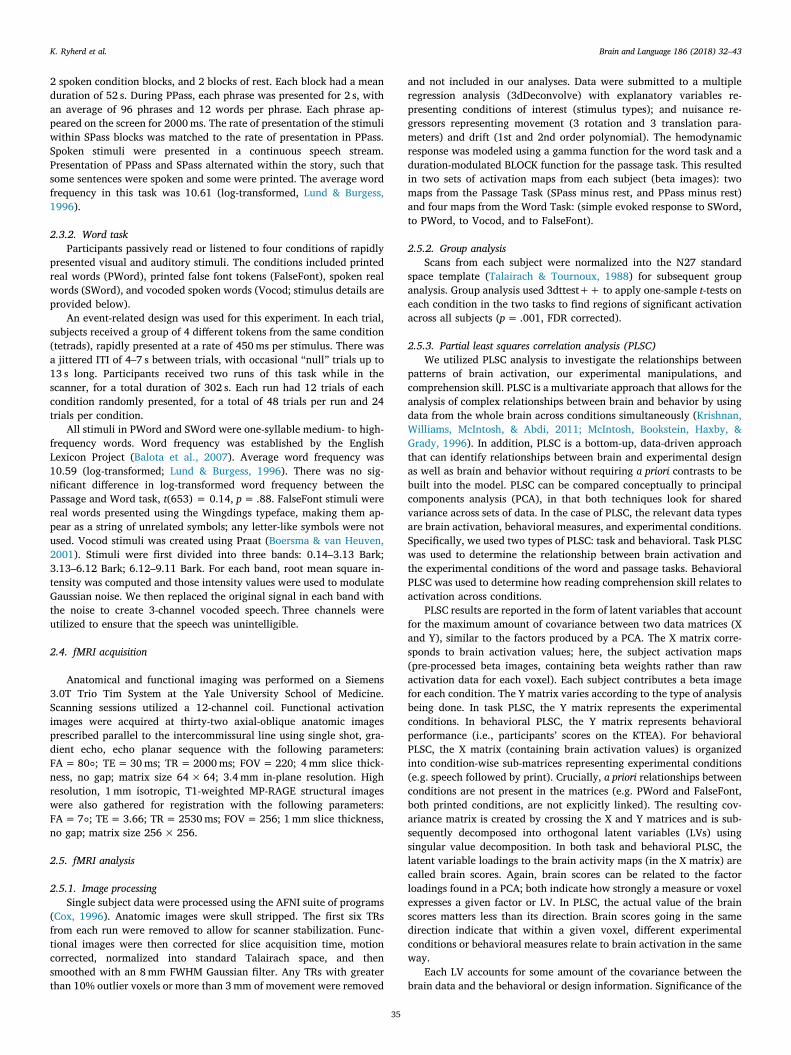
tated behavioral PLSC analyses, coding the conditions of interest as 1and the others as 0. Unlike mean-centered PLSC, non-rotated PLSC al-lows you to investigate specific contrasts while also taking into accountall conditions of an experiment. In this investigation, we were able tolook at the covariance between specific conditions of primary interestwithout removing the other task conditions. Since both of our non-ro-tated task PLSC analyses had only one contrast, percent of covarianceaccounted for is not relevant; there is only one source of covariance.The first non-rotated behavioral PLSC analysis determined how readingcomprehension scores covaried with the two passage task conditions(SPass and PPass) to test whether the modality of the material affectedthe modulation of regions used for comprehension (see Table 2). Be-cause the number of latent variables in non-rotated behavioral PLSanalyses is equal to the number of contrasts, we found one LV. This LVhad a singular value of 70.8. This LV did not dissociate between the twopassage conditions; comprehension ability was related to similar pat-terns of neural activation across both modalities, which was confirmedby 95% CIs [spoken: .72, .92; printed: .68, .91] (see Fig. 2a). That is, thesame distinct sets of brain regions were associated with lower or highercomprehension skill for both SPass and PPass. SWord also showed thesame pattern, although to a lesser extent. Specifically, across bothmodalities, activation related to higher reading comprehension skillwas seen in bilateral MTG and left IFG pars orbitalis and pars
K. Ryherd et al. Brain and Language 186 (2018) 32–43
36
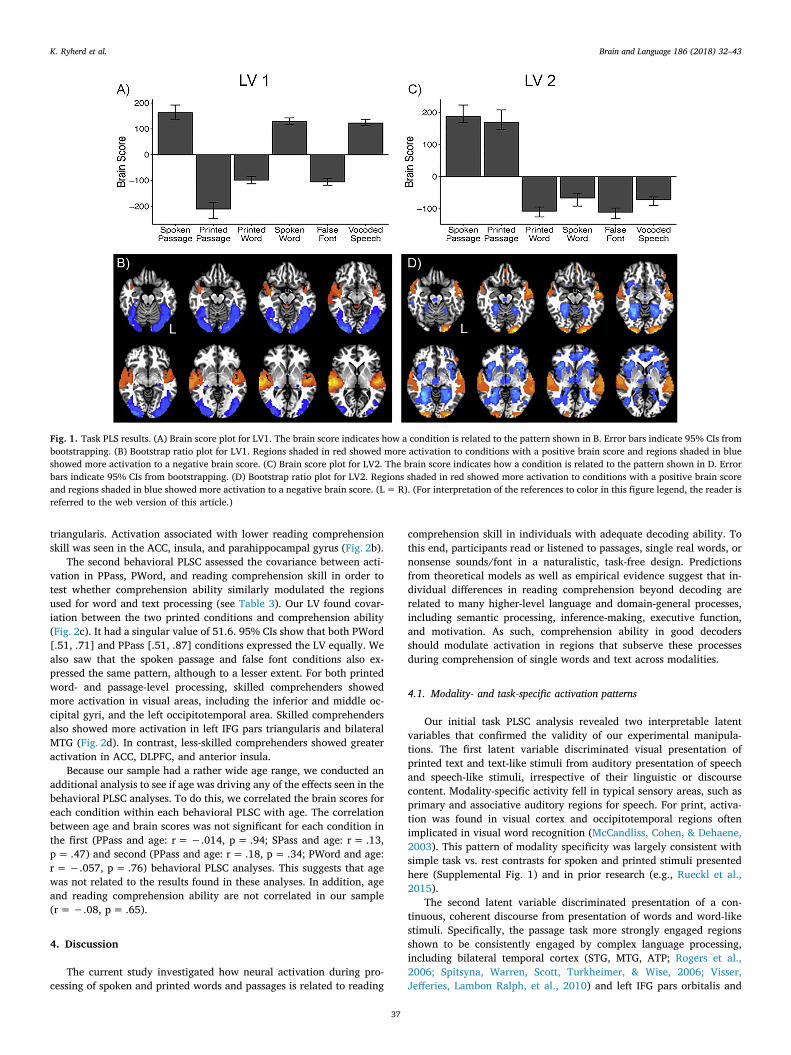
triangularis. Activation associated with lower reading comprehensionskill was seen in the ACC, insula, and parahippocampal gyrus (Fig. 2b).
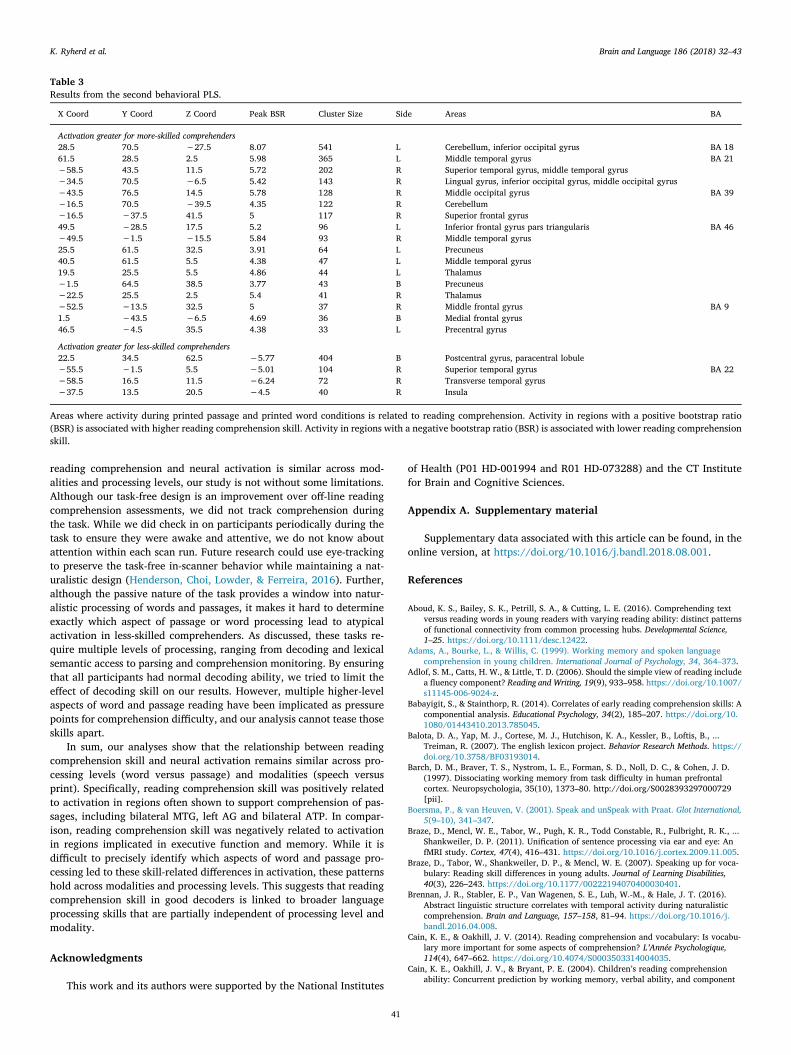
The second behavioral PLSC assessed the covariance between acti-vation in PPass, PWord, and reading comprehension skill in order totest whether comprehension ability similarly modulated the regionsused for word and text processing (see Table 3). Our LV found covar-iation between the two printed conditions and comprehension ability(Fig. 2c). It had a singular value of 51.6. 95% CIs show that both PWord[.51, .71] and PPass [.51, .87] conditions expressed the LV equally. Wealso saw that the spoken passage and false font conditions also ex-pressed the same pattern, although to a lesser extent. For both printedword- and passage-level processing, skilled comprehenders showedmore activation in visual areas, including the inferior and middle oc-cipital gyri, and the left occipitotemporal area. Skilled comprehendersalso showed more activation in left IFG pars triangularis and bilateralMTG (Fig. 2d). In contrast, less-skilled comprehenders showed greateractivation in ACC, DLPFC, and anterior insula.
Because our sample had a rather wide age range, we conducted anadditional analysis to see if age was driving any of the effects seen in thebehavioral PLSC analyses. To do this, we correlated the brain scores foreach condition within each behavioral PLSC with age. The correlationbetween age and brain scores was not significant for each condition inthe first (PPass and age: r=−.014, p= .94; SPass and age: r= .13,p= .47) and second (PPass and age: r= .18, p= .34; PWord and age:r=−.057, p= .76) behavioral PLSC analyses. This suggests that agewas not related to the results found in these analyses. In addition, ageand reading comprehension ability are not correlated in our sample(r=−.08, p= .65).
4. Discussion
The current study investigated how neural activation during pro-cessing of spoken and printed words and passages is related to reading
comprehension skill in individuals with adequate decoding ability. Tothis end, participants read or listened to passages, single real words, ornonsense sounds/font in a naturalistic, task-free design. Predictionsfrom theoretical models as well as empirical evidence suggest that in-dividual differences in reading comprehension beyond decoding arerelated to many higher-level language and domain-general processes,including semantic processing, inference-making, executive function,and motivation. As such, comprehension ability in good decodersshould modulate activation in regions that subserve these processesduring comprehension of single words and text across modalities.
4.1. Modality- and task-specific activation patterns
Our initial task PLSC analysis revealed two interpretable latentvariables that confirmed the validity of our experimental manipula-tions. The first latent variable discriminated visual presentation ofprinted text and text-like stimuli from auditory presentation of speechand speech-like stimuli, irrespective of their linguistic or discoursecontent. Modality-specific activity fell in typical sensory areas, such asprimary and associative auditory regions for speech. For print, activa-tion was found in visual cortex and occipitotemporal regions oftenimplicated in visual word recognition (McCandliss, Cohen, & Dehaene,2003). This pattern of modality specificity was largely consistent withsimple task vs. rest contrasts for spoken and printed stimuli presentedhere (Supplemental Fig. 1) and in prior research (e.g., Rueckl et al.,2015).
The second latent variable discriminated presentation of a con-tinuous, coherent discourse from presentation of words and word-likestimuli. Specifically, the passage task more strongly engaged regionsshown to be consistently engaged by complex language processing,including bilateral temporal cortex (STG, MTG, ATP; Rogers et al.,2006; Spitsyna, Warren, Scott, Turkheimer, & Wise, 2006; Visser,Jefferies, Lambon Ralph, et al., 2010) and left IFG pars orbitalis and
Fig. 1. Task PLS results. (A) Brain score plot for LV1. The brain score indicates how a condition is related to the pattern shown in B. Error bars indicate 95% CIs frombootstrapping. (B) Bootstrap ratio plot for LV1. Regions shaded in red showed more activation to conditions with a positive brain score and regions shaded in blueshowed more activation to a negative brain score. (C) Brain score plot for LV2. The brain score indicates how a condition is related to the pattern shown in D. Errorbars indicate 95% CIs from bootstrapping. (D) Bootstrap ratio plot for LV2. Regions shaded in red showed more activation to conditions with a positive brain scoreand regions shaded in blue showed more activation to a negative brain score. (L=R). (For interpretation of the references to color in this figure legend, the reader isreferred to the web version of this article.)
K. Ryherd et al. Brain and Language 186 (2018) 32–43
37

triangularis (Ferstl et al., 2008; Friederici, Rüschemeyer, Hahne, &Fiebach, 2003; Liakakis, Nickel, & Seitz, 2011; Newman, Ikuta, andBurns Jr., 2010). The IFG has also been linked to social-emotionalprocessing as well as working memory, which are known to be com-ponents of narrative comprehension (Keuken et al., 2011; Rota et al.,2009; Tops & Boksem, 2011). These regions were also similar to thosefound to be activated for both printed and spoken passage compre-hension in our basic GLM contrasts.
The single-word level task more strongly engaged the hippocampalregions as well as the anterior cingulate, thalamus, and insula. These
findings are consistent with studies directly contrasting single wordsand passages (Wang et al., 2015). This suggests that these regionssupport single-word processing specifically when compared to passagecomprehension. Other regions typically isolated by word processing,such as anterior fusiform, left inferior frontal gyrus, and left middletemporal gyrus, seem to be involved in processing words both in iso-lation and in connected text (Crepaldi et al., 2013; Taylor, Rastle, &Davis, 2013). Further, the regions more strongly activated by the wordtasks in this LV may partially reflect processing specific to this task,such as comprehending unrelated lists of words and quickly switching
Table 1Results from task PLS analyses.
X coord Y coord Z coord Peak BSR Cluster Size Hemi-sphere
Areas in this cluster BA
LV 1Activation greater for spoken tasks−49.5 19.5 8.5 19.918 1218 R Superior temporal gyrus BA 2243.5 25.5 11.5 21.913 951 L Superior temporal gyrus BA 2210.5 70.5 29.5 9.246 61 L Precuneus, cuneus BA 7, 3122.5 52.5 −48.5 7.807 47 L Cerebellar tonsil10.5 52.5 50.5 7.144 31 L Precuneus BA 7
Activation greater for printed tasks37.5 43.5 −12.5 −11.413 1112 L Fusiform gyrus, middle occipital gyrus, inferior occipital gyrus BA 18,
19−25.5 91.5 −6.5 −12.921 910 R Fusiform gyrus, middle occipital gyrus, inferior occipital gyrus BA 18.
1940.5 −1.5 47.5 −7.297 135 L Middle frontal gyrus, precentral gyrus BA 6−28.5 61.5 47.5 −8.616 96 R Superior parietal lobule, precuneus BA 725.5 55.5 44.5 −6.493 35 L Superior parietal lobule, precuneus BA 71.5 73.5 −21.5 −6.21 30 B Declive of Vermis
LV 2Activation greater for passages55.5 7.5 −6.5 8.629 708 L Middle temporal gyrus, superior temporal gyrus−58.5 13.5 5.5 8.817 431 R Middle temporal gyrus, superior temporal gyrus25.5 94.5 −6.5 10.207 396 L Inferior occipital gyrus−13.5 79.5 −30.5 9.03 318 R Uvula−22.5 94.5 −6.5 9.913 125 R Inferior occipital gyrus BA 1749.5 61.5 26.5 7.687 122 L Middle temporal gyrus BA 3946.5 −31.5 −6.5 5.542 53 L Inferior frontal gyrus p. orbitalis/triangularis10.5 −34.5 50.5 5.788 38 L Superior frontal gyrus−55.5 58.5 23.5 6.607 36 R Superior temporal gyrus BA 39
Activation greater for single words4.5 22.5 32.5 −11.361 5882 B Cingulate gyrus (anterior to posterior), cuneus, precuneus, inferior parietal lobule, middle
frontal gyrus, right parahippocampusBA 9
16.5 70.5 32.5 −11.843 1046 L Cuneus, posterior cingulate gyrus, parahippocampal gyrus−31.5 −37.5 35.5 −9.464 1022 R Middle frontal gyrus, insula7.5 7.5 2.5 −7.53 177 B Thalamus31.5 40.5 −30.5 −5.772 71 L Cerebellar tonsil−16.5 −13.5 −0.5 −5.596 45 R Putamen−43.5 4.5 23.5 −4.884 30 R Precentral gyrus
LV 3Activation greater for spoken passages, printed single words and false fonts−34.5 40.5 −9.5 6.756 1362 R Parahippocampal gyrus, fusiform gyrus, insula31.5 49.5 −9.5 6.873 226 L Parahippocampal gyrus, fusiform gyrus40.5 1.5 11.5 4.667 139 L Insula BA 13−19.5 58.5 65.5 4.021 134 R Superior parietal lobule−46.5 −37.5 −9.5 4.378 91 R Middle frontal gyrus BA 47−55.5 −10.5 −3.5 3.997 64 R Superior temporal gyrus BA 2243.5 −37.5 −9.5 5.448 62 L Middle frontal gyrus BA 4710.5 55.5 56.5 4.124 53 L Precuneus19.5 4.5 −27.5 3.416 43 L Parahippocampal gyrus, uncus40.5 43.5 53.5 3.651 30 L Inferior parietal lobule BA 4052.5 58.5 −0.5 3.515 30 L Middle temporal gyrus BA 37−58.5 22.5 38.5 3.173 28 R Postcentral gyrus BA 3
Activation greater for printed passages, spoken words and vocoded words16.5 82.5 −9.5 −9.617 10,448 B Lingual gyrus, cuneus, thalamus, insula, superior temporal gyrus, posterior cingulate gyrus,
anterior cingulate gyrus, medial frontal gyrus, middle frontal gyrus,BA 18,10
1.5 28.5 −33.5 −5.613 197 B Brainstem4.5 4.5 59.5 −4.528 107 L Medial frontal gyrus BA 6
All results come from the three significant LVs of the task PLS.
K. Ryherd et al. Brain and Language 186 (2018) 32–43
38

between conditions.Thus, at the group level, the task PLSC successfully identifies im-
portant task-related variability in brain activity that aligns well withresults found from basic contrasts. Critically, the task PLSC analysisuses an unsupervised approach, where similarities are extractedwithout the experimenter inputting specific contrasts. The overlap be-tween task PLSC and contrast-based analyses confirm the validity of themodality and processing level experimental manipulations. We nowturn to analyses applying the same approach to explore brain activityassociated with individual differences in comprehension ability.
4.2. Activity associated with individual variability in comprehension
Extant research finds tight links between reading and listeningcomprehension ability (Adams et al., 1999; Verhoeven & van Leeuwe,2008). Thus, we hypothesized that individual differences may be re-lated to activation during comprehension similarly across modalities.To test this hypothesis, our first brain-behavior analysis (behavioralPLSC) examined the relationship between comprehension skill andpassage-level processing across the spoken and printed modalities,contrasted against other conditions. In line with our hypothesis, thisanalysis identified regions that were modulated by comprehension skillsimilarly for both modalities, suggesting that some reading compre-hension skill associated differences in neural response are modality-independent. This result is in line with Shankweiler et al. (2008), whichalso found that activation during both print and speech in some regionswas related to comprehension ability.
Additionally, research has also identified relations between readingcomprehension skill and word level processing (Henderson, Snowling,& Clarke, 2013; Nation & Snowling, 1999; Oakhill & Cain, 2012;Oakhill, Hartt, & Samols, 2005). More specifically, performance in tasksthat tap word-level semantic processing (Henderson et al., 2013; Nation& Snowling, 1999), as well as tasks that tap higher-level word to textintegration (Silva & Cain, 2015) have been correlated with compre-hension skill and impaired in those with S-RCD. Thus, we hypothesizedthat reading comprehension skill would be related to neural activationduring processing of words in addition to processing of passages. Oursecond brain-behavior analysis tested this hypothesis by analyzing therelationship between reading comprehension skill and printed single-
word and passage processing, contrasted against the other conditions.Findings from this second brain-behavior analysis show that the re-lationship between neural activation and reading comprehension skillwas similar for both the single-word and passage conditions.
Across both passage and word processing tasks and spoken andprinted modalities, we observed that reading comprehension skill waspositively associated with activation in bilateral STG/MTG, the inferiorparietal lobe (including AG), the anterior temporal pole, and portions ofthe left IFG (pars triangularis and orbitalis). Meta-analyses show thatthese regions are consistently activated in both print and speech forword- and passage-level processing (Crepaldi et al., 2013; Ferstl et al.,2008; Martin et al., 2015; Rodd et al., 2015). In addition, studies findpositive relationships between reading comprehension ability and ac-tivation during sentence comprehension in left AG and left STG (VanEttinger-Veenstra et al., 2016) and during passage comprehension inleft IFG as well as bilateral STG and inferior parietal lobe (Aboud et al.,2016; Horowitz-Kraus et al., 2013). Thus, these regions seem to supportcomprehension across modalities and processing levels.
Reading comprehension skill was negatively associated with acti-vation in ACC, DLPFC, and hippocampal areas. DLPFC and ACC havebeen shown to be involved in a variety of executive functions, includingcognitive control, performance monitoring, flexibility, inhibition, andeffortful control (MacDonald, Cohen, Stenger, & Carter, 2000; Niendamet al., 2012; Nouchi et al., 2016). Thus, during comprehension ofspoken and written passages and words, poorer comprehenders showmore activation in executive function regions. Prior research has foundthat connectivity for passages relative to words between left DLPFC andleft ventral AG is positively correlated with reading comprehension(Aboud et al., 2016). This study also found that left DLPFC was acti-vated during both word and passage reading. The authors suggest thatleft DLPFC may be involved in word-to-text integration, supportingcommunication between networks involved in word-level and passage-level reading. However, our findings show that activation in DLPFC isnegatively related to reading comprehension ability, perhaps sug-gesting atypical use of DLPFC in poorer comprehenders for both word-and passage-level comprehension. In addition, activation in ACC andanterior insula have been shown to be related to task difficulty (Barchet al., 1997; Edward, James, Ross, William, & Therese, 2013). As such,it is possible that poorer comprehenders found our tasks more difficult.
Table 2Results from the first behavioral PLS.
X coord Y Coord Z Coord Peak BSR Cluster Size Side Areas in this cluster BA
Activation greater for more-skilled comprehenders43.5 −34.5 −9.5 5.36 49 L Inferior frontal gyrus pars orbitalis BA 11−4.5 52.5 29.5 4.92 58 B Cingulate gyrus−1.5 −46.5 −9.5 3.74 59 B Medial frontal gyrus−22.5 85.5 −9.5 4.78 73 R Middle occipital gyrus BA 1834.5 31.5 −15.5 4.04 101 L Fusiform gyrus52.5 −28.5 14.5 9.19 157 L Inferior frontal gyrus pars triangularis BA 46−61.5 37.5 −0.5 3.76 170 R Middle temporal gyrus BA 21−19.5 76.5 −36.5 4.8 183 R Cerebellum4.5 −37.5 44.5 4.76 202 B Superior frontal gyrus BA 831.5 70.5 −33.5 7.81 203 L Cerebellum−58.5 4.5 −6.5 6.08 227 B Middle temporal gyrus58.5 31.5 5.5 6.78 754 L Middle temporal gyrus BA 22
Activation greater for less-skilled comprehenders4.5 −28.5 17.5 −9.14 1718 B Anterior cingulate cortex BA 2410.5 52.5 −12.5 −8.77 1302 B Cerebellum25.5 37.5 2.5 −8.55 1020 B Posterior cingulate cortex, parahippocampus, insula, inferior parietal lobule−31.5 −34.5 26.5 −6.54 195 R Middle frontal gyrus−13.5 70.5 26.5 −3.8 57 R Precuneus−40.5 −4.5 14.5 −4.31 47 R Insula4.5 −7.5 −0.5 −3.81 33 L Caudate−16.5 49.5 −45.5 −3.78 30 R Cerebellum
Areas where activity during printed and spoken conditions of the passage task is related to reading comprehension. Activity in regions with a positive bootstrap ratio(BSR) is associated with higher reading comprehension skill. Activity in regions with a negative bootstrap ratio (BSR) is associated with lower reading comprehensionskill.
K. Ryherd et al. Brain and Language 186 (2018) 32–43
39
However, without online behavioral measures of comprehension col-lected during scanning, this interpretation should be taken cautiously.Finally, a negative relationship between reading comprehension skilland activation in parahippocampal regions may implicate atypical re-trieval of information from declarative memory during comprehension
for less-skilled comprehenders. These results are consistent with thoseof Cutting et al. (2013), who found that functional connectivity be-tween the left IFG and left hippocampus/parahippocampus increased inresponse to low-frequency words for S-RCD individuals.
While our results support the idea that the relationship between
Fig. 2. Results from brain behavior analyses. (A) Reading comprehension correlation plot for first brain behavior analysis comparing spoken and printed passagetasks. This plot shows the correlation between reading comprehension skill and brain scores (similar to factor loadings, they indicate how strongly activation dataexpress the pattern from the latent variable). Both plots show error bars which correspond to 95% CIs from bootstrapping. Positive correlations indicate that theactivation pattern shown in B is positively correlated with reading comprehension skill. (B) Bootstrap ratio plot for first brain behavior analysis. For PPass, SPass, andSWord, areas in red are positively correlated with reading comprehension, and areas in blue are negatively correlated with reading comprehension. (C) Readingcomprehension correlation plot for the second brain-behavior analysis comparing printed word and passage tasks. (D) Bootstrap ratio plot for second brain behavioralanalysis. For PPass and PWord, areas in red are positively correlated with reading comprehension, and areas in blue are negatively correlated with reading com-prehension. Images are presented in radiological convention (L=R, image in top left corner is at z= 11, displaying every fifth slice).
K. Ryherd et al. Brain and Language 186 (2018) 32–43
40
reading comprehension and neural activation is similar across mod-alities and processing levels, our study is not without some limitations.Although our task-free design is an improvement over off-line readingcomprehension assessments, we did not track comprehension duringthe task. While we did check in on participants periodically during thetask to ensure they were awake and attentive, we do not know aboutattention within each scan run. Future research could use eye-trackingto preserve the task-free in-scanner behavior while maintaining a nat-uralistic design (Henderson, Choi, Lowder, & Ferreira, 2016). Further,although the passive nature of the task provides a window into natur-alistic processing of words and passages, it makes it hard to determineexactly which aspect of passage or word processing lead to atypicalactivation in less-skilled comprehenders. As discussed, these tasks re-quire multiple levels of processing, ranging from decoding and lexicalsemantic access to parsing and comprehension monitoring. By ensuringthat all participants had normal decoding ability, we tried to limit theeffect of decoding skill on our results. However, multiple higher-levelaspects of word and passage reading have been implicated as pressurepoints for comprehension difficulty, and our analysis cannot tease thoseskills apart.
In sum, our analyses show that the relationship between readingcomprehension skill and neural activation remains similar across pro-cessing levels (word versus passage) and modalities (speech versusprint). Specifically, reading comprehension skill was positively relatedto activation in regions often shown to support comprehension of pas-sages, including bilateral MTG, left AG and bilateral ATP. In compar-ison, reading comprehension skill was negatively related to activationin regions implicated in executive function and memory. While it isdifficult to precisely identify which aspects of word and passage pro-cessing led to these skill-related differences in activation, these patternshold across modalities and processing levels. This suggests that readingcomprehension skill in good decoders is linked to broader languageprocessing skills that are partially independent of processing level andmodality.
Acknowledgments
This work and its authors were supported by the National Institutes
of Health (P01 HD-001994 and R01 HD-073288) and the CT Institutefor Brain and Cognitive Sciences.
Appendix A. Supplementary material
Supplementary data associated with this article can be found, in theonline version, at https://doi.org/10.1016/j.bandl.2018.08.001.
References
Aboud, K. S., Bailey, S. K., Petrill, S. A., & Cutting, L. E. (2016). Comprehending textversus reading words in young readers with varying reading ability: distinct patternsof functional connectivity from common processing hubs. Developmental Science,1–25. https://doi.org/10.1111/desc.12422.
Adams, A., Bourke, L., & Willis, C. (1999). Working memory and spoken languagecomprehension in young children. International Journal of Psychology, 34, 364–373.
Adlof, S. M., Catts, H. W., & Little, T. D. (2006). Should the simple view of reading includea fluency component? Reading and Writing, 19(9), 933–958. https://doi.org/10.1007/s11145-006-9024-z.
Babayigit, S., & Stainthorp, R. (2014). Correlates of early reading comprehension skills: Acomponential analysis. Educational Psychology, 34(2), 185–207. https://doi.org/10.1080/01443410.2013.785045.
Balota, D. A., Yap, M. J., Cortese, M. J., Hutchison, K. A., Kessler, B., Loftis, B., ...Treiman, R. (2007). The english lexicon project. Behavior Research Methods. https://doi.org/10.3758/BF03193014.
Barch, D. M., Braver, T. S., Nystrom, L. E., Forman, S. D., Noll, D. C., & Cohen, J. D.(1997). Dissociating working memory from task difficulty in human prefrontalcortex. Neuropsychologia, 35(10), 1373–80. http://doi.org/S0028393297000729[pii].
Boersma, P., & van Heuven, V. (2001). Speak and unSpeak with Praat. Glot International,5(9–10), 341–347.
Braze, D., Mencl, W. E., Tabor, W., Pugh, K. R., Todd Constable, R., Fulbright, R. K., ...Shankweiler, D. P. (2011). Unification of sentence processing via ear and eye: AnfMRI study. Cortex, 47(4), 416–431. https://doi.org/10.1016/j.cortex.2009.11.005.
Braze, D., Tabor, W., Shankweiler, D. P., & Mencl, W. E. (2007). Speaking up for voca-bulary: Reading skill differences in young adults. Journal of Learning Disabilities,40(3), 226–243. https://doi.org/10.1177/00222194070400030401.
Brennan, J. R., Stabler, E. P., Van Wagenen, S. E., Luh, W.-M., & Hale, J. T. (2016).Abstract linguistic structure correlates with temporal activity during naturalisticcomprehension. Brain and Language, 157–158, 81–94. https://doi.org/10.1016/j.bandl.2016.04.008.
Cain, K. E., & Oakhill, J. V. (2014). Reading comprehension and vocabulary: Is vocabu-lary more important for some aspects of comprehension? L’Année Psychologique,114(4), 647–662. https://doi.org/10.4074/S0003503314004035.
Cain, K. E., Oakhill, J. V., & Bryant, P. E. (2004). Children’s reading comprehensionability: Concurrent prediction by working memory, verbal ability, and component
Table 3Results from the second behavioral PLS.
X Coord Y Coord Z Coord Peak BSR Cluster Size Side Areas BA
Activation greater for more-skilled comprehenders28.5 70.5 −27.5 8.07 541 L Cerebellum, inferior occipital gyrus BA 1861.5 28.5 2.5 5.98 365 L Middle temporal gyrus BA 21−58.5 43.5 11.5 5.72 202 R Superior temporal gyrus, middle temporal gyrus−34.5 70.5 −6.5 5.42 143 R Lingual gyrus, inferior occipital gyrus, middle occipital gyrus−43.5 76.5 14.5 5.78 128 R Middle occipital gyrus BA 39−16.5 70.5 −39.5 4.35 122 R Cerebellum−16.5 −37.5 41.5 5 117 R Superior frontal gyrus49.5 −28.5 17.5 5.2 96 L Inferior frontal gyrus pars triangularis BA 46−49.5 −1.5 −15.5 5.84 93 R Middle temporal gyrus25.5 61.5 32.5 3.91 64 L Precuneus40.5 61.5 5.5 4.38 47 L Middle temporal gyrus19.5 25.5 5.5 4.86 44 L Thalamus−1.5 64.5 38.5 3.77 43 B Precuneus−22.5 25.5 2.5 5.4 41 R Thalamus−52.5 −13.5 32.5 5 37 R Middle frontal gyrus BA 91.5 −43.5 −6.5 4.69 36 B Medial frontal gyrus46.5 −4.5 35.5 4.38 33 L Precentral gyrus
Activation greater for less-skilled comprehenders22.5 34.5 62.5 −5.77 404 B Postcentral gyrus, paracentral lobule−55.5 −1.5 5.5 −5.01 104 R Superior temporal gyrus BA 22−58.5 16.5 11.5 −6.24 72 R Transverse temporal gyrus−37.5 13.5 20.5 −4.5 40 R Insula
Areas where activity during printed passage and printed word conditions is related to reading comprehension. Activity in regions with a positive bootstrap ratio(BSR) is associated with higher reading comprehension skill. Activity in regions with a negative bootstrap ratio (BSR) is associated with lower reading comprehensionskill.
K. Ryherd et al. Brain and Language 186 (2018) 32–43
41

skills. Journal of Educational Psychology, 96(1), 31–42. https://doi.org/10.1037/0022-0663.96.1.31.
Catts, H. W., Adlof, S. M., & Weismer, S. E. (2006). Language deficits in poor compre-henders: A case for the simple view of reading. Journal of Speech, Language, andHearing Research, 49(2), 278–293. https://doi.org/10.1044/1092-4388(2006/023).
Chik, P. P. man, Ho, C. S. han, Yeung, P. sze, Wong, Y. kai, Chan, D. W. ock, Chung, K. K.hoa, & Lo, L. yan. (2012). Contribution of discourse and morphosyntax skills toreading comprehension in Chinese dyslexic and typically developing children. Annalsof Dyslexia, 62(1), 1–18. http://doi.org/10.1007/s11881-010-0045-6.
Constable, R. T., Pugh, K. R., Berroya, E., Mencl, W. E., Westerveld, M., Ni, W., &Shankweiler, D. (2004). Sentence complexity and input modality effects in sentencecomprehension: An fMRI study. NeuroImage, 22(1), 11–21. https://doi.org/10.1016/j.neuroimage.2004.01.001.
Cox, R. W. (1996). AFNI: Software for analysis and visualization of functional magneticresonance neuroimages. Computers and Biomedical Research, an International Journal,29(3), 162–173. https://doi.org/10.1006/cbmr.1996.0014.
Crepaldi, D., Berlingeri, M., Cattinelli, I., Borghese, N. A., Luzzatti, C., & Paulesu, E.(2013). Clustering the lexicon in the brain: A meta-analysis of the neurofunctionalevidence on noun and verb processing. Frontiers in Human Neuroscience, 7(June),1–15. https://doi.org/10.3389/fnhum.2013.00303.
Cutting, L. E., Clements-Stephens, A., Pugh, K. R., Burns, S., Cao, A., Pekar, J. J., ...Rimrodt, S. L. (2013). Not all reading disabilities are dyslexia: Distinct neurobiologyof specific comprehension deficits. Brain Connectivity, 3(2), 199–211. https://doi.org/10.1089/brain.2012.0116.
Diakidoy, I.-A. N., Stylianou, P., Karefillidou, C., & Papageorgiou, P. (2005). The re-lationship between listening and reading comprehension of different types of text atincreasing grade levels. Reading Psychology, 26(1), 55–80. https://doi.org/10.1080/02702710590910584.
Edward, M., James, P., Ross, W., William, T., & Therese, P. (2013). Stop-signal task dif-ficulty and the right inferior frontal gyrus. Behavioural Brain Research, 256, 205–213.https://doi.org/10.1016/j.bbr.2013.08.026.
Ferstl, E. C., Neumann, J., Bogler, C., & von Cramon, D. Y. (2008). The extended languagenetwork: A meta-analysis of neuroimaging studies on text comprehension. HumanBrain Mapping, 29(5), 581–593. https://doi.org/10.1002/hbm.20422.
Friederici, A. D., Rüschemeyer, S.-A., Hahne, A., & Fiebach, C. J. (2003). The role of leftinferior frontal and superior temporal cortex in sentence comprehension: localizingsyntactic and semantic processes. Cerebral Cortex, 13(2), 170–177. https://doi.org/10.1093/cercor/13.2.170.
García, J. R., & Cain, K. E. (2014). Decoding and reading comprehension: A meta-analysisto identify which reader and assessment characteristics influence the strength of therelationship in english. Review of Educational Research, 84(1), 74–111. https://doi.org/10.3102/0034654313499616.
Gough, P. B., & Tunmer, W. E. (1986). Decoding, reading, and reading disability. Remedialand Special Education, 7(1), 6–10. https://doi.org/10.1177/074193258600700104.
Hale, J. T., Lutz, D. E., Luh, W., Brennan, J. R., & Arbor, A. (2015). Modeling fMRI timecourses with linguistic structure at various grain sizes. Proceedings of CMCL, 89–97.
Henderson, J. M., Choi, W., Lowder, M. W., & Ferreira, F. (2016). Language structure inthe brain: A fixation-related fMRI study of syntactic surprisal in reading. NeuroImage,132, 293–300. https://doi.org/10.1016/j.neuroimage.2016.02.050.
Henderson, L., Snowling, M. J., & Clarke, P. (2013). Accessing, integrating, and inhibitingword meaning in poor comprehenders. Scientific Studies of Reading, 17(3), 177–198.https://doi.org/10.1080/10888438.2011.652721.
Hogan, T. P., Adlof, S. M., & Alonzo, C. N. (2014). On the importance of listening com-prehension. International Journal of Speech-Language Pathology, 16(3), 199–207.https://doi.org/10.3109/17549507.2014.904441.
Horowitz-Kraus, T., Vannest, J. J., & Holland, S. K. (2013). Overlapping neural circuitryfor narrative comprehension and proficient reading in children and adolescents.Neuropsychologia, 51(13), 2651–2662. https://doi.org/10.1016/j.neuropsychologia.2013.09.002.
Houdé, O., Rossi, S., Lubin, A., & Joliot, M. (2010). Mapping numerical processing,reading, and executive functions in the developing brain: An fMRI meta-analysis of52 studies including 842 children. Developmental Science, 13(6), 876–885. https://doi.org/10.1111/j.1467-7687.2009.00938.x.
Joshi, R. M., Ji, X. R., Breznitz, Z., Amiel, M., & Yulia, A. (2015). Validation of the simpleview of reading in hebrew—A semitic language. Scientific Studies of Reading, 19(3),243–252. https://doi.org/10.1080/10888438.2015.1010117.
Kaufman, A. S., & Kaufman, N. L. (2004). Kaufman test of educational achievement –comprehensive form. American Guidance Service.
Kendeou, P., van den Broek, P., White, M. J., & Lynch, J. S. (2009). Predicting readingcomprehension in early elementary school: The independent contributions of orallanguage and decoding skills. Journal of Educational Psychology, 101(4), 765–778.https://doi.org/10.1037/a0015956.
Keuken, M. C., Hardie, A., Dorn, B. T., Dev, S., Paulus, M. P., Jonas, K. J., ... Pineda, J. A.(2011). The role of the left inferior frontal gyrus in social perception: An rTMS study.Brain Research, 1383, 196–205. https://doi.org/10.1016/j.brainres.2011.01.073.
Kim, Y.-S., Park, C. H., & Wagner, R. K. (2014). Is oral/text reading fluency a “bridge” toreading comprehension? Reading and Writing, 27(1), 79–99. https://doi.org/10.1007/s11145-013-9434-7.
Krishnan, A., Williams, L. J., McIntosh, A. R., & Abdi, H. (2011). Partial Least Squares(PLS) methods for neuroimaging: A tutorial and review. NeuroImage, 56(2), 455–475.https://doi.org/10.1016/j.neuroimage.2010.07.034.
Language and Reading Research Consortium, & Logan, J. (2017). Pressure points inreading comprehension: A quantile multiple regression analysis. Journal ofEducational Psychology, 109(4), 451–464. http://doi.org/10.1037/edu0000150.
Liakakis, G., Nickel, J., & Seitz, R. J. (2011). Diversity of the inferior frontal gyrus—Ameta-analysis of neuroimaging studies. Behavioural Brain Research, 225(1), 341–347.
https://doi.org/10.1016/j.bbr.2011.06.022.Lund, K., & Burgess, C. (1996). Producing high-dimensional semantic spaces from lexical
co-occurrence. Behavior Research Methods, Instruments, & Computers, 28(2), 203–208.https://doi.org/10.3758/BF03204766.
MacDonald, A. W., Cohen, J. D., Stenger, V. A., & Carter, C. S. (2000). Dissociating therole of the dorsolateral prefrontal and anterior cingulate cortex in cognitive control.Science, 288(5472), 1835–1838. https://doi.org/10.1126/science.288.5472.1835.
Malins, J. G., Gumkowski, N., Buis, B., Molfese, P., Rueckl, J. G., Frost, S. J., ... Mencl, W.E. (2016). Dough, tough, cough, rough: A “fast” fMRI localizer of component pro-cesses in reading. Neuropsychologia, 91, 394–406. https://doi.org/10.1016/j.neuropsychologia.2016.08.027.
Martin, A., Schurz, M., Kronbichler, M., & Richlan, F. (2015). Reading in the brain ofchildren and adults: A meta-analysis of 40 functional magnetic resonance imagingstudies. Human Brain Mapping, 36(5), 1963–1981. https://doi.org/10.1002/hbm.22749.
McCandliss, B. D., Cohen, L., & Dehaene, S. (2003). The visual word form area: Expertisefor reading in the fusiform gyrus. Trends in Cognitive Sciences, 7(7), 293–299. https://doi.org/10.1016/S1364-6613(03)00134-7.
McIntosh, A. R., & Bookstein, F. L. (2015). Partial Least Squares Analysis SoftwarePackage. Toronto: Rotman Research Institute. Retrieved from https://www.rotman-baycrest.on.ca/index.php?section=84.
McIntosh, A. R., Bookstein, F. L., Haxby, J. V., & Grady, C. L. (1996). Spatial patternanalysis of functional brain images using partial least squares. NeuroImage, 3,143–157.
Moss, J., & Schunn, C. D. (2015). Comprehension through explanation as the interactionof the brain’s coherence and cognitive control networks. Frontiers in HumanNeuroscience, 9(October), 1–17. https://doi.org/10.3389/fnhum.2015.00562.
Nation, K., & Snowling, M. J. (1999). Developmental differences in sensitivity to semanticrelations among good and poor comprehenders: Evidence from semantic priming.Cognition, 70(1), 4–9. https://doi.org/10.1016/S0010-0277(99)00004-9.
Newman, S. D., Ikuta, T., & Burns, T., Jr. (2010). The effect of semantic relatedness onsyntactic analysis: An fMRI study. Brain and Language, 113(2), 51–58. https://doi.org/10.1016/j.bandl.2010.02.001.
Niendam, T. A., Laird, A. R., Ray, K. L., Dean, Y. M., Glahn, D. C., & Carter, C. S. (2012).Meta-analytic evidence for a superordinate cognitive control network subservingdiverse executive functions. Cognitive, Affective and Behavioral Neuroscience, 12(2),241–268. https://doi.org/10.3758/s13415-011-0083-5.
Nouchi, R., Takeuchi, H., Taki, Y., Sekiguchi, A., Kotozaki, Y., Nakagawa, S., ...Kawashima, R. (2016). Neuroanatomical bases of effortful control: Evidence from alarge sample of young healthy adults using voxel-based morphometry. ScientificReports, 6(July), 1–8. https://doi.org/10.1038/srep31231.
Oakhill, J. V., & Cain, K. E. (2012). The precursors of reading ability in young readers:Evidence from a four-year longitudinal study. Scientific Studies of Reading, 16(2),91–121. https://doi.org/10.1080/10888438.2010.529219.
Oakhill, J. V., Hartt, J., & Samols, D. (2005). Levels of comprehension monitoring andworking memory in good and poor comprehenders. Reading and Writing, 18(7–9),657–686. https://doi.org/10.1007/s11145-005-3355-z.
Perfetti, C. A., & Hogaboam, T. (1975). Relationship between single word decoding andreading comprehension skill. Journal of Educational Psychology, 67(4), 461–469.https://doi.org/10.1037/h0077013.
Rodd, J. M., Vitello, S., Woollams, A. M., & Adank, P. (2015). Localising semantic andsyntactic processing in spoken and written language comprehension: An activationlikelihood estimation meta-analysis. Brain and Language, 141, 89–102. https://doi.org/10.1016/j.bandl.2014.11.012.
Rogers, T. T., Hocking, J., Noppeney, U., Mechelli, A., Gorno-Tempini, M. L., Patterson,K., & Price, C. J. (2006). Anterior temporal cortex and semantic memory: Reconcilingfindings from neuropsychology and functional imaging. Cognitive, Affective, &Behavioral Neuroscience, 6(3), 201–213. https://doi.org/10.3758/CABN.6.3.201.
Rota, G., Sitaram, R., Veit, R., Erb, M., Weiskopf, N., Dogil, G., & Birbaumer, N. (2009).Self-regulation of regional cortical activity using real-time fMRI: The right inferiorfrontal gyrus and linguistic processing. Human Brain Mapping, 30(5), 1605–1614.https://doi.org/10.1002/hbm.20621.
Rueckl, J. G., Paz-Alonso, P. M., Molfese, P. J., Kuo, W.-J., Bick, A., Frost, S. J., ... Frost, R.(2015). Universal brain signature of proficient reading: Evidence from four con-trasting languages. Proceedings of the National Academy of Sciences, 112(50),15510–15515. https://doi.org/10.1073/pnas.1509321112.
Sesma, H. W., Mahone, E. M., Levine, T., Eason, S. H., & Cutting, L. E. (2009). Thecontribution of executive skills to reading comprehension. Child Neuropsychology,15(3), 232–246. https://doi.org/10.1080/09297040802220029.THE.
Shankweiler, D., Mencl, W. E., Braze, D., Tabor, W., Pugh, K. R., & Fulbright, R. K. (2008).Reading differences and brain: Cortical integration of speech and print in sentenceprocessing varies with reader skill. Developmental Neuropsychology, 33(6), 745–775.https://doi.org/10.1080/87565640802418688.
Silva, M., & Cain, K. E. (2015). The relations between lower and higher level compre-hension skills and their role in prediction of early reading comprehension. Journal ofEducational Psychology, 107(2), 321–331. https://doi.org/10.1037/a0037769.
Sparks, R., & Patton, J. (2016). Examining the simple view of reading model for unitedstates high school spanish students. Hispania, 99(1), 17–33. https://doi.org/10.1353/hpn.2016.0012.
Spitsyna, G., Warren, J. E., Scott, S. K., Turkheimer, F. E., & Wise, R. J. S. (2006).Converging language streams in the human temporal lobe. Journal of Neuroscience,26(28), 7328–7336. https://doi.org/10.1523/JNEUROSCI.0559-06.2006.
Talairach, J., & Tournoux, P. (1988). A co-planar stereotaxic atlas of a human brain.Stuttgart: Thieme.
Taylor, J. S. H., Rastle, K., & Davis, M. H. (2013). Can cognitive models explain brainactivation during word and pseudoword reading? A meta-analysis of 36
K. Ryherd et al. Brain and Language 186 (2018) 32–43
42
neuroimaging studies. Psychological Bulletin, 139(4), 766–791. https://doi.org/10.1037/a0030266.
Tighe, E. L., & Schatschneider, C. (2014). A dominance analysis approach to determiningpredictor importance in third, seventh, and tenth grade reading comprehension skills.Reading and Writing, 27(1), 101–127. https://doi.org/10.1007/s11145-013-9435-6.
Tops, M., & Boksem, M. A. S. (2011). A potential role of the inferior frontal gyrus andanterior insula in cognitive control, brain rhythms, and event-related potentials.Frontiers in Psychology, 2(November), 1–14. https://doi.org/10.3389/fpsyg.2011.00330.
Tunmer, W. E., & Chapman, J. W. (2012). The simple view of reading redux: vocabularyknowledge and the independent components hypothesis. Journal of LearningDisabilities, 45(5), 453–466. https://doi.org/10.1177/0022219411432685.
Van Ettinger-Veenstra, H., McAllister, A., Lundberg, P., Karlsson, T., & Engström, M.(2016). Higher language ability is related to angular gyrus activation increase duringsemantic processing, independent of sentence incongruency. Frontiers in HumanNeuroscience, 10(March), 110. https://doi.org/10.3389/fnhum.2016.00110.
Verhoeven, L., & van Leeuwe, J. (2008). Prediction of the development of reading com-prehension: A longitudinal study. Applied Cognitive Psychology, 22(3), 407–423.https://doi.org/10.1002/acp.1414.
Visser, M., Jefferies, E., & Lambon Ralph, M.a. (2010). Semantic processing in the anteriortemporal lobes: A meta-analysis of the functional neuroimaging literature. Journal ofCognitive Neuroscience, 22(6), 1083–1094. https://doi.org/10.1162/jocn.2009.21309.
Wang, X., Yang, J., Yang, J., Mencl, W. E., Shu, H., & Zevin, J. D. (2015). Language
differences in the brain network for reading in naturalistic story reading and lexicaldecision. PloS One, 10(5), e0124388. https://doi.org/10.1371/journal.pone.0124388.
Wechsler, D., & Hsiao-pin, C. (2011). WASI-II: Wechsler abbreviated scale of intelligence.Pearson.
Wehbe, L., Murphy, B., Talukdar, P., Fyshe, A., Ramdas, A., & Mitchell, T. (2014).Simultaneously uncovering the patterns of brain regions involved in different storyreading subprocesses. PLoS ONE, 9(11), e112575. https://doi.org/10.1371/journal.pone.0112575.
Welcome, S. E., & Joanisse, M. F. (2012). Individual differences in skilled adult readersreveal dissociable patterns of neural activity associated with component processes ofreading. Brain and Language, 120(3), 360–371. https://doi.org/10.1016/j.bandl.2011.12.011.
Wise, J. C., Sevcik, R. A., Morris, R. D., Lovett, M. W., & Wolf, M. (2007). The relationshipamong receptive and expressive vocabulary, listening comprehension, pre-readingskills, word identification skills, and reading comprehension by children with readingdisabilities. Journal of Speech Language and Hearing Research, 50(4), 1093. https://doi.org/10.1044/1092-4388(2007/076).
Woodcock, R. W., McGrew, K. S., Mather, N., & Schrank, F. (2001). Woodcock-Johnson IIINU Tests of Achievement. Rolling Meadows, IL: Riverside Publishing.
Yarkoni, T., Speer, N. K., & Zacks, J. M. (2008). Neural substrates of narrative compre-hension and memory. NeuroImage, 41(4), 1408–1425. https://doi.org/10.1016/j.neuroimage.2008.03.062.
K. Ryherd et al. Brain and Language 186 (2018) 32–43
43