cortical inputs to the middle temporal visual area in new...
15
© 2015 Cerkevich et al. This work is published by Dove Medical Press Limited, and licensed under Creative Commons Attribution – Non Commercial (unported, v3.0) License. The full terms of the License are available at http://creativecommons.org/licenses/by-nc/3.0/. Non-commercial uses of the work are permitted without any further permission from Dove Medical Press Limited, provided the work is properly attributed. Permissions beyond the scope of the License are administered by Dove Medical Press Limited. Information on how to request permission may be found at: http://www.dovepress.com/permissions.php Eye and Brain 2015:7 1–15 Eye and Brain Dovepress submit your manuscript | www.dovepress.com Dovepress 1 ORIGINAL RESEARCH open access to scientific and medical research Open Access Full Text Article http://dx.doi.org/10.2147/EB.S69713 Cortical inputs to the middle temporal visual area in New World owl monkeys Christina M Cerkevich 1 Christine E Collins 2 Jon H Kaas 2 1 Center for the Neural Basis of Cognition and Systems Neuroscience Institute, University of Pittsburgh School of Medicine, Pittsburgh, PA, USA; 2 Department of Psychology, Vanderbilt University, Nashville, TN, USA Correspondence: Jon H Kaas Department of Psychology, Vanderbilt University, 301 David K Wilson Hall, 111 21st Avenue South, Nashville, TN 37203, USA Tel +1 615 322 6029 Fax +1 615 343 8449 Email [email protected] Abstract: We made eight retrograde tracer injections into the middle temporal visual area (MT) of three New World owl monkeys (Aotus nancymaae). These injections were placed across the representation of the retina in MT to allow us to compare the locations of labeled cells in other areas in order to provide evidence for any retinotopic organization in those areas. Four regions projected to MT: 1) early visual areas, including V1, V2, V3, the dorsolateral visual area, and the dorsomedial visual area, provided topographically organized inputs to MT; 2) all areas in the MT complex (the middle temporal crescent, the middle superior temporal area, and the fundal areas of the superior temporal sulcus) projected to MT. Somewhat variably across injec- tions, neurons were labeled in other parts of the temporal lobe; 3) regions in the location of the medial visual area, the posterior parietal cortex, and the lateral sulcus provided other inputs to MT; 4) finally, projections from the frontal eye field, frontal visual field, and prefrontal cortex were also labeled by our injections. These results further establish the sources of input to MT, and provide direct evidence within and across cases for retinotopic patterns of projections from early visual areas to MT. Keywords: middle temporal area, visual cortex, parietal cortex Introduction In the present study, we revealed the ipsilateral cortical connections of the middle temporal visual area (MT) of owl monkeys by making up to three injections of differ- ent tracers within the area. MT was the first of the extrastriate visual areas in primates, after the second visual area, V2, to be established by microelectrode mapping of its retinotopic organization in relation to cortical architecture. 1–3 MT is now known to be involved in motion perception and 4–9 directing pursuit eye movements 10,11 and as a key area in the dorsal stream of visuomotor processing. 12–14 MT proved to be particularly easy to identify because of its dense myelination and expression of cytochrome oxidase (CO) in comparison with adjoining cortex. As a result, the connections of MT with other areas of cortex have been extensively studied across a range of primate species, with considerable agreement across studies on the major MT connections with other cortical areas and regions. 15–23 The connections revealed by injections of tracers in MT are generally consistent with those MT connections revealed by injections in other areas of cortex. 24–27 We sought to add to this accumulation of evidence on the connections of MT in primates in several ways. First, interpretations of the organization of extrastriate visual cortex have continued to evolve, and the connection patterns can now be related to more recent understandings. For example, there is now considerable evidence for a single
Transcript of cortical inputs to the middle temporal visual area in new...
© 2015 Cerkevich et al. This work is published by Dove Medical Press Limited, and licensed under Creative Commons Attribution – Non Commercial (unported, v3.0) License. The full terms of the License are available at http://creativecommons.org/licenses/by-nc/3.0/. Non-commercial uses of the work are permitted without any further
permission from Dove Medical Press Limited, provided the work is properly attributed. Permissions beyond the scope of the License are administered by Dove Medical Press Limited. Information on how to request permission may be found at: http://www.dovepress.com/permissions.php
Eye and Brain 2015:7 1–15
Eye and Brain Dovepress
submit your manuscript | www.dovepress.com
Dovepress 1
O r i g i n a l r E s E a r c h
open access to scientific and medical research
Open access Full Text article
http://dx.doi.org/10.2147/EB.S69713
cortical inputs to the middle temporal visual area in new World owl monkeys
christina M cerkevich1
christine E collins2
Jon h Kaas2
1center for the neural Basis of cognition and systems neuroscience institute, University of Pittsburgh school of Medicine, Pittsburgh, Pa, Usa; 2Department of Psychology, Vanderbilt University, nashville, Tn, Usa
correspondence: Jon h Kaas Department of Psychology, Vanderbilt University, 301 David K Wilson hall, 111 21st avenue south, nashville, Tn 37203, Usa Tel +1 615 322 6029 Fax +1 615 343 8449 Email [email protected]
Abstract: We made eight retrograde tracer injections into the middle temporal visual area (MT)
of three New World owl monkeys (Aotus nancymaae). These injections were placed across the
representation of the retina in MT to allow us to compare the locations of labeled cells in other
areas in order to provide evidence for any retinotopic organization in those areas. Four regions
projected to MT: 1) early visual areas, including V1, V2, V3, the dorsolateral visual area, and
the dorsomedial visual area, provided topographically organized inputs to MT; 2) all areas in
the MT complex (the middle temporal crescent, the middle superior temporal area, and the
fundal areas of the superior temporal sulcus) projected to MT. Somewhat variably across injec-
tions, neurons were labeled in other parts of the temporal lobe; 3) regions in the location of the
medial visual area, the posterior parietal cortex, and the lateral sulcus provided other inputs to
MT; 4) finally, projections from the frontal eye field, frontal visual field, and prefrontal cortex
were also labeled by our injections. These results further establish the sources of input to MT,
and provide direct evidence within and across cases for retinotopic patterns of projections from
early visual areas to MT.
Keywords: middle temporal area, visual cortex, parietal cortex
IntroductionIn the present study, we revealed the ipsilateral cortical connections of the middle
temporal visual area (MT) of owl monkeys by making up to three injections of differ-
ent tracers within the area. MT was the first of the extrastriate visual areas in primates,
after the second visual area, V2, to be established by microelectrode mapping of its
retinotopic organization in relation to cortical architecture.1–3 MT is now known to be
involved in motion perception and4–9 directing pursuit eye movements10,11 and as a key
area in the dorsal stream of visuomotor processing.12–14 MT proved to be particularly
easy to identify because of its dense myelination and expression of cytochrome oxidase
(CO) in comparison with adjoining cortex. As a result, the connections of MT with
other areas of cortex have been extensively studied across a range of primate species,
with considerable agreement across studies on the major MT connections with other
cortical areas and regions.15–23 The connections revealed by injections of tracers in MT
are generally consistent with those MT connections revealed by injections in other
areas of cortex.24–27
We sought to add to this accumulation of evidence on the connections of MT in
primates in several ways. First, interpretations of the organization of extrastriate visual
cortex have continued to evolve, and the connection patterns can now be related to more
recent understandings. For example, there is now considerable evidence for a single
Eye and Brain 2015:7submit your manuscript | www.dovepress.com
Dovepress
Dovepress
2
cerkevich et al
V3 with dorsal and ventral halves in primates, rather than a
dorsal V3 and a ventral V3 (see Lyon and Connolly28), and
the relation of MT to adjoining areas including the middle
temporal crescent (MTc or V4t), the middle superior temporal
area (MST), and the dorsal and ventral fundal areas of the
superior temporal sulcus (FSTd and FSTv, respectively) is
better understood.23,25 Furthermore, it is possible to inject
several different retrograde tracers into different retinotopic
locations in MT, thereby revealing the existence of retinotopic
patterns of input connections, although this has not been done
previously. Finally, strengths of MT connections have only
been quantified in one previous study on marmosets,21 and
quantifications of connections are needed for comparison
with other primates.
In the present study, we investigated the possibility of
retinotopic patterns of MT connections with other cortical
areas by placing injections of two or three distinguishable
tracers in separate locations in MT of three owl monkeys.
The results were analyzed from brain sections cut parallel to
the surface of manually flattened cortex in order to obtain the
most accurate portrayal of connection patterns. These con-
nection patterns were then related to cortical architecture and
assigned to cortical fields, based on present understandings of
the arrangement of cortical areas in owl monkeys and other
primates. In particular, we include both a V3 and a dorso-
medial visual area (DM), following Lyon and Connolly,28
although other models remain viable.29,30 Counts of labeled
cortical neurons were compared across cortical areas and
regions for each MT injection. The results help establish the
connection pattern of MT in primates, and provide compel-
ling evidence that the early visual areas V1, V2, V3, the
dorsolateral visual area (DL or V4), and DM have retinotopi-
cally congruent connections with MT.
MethodsThree adult owl monkeys (Aotus nancymaae) were used
in this study. The experimental procedures were approved
by the Vanderbilt University Animal Care and Use
Committee and adhered to National Institutes of Health
guidelines. All surgical procedures were performed under
aseptic conditions.
surgical procedure and tracer injectionEach animal was anesthetized with an initial injection of
ketamine hydrochloride (10–50 mg/kg, intramuscularly),
intubated, and maintained on 2% isoflurane anesthesia for the
duration of the surgical procedure. Heart rate, blood oxygen
levels, and temperature were monitored throughout the pro-
cedure. Each monkey was placed on a heating pad or under
a heating lamp to maintain the body temperature at 37°C. A
local anesthetic, lidocaine hydrochloride, was applied to the
ears and subcutaneous skin before the animal was placed into
a stereotaxic frame. The skin was incised to expose the skull.
A craniotomy was performed to expose the caudal tip of the
superior temporal sulcus and surrounding cortex. Once the
dura was dissected, the exposed cortex was kept moist with
the application of sterile saline.
The location of MT was estimated relative to the loca-
tion of the caudal tip of the superior temporal sulcus,1,31 and
later confirmed anatomically through tissue processing for
myelinated fibers and CO and reconstruction. Each injection
of anatomical tracer was made using a Hamilton syringe
mounted on a stereotaxic arm with glass micropipette tip
attached to the syringe with epoxy. In each case, up to three
distinguishable tracers, including 0.5–0.6 µL of cholera toxin
subunit B (CTB) (1% CTB in distilled water; Sigma-Aldrich
Co, St Louis, MO, USA); 0.25–0.5 µL of diamidino yellow
(DY) (2% DY in 0.1 M phosphate buffer; Sigma-Aldrich
Co); and 0.5–0.6 µL of Fluoro-Ruby (FR) (10% FR in dis-
tilled water; Molecular Probes®; Thermo Fisher Scientific,
Waltham, MA, USA), were pressure-injected 0.5–1 mm
below the cortical surface. Injection site locations were
chosen with the goal to place the different tracers across
the full extent of MT, thus covering different regions of the
retinotopic map in this area (Figure 1).
Following the injections, gel film was inserted to replace
the opened dura, the craniotomy closed with dental cement,
and the skin sutured shut. The animal was then recovered
from anesthesia, treated with prophylactic antibiotics and
analgesics, and returned to its home cage for the duration of
the survival period. Seven days after the tracer injections,
the monkeys were deeply anesthetized with an injection of
sodium pentobarbital (80 mg/kg), and, once areflexive, per-
fused through the heart with phosphate-buffered saline (pH
7.4) followed by 2% paraformaldehyde in phosphate buffer
and 2% paraformaldehyde with 10% sucrose in phosphate
buffer.
The cortex was separated from the rest of the brain and
flattened as previously described.20,32 Each flattened cortex
was held between two glass slides and stored overnight for
cryoprotection in 30% sucrose at 4°C.
Tissue processingThe cortex of the injected hemisphere was cut tangential to
the surface at a thickness of 40 µm on a freezing microtome.
In all cases, alternate series of sections were mounted
Eye and Brain 2015:7 submit your manuscript | www.dovepress.com
Dovepress
Dovepress
3
cortical input to MT
unstained for fluorescence microscopy, processed to reveal
myelinated fibers with modified silver staining,33 and reacted
with standard methods to reveal the distribution of CO.34
When appropriate, a series of sections was processed with
CTB immunohistochemistry to reveal CTB injection sites
and labeled cells.35,36
Data analysisLocations and extent of injection sites and distributions of
neurons filled by each tracer injection were plotted for the
injected hemisphere with a fluorescent/bright-field Leitz
microscope coupled to an X, Y encoder (Leica Microsystems,
Wetzlar, Germany) and a Macintosh G3 computer (Apple
Inc., Cupertino, CA, USA) running IGOR Pro™ software
(WaveMetrics, Inc., Portland, OR, USA). Blood vessels and
other landmarks were also marked on the plots for later use
during alignment and reconstruction. Digital photomicro-
graphs of sections stained to reveal cortical architecture,
ie, those stained for myelinated fibers and CO, were taken
using a Nikon DXM1200 camera mounted on a Nikon E800
microscope (Nikon Instruments, Melville, NY, USA). These
digital images were then adjusted for contrast, saturation,
lightness, and curves with Adobe Photoshop CS2™ (Adobe
Systems Incorporated, San Jose, CA, USA), but were not
otherwise altered.
relating labeled neurons to cortical areasTo the extent possible, the boundaries of cortical areas were
determined architectonically from individual brain sections
as shown in Figure 1, and compiled and compared from
sections processed for CO or myelin across the depth of
cortex. These results and the location of labeled neurons in
plotted sections were related to a single favorable section by
drawing a reference section with a projection microscope,
outlining cortex and including areal borders, sulcal patterns,
and local landmarks such as blood vessels and injection holes
(Figure 1). These landmarks were used to locally align results
from adjacent sections and others to the reference section.
The architectonic results allowed us to identify borders of
MT, primary visual cortex (V1), and primary somatosensory
cortex (area 3b) with a high degree of certainty. The borders
of other areas of the MT complex (MST, MTc, and FST) were
all outside the clear MT border and at least partly confirmed
by architecture, as well as being consistent with previous
estimates.25 The border of V2 with V1 was always obvious,
and the outer border was variably apparent, but otherwise
placed at estimated width of V2.20 The architectonic borders
of V3 and DM were less apparent, and largely estimated from
previous reports.32,37,38 DL borders were limited by location
between MTc and V3, and upper and lower borders were
estimated from previous reports.39–41 The approximate loca-
tions of other areas do not include boundaries, but conform
to previously identified locations.20,42,43 Reconstructions of
areal borders and locations, together with plots of labeled
neurons, were created with Adobe Illustrator™ CS2 and
CS5™ (Adobe Systems Incorporated). The numbers of
labeled cells in each area was determined using the counting
function in Adobe Illustrator.
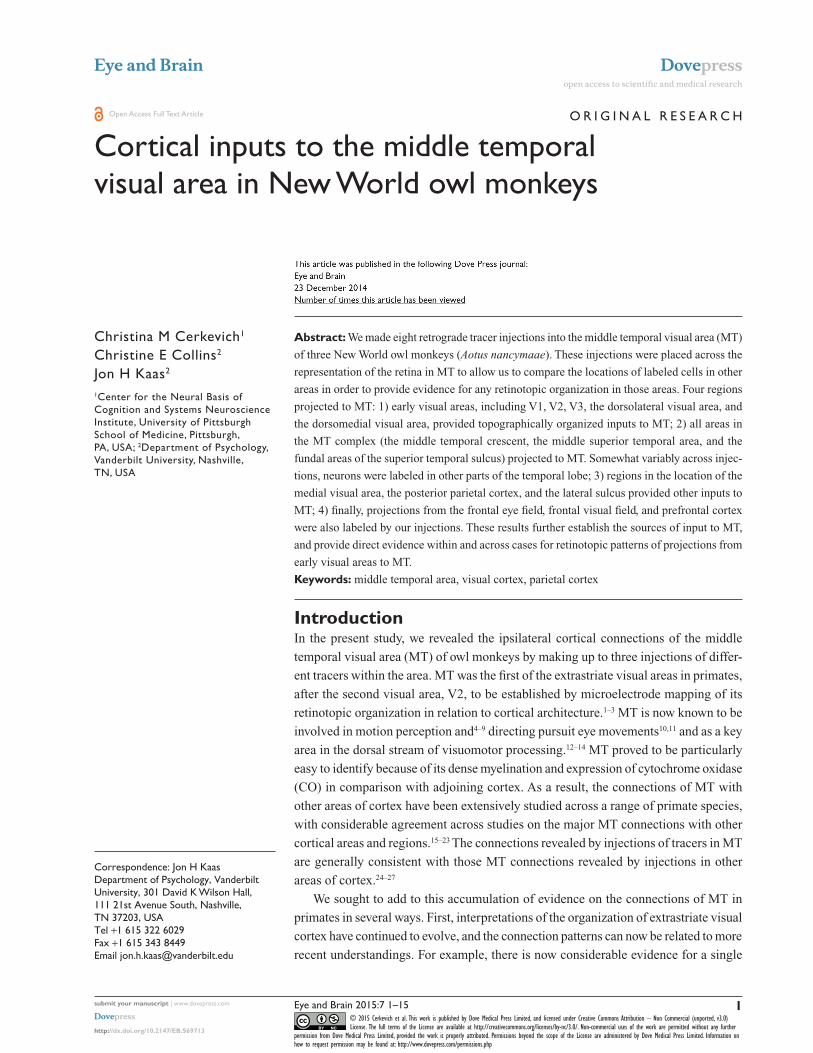
Figure 1 histology of MT and locations of injection sites.Notes: (A and B) Photomicrographs of the MT complex as revealed by staining for myelinated fibers (A) and cO (B) in case 1. Dashed lines are the reconstructed borders of the areas in the MT complex in this case. Because these borders were reconstructed using all sections through the depth of cortex, they cannot be perfectly aligned with those visible in any single section. Arrowheads indicate tissue damaged as a result of each of the three injections. In flattened cortex, MT is indicated by heavy staining for myelinated fibers and CO around the caudal tip of the more lightly stained STS. Scale bars are 2 mm. (C) The locations of injection sites in MT. solid lines are the borders of areas drawn by aligning all three cases. The visual field coordinates in MT are based on the accepted map of visual space in MT and the locations of labeled cells in V1. Dashed lines indicate the estimated locations of the horizontal meridian (thick) and the representations of central (caudal) and peripheral (rostral) vision at 20° of visual space (fine). The upper visual field (+) is represented laterally, and the lower visual field (-) medially. Markers are the locations of the injections in each case: case 1= stars, case 2= squares, case 3= circles. The shade of each marker indicates the type of tracer: cholera toxin subunit B = white, Fluoro-ruby = dark gray, diamidino yellow = light gray. rostral is left and medial is up. Abbreviations: cO, cytochrome oxidase; FsTd, dorsal fundal area of the superior temporal sulcus; FsTv, ventral fundal area of the superior temporal sulcus; MsT, middle superior temporal area; MT, middle temporal visual area; MTc, middle temporal crescent; sTs, superior temporal sulcus.

Eye and Brain 2015:7submit your manuscript | www.dovepress.com
Dovepress
Dovepress
4
cerkevich et al
ResultsThree different tracers were placed in different locations in MT
of two owl monkeys, and two were placed in MT of a third owl
monkey. Cortex was flattened, and cut parallel to the surface so
that labeled neurons could be related to locations in and around
cortical areas. The collective results identify a number of areas
or regions with neurons projecting to MT, and provide evidence
about the visuotopic organization of visual areas.
case 1Injections of three distinct tracers were placed in different
regions of MT in case 1 (Figure 1C [stars]). The injection
locations were identified in the processed brain sections by
the slight damage made by the injection syringe. DY was
injected medially in MT, into the central representation of the
lower field (Figure 2A). The diffusion zone around the core
of this DY injection did not extend to either the horizontal
meridian (HM) or vertical meridian (VM). An injection of FR
was placed rostral to the DY injection in the lower field rep-
resentation near MT’s representation of the HM (Figure 2B).
This FR injection was the only injection in the peripheral
visual representation in case 1. Finally, a CTB injection was
placed in the representation of the far central upper visual
field, just within 20° of visual space. While this injection was
centered closer to the representation of the HM, the core of
the injection was ovoid in shape, and stretched across much
of the central visual representation from the HM toward the
representation of the VM that lies along the lateral border of
MT. This injection may have involved the white matter.
In case 1, DY was injected medial and caudal to the other
injections, centering it in the representation of the central
lower field (Figure 2A). Early visual areas, including V1, V2,
V3, DL or V4, and DM, all contained labeled cells following
the injection in MT. The neurons filled with DY were con-
centrated in lower field representations in areas with known
retinotopic maps, thus matching the retinotopic location
of the DY injection in MT. Many cells were labeled within
MT (Table 1), as well as in associated areas within the MT
complex, including MTc or V4t, MST, and FST. In FST, DY-
labeled neurons were concentrated in the dorsal subdivision
(FSTd). The lower visual field DY injection revealed projec-
tions from regions around the inferior occipital sulcus and
rostral tip of the superior temporal sulcus to MT in the inferior
temporal cortex (IT). In the posterior parietal cortex (PPC),
DY-labeled cells sat caudally along the border with DM, in
a patchy field that extended from the medial visual area (M)
to the tip of the lateral sulcus. This region of the owl monkey
PPC may correspond to the lateral intraparietal area (LIP)
or ventral intraparietal area (VIP), or possibly a region, with
known inputs to MT in macaques.17,26 A few DY-labeled cells
were also found in a region of frontal cortex that included the
frontal eye field (FEF) and frontal visual area (FV).
While the FR injection in case 1 was centered in the
peripheral upper field near the MT representation of the
HM, it spread rostrodorsally to include more of the temporal
visual space, and slightly ventrally, ultimately crossing the
HM (Figure 2B [red]). Cells filled as a result of this injection
were found across V1, V2, V3, DL, MT, MTc, MST, and FST
in a manner similar to those resulting from the DY and CTB
injections in case 1. As with the other injections, FR-filled
cells in areas with known retinotopic maps revealed organized
projections to area MT. For example, FR-labeled neurons
were found in both the upper and lower peripheral visual field
representations in V1. Furthermore, they sat caudally away
from the representation of the VM along the V1/V2 border.
In addition to the early visual areas and divisions of the MT
complex, FR-labeled cells indicated projections from a region
near the inferior occipital sulcus, M, and the PPC. The FR
injection was the smallest of the three injections in case 1,
and may not have included the layers receiving the strongest
projections from other cortical areas. This likely explains the
overall lower number of labeled cells resulting from the FR
injection (Table 1), as well as the more confined distribution
of backfilled cells that did not include the frontal cortex.
Neurons filled as a result of the case 1 central upper field
CTB injection were distributed across visual areas, as well as
in parietal and frontal cortex (not shown). While the increased
number of cells labeled by the case 1 CTB injection and the
scattered nature of the resulting filled neurons suggested that
this injection may have included passing fibers in the white
matter, the overall distribution of CTB cells was otherwise
similar to those labeled after the case 1 DY and FR injections
(Table 1). This included projections from V1, V2, V3, DL,
and DM, where the concentration of CTB-labeled neurons sat
more ventrally when compared to the more dorsal distribu-
tion of backfilled DY cells. A lower number of CTB-labeled
cells were found in the lower field representations in each of
these areas, likely due to diffusion of the tracer to and slightly
across the HM in MT. Again, there were many intrinsic con-
nections within MT. Backfilled CTB cells were also found
in MTc, MST, and FST. Neurons filled with CTB as a result
of the case 1 injection were distributed broadly throughout
the rest of the temporal cortex with denser foci around the
inferior occipital sulcus, within the superior temporal sulcus,
and throughout IT, particularly near the polar division of this
region (ITp) rostral to the tip of the superior temporal sulcus.
Eye and Brain 2015:7 submit your manuscript | www.dovepress.com
Dovepress
Dovepress
5
cortical input to MT
Figure 2 The distribution of cells labeled by the injections in case 1.Notes: (A) The distribution of DY-labeled cells in case 1. Thin black lines are anatomical borders. Thick black lines indicate the edges of the sections and tears. sulci are shaded in gray. anatomical boundaries were determined from adjacent sections stained for myelin and cO, and from measurements based on previously published studies where these were unclear. The dashed line denotes location of the horizontal meridian estimated from descriptions of its location throughout the literature on the cortical visual system and based on the distribution of our labeled cells. (B) The distribution of FR (red)-labeled cells in case 1. These two fluorescent tracers were plotted on the same sections, but are shown separately to better show the locations of labeled cells in regions where there is a high degree of overlap. Each yellow triangle or red square represents a single DY- or FR-filled neuron, respectively. The injection cores and full extent of the surrounding diffusion zone are outlined in matching colors, with the core more heavily shaded. The overall distribution of cells was similar after all injections in case 1, with neurons in V1, V2, V3, Dl, MT, MTc, MsT, FsT, M, PPc, and the inferior temporal and frontal cortices. comparing the locations of labeled cells resulting from each injection, it is evident that retinotopically organized visual areas send organized projections to MT. rostral is left and medial is up. scale bars are 5 mm. “-” indicates the lower visual field, and “+” the upper visual field. “1” and “2” are the caudal somatosensory areas. “3a” is the rostral somatosensory area, and “3b” the primary somatosensory area.Abbreviations: a1, primary auditory area; cO, cytochrome oxidase; Dl, dorsolateral visual area; DM, dorsomedial visual area; DY, diamidino yellow; FEF, frontal eye field; FR, Fluoro-Ruby; FST, fundal area of the superior temporal sulcus; FSTd, dorsal fundal area of the superior temporal sulcus; FSTv, ventral fundal area of the superior temporal sulcus; FV, frontal visual area; iOs, inferior occipital sulcus; iTc, caudal inferior temporal cortex; iTm, medial inferior temporal cortex; iTp, polar inferior temporal cortex; iTr, rostral inferior temporal cortex; ls, lateral sulcus; M, medial visual area; M1, primary motor area; MsT, middle superior temporal area; MT, middle temporal visual area; MTc, middle temporal crescent; PMd, dorsal premotor area; PMv, ventral premotor area; PPc, posterior parietal cortex; PV, parietal ventral area; R, rostral auditory area; S2, secondary somatosensory area; SMA, supplementary motor area; STS, superior temporal sulcus; V1, first visual area; V2, second visual area; V3, third visual area.
In the parietal lobe, CTB-labeled cells were concentrated in
M and much of the rest of the PPC. Foci of backfilled neurons
were found in both the lower and upper banks of the lateral
sulcus, though they tended to be collected caudally. While
CTB-labeled neurons were distributed throughout the frontal
cortex, they were concentrated in the FEF/FV region. There
was also a focus of filled cells in the opercular prefrontal
frontal cortex (PFC), in the region that may encompass the
precentral opercular cortex (area PrCO), area 12/45, and area
47 of similar New World marmoset monkeys.44–46
Eye and Brain 2015:7submit your manuscript | www.dovepress.com
Dovepress
Dovepress
6
cerkevich et al
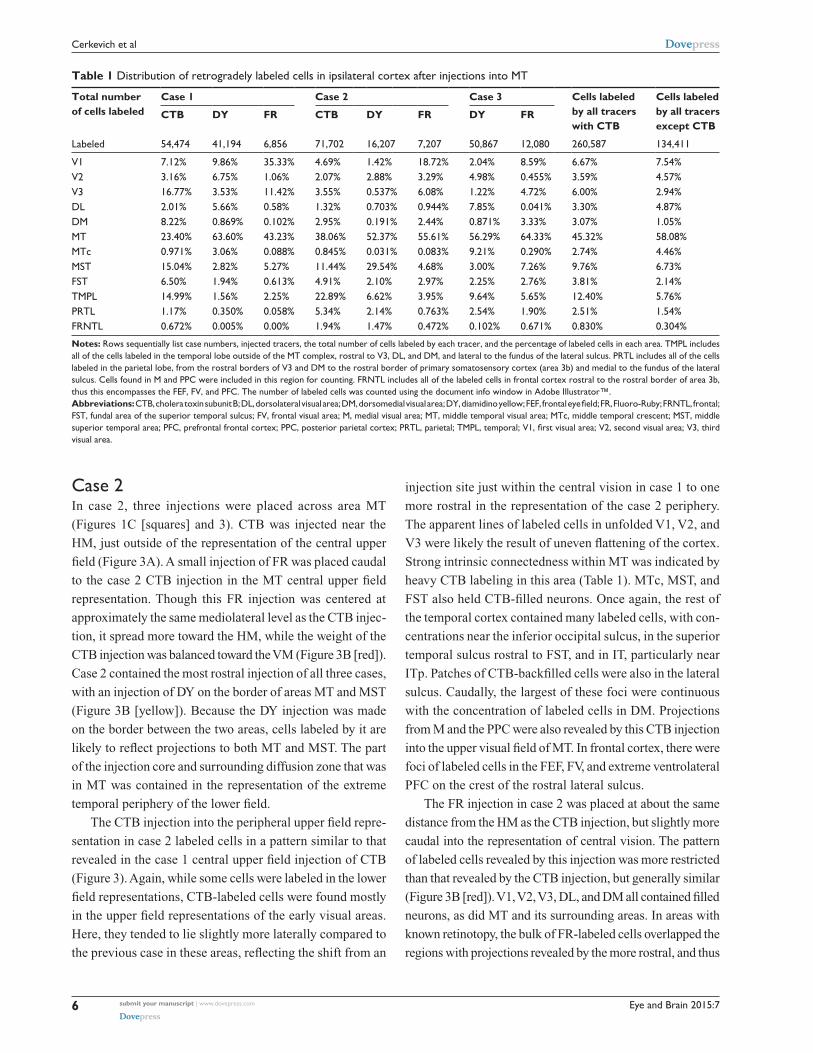
Table 1 Distribution of retrogradely labeled cells in ipsilateral cortex after injections into MT
Total number of cells labeled
Case 1 Case 2 Case 3 Cells labeled by all tracers with CTB
Cells labeled by all tracers except CTB
CTB DY FR CTB DY FR DY FR
labeled 54,474 41,194 6,856 71,702 16,207 7,207 50,867 12,080 260,587 134,411
V1 7.12% 9.86% 35.33% 4.69% 1.42% 18.72% 2.04% 8.59% 6.67% 7.54%V2 3.16% 6.75% 1.06% 2.07% 2.88% 3.29% 4.98% 0.455% 3.59% 4.57%V3 16.77% 3.53% 11.42% 3.55% 0.537% 6.08% 1.22% 4.72% 6.00% 2.94%Dl 2.01% 5.66% 0.58% 1.32% 0.703% 0.944% 7.85% 0.041% 3.30% 4.87%DM 8.22% 0.869% 0.102% 2.95% 0.191% 2.44% 0.871% 3.33% 3.07% 1.05%MT 23.40% 63.60% 43.23% 38.06% 52.37% 55.61% 56.29% 64.33% 45.32% 58.08%MTc 0.971% 3.06% 0.088% 0.845% 0.031% 0.083% 9.21% 0.290% 2.74% 4.46%MsT 15.04% 2.82% 5.27% 11.44% 29.54% 4.68% 3.00% 7.26% 9.76% 6.73%FsT 6.50% 1.94% 0.613% 4.91% 2.10% 2.97% 2.25% 2.76% 3.81% 2.14%TMPl 14.99% 1.56% 2.25% 22.89% 6.62% 3.95% 9.64% 5.65% 12.40% 5.76%PrTl 1.17% 0.350% 0.058% 5.34% 2.14% 0.763% 2.54% 1.90% 2.51% 1.54%FrnTl 0.672% 0.005% 0.00% 1.94% 1.47% 0.472% 0.102% 0.671% 0.830% 0.304%
Notes: rows sequentially list case numbers, injected tracers, the total number of cells labeled by each tracer, and the percentage of labeled cells in each area. TMPl includes all of the cells labeled in the temporal lobe outside of the MT complex, rostral to V3, Dl, and DM, and lateral to the fundus of the lateral sulcus. PrTl includes all of the cells labeled in the parietal lobe, from the rostral borders of V3 and DM to the rostral border of primary somatosensory cortex (area 3b) and medial to the fundus of the lateral sulcus. cells found in M and PPc were included in this region for counting. FrnTl includes all of the labeled cells in frontal cortex rostral to the rostral border of area 3b, thus this encompasses the FEF, FV, and PFc. The number of labeled cells was counted using the document info window in adobe illustrator™.Abbreviations: CTB, cholera toxin subunit B; DL, dorsolateral visual area; DM, dorsomedial visual area; DY, diamidino yellow; FEF, frontal eye field; FR, Fluoro-Ruby; FRNTL, frontal; FsT, fundal area of the superior temporal sulcus; FV, frontal visual area; M, medial visual area; MT, middle temporal visual area; MTc, middle temporal crescent; MsT, middle superior temporal area; PFC, prefrontal frontal cortex; PPC, posterior parietal cortex; PRTL, parietal; TMPL, temporal; V1, first visual area; V2, second visual area; V3, third visual area.
case 2In case 2, three injections were placed across area MT
(Figures 1C [squares] and 3). CTB was injected near the
HM, just outside of the representation of the central upper
field (Figure 3A). A small injection of FR was placed caudal
to the case 2 CTB injection in the MT central upper field
representation. Though this FR injection was centered at
approximately the same mediolateral level as the CTB injec-
tion, it spread more toward the HM, while the weight of the
CTB injection was balanced toward the VM (Figure 3B [red]).
Case 2 contained the most rostral injection of all three cases,
with an injection of DY on the border of areas MT and MST
(Figure 3B [yellow]). Because the DY injection was made
on the border between the two areas, cells labeled by it are
likely to reflect projections to both MT and MST. The part
of the injection core and surrounding diffusion zone that was
in MT was contained in the representation of the extreme
temporal periphery of the lower field.
The CTB injection into the peripheral upper field repre-
sentation in case 2 labeled cells in a pattern similar to that
revealed in the case 1 central upper field injection of CTB
(Figure 3). Again, while some cells were labeled in the lower
field representations, CTB-labeled cells were found mostly
in the upper field representations of the early visual areas.
Here, they tended to lie slightly more laterally compared to
the previous case in these areas, reflecting the shift from an
injection site just within the central vision in case 1 to one
more rostral in the representation of the case 2 periphery.
The apparent lines of labeled cells in unfolded V1, V2, and
V3 were likely the result of uneven flattening of the cortex.
Strong intrinsic connectedness within MT was indicated by
heavy CTB labeling in this area (Table 1). MTc, MST, and
FST also held CTB-filled neurons. Once again, the rest of
the temporal cortex contained many labeled cells, with con-
centrations near the inferior occipital sulcus, in the superior
temporal sulcus rostral to FST, and in IT, particularly near
ITp. Patches of CTB-backfilled cells were also in the lateral
sulcus. Caudally, the largest of these foci were continuous
with the concentration of labeled cells in DM. Projections
from M and the PPC were also revealed by this CTB injection
into the upper visual field of MT. In frontal cortex, there were
foci of labeled cells in the FEF, FV, and extreme ventrolateral
PFC on the crest of the rostral lateral sulcus.
The FR injection in case 2 was placed at about the same
distance from the HM as the CTB injection, but slightly more
caudal into the representation of central vision. The pattern
of labeled cells revealed by this injection was more restricted
than that revealed by the CTB injection, but generally similar
(Figure 3B [red]). V1, V2, V3, DL, and DM all contained filled
neurons, as did MT and its surrounding areas. In areas with
known retinotopy, the bulk of FR-labeled cells overlapped the
regions with projections revealed by the more rostral, and thus

Eye and Brain 2015:7 submit your manuscript | www.dovepress.com
Dovepress
Dovepress
7
cortical input to MT
Figure 3 The distribution of cells labeled by the injections in case 2.Notes: (A) The distribution of cTB-labeled cells in case 2. (B) The distribution of DY (yellow)-and Fr (red)-labeled cells in case 2. The three injections in case 2 revealed similar projections to MT as those demonstrated in case 1. cells were labeled by each tracer in regions of retinotopically organized areas that match the locations of the tracers. labeled cells were also distributed broadly across temporal, parietal, and frontal cortex. rostral is left and medial is up. scale bars are 5 mm. “-” indicates the lower visual field, and “+” the upper visual field. “1” and “2” are the caudal somatosensory areas. “3a” is the rostral somatosensory area, and “3b” the primary somatosensory area.Abbreviations: a1, primary auditory area; cTB, cholera toxin subunit B; Dl, dorsolateral visual area; DM, dorsomedial visual area; DY, diamidino yellow; FEF, frontal eye field; FR, Fluoro-Ruby; FSTd, dorsal fundal area of the superior temporal sulcus; FSTv, ventral fundal area of the superior temporal sulcus; FV, frontal visual area; IOS, inferior occipital sulcus; iTc, caudal inferior temporal cortex; iTm, medial inferior temporal cortex; iTp, polar inferior temporal cortex; iTr, rostral inferior temporal cortex; ls lateral sulcus; M, medial visual area; M1, primary motor area; MsT, middle superior temporal area; MT, middle temporal visual area; MTc, middle temporal crescent; PMd, dorsal premotor area; PMv, ventral premotor area; PPc, posterior parietal cortex; PV, parietal ventral area; r, rostral auditory area; s2, secondary somatosensory area; sMa, supplementary motor area; STS, superior temporal sulcus; V1, first visual area; V2, second visual area; V3, third visual area.
peripheral, CTB injection. The number of FR-labeled cells in
temporal cortex outside of the MT complex was low. Small
but dense foci of backfilled FR neurons were also found in
regions of the PPC and FEF that overlapped the locations of
cells labeled by the case 2 CTB injection.
The DY injection was on the MT/MST border. These
two areas have overlapping inputs, complicating the inter-
pretation of the results of this DY injection. However, it was
clear that the distribution of DY-positive cells was similar
to that revealed by other injections that were restricted to
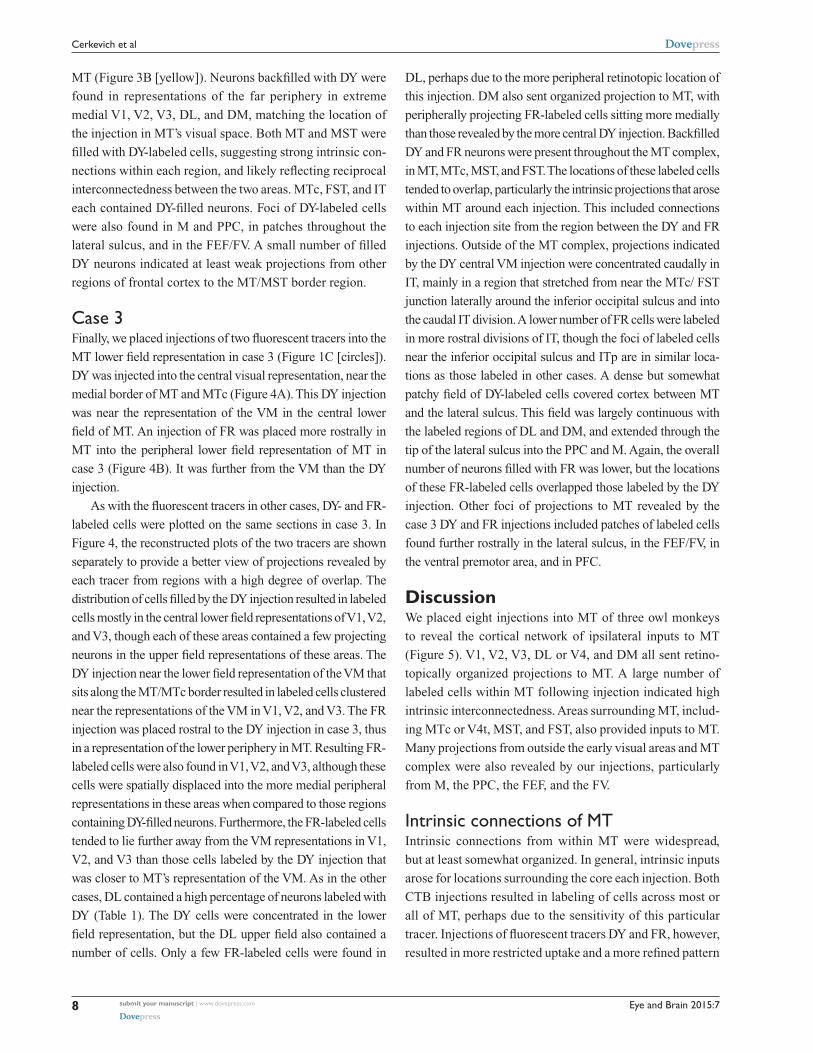
Eye and Brain 2015:7submit your manuscript | www.dovepress.com
Dovepress
Dovepress
8
cerkevich et al
MT (Figure 3B [yellow]). Neurons backfilled with DY were
found in representations of the far periphery in extreme
medial V1, V2, V3, DL, and DM, matching the location of
the injection in MT’s visual space. Both MT and MST were
filled with DY-labeled cells, suggesting strong intrinsic con-
nections within each region, and likely reflecting reciprocal
interconnectedness between the two areas. MTc, FST, and IT
each contained DY-filled neurons. Foci of DY-labeled cells
were also found in M and PPC, in patches throughout the
lateral sulcus, and in the FEF/FV. A small number of filled
DY neurons indicated at least weak projections from other
regions of frontal cortex to the MT/MST border region.
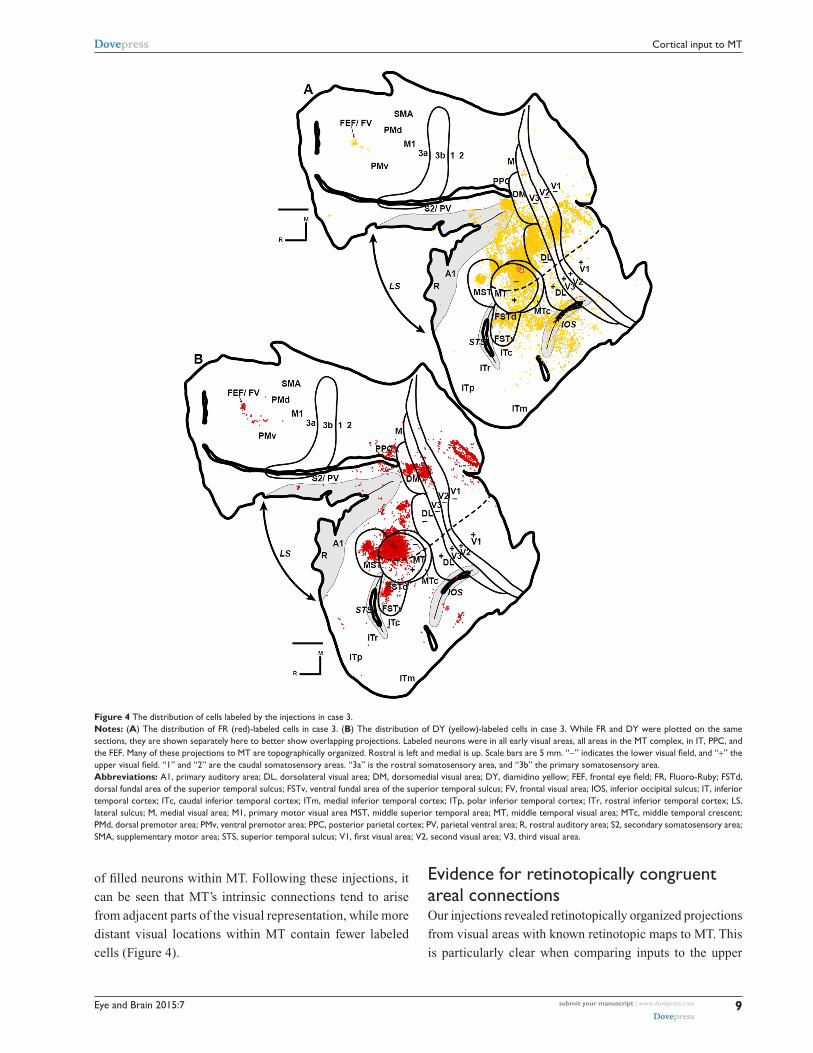
case 3Finally, we placed injections of two fluorescent tracers into the
MT lower field representation in case 3 (Figure 1C [circles]).
DY was injected into the central visual representation, near the
medial border of MT and MTc (Figure 4A). This DY injection
was near the representation of the VM in the central lower
field of MT. An injection of FR was placed more rostrally in
MT into the peripheral lower field representation of MT in
case 3 (Figure 4B). It was further from the VM than the DY
injection.
As with the fluorescent tracers in other cases, DY- and FR-
labeled cells were plotted on the same sections in case 3. In
Figure 4, the reconstructed plots of the two tracers are shown
separately to provide a better view of projections revealed by
each tracer from regions with a high degree of overlap. The
distribution of cells filled by the DY injection resulted in labeled
cells mostly in the central lower field representations of V1, V2,
and V3, though each of these areas contained a few projecting
neurons in the upper field representations of these areas. The
DY injection near the lower field representation of the VM that
sits along the MT/MTc border resulted in labeled cells clustered
near the representations of the VM in V1, V2, and V3. The FR
injection was placed rostral to the DY injection in case 3, thus
in a representation of the lower periphery in MT. Resulting FR-
labeled cells were also found in V1, V2, and V3, although these
cells were spatially displaced into the more medial peripheral
representations in these areas when compared to those regions
containing DY-filled neurons. Furthermore, the FR-labeled cells
tended to lie further away from the VM representations in V1,
V2, and V3 than those cells labeled by the DY injection that
was closer to MT’s representation of the VM. As in the other
cases, DL contained a high percentage of neurons labeled with
DY (Table 1). The DY cells were concentrated in the lower
field representation, but the DL upper field also contained a
number of cells. Only a few FR-labeled cells were found in
DL, perhaps due to the more peripheral retinotopic location of
this injection. DM also sent organized projection to MT, with
peripherally projecting FR-labeled cells sitting more medially
than those revealed by the more central DY injection. Backfilled
DY and FR neurons were present throughout the MT complex,
in MT, MTc, MST, and FST. The locations of these labeled cells
tended to overlap, particularly the intrinsic projections that arose
within MT around each injection. This included connections
to each injection site from the region between the DY and FR
injections. Outside of the MT complex, projections indicated
by the DY central VM injection were concentrated caudally in
IT, mainly in a region that stretched from near the MTc/ FST
junction laterally around the inferior occipital sulcus and into
the caudal IT division. A lower number of FR cells were labeled
in more rostral divisions of IT, though the foci of labeled cells
near the inferior occipital sulcus and ITp are in similar loca-
tions as those labeled in other cases. A dense but somewhat
patchy field of DY-labeled cells covered cortex between MT
and the lateral sulcus. This field was largely continuous with
the labeled regions of DL and DM, and extended through the
tip of the lateral sulcus into the PPC and M. Again, the overall
number of neurons filled with FR was lower, but the locations
of these FR-labeled cells overlapped those labeled by the DY
injection. Other foci of projections to MT revealed by the
case 3 DY and FR injections included patches of labeled cells
found further rostrally in the lateral sulcus, in the FEF/FV, in
the ventral premotor area, and in PFC.
DiscussionWe placed eight injections into MT of three owl monkeys
to reveal the cortical network of ipsilateral inputs to MT
(Figure 5). V1, V2, V3, DL or V4, and DM all sent retino-
topically organized projections to MT. A large number of
labeled cells within MT following injection indicated high
intrinsic interconnectedness. Areas surrounding MT, includ-
ing MTc or V4t, MST, and FST, also provided inputs to MT.
Many projections from outside the early visual areas and MT
complex were also revealed by our injections, particularly
from M, the PPC, the FEF, and the FV.
intrinsic connections of MTIntrinsic connections from within MT were widespread,
but at least somewhat organized. In general, intrinsic inputs
arose for locations surrounding the core each injection. Both
CTB injections resulted in labeling of cells across most or
all of MT, perhaps due to the sensitivity of this particular
tracer. Injections of fluorescent tracers DY and FR, however,
resulted in more restricted uptake and a more refined pattern
Eye and Brain 2015:7 submit your manuscript | www.dovepress.com
Dovepress
Dovepress
9
cortical input to MT
Figure 4 The distribution of cells labeled by the injections in case 3.Notes: (A) The distribution of Fr (red)-labeled cells in case 3. (B) The distribution of DY (yellow)-labeled cells in case 3. While Fr and DY were plotted on the same sections, they are shown separately here to better show overlapping projections. labeled neurons were in all early visual areas, all areas in the MT complex, in iT, PPc, and the FEF. Many of these projections to MT are topographically organized. rostral is left and medial is up. scale bars are 5 mm. “-” indicates the lower visual field, and “+” the upper visual field. “1” and “2” are the caudal somatosensory areas. “3a” is the rostral somatosensory area, and “3b” the primary somatosensory area.Abbreviations: A1, primary auditory area; DL, dorsolateral visual area; DM, dorsomedial visual area; DY, diamidino yellow; FEF, frontal eye field; FR, Fluoro-Ruby; FSTd, dorsal fundal area of the superior temporal sulcus; FsTv, ventral fundal area of the superior temporal sulcus; FV, frontal visual area; iOs, inferior occipital sulcus; iT, inferior temporal cortex; iTc, caudal inferior temporal cortex; iTm, medial inferior temporal cortex; iTp, polar inferior temporal cortex; iTr, rostral inferior temporal cortex; ls, lateral sulcus; M, medial visual area; M1, primary motor visual area MsT, middle superior temporal area; MT, middle temporal visual area; MTc, middle temporal crescent; PMd, dorsal premotor area; PMv, ventral premotor area; PPc, posterior parietal cortex; PV, parietal ventral area; r, rostral auditory area; s2, secondary somatosensory area; SMA, supplementary motor area; STS, superior temporal sulcus; V1, first visual area; V2, second visual area; V3, third visual area.
of filled neurons within MT. Following these injections, it
can be seen that MT’s intrinsic connections tend to arise
from adjacent parts of the visual representation, while more
distant visual locations within MT contain fewer labeled
cells (Figure 4).
Evidence for retinotopically congruent areal connectionsOur injections revealed retinotopically organized projections
from visual areas with known retinotopic maps to MT. This
is particularly clear when comparing inputs to the upper

Eye and Brain 2015:7submit your manuscript | www.dovepress.com
Dovepress
Dovepress
10
cerkevich et al
Restricted projections to MT from the upper or lower field
representations were found to arise from V2 and V3 as well.
Topographic projections related to the VM were also indi-
cated in these early visual areas. This is particularly clear in
V1, where cells labeled by injections closer to the boundaries
of MT, the location of the VM representation in MT,1 were
in closer proximity to the representation of the VM along
the V1/V2 border than injections located away from the
boundaries of MT (eg, compare the locations of FR- and
DY-labeled cells in cases 1 and 3 in Figures 2 and 4). Similar
matched, though somewhat more diffuse, inputs to MT also
arose from the upper and lower visual field representations in
DL, where the lower and upper visual fields are represented
dorsally and ventrally as in the other early visual areas.14,51
Cells labeled by injections into the MT lower field generally
were in dorsocaudal DM when compared to those filled by
the injections into the MT upper field representation, again
matching the known visual map in DM.32,37,52
Tracers were injected across the rostral to caudal extent
of MT, thus covering MT’s visual map from central to periph-
eral vision.1 Projections to MT were also organized along
this dimension of visual space. The most caudal injections
in each case resulted in cells labeled in the central visual
representation in V1, V2, and V3.14,51 Neurons filled by trac-
ers injected more rostrally in MT sat progressively further
from the representation of the central visual field. Thus,
when two injections were placed in the lower field repre-
sentation, the most caudal MT injection resulted in labeled
cells in central V1, V2, and V3, while the cells labeled by
more rostral injections into the MT peripheral visual repre-
sentation were displaced medially. For example, FR-filled
neurons in both cases 1 and 3 were found in V1, V2, and
V3 medial to those labeled by the DY injections into the
central visual representation in MT in each case. A similar
displacement was seen when two tracers were injected into
the central and peripheral representations of the upper field,
although, in this situation, cells labeled by the more rostral
(ie, peripheral visual field) MT injection lay laterally in V1,
V2, and V3 compared to those labeled by the injection into
a location more central in the visual field (Figure 2 [yellow
versus red]). Projections from DL and DM were similarly
separated into central and peripheral representations in each
area, respectively. Interestingly, projections organized along
the central to peripheral visual dimension also arose from the
FEF. Inputs from FEF to the central field representation in
caudal MT arise laterally to those cells labeled by injections
in more peripheral representations in rostral MT (Figures 3
and 4). This arrangement matches the topography of the FEF
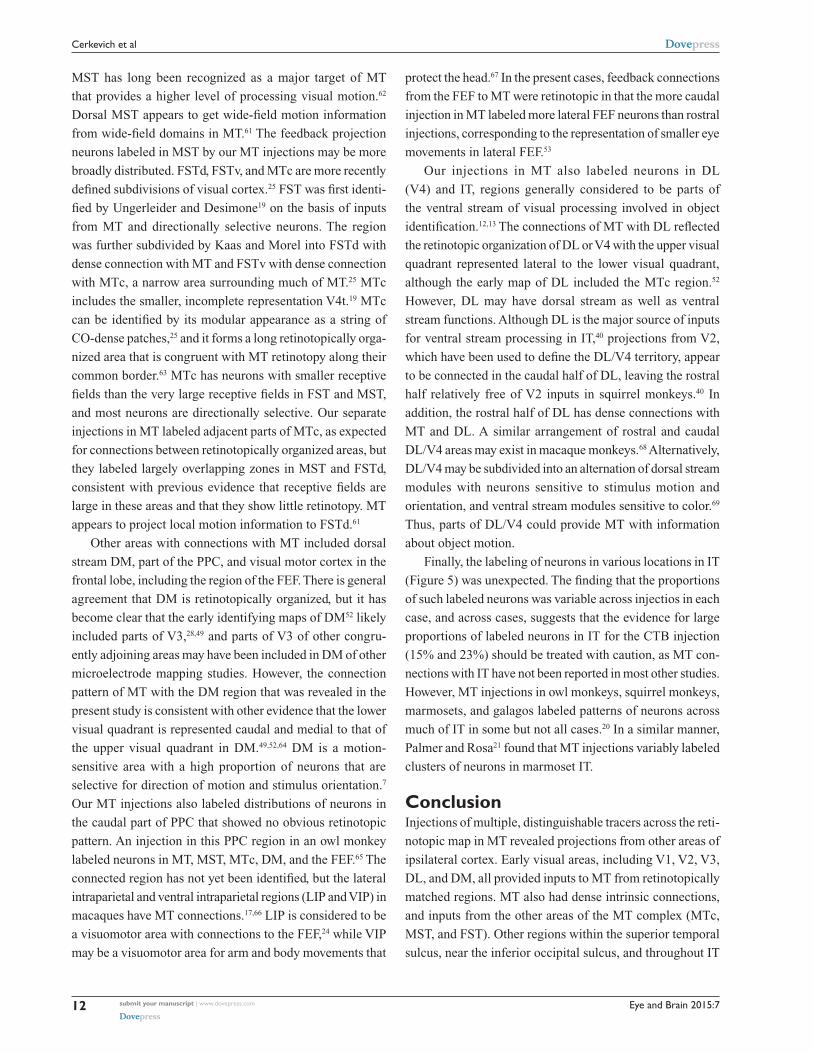
Figure 5 summary of corticocortical projections to MT.Notes: MT receives inputs from throughout cortex. retinotopically organized projections to MT arise from all early visual areas (dark gray arrows). MT has strong intrinsic connections within itself, as well as inputs from other areas in the MT complex (medium gray arrows). Other areas in the inferior temporal cortex, the PPc, and regions of the frontal cortex also provide input to MT (light gray arrows). The organization of these projections is sometimes clear, as those from the FEF are distributed across the central-peripheral axis of the visual field, and sometimes unclear, as those from iT appear to be mixed with no clear separation of inputs. rostral is left and medial is up. “-” indicates the lower visual field, and “+” the upper visual field. “1” and “2” are the caudal somatosensory areas. “3a” is the rostral somatosensory area, and “3b” the primary somatosensory area.Abbreviations: a1, primary auditory area; Dl, dorsolateral visual area; DM, dorsomedial visual area; FEF, frontal eye field; FST, fundal area of the superior temporal sulcus; FV, frontal visual area; iOs, inferior occipital sulcus; iT, inferior temporal cortex; iTc, caudal inferior temporal cortex; iTm, medial inferior temporal cortex; iTp, polar inferior temporal cortex; iTr, rostral inferior temporal cortex; ls, lateral sulcus; M, medial visual area; M1, primary motor area; MsT, middle superior temporal area; MT, middle temporal visual area MTc, middle temporal crescent; PMd, dorsal premotor area; PMv, ventral premotor area; PPc, posterior parietal cortex; PV, parietal ventral area; r, rostral auditory area; s2, secondary somatosensory area; sMa, supplementary motor area; STS, superior temporal sulcus; V1, first visual area; V2, second visual area; V3, third visual area.
and lower field representations in ventral and dorsal MT,
respectively. As in MT of owl monkeys,1,2,47 the lower visual
field is represented dorsally in V1, V2, and V3, while the
upper visual field is represented ventrally.2,14,48–50 When injec-
tions were placed cleanly into either the upper or lower visual
field representation in MT, projections arose from matched
upper or lower field locations in V1 with very little input
coming from the opposing representation. For example, cells
labeled by the CTB injection into the more ventral MT upper
field representation in case 1 were almost exclusively found
in ventral V1, while those labeled by the case 1 lower field
DY injection were found dorsally (Figure 2 [red and yellow]).
When an injection of tracer was placed on the representa-
tion of the HM, such as the FR injection in case 1, resulting
labeled cells were found in both the upper and lower field
representations in dorsal and ventral V1 (Figure 2 [red]).

Eye and Brain 2015:7 submit your manuscript | www.dovepress.com
Dovepress
Dovepress
11
cortical input to MT
visual field previously demonstrated in a study of inputs from
macaque visual cortex to the FEF.53
MT connections with higher order visual areasThe organization of other visual areas in the MT complex
and many higher order visual areas remains unclear. For
some of these regions, including a region of the PPC that
may encompass the LIP and VIP, projections to MT suggest
some organization. In others, for example IT, no retinotopi-
cally organized projections were indicated.
Overall, the pattern of connections of MT with other areas
of cortex revealed in the present study is in agreement with
previous results from owl monkeys,18,20,25,54 other New World
monkeys,15,20–22,55 Old World macaques,17,19 and prosimian
galagos.23 All studied primates appear to have neurons pro-
jecting to MT in visual areas V1, V2, and V3 (although V3
has not been consistently recognized), DM or a comparable
region, parts of PPC that in macaques include LIP and VIP,
frontal cortex in and near the expected locations of the FEF,
areas of the MT complex (MTc, FST, and MST), DL, and
parts of temporal cortex. Other regions have been variously
reported (see Palmer and Rosa21,55 for review).
Here, we reported quantitative data on the strengths of
connections, which were somewhat variable across the three
cases, and different across tracers. As expected, most of the
ipsilateral cortical connections of MT were intrinsic, with
23%–64% of neurons labeled by MT injections confined
to MT. Other major sources of inputs to MT included those
from V1, V2, V3, and MST. Projections from parietal cortex,
largely from a region that could include LIP and VIP, were
slight, generally 1%–2%, but over 5% for one injection.
Relatively few neurons were also labeled in the region of the
FEF (under 2%). Many of these connections reflect visual
inputs to MT (V1–V3), or feedback to MT related to visual
motion signals sent by MT to posterior parietal and frontal
cortex. Some of the variability in the strengths of connec-
tions across cases and injection sites in our material likely
reflects our approach of flattening cortex and cutting sec-
tions parallel to the cortical surface. Such sections are ideal
for locating labeled neurons relative to a surface view and
architectonic borders, but there are few sections, 20 or so,
across the cortical thickness, and half of these sections are
used for architecture. Thus, sampling of cortical sublayers
may vary, and results across cases and injection sites would
more accurately reflect connection strengths. In spite of this
variability, we can compare the present quantitative results
with those obtained after injections in MT of marmosets,
another New World monkey. Palmer and Rosa21 compared the
proportions of neurons projecting to MT, and did not include
neurons labeled within MT. However, they subdivided cortex
somewhat differently than in our present study. As in our pres-
ent study, V1 and V2 provided proportionately large inputs
to MT. The greatest input to marmoset MT was from MTc,
which, in our study in owl monkeys, projected densely to MT
only in our case where the injection was close to the MT side
of the MT/MTc border. Thus, some contamination of MTc
by our injection was possible. In addition, MTc was defined
as a proportionately smaller area in our present study. As in
our study, Palmer and Rosa21 found that connection strengths
were variable across injections in different cases.
The functional significance of MT connectionsThe major activating inputs to MT are from visual areas V1,
V2, and V3. Our injections in MT, and those indicated in
other studies, indicate that these inputs are retinotopically
organized, and suitable for creating, through a moderate
level of convergence, the larger excitatory receptive fields of
the smaller MT, while creating the retinotopy of MT. As for
V2 and V3, MT neurons appear to be dependent on V1 for
above-threshold activation, as lesions or chemical blocking
of V1 in adult owl monkeys render MT neurons unresponsive
to visual stimuli.47,51 As the projections from V1 are from
orientation-sensitive neurons selectively activated by the
magnocellular inputs to V1 (eg, Tigges et al in 198156 and
Maunsell et al in 199057), they likely create the direction of
movement- and orientation-selective modules in MT.58 The
magnocellular geniculate pathway to V1 also activates layer
three neurons projecting to orientation-selective band-like
modules in V1 and V3, which project to MT.20,37,58,59 These
indirect feedforward inputs are thought to contribute to the
sensitivities of MT neurons to binocular disparity, a signal for
perceptual depth, and processing motion at high speeds.60
Our injections also labeled widespread connections
within MT. These intrinsic connections likely contribute
a low-level excitation, possibly below spiking thresholds,
between functionally matched orientation selective specific
modules in MT revealed a patchy pattern of lateral connec-
tions to clusters of neurons within MT that were functionally
similar to the injected module.54,61 The larger injection cores
in our experiments would have involved several orientation
modules, and the orientation-specific networks were not
revealed.
Our injections also revealed projections to MT from other
areas in the MT complex, namely FSTd, MTc, and MST.
Eye and Brain 2015:7submit your manuscript | www.dovepress.com
Dovepress
Dovepress
12
cerkevich et al
MST has long been recognized as a major target of MT
that provides a higher level of processing visual motion.62
Dorsal MST appears to get wide-field motion information
from wide-field domains in MT.61 The feedback projection
neurons labeled in MST by our MT injections may be more
broadly distributed. FSTd, FSTv, and MTc are more recently
defined subdivisions of visual cortex.25 FST was first identi-
fied by Ungerleider and Desimone19 on the basis of inputs
from MT and directionally selective neurons. The region
was further subdivided by Kaas and Morel into FSTd with
dense connection with MT and FSTv with dense connection
with MTc, a narrow area surrounding much of MT.25 MTc
includes the smaller, incomplete representation V4t.19 MTc
can be identified by its modular appearance as a string of
CO-dense patches,25 and it forms a long retinotopically orga-
nized area that is congruent with MT retinotopy along their
common border.63 MTc has neurons with smaller receptive
fields than the very large receptive fields in FST and MST,
and most neurons are directionally selective. Our separate
injections in MT labeled adjacent parts of MTc, as expected
for connections between retinotopically organized areas, but
they labeled largely overlapping zones in MST and FSTd,
consistent with previous evidence that receptive fields are
large in these areas and that they show little retinotopy. MT
appears to project local motion information to FSTd.61
Other areas with connections with MT included dorsal
stream DM, part of the PPC, and visual motor cortex in the
frontal lobe, including the region of the FEF. There is general
agreement that DM is retinotopically organized, but it has
become clear that the early identifying maps of DM52 likely
included parts of V3,28,49 and parts of V3 of other congru-
ently adjoining areas may have been included in DM of other
microelectrode mapping studies. However, the connection
pattern of MT with the DM region that was revealed in the
present study is consistent with other evidence that the lower
visual quadrant is represented caudal and medial to that of
the upper visual quadrant in DM.49,52,64 DM is a motion-
sensitive area with a high proportion of neurons that are
selective for direction of motion and stimulus orientation.7
Our MT injections also labeled distributions of neurons in
the caudal part of PPC that showed no obvious retinotopic
pattern. An injection in this PPC region in an owl monkey
labeled neurons in MT, MST, MTc, DM, and the FEF.65 The
connected region has not yet been identified, but the lateral
intraparietal and ventral intraparietal regions (LIP and VIP) in
macaques have MT connections.17,66 LIP is considered to be
a visuomotor area with connections to the FEF,24 while VIP
may be a visuomotor area for arm and body movements that
protect the head.67 In the present cases, feedback connections
from the FEF to MT were retinotopic in that the more caudal
injection in MT labeled more lateral FEF neurons than rostral
injections, corresponding to the representation of smaller eye
movements in lateral FEF.53
Our injections in MT also labeled neurons in DL
(V4) and IT, regions generally considered to be parts of
the ventral stream of visual processing involved in object
identification.12,13 The connections of MT with DL reflected
the retinotopic organization of DL or V4 with the upper visual
quadrant represented lateral to the lower visual quadrant,
although the early map of DL included the MTc region.52
However, DL may have dorsal stream as well as ventral
stream functions. Although DL is the major source of inputs
for ventral stream processing in IT,40 projections from V2,
which have been used to define the DL/V4 territory, appear
to be connected in the caudal half of DL, leaving the rostral
half relatively free of V2 inputs in squirrel monkeys.40 In
addition, the rostral half of DL has dense connections with
MT and DL. A similar arrangement of rostral and caudal
DL/V4 areas may exist in macaque monkeys.68 Alternatively,
DL/V4 may be subdivided into an alternation of dorsal stream
modules with neurons sensitive to stimulus motion and
orientation, and ventral stream modules sensitive to color.69
Thus, parts of DL/V4 could provide MT with information
about object motion.
Finally, the labeling of neurons in various locations in IT
(Figure 5) was unexpected. The finding that the proportions
of such labeled neurons was variable across injectios in each
case, and across cases, suggests that the evidence for large
proportions of labeled neurons in IT for the CTB injection
(15% and 23%) should be treated with caution, as MT con-
nections with IT have not been reported in most other studies.
However, MT injections in owl monkeys, squirrel monkeys,
marmosets, and galagos labeled patterns of neurons across
much of IT in some but not all cases.20 In a similar manner,
Palmer and Rosa21 found that MT injections variably labeled
clusters of neurons in marmoset IT.
ConclusionInjections of multiple, distinguishable tracers across the reti-
notopic map in MT revealed projections from other areas of
ipsilateral cortex. Early visual areas, including V1, V2, V3,
DL, and DM, all provided inputs to MT from retinotopically
matched regions. MT also had dense intrinsic connections,
and inputs from the other areas of the MT complex (MTc,
MST, and FST). Other regions within the superior temporal
sulcus, near the inferior occipital sulcus, and throughout IT
Eye and Brain 2015:7 submit your manuscript | www.dovepress.com
Dovepress
Dovepress
13
cortical input to MT
projected to MT. More input to MT arose from the cortex in
and around the lateral sulcus, particularly in its caudal tip,
and the PPC. Finally, our injections also revealed projections
from frontal regions, including the regions of FEF and FV.
AcknowledgmentsThe authors thank Mary Feurtado for help in surgery and
animal care, Laura Trice and Mary Varghese for tissue
processing, and Dr Iwona Stepniewska and Emily Rockoff
for help during surgery and comments on this manuscript.
JHK was supported by an NIH Grant EY002686. Christine
E Collins’ present affiliation is Eli Lilly and Company,
Indianapolis, IN, USA.
Author contributionsAll authors had full access to all the data in the study and take
responsibility for the integrity of the data and the accuracy
of the data analysis. Study concept and design: JHK, CEC,
CMC. Acquisition of data: CMC, CEC. Analysis and inter-
pretation of data: CMC, JHK. Drafting of the manuscript:
CMC, CEC, JHK.
DisclosureThe authors report no conflicts of interest in this work.
References 1. Allman JM, Kaas JH. A representation of the visual field in the caudal
third of the middle temporal gyrus of the owl monkey (Aotus trivirgatus). Brain Res. 1971;31(1):85–105.
2. Allman JM, Kaas JH. Representation of the visual field in striate and adjoining cortex of the owl monkey (Aotus trivirgatus). Brain Res. 1971;35(1):89–106.
3. Allman JM, Kaas JH, Lane RH. The middle temporal visual area (MT) in the bushbaby, Galago senegalensis. Brain Res. 1973;57(1): 197–202.
4. Malonek D, Tootell RB, Grinvald A. Optical imaging reveals the functional architecture of neurons processing shape and motion in owl monkey area MT. Proc Biol Sci. 1994;258(1352):109–119.
5. Xu X, Collins CE, Kaskan PM, Khaytin I, Kaas JH, Casagrande VA. Optical imaging of visually evoked responses in prosimian primates reveals conserved features of the middle temporal visual area. Proc Natl Acad Sci U S A. 2004;101(8):2566–2571.
6. Zeki S. The response properties of cells in the middle temporal area (area MT) of owl monkey visual cortex. Proc R Soc Lond B Biol Sci. 1980;207(1167):239–248.
7. Baker JF, Petersen SE, Newsome WT, Allman JM. Visual response proper-ties of neurons in four extrastriate visual areas of the owl monkey (Aotus trivirgatus): a quantitative comparison of medial, dorsomedial, dorsolat-eral, and middle temporal areas. J Neurophysiol. 1981;45(3):397–416.
8. Felleman DJ, Kaas JH. Receptive-field properties of neurons in middle temporal visual area (MT) of owl monkeys. J Neurophysiol. 1984;52(3): 488–513.
9. Salzman CD, Murasugi CM, Britten KH, Newsome WT. Microstimulation in visual area MT: effects on direction discrimination performance. J Neurosci. 1992;12(6):2331–2355.
10. Komatsu H, Wurtz RH. Modulation of pursuit eye movements by stimulation of cortical areas MT and MST. J Neurophysiol. 1989;62(1): 31–47.
11. Groh JM, Born RT, Newsome WT. How is a sensory map read out? Effects of microstimulation in visual area MT on saccades and smooth pursuit eye movements. J Neurosci. 1997;17(11):4312–4330.
12. Ungerleider L, Mishkin M. Two cortical visual systems. In: Ingle DJ, Goodale MA, Mansfield RJW, editors. Analysis of Visual Behavior. Cambridge, MA: MIT Press; 1982:549–586.
13. Goodale MA, Milner AD. Separate visual pathways for perception and action. Trends Neurosci. 1992;15(1):20–25.
14. Kaas JH, Lyon DC. Pulvinar contributions to the dorsal and ventral streams of visual processing in primates. Brain Res Rev. 2007;55:285–296.
15. Spatz WB, Tigges J. Experimental-anatomical studies on the “middle temporal visual area (MT)” in primates. I. Efferent cortico-cortical connections in the marmoset Callithrix jacchus. J Comp Neurol. 1972;146(4):451–464.
16. Wall JT, Symonds LL, Kaas JH. Cortical and subcortical projections of the middle temporal area (MT) and adjacent cortex in galagos. J Comp Neurol. 1982;211(2):193–214.
17. Maunsell JH, van Essen DC. The connections of the middle temporal visual area (MT) and their relationship to a cortical hierarchy in the macaque monkey. J Neurosci. 1983;3(12):2563–2586.
18. Weller RE, Wall JT, Kaas JH. Cortical connections of the middle temporal visual area (MT) and the superior temporal cortex in owl monkeys. J Comp Neurol. 1984;228(1):81–104.
19. Ungerleider L, Desimone R. Cortical connections of visual area MT in the macaque. J Comp Neurol. 1986;248(2):190–222.
20. Krubitzer LA, Kaas JH. Cortical connections of MT in four species of primates: areal, modular, and retinotopic patterns. Vis Neurosci. 1990;5(2):165–204.
21. Palmer SM, Rosa MG. Quantitative analysis of the corticocortical projec-tions to the middle temporal area in the marmoset monkey: evolutionary and functional implications. Cereb Cortex. 2006;16(9):1361–1375.
22. Rosa MG, Soares JG, Fiorani M Jr, Gattass R. Cortical afferents of visual area MT in the Cebus monkey: possible homologies between New and Old World monkeys. Vis Neurosci. 1993;10(05):827–855.
23. Kaskan PM, Kaas JH. Cortical connections of the middle temporal and the middle temporal crescent visual areas in prosimian galagos (Otolemur garnetti). Anat Rec (Hoboken). 2007;290(3):349–366.
24. Huerta MF, Krubitzer LA, Kaas JH. Frontal eye field as defined by intracortical microstimulation in squirrel monkeys, owl monkeys, and macaque monkeys. II. Cortical connections. J Comp Neurol. 1987;265(3):332–361.
25. Kaas JH, Morel A. Connections of visual areas of the upper temporal lobe of owl monkeys: the MT crescent and dorsal and ventral subdivi-sions of FST. J Neurosci. 1993;13(2):534–546.
26. Blatt GJ, Andersen RA, Stoner GR. Visual receptive field organization and cortico-cortical connections of the lateral intraparietal area (area LIP) in the macaque. J Comp Neurol. 1990;299(4):421–445.
27. Jeffs J, Ichida JM, Federer F, Angelucci A. Anatomical evidence for classical and extra-classical receptive field completion across the discontinuous horizontal meridian representation of primate area V2. Cereb Cortex. 2009;19(4):963–981.
28. Lyon DC, Connolly JD. The case for primate V3. Proc Biol Sci. 2012;279(1729):625–633.
29. Rosa MG, Palmer SM, Gamberini M, et al. Connections of the dorso-medial visual area: pathways for early integration of dorsal and ventral streams in extrastriate cortex. J Neurosci. 2009;29(14):4548–4563.
30. Jeffs J, Federer F, Ichida JM, Angelucci A. High-resolution mapping of anatomical connections in marmoset extrastriate cortex reveals a complete representation of the visual field bordering dorsal V2. Cereb Cortex. 2013;23(5):1126–1147.
31. Stepniewska I, Qi HX, Kaas JH. Do superior colliculus projection zones in the inferior pulvinar project to MT in primates? Eur J Neurosci. 1999;11(2):469–480.
32. Krubitzer LA, Kaas JH. The dorsomedial visual area of owl monkeys: connections, myeloarchitecture, and homologies in other primates. J Comp Neurol. 1993;334(4):497–528.
Eye and Brain 2015:7submit your manuscript | www.dovepress.com
Dovepress
Dovepress
14
cerkevich et al
33. Gallyas F. Silver staining of myelin by means of physical development. Neurol Res. 1979;1:203–209.
34. Wong-Riley M. Changes in the visual system of monocularly sutured or enucleated cats deomonstrable with cytochrome oxidase histochemistry. Brain Res. 1979;171(1):11–28.
35. Angelucci A, Clascá F, Sur M. Anterograde axonal tracing with the subunit B of cholera toxin: a highly sensitive immunohistochemical protocol for revealing fine axonal morphology in adult and neonatal brains. J Neurosci Methods. 1996;65(1):101–112.
36. Bruce K, Grofova I. Notes on a light and electron microscopic double-labeling method combining anterograde tracing with Phaseolus vulgaris leucoagglutinin and retrograde tracing with cholera toxin subunit B. J Neurosci Methods. 1992;45(1–2):23–33.
37. Lyon DC, Kaas JH. Connectional and architectonic evidence for dorsal and ventral V3, and dorsomedial area in marmoset monkeys. J Neurosci. 2001;21(1):249–261.
38. Lyon DC, Kaas JH. Connectional evidence for dorsal and ventral V3, and other extrastriate areas in the prosimian primate, Galago garnetti. Brain Behav Evol. 2002;59(3):114–129.
39. Allman JM, Kaas JH. A crescent-shaped cortical visual area surrounding the middle temporal area (MT) in the owl monkey (Aotus trivirgatus). Brain Res. 1974;81(2):199–213.
40. Cusick CG, Kaas JH. Cortical connections of area 18 and dorsolateral visual cortex in squirrel monkeys. Vis Neurosci. 1988;1(2):211–237.
41. Weller RE, Kaas JH. Retinotopic patterns of connections of area 17 with visual areas V-II and MT in macaque monkeys. J Comp Neurol. 1983;220(3):253–279.
42. Preuss TM, Stepniewska I, Kaas JH. Movement representation in the dorsal and ventral premotor areas of owl monkeys: a microstimulation study. J Comp Neurol. 1996;371(4):649–676.
43. Weller RE, Kaas JH. Subdivisions and connections of inferior temporal cortex in owl monkeys. J Comp Neurol. 1987;256(1):137–172.
44. Burman KJ, Palmer SM, Gamberini M, Rosa MG. Cytoarchitectonic subdivisions of the dorsolateral frontal cortex of the marmoset monkey (Callithrix jacchus), and their projections to dorsal visual areas. J Comp Neurol. 2006;495(2):149–172.
45. Burman KJ, Rosa MG. Architectural subdivisions of medial and orbital frontal cortices in the marmoset monkey (Callithrix jacchus). J Comp Neurol. 2009;514(1):11–29.
46. Paxinos G, Watson C, Petrides M, Rosa M, Tokuno H. The Marmoset Brain in Stereotaxic Coordinates. New York: Academic Press; 2011.
47. Collins CE, Lyon DC, Kaas JH. Responses of neurons in the middle tem-poral visual area after long-standing lesions of the primary visual cortex in adult new world monkeys. J Neurosci. 2003;23(6):2251–2264.
48. Collins CE, Lyon DC, Kaas JH. Distribution across cortical areas of neurons projecting to the superior colliculus in new world monkeys. Anat Rec A Discov Mol Cell Evol Biol. 2005;285(1):619–627.
49. Lyon DC, Kaas JH. Evidence for a modified V3 with dorsal and ventral halves in macaque monkeys. Neuron. 2002;33(3):453–461.
50. Lyon DC, Xu X, Casagrande VA, Stefansic JD, Shima D, Kaas JH. Optical imaging reveals retinotopic organization of dorsal V3 in New World owl monkeys. Proc Natl Acad Sci U S A. 2002;99(24): 15735–15742.
51. Collins CE, Xu X, Khaytin I, Kaskan PM, Casagrande VA, Kaas JH. Optical imaging of visually evoked responses in the middle temporal area after deactivation of primary visual cortex in adult primates. Proc Natl Acad Sci U S A. 2005;102(15):5594–5599.
52. Allman JM, Kass JH. The dorsomedial cortical visual area: a third tier area in the occipital lobe of the owl monkey (Aotus trivirgatus). Brain Res. 1975;100(3):473–487.
53. Schall JD, Morel A, King DJ, Bullier J. Topography of visual cortex connections with frontal eye field in macaque: convergence and seg-regation of processing streams. J Neurosci. 1995;15(6):4464–4487.
54. Malach R, Schirman TD, Harel M, Tootell RB, Malonek D. Organization of intrinsic connections in owl monkey area MT. Cereb Cortex. 1997;7(4):386–393.
55. Palmer SM, Rosa MG. A distinct anatomical network of cortical areas for analysis of motion in far peripheral vision. Eur J Neurosci. 2006;24(8):2389–2405.
56. Tigges J, Tigges M, Anschel S, Cross NA, Letbetter WD, McBride RL. Areal and laminar distribution of neurons interconnecting the central visual cortical areas 17, 18, 19, and MT in squirrel monkey (Saimiri). J Comp Neurol. 1981;202(4):539–560.
57. Maunsell JH, Nealey TA, DePriest DD. Magnocellular and parvocellular contributions to responses in the middle temporal visual area (MT) of the macaque monkey. J Neurosci. 1990;10(10):3323–3334.
58. Kaskan PM, Dillenburger BC, Lu HD, Roe AW, Kaas JH. Orientation and direction-of-motion response in the middle temporal visual area (MT) of New World owl monkeys as revealed by intrinsic-signal optical imaging. Front Neuroanat. 2010;4:23.
59. Casagrande VA, Kaas JH. The afferent, intrinsic, and efferent connec-tions of primary visual cortex in primates. In: Peters A, Rockland KS, editors. Primary Visual Cortex in Primates. New York: Plenum Press; 1994:201–259.
60. Ponce CR, Hunter JN, Pack CC, Lomber SG, Born RT. Contributions of indirect pathways to visual response properties in macaque middle temporal area MT. J Neurosci. 2011;31(10):3894–3903.
61. Berezovskii VK, Born RT. Specificity of projections from wide-field and local motion-processing regions within the middle temporal visual area of the owl monkey. J Neurosci. 2000;20(3):1157–1169.
62. Tanaka K, Saito H. Analysis of motion of the visual field by direc-tion, expansion/contraction, and rotation cells clustered in the dorsal part of the medial superior temporal area of the macaque monkey. J Neurophysiol. 1989;62(3):626–641.
63. Rosa MG, Elston GN. Visuotopic organisation and neuronal response selectivity for direction of motion in visual areas of the caudal temporal lobe of the marmoset monkey (Callithrix jacchus): middle temporal area, middle temporal crescent, and surrounding cortex. J Comp Neurol. 1998;393(4):505–527.
64. Rosa MG, Palmer SM, Gamberini M, Tweedale R, Pinon MC, Bourne JA. Resolving the organization of the New World monkey third visual complex: the dorsal extrastriate cortex of the marmoset (Callithrix jacchus). J Comp Neurol. 2005;483(2):164–191.
65. Beck PD, Kaas JH. Cortical connections of the dorsomedial visual area in new world owl monkeys (Aotus trivirgatus) and squirrel monkeys (Saimiri sciureus). J Comp Neurol. 1998;400(1):18–34.
66. Boussaoud D, Ungerleider LG, Desimone R. Pathways for motion analysis: cortical connections of the medial superior temporal and fundus of the superior temporal visual areas in the macaque. J Comp Neurol. 1990;296(3):462–495.
67. Cooke DF, Taylor CS, Moore T, Graziano MS. Complex movements evoked by microstimulation of the ventral intraparietal area. Proc Natl Acad Sci U S A. 2003;100(10):6163–6168.
68. Stepniewska I, Collins CE, Kaas JH. Reappraisal of DL/VA boundaries based on connectivity patterns of dorsolateral visual cortex in macaques. Cereb Cortex. 2005;15(6):809–822.
69. Tanigawa H, Lu HD, Roe AW. Functional organization for color and orientation in macaque V4. Nat Neurosci. 2010;13(12):1542–1548.

Eye and Brain
Publish your work in this journal
Submit your manuscript here: http://www.dovepress.com/eye-and-brain-journal
Eye and Brain is an international, peer-reviewed, open access journal focusing on clinical and experimental research in the f ield of neuro-ophthalmology. All aspects of patient care are addressed within the journal as well as basic research. Papers covering original research, basic science, clinical and epidemiological studies, reviews and
evaluations, guidelines, expert opinion and commentary, case reports and extended reports are welcome. The manuscript management system is completely online and includes a very quick and fair peer-review system, which is all easy to use. Visit http://www.dovepress.com/ testimonials.php to read real quotes from published authors.
Eye and Brain 2015:7 submit your manuscript | www.dovepress.com
Dovepress
Dovepress
DovepressDovepress
15
cortical input to MT