Correlations Between Shoulder Rotational Motion, Strength ...
120
Marquee University e-Publications@Marquee Master's eses (2009 -) Dissertations, eses, and Professional Projects Correlations Between Shoulder Rotational Motion, Strength Measures and rowing Biomechanics in Collegiate Baseball Pitchers Austin William Higgins Marquee University Recommended Citation Higgins, Austin William, "Correlations Between Shoulder Rotational Motion, Strength Measures and rowing Biomechanics in Collegiate Baseball Pitchers" (2019). Master's eses (2009 -). 528. hps://epublications.marquee.edu/theses_open/528
Transcript of Correlations Between Shoulder Rotational Motion, Strength ...

Marquette Universitye-Publications@Marquette
Master's Theses (2009 -) Dissertations, Theses, and Professional Projects
Correlations Between Shoulder Rotational Motion,Strength Measures and Throwing Biomechanics inCollegiate Baseball PitchersAustin William HigginsMarquette University
Recommended CitationHiggins, Austin William, "Correlations Between Shoulder Rotational Motion, Strength Measures and Throwing Biomechanics inCollegiate Baseball Pitchers" (2019). Master's Theses (2009 -). 528.https://epublications.marquette.edu/theses_open/528

CORRELATIONS BETWEEN SHOULDER ROTATIONAL MOTION,
STRENGTH MEASURES AND THROWING BIOMECHANICS IN
COLLEGIATE BASEBALL PITCHERS
by
Austin Higgins, B.S.
A Thesis submitted to the Faculty of the Graduate School,
Marquette University,
in Partial Fulfillment of the Requirements for
the Degree of Master of Science of Biomedical Engineering
Milwaukee, Wisconsin
May 2019

ABSTRACT
CORRELATIONS BETWEEN SHOULDER ROTATIONAL MOTION,
STRENGTH MEASURES AND THROWING BIOMECHANICS IN
COLLEGIATE BASEBALL PITCHERS
Austin Higgins, B.S.
Marquette University, 2019
Pitching involves high stresses to the arm that may alter soft tissue responsible for
controlling biomechanics. It has been hypothesized that imbalances in strength and
flexibility of the dominant shoulder lead to decreased performance and increased injury
risk, but it is not fully known what specific pitching biomechanics are altered. There is a
critical need to determine correlations between shoulder rotational strength, range of
motion and pitching kinetics. Without such knowledge, identifying potential for injury
from shoulder imbalances will likely remain difficult and invasive. The goal of this study
was to determine correlations between shoulder rotational strength and range of motion
and kinetics.
Twelve collegiate pitchers participated in this IRB approved study. The clinical
measures session tested shoulder rotational range of motion and strength and grip
strength. The motion analysis session tested pitching biomechanics. Paired t-tests
investigated differences in strength and range of motion between arms. Linear regression
was performed to determine correlations between clinical measures, kinetics and pitch
velocity. Regression learner neural networks were created to predict pitch velocity and
elbow varus torque using clinical measures as inputs.
The dominant arm had significantly higher external rotation and total range of
motion than the nondominant arm. The nondominant arm normalized external rotation
peak torque was significantly greater than the dominant arm at 0˚ external rotation.
Correlations were found between elbow varus torque and isometric external/internal
rotation ratio, and between shoulder posterior shear force and isokinetic eccentric
external rotation/internal rotation ratios. Correlations to velocity included grip strength,
concentric external rotation peak torque, isometric internal rotation peak torques, and
isometric external rotation peak torques. The neural network accurately predicted
velocity, with the standard deviation of the error equal to 2.29 (2.97%).
These correlations associate two testing methods to identify injury risk. Increasing
external/internal rotation ratios may decrease elbow varus torque and shoulder posterior
shear force. Increasing external rotation, internal rotation, and grip strength may lead to
velocity gains. Velocity can be predicted using clinical measures and a neural network.
i
ACKNOWLEDGEMENTS
Austin Higgins, B.S.
Many people have helped contribute to this thesis project and deserve my thanks
and recognition. First, I would like to thank Dr. Janelle Cross for mentoring me
throughout the course of the project and giving me the opportunity to study one of my
greatest passions. The time and effort she has put into helping me have been monumental.
I would also like to thank my advisor Dr. Gerald Harris for the time and advice he
has contributed to the planning and execution of this project.
I would also like to thank Dr. William Raasch for joining my thesis committee
and offering his time and professional insight.
I would also like to thank Dr. Jessica Fritz for her help with the clinical testing
sessions and her advice along the way.
I would also like to thank Cody Dzuik, and Cameron Hays for assisting with the
motion analysis testing sessions which greatly expedited the process.
I would like to acknowledge all the pitchers for giving their time and effort to
participate in the study.
I would like to thank my family and friends for their constant support and
encouragement throughout the length of the project.
Finally, I would like to thank the Medical College of Wisconsin and Marquette
University joint Biomedical Engineering Master’s program, and the MCW Department of
Orthopaedic Surgery for funding the project.

ii
TABLE OF CONTENTS
ACKNOWLEDGEMENTS .............................................................................................. i
TABLE OF CONTENTS ................................................................................................. ii
LIST OF TABLES ........................................................................................................... vi
LIST OF FIGURES ....................................................................................................... viii
LIST OF ACRONYMS ................................................................................................... xi
CHAPTER 1: INTRODUCTION .................................................................................... 1
CHAPTER 2: LITERATURE REVIEW........................................................................ 4
2.1 PHASES OF PITCHING .................................................................................. 4
2.2 PITCHING INJURIES...................................................................................... 6
2.3 BIOMECHANICS OF PITCHING AND MOTION ANALYSIS ................... 8
2.3.1 Quantifying Pitching Biomechanics ................................................ 10
2.3.2 Pitching Biomechanics Correlations ............................................... 12
2.3.3 Comparison of Populations, Parameters ......................................... 16
2.4 CLINICAL MEASURES OF STRENGTH AND FLEXIBILITY ................ 20
2.4.1 Flexibility ......................................................................................... 20
2.4.2 Isokinetic Strength ........................................................................... 24
2.4.2.1 Concentric Strength .......................................................... 27
2.4.2.2 Eccentric Strength ............................................................. 27
2.4.2.3 Isokinetic Torque ER/IR Ratios ........................................ 28

iii
2.4.3 Isometric Strength ............................................................................ 29
2.4.4 Grip Strength ................................................................................... 30
2.5 CORRELATIONS BETWEEN BIOMECHANICS AND CLINICAL
MEASURES ......................................................................................................... 32
CHAPTER 3: METHODS ............................................................................................. 36
3.1 SUBJECTS ..................................................................................................... 36
3.2 TEST PROTOCOL ......................................................................................... 36
3.2.1 Clinical Strength and ROM Testing ................................................. 36
3.2.1.1 Passive Range of Motion Testing ...................................... 37
3.2.1.2 Grip Strength Testing ........................................................ 39
3.2.1.3 Isokinetic Strength Testing ................................................ 40
3.2.1.4 Isometric Strength Testing ................................................ 41
3.2.2 Motion Analysis Testing Session ...................................................... 42
3.3 DATA PROCESSING .................................................................................... 44
3.3.1 Clinical Measures Data ................................................................... 44
3.3.2 Motion Analysis Data ...................................................................... 45
3.3.2.1 Cortex Processing ............................................................. 45
3.3.2.2 Visual 3D Processing ........................................................ 46
3.3.2.2.1 Kinematic Metrics .............................................. 49
3.3.2.2.2 Kinetic Metrics ................................................... 49

iv
3.3.2.2.3 Timing Events..................................................... 50
3.4 STATISTICAL ANALYSIS .......................................................................... 52
CHAPTER 4: RESULTS ............................................................................................... 53
4.1 CLINICAL MEASURES................................................................................ 53
4.2 BIOMECHANICAL MEASURES ................................................................. 57
4.3 CORRELATIONS BETWEEN CLINICAL MEASURES, VELOCITY,
KINETICS ............................................................................................................ 58
4.4 NEURAL NETWORK REGRESSION LEARNER ...................................... 64
CHAPTER 5: DISCUSSION ......................................................................................... 68
5.1 CLINICAL MEASURES................................................................................ 68
5.1.1 Range of motion ............................................................................... 68
5.1.2 Grip strength .................................................................................... 72
5.1.3 Isokinetic Strength ........................................................................... 73
5.1.4 Isometric Strength ............................................................................ 76
5.3 BIOMECHANICAL MEASURES ................................................................. 78
5.4 CORRELATIONS .......................................................................................... 81
5.4.1 Clinical measures and kinetics ........................................................ 81
5.4.2 Clinical measures and velocity ........................................................ 84
5.5 NEURAL NETWORK ................................................................................... 86
5.6 STUDY LIMITATIONS ................................................................................ 89

v
5.7 FUTURE STUDIES........................................................................................ 90
5.8 SUMMARY .................................................................................................... 92
CHAPTER 6: CONCLUSION....................................................................................... 93
BIBLOIGRPAHY ........................................................................................................... 96
APPENDIX A: CONSENT FORM ............................................................................. 102

vi
LIST OF TABLES
Table 2.1: Comparison of kinetic measures from various studies (Y=youth, HS=high
school, C=college, PRO=professional, arm slot: OH=overhand, SA=sidearm, 3Q=three-
quarters, Nm=Newton-meters, N=Newtons). ..................................................................... 9
Table 2.2: Subject pool, purpose, and key findings of studies investigating correlations
between key biomechanics (→ = correlated with, ↑ = increased, ↓ = decreased). ........... 13
Table 2.3: Subject pool, purpose, and key findings of studies comparing biomechanics of
various populations and parameters. ................................................................................. 17
Table 2.4: Comparison of glenohumeral ER and IR ROM studies (* indicates significant
difference between D and ND arms) Values are means with standard deviations (if
provided) in degrees. ......................................................................................................... 22
Table 2.5: Glenohumeral ROM before, immediately after, and 24 hours after pitching in
the D shoulder [40] (* indicates significant difference compared to ROM before
pitching). ........................................................................................................................... 23
Table 2.6: Comparison of isokinetic peak torque (Nm) in ER and IR at 90˚ shoulder
abduction and 90˚ elbow flexion across various studies (Subj = subjects, vel. = velocity, *
indicates significant difference between D and ND arm). ................................................ 25
Table 3.1: Descriptions of the LCS used for each segment in the pitching model.
R+L=right and left, L=lateral, M=medial, JC=joint center, F+R=front and rear. ............ 47
Table 4.1: ROM and grip strength averages and standard deviations for D and ND arms.
* denotes significance. ...................................................................................................... 54
Table 4.2: Averages and standard deviations of isokinetic PTs normalized to body weight
and strength ratios at 90 deg/sec. ...................................................................................... 55
Table 4.3: Averages and standard deviations of isokinetic PTs normalized to body weight
and strength ratios at 180 deg/sec. .................................................................................... 55

vii
Table 4.4: : Averages and standard deviations of isokinetic PTs normalized to body
weight and strength ratios at 270 deg/sec. ........................................................................ 56
Table 4.5: Averages and standard deviations of isometric PT normalized to body weight
and strength ratios at arm positions of 90˚ ER. ................................................................. 56
Table 4.6: Averages and standard deviations of isometric PT normalized to body weight
and strength ratios at arm positions of 45˚ ER. ................................................................. 57
Table 4.7: Averages and standard deviations of isometric PT normalized to body weight
and strength ratios at arm positions of 0˚ ER. * denotes significance. ............................. 57
Table 4.8: Averages and standard deviations of kinetics at the arm cocking and BR
phases normalized to subject body weight and height. Torque units: Nm and Nm/kg*m,
force units: N and N/kg*m. ............................................................................................... 58
viii
LIST OF FIGURES
Figure 2.1: Phases and key points of the pitching motion [18]. ......................................... 5
Figure 2.2: Forces and torques on the shoulder throughout the pitching motion
(REL=BR) [16]. ................................................................................................................ 11
Figure 2.3: Forces and torques on the elbow throughout the pitching motion [16].......... 11
Figure 2.4: Glenohumeral total ROM in the D arm (A) and ND arm (B) showing a shift in
total ROM externally in the D arm of pitchers [20].......................................................... 21
Figure 2.5: Stabilization of humeral head (left), stabilization of scapula (middle) and
visual inspection without stabilization (right) [38]. .......................................................... 23
Figure 2.6: Correlations between clinical ER ROM and peak elbow adduction moment
(left), and peak shoulder IR moment (right) [13]. ............................................................ 33
Figure 2.7: Correlations between peak shoulder ER moment and clinical IR strength
(left), and peak elbow adduction moment and peak shoulder IR moment (right) [13]. ... 33
Figure 3.1: Shoulder Rotational ROM testing using the scapular stabilization method. .. 38
Figure 3.2: Grip strength testing position. ........................................................................ 39
Figure 3.3: Flowchart of isokinetic and isometric strength testing procedures. ............... 41
Figure 3.4: Shoulder rotational strength testing. Top to bottom: positions for isometric
testing of 90, 45, and 0˚ ER. Isokinetic testing consisted of the full 90˚. ......................... 42
Figure 3.5: Subject after all markers are placed on anatomical landmarks. ..................... 44

ix
Figure 4.1: Elbow Varus torque normalized by body weight and height (Nm/(kg*m)) vs.
isometric ER/IR ratio at 90 degrees of shoulder ER. R2=0.363, p = 0.050. ..................... 59
Figure 4.2: Shoulder posterior shear force normalized by body weight and height
(N/(kg*m)) vs. isokinetic eccentric ER/IR ratio at 180 deg/sec. R2=0.425, p=0.022. ..... 60
Figure 4.3: Shoulder posterior shear force normalized by body weight and height
(N/kg*m)) vs. isokinetic eccentric ER/IR ratio at 270 deg/sec. R2=0.510, p=0.009. ...... 60
Figure 4.4: Velocity (mph) vs. grip strength (kg). R2=0.444, p=0.018. ........................... 61
Figure 4.5: Velocity (mph) vs. concentric ER torque normalized to body weight (Nm/kg)
at 90 degrees/sec. R2=0.357, p=0.040. ............................................................................. 62
Figure 4.6: Velocity (mph) vs. Isometric IR PT normalized to body weight (Nm/kg) at an
arm position of 90 degrees ER. R2=0.350, p=0.043. ........................................................ 62
Figure 4.7: Velocity (mph) vs. isometric ER PT normalized to body weight (Nm/kg) at an
arm position of 45 degrees ER. R2=0.529, p=0.007. ........................................................ 63
Figure 4.8: Velocity (mph) vs. isometric IR PT normalized to body weight (Nm/kg) at an
arm position of 45 degrees ER. R2=0.395, p=0.029. ........................................................ 63
Figure 4.9: Velocity (mph) vs. isometric ER PT normalized to body weight (Nm/kg) at an
arm position of 0 degrees ER. R2=0.702, p=0.001. .......................................................... 64
Figure 4.10: Velocity predicting cubic SVM RLNN model response plot: blue=actual,
orange=predicted, red line=errors. .................................................................................... 65
Figure 4.11: Cubic SVM NN linear regression learner model predicted vs. true fastball
velocity: blue=observation, black line=perfect prediction. Model performance:
RMSE=2.2924, R2=0.70, MSE=5.2549, MAE=1.9064. .................................................. 65
Figure 4.12: Elbow varus torque predicting rational quadratic gaussian process regression
RLNN model response plot: blue=actual, orange=predicted, red line=errors. ................. 66
x
Figure 4.13: rational quadratic gaussian process regression RLNN model predicted vs.
true elbow varus torque: blue=observation, black line=perfect prediction. Model
performance: RMSE=16.34, R2=0.70, MSE=266.98, MAE=12.417. ............................. 67
Figure 5.1: ROM results compared across studies............................................................ 69
Figure 5.2: D and ND shoulder rotational strength ratios at 90, 280, and 270˚/sec. ........ 74
Figure 5.3: Comparison of elbow varus torque (Nm) across various levels. .................... 79
Figure 5.4: Comparison of shoulder IR torque across various levels. .............................. 79
Figure 5.5: Comparison of shoulder compressive force across various levels. ................ 80
Figure 5.6: R-squared values for correlations found in this study and Hurd et al. [13].
(EVT = elbow varus torque, Ism = isometric, SPSF = shoulder posterior shear force, Ecc
= eccentric, SAT = shoulder adduction torque, EAT = elbow adduction torque, SIRT =
shoulder internal rotation torque, SERT = shoulder external rotation torque, IRT =
internal rotation torque) .................................................................................................... 84
Figure 5.7: R-squared values for correlations between velocity and clinical measures. .. 85

xi
LIST OF ACRONYMS
ER External Rotation
IR Internal Rotation
ROM Range of Motion
ER/IR External Rotation/Internal Rotation
PT Peak Torque
BW Body Weight
3D Three-dimensional
GIRD Glenohumeral Internal Rotation Deficit
C3D Coordinate 3-Dimensional
LCS Local Coordinate System
GCS Global Coordinate System
LL Leg Lift
FC Foot Contact
BR Ball Release
MER Maximum External Rotation
MIR Maximum Internal Rotation
SLAP Superior Labral from Anterior to Posterior
UCL Ulnar Collateral Ligament
D Dominant
ND Nondominant
C Collegiate
HS High School

xii
PRO Professional
Y Youth
MKH Maximum Knee Height
HSP Hand Separation
EE Elbow Extension
NN Neural Network
RLNN Regression Learner Neural Network
SVM Support Vector Machine
RMSE Root Mean Square Error
MAE Mean Absolute Error
MSE Mean Square Error
EVT Elbow Varus Torque
ISM Isometric
SPSF Shoulder Posterior Shear Force
ECC Eccentric
SAT Shoulder Adduction Torque
EAT Elbow Adduction Torque
SIRT Shoulder Internal Rotation Torque
SERT Shoulder External Rotation Torque
IRT Internal Rotation Torque
GS Grip Strength

1
CHAPTER 1: INTRODUCTION
Baseball pitching involves repetitive, high stresses to the dominant (D) arm that
may alter the soft tissue responsible for controlling the biomechanics. Over time, pitchers
often develop a shift in D arm glenohumeral shoulder rotational range of motion (ROM)
that either increases external rotation (ER) ROM, decreases internal rotation (IR) ROM,
or both [1–4]. Similarly, the strength of the glenohumeral rotator muscles is often tested
to investigate alterations to the D arm [5–12]. These interlimb strength differences are
compared using shoulder external rotation to internal rotation (ER/IR) ratios of peak
torque [5–12]. Lower D arm ER/IR ratios indicate weaker ER muscles, stronger IR
muscles, or both when compared to the nondominant (ND) arm. These imbalances in
flexibility and strength in the opposing muscles of the throwing shoulder may cause
decreased performance and injury [6].
It has been hypothesized that imbalances in strength and flexibility of the D
shoulder of baseball pitchers lead to a decrease in performance and increase in injury
risk, but it is not fully known what specific pitching biomechanics are altered by these
imbalances. There have been several studies showing the existence of these shifts in
shoulder parameters [1,5–11,13,14], along with numerous pitching biomechanical studies
using motion analysis techniques identifying key points of high stresses and torques [15–
18]. Only one study links the strength imbalances to specific pitching kinetics [13]. Thus,
there is a critical need to determine the correlations between shoulder rotational strength,
ROM and biomechanical metrics of the pitching motion. Without such knowledge,
identifying potential for performance decline and injury from shoulder imbalances will
likely remain difficult and invasive.
2
The goal of this study was to determine correlations between shoulder rotational
strength, ROM, and kinetics during pitching determined by motion analysis. The central
hypothesis was that correlations exist between ER/IR ratios and pitching kinetics. This
hypothesis has been formulated based on findings by Hurd et al. who found a positive
correlation between peak shoulder ER moment and clinically measured IR strength, along
with a negative correlation between peak shoulder IR moment and clinically measured
ER ROM [13]. The rationale of this study is that new evidence on relationships between
clinical measures and pitching biomechanics would associate different modalities of
testing (i.e. strength, ROM, motion analysis, neural networks (NN)) to identify risk of
injury, which would be useful to medical and coaching staff alike. It may reveal strength
and flexibility training strategies to decrease abnormally high kinetics. This study
achieved the goal by completing the following specific aims:
Specific Aim 1: Determine clinical measures of shoulder strength and flexibility
and grip strength.
Hypothesis 1: Significant differences will be found between D and ND IR
ROM, and ER ROM.
Hypothesis 2: Significant differences will be found between D and ND
ER/IR ratios.
Hypothesis 3: Significant differences will be found between D and ND
grip strength.
Specific Aim 2: Analyze pitching biomechanics using high-speed, three-
dimensional (3D) motion analysis to determine correlations between clinical
measures and biomechanics.

3
Hypothesis 4: Inverse correlations will be found between rotational
strength ratios and key pitching kinetics.
Specific Aim 3: Develop and train a NN using strength, flexibility and
biomechanics metrics.
Hypothesis 5: Trained NNs can predict key biomechanical metrics using
clinical data.
We expect to determine how shoulder strength and flexibility in collegiate
pitchers affect pitching biomechanics by determining the correlations between clinical
measures and kinetics. This will fill the critical need of determining injury risks to
pitchers associated with strength and flexibility imbalances in the shoulder. This
knowledge will associate different modalities of testing baseball pitchers to identify risk
of injury, along with providing training recommendations to restore balance to the
shoulder and decrease high kinetics correlated with injury. Furthermore, NNs may be
useful for predicting key biomechanics of pitching using clinical metrics, avoiding the
need for motion analysis or maximal effort pitching.
The following section summarizes the current literature on ROM, grip strength,
isokinetic and isometric strength testing, and motion analysis of baseball players. These
studies establish the present status of the problem, rationale for the current study, and
various aspects of the proposed protocol.
4
CHAPTER 2: LITERATURE REVIEW
The purpose of this chapter is to review literature relevant to the topic and to
increase understanding of the purpose of this study. Key terminology, metrics of interest,
and relevant previous findings will be discussed. Content includes: phases of pitching
(section 2.1), common injuries associated with pitching (section 2.2), motion analysis
studies that quantify biomechanics, investigate correlations of pitching metrics, and
compare different populations of pitchers (section 2.3), clinical measures of pitching
including strength and flexibility (section 2.4), and correlations between clinical
measures and biomechanics (section 2.5).
2.1 PHASES OF PITCHING
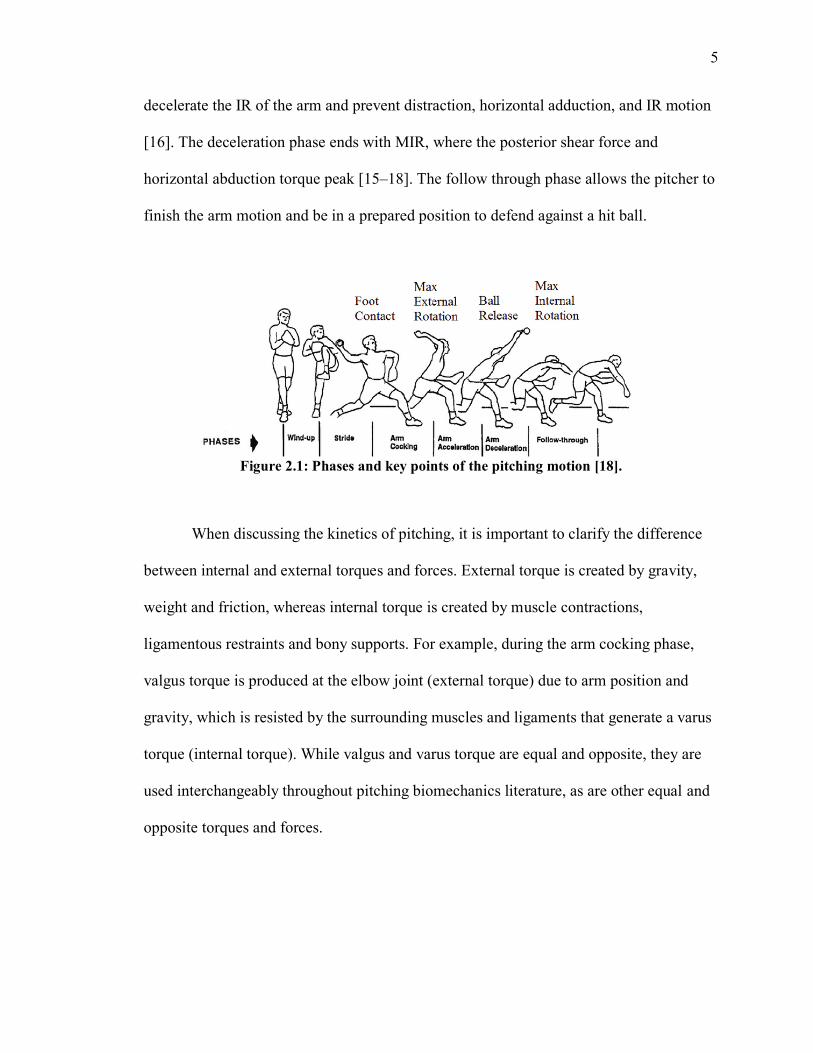
The pitching motion is commonly divided into 6 phases: wind-up, stride, arm
cocking, arm acceleration, arm deceleration, and follow through (figure 2.1). These
phases are separated by key points, including foot contact (FC), maximum shoulder
external rotation (MER), ball release (BR), and maximum shoulder internal rotation
(MIR) [15–18]. Most peak forces and torques occur at or near these points [17]. FC
marks the end of the stride, where hip rotation and lateral trunk movement begin [17,18].
During arm cocking, between FC and MER, the shoulder is externally rotating [15–18].
Just before MER, peak torques occur for shoulder IR and elbow varus torque [15,16].
During arm acceleration, between MER and BR, the arm rapidly accelerates in IR [15–
18]. This action is plyometric for the anterior shoulder, as it concentrically contracts
shortly after being stretched in ER. BR marks the end of the acceleration phase, and the
beginning of the deceleration phase [15–18]. The posterior shoulder muscles attempt to
5
decelerate the IR of the arm and prevent distraction, horizontal adduction, and IR motion
[16]. The deceleration phase ends with MIR, where the posterior shear force and
horizontal abduction torque peak [15–18]. The follow through phase allows the pitcher to
finish the arm motion and be in a prepared position to defend against a hit ball.
Figure 2.1: Phases and key points of the pitching motion [18].
When discussing the kinetics of pitching, it is important to clarify the difference
between internal and external torques and forces. External torque is created by gravity,
weight and friction, whereas internal torque is created by muscle contractions,
ligamentous restraints and bony supports. For example, during the arm cocking phase,
valgus torque is produced at the elbow joint (external torque) due to arm position and
gravity, which is resisted by the surrounding muscles and ligaments that generate a varus
torque (internal torque). While valgus and varus torque are equal and opposite, they are
used interchangeably throughout pitching biomechanics literature, as are other equal and
opposite torques and forces.

6
2.2 PITCHING INJURIES
Baseball pitching is a dynamic, repetitive, high-stress motion that often results in
injury. Injuries to the throwing shoulder are the most common type of injury experienced
by pitchers, and include overuse tendinitis, rotator cuff tears, glenoid labrum fraying,
labral detachment, and capsular laxity problems [19]. Throwing requires the
glenohumeral joint to undergo a large ROM at a high velocity while maintaining joint
stability. Shoulder joint angular velocities have been reported over 7000 ˚/sec during the
acceleration phase of pitching [19]. The muscles responsible for shoulder IR, including
the subscapularis, anterior deltoid, pectoralis major, latissimus dorsi, and teres major,
contract concentrically during the acceleration phase to internally rotate the arm at the
glenohumeral joint. After BR, the external rotators, including the infraspinatus, teres
minor, posterior deltoid, and supraspinatus, contract eccentrically to decelerate the arm. If
the forces and torques demanded during the pitching motion surpass the limits of the
muscles, injury is likely to occur [19].
The muscles of the shoulder, particularly those responsible for ER such as the
infraspinatus and teres minor, are commonly injured during the deceleration phase of
pitching. Microtrauma, inflammation, and decreased muscular performance allow for
increased joint laxity and humeral head translation, creating a higher stability demands on
the surrounding tissue. The humeral head translation causes fibrous degeneration, tissue
damage, altered mechanics, and injury [19]. Pitching requires stability that must be
accounted for primarily by soft tissue since the ball and socket joint of the shoulder is
extremely shallow. Inflammation and pain in the posterior glenohumeral capsule
(posterior capsulitis) is a sign of posterior rotator cuff tendinitis [19].

7
Tensile lesions to the underside of the rotator cuff are another common injury
occurring during the deceleration phase. Obvious weakness of the rotator cuff is not
always present in pitchers but can most often be found via isokinetic strength testing of
the external rotator muscles at 90˚ shoulder abduction [19]. The arm position of 90˚ of
shoulder abduction and elbow flexion is useful to test strength of pitchers due to the
similarity of the arm position during pitching. Rehabilitation from tensile lesions includes
strengthening the rotator cuff, with an emphasis on eccentric contractions [19]. Attention
and research must be applied to identifying ways to strengthen the shoulder musculature
and prevent injuries, particularly those occurring during the deceleration phase due to
eccentric overload.
The glenoid labrum is another tissue commonly injured in the pitching shoulder.
The labrum increases the congruency of the loose-fitting ball-and-socket glenohumeral
joint. The humeral head moves from anterior to posterior in the glenohumeral joint and
undergoes large compressive and shear forces [19]. The superior labrum anterior-
posterior (SLAP) lesion is a common labrum lesion that results from these forces, and
involves a tear on the superior portion of the labrum anterior and posterior to the biceps
tendon proximal attachment [19,20]. Common side effects in pitchers with SLAP lesions
include clicking, popping, shoulder pain, and decreased velocity. Glenoid labrum tears
are commonly treated via arthroscopic surgery, although nonsurgical treatment, while
uncommon for pitchers, may be administered depending on the type of tear [20].
The elbow joint also undergoes extremes of velocity, acceleration, forces, and
torques during the pitching motion. Composed of anterior, posterior, and transverse
oblique bundles, the ulnar collateral ligament (UCL) absorbs high valgus torques during

8
the arm cocking phase of pitching [16]. During the acceleration phase of pitching, the
elbow joint is pushed near its limit, undergoing valgus forces of 64 Nm and compressive
forces of 500 N as the elbow moves from 110 to 20˚ of flexion at rotational velocities of
3000 ˚/sec [21]. Valgus extension overload syndrome is the combination of large valgus
torques with rapid elbow extension, which produces tensile stress along the medial
compartment, shear stress in the posterior compartment and compression stress laterally
[21]. Valgus torque is arguably the most important kinetic metric obtained via motion
analysis to monitor due to its correlation to injury [16,22].
Tensile stress along the medial compartment affects the UCL, flexor-pronator
mass, medial epicondyle apophysis, and ulnar nerve [21]. The shear stress affects the
postmedial tip of the olecranon and the trochlear/olecranon fossa [21]. The lateral
compression stress affects the radial head and capitellum [21]. Injury to the UCL is
particularly debilitating. When torn, UCL reconstruction, also known as Tommy John
surgery after the first pitcher to successfully come back from the surgery, is often
required and involves a recovery period of a year or more [23]. As of 2015, 25% of all
active MLB pitchers had already undergone Tommy John surgery at least once in their
career [24]. Identifying ways to improve pitching biomechanics and decrease excessive
torque on the elbow is important to prevent damage to the elbow joint and its surrounding
tissue.
2.3 BIOMECHANICS OF PITCHING AND MOTION ANALYSIS
To accurately and effectively analyze the biomechanics of the pitching motion, a
quantitative tool is necessary. Motion analysis has been the gold standard to

9
quantitatively describe the pitching motion for over 30 years because of the accurate
biomechanical data it provides [15–17,25–33]. Elbow and shoulder kinetic measures
from biomechanical studies are compared in table 2.1. These kinetics are important
because they have been correlated with injury [16,22].
Table 2.1: Comparison of kinetic measures from various studies (Y=youth, HS=high school,
C=college, PRO=professional, arm slot: OH=overhand, SA=sidearm, 3Q=three-quarters,
Nm=Newton-meters, N=Newtons).
Study Subjects Elbow Varus
Torque (Nm)
Shoulder IR
Torque (Nm)
Shoulder
Compressive
Force (N)
Feltner et al. –
1986 [15] 8 – C 100 ± 20 90 ± 20 860 ± 120
Fleisig et al. –
1995 [16] 26 – PRO 64 ± 12 67 ± 11 1090 ± 110
Aguinaldo et al.
– 2007 [28]
38 – Y, HS, C,
PRO N/A
Y – 33 ± 3
HS – 66 ± 6
C – 78 ± 9
PRO – 78 ± 9
N/A
Aguinaldo et al.
– 2009 [29] 69 – C, PRO 50 ± 29 N/A N/A
Solomito et al –
2015 [30] 99 – C 75.6 ± 15.3 N/A N/A
Laughlin et al. –
2014 [32] 65 – C, PRO N/A
SLAP – 87.8 ±
12.5
Control – 87.5 ±
17.8
N/A
Fleisig et al. –
2015 [33] 80 – PRO
UCL – 99 ± 17
Control - 99 ±
16
UCL - 101 ± 18
Control – 102 ±
17
UCL – 1250 ±
140
Control – 1280 ±
170
Luera et al. –
2018 [25] 77 – HS, PRO
HS – 50.43 ±
17.71
PRO – 86.35 ±
16.23
HS – 54.26 ±
18.21,
PRO – 93.43 ±
16.59
HS – 612.20 ±
142.68,
PRO – 1056.95
± 134.27
Escamilla et al.
– 2018 [26] 207 – PRO
OH – 97 ± 11
SA – 94 ± 16
3Q – 88 ± 12
OH – 98 ± 11
SA – 95 ± 16
3Q – 91 ± 12
OH – 1109 ±
141
SA – 1069 ± 141
3Q – 1129 ± 133
10
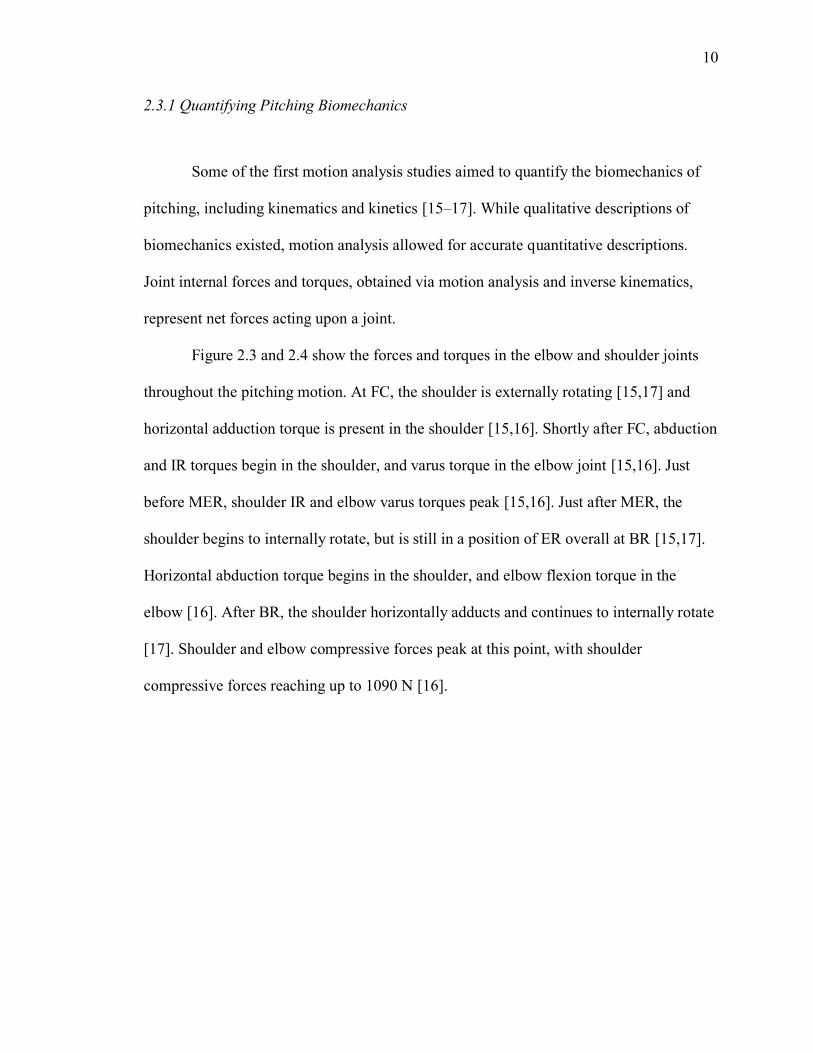
2.3.1 Quantifying Pitching Biomechanics
Some of the first motion analysis studies aimed to quantify the biomechanics of
pitching, including kinematics and kinetics [15–17]. While qualitative descriptions of
biomechanics existed, motion analysis allowed for accurate quantitative descriptions.
Joint internal forces and torques, obtained via motion analysis and inverse kinematics,
represent net forces acting upon a joint.
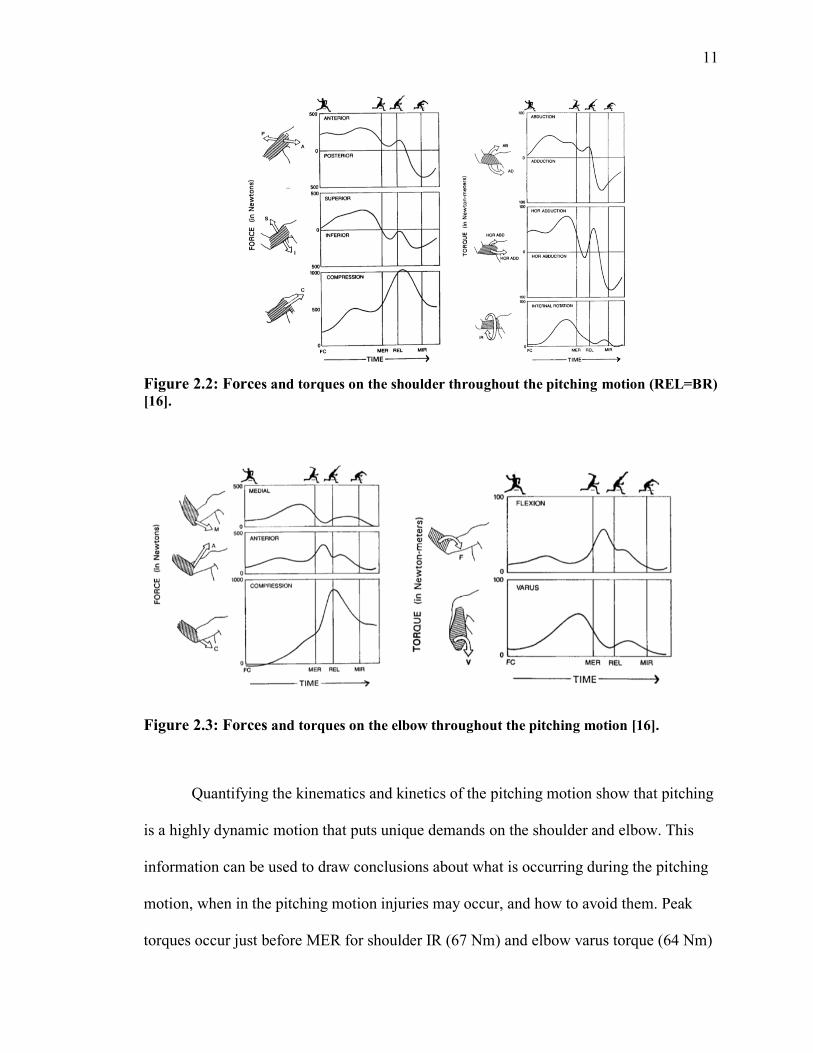
Figure 2.3 and 2.4 show the forces and torques in the elbow and shoulder joints
throughout the pitching motion. At FC, the shoulder is externally rotating [15,17] and
horizontal adduction torque is present in the shoulder [15,16]. Shortly after FC, abduction
and IR torques begin in the shoulder, and varus torque in the elbow joint [15,16]. Just
before MER, shoulder IR and elbow varus torques peak [15,16]. Just after MER, the
shoulder begins to internally rotate, but is still in a position of ER overall at BR [15,17].
Horizontal abduction torque begins in the shoulder, and elbow flexion torque in the
elbow [16]. After BR, the shoulder horizontally adducts and continues to internally rotate
[17]. Shoulder and elbow compressive forces peak at this point, with shoulder
compressive forces reaching up to 1090 N [16].
11
Figure 2.2: Forces and torques on the shoulder throughout the pitching motion (REL=BR)
[16].
Figure 2.3: Forces and torques on the elbow throughout the pitching motion [16].
Quantifying the kinematics and kinetics of the pitching motion show that pitching
is a highly dynamic motion that puts unique demands on the shoulder and elbow. This
information can be used to draw conclusions about what is occurring during the pitching
motion, when in the pitching motion injuries may occur, and how to avoid them. Peak
torques occur just before MER for shoulder IR (67 Nm) and elbow varus torque (64 Nm)

12
[15,16]. The IR torque that resists ER may be transmitted through the humerus to the
elbow joint, where a large varus torque is seen that stresses the UCL [15]. It is estimated
that half of the varus torque at the elbow is placed on the UCL (34.6 Nm), which is above
the maximum varus torque producible to failure in UCLs in cadaveric studies (32.1 Nm)
[16]. Keeping elbow varus torque within a safe range is important to avoid injury to the
UCL that often requires surgery and a lengthy recovery time.
At MER, the arm is can reach an angle of 180˚ ER [17]. The arm then undergoes
rapid IR just after MER, and can reach velocities up to 7000 ˚/sec before BR [17]. Great
care must be taken to prepare the shoulder for these intense demands. Defining,
monitoring and maintaining proper shoulder rotational flexibility and strength may help
pitchers to reduce injury risk to the shoulder. After BR, the shoulder muscles attempt to
decelerate the arm and prevent distraction, horizontal adduction, and IR motion [16].
Compressive force and horizontal adduction torque at this point may be the primary
cause of rotator cuff tears [16]. These conclusions are consistent with the
electromyographic findings showing activity in the posterior shoulder muscles after BR,
including the teres minor, infraspinatus, and posterior deltoid [34].
2.3.2 Pitching Biomechanics Correlations
Increasing pitch velocity without increasing joint loads to unsafe levels allow
pitchers to improve in an efficient manner. Discovering correlations between
biomechanics and other metrics of interest can help pitchers accomplish this. Multiple
studies have investigated correlations between pitch velocity and biomechanics, with the
primary goal of determining ways to increase pitch velocity and performance [27,30,35].
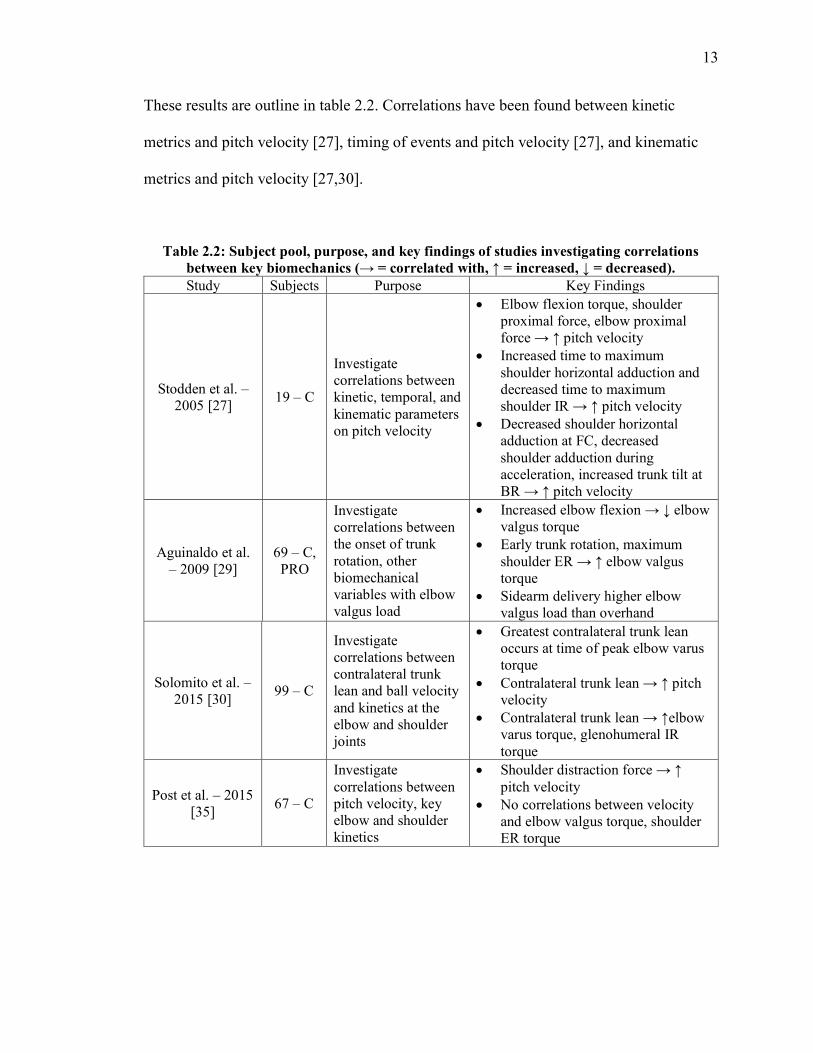
13
These results are outline in table 2.2. Correlations have been found between kinetic
metrics and pitch velocity [27], timing of events and pitch velocity [27], and kinematic
metrics and pitch velocity [27,30].
Table 2.2: Subject pool, purpose, and key findings of studies investigating correlations
between key biomechanics (→ = correlated with, ↑ = increased, ↓ = decreased). Study Subjects Purpose Key Findings
Stodden et al. –
2005 [27] 19 – C
Investigate
correlations between
kinetic, temporal, and
kinematic parameters
on pitch velocity
• Elbow flexion torque, shoulder
proximal force, elbow proximal
force → ↑ pitch velocity
• Increased time to maximum
shoulder horizontal adduction and
decreased time to maximum
shoulder IR → ↑ pitch velocity
• Decreased shoulder horizontal
adduction at FC, decreased
shoulder adduction during
acceleration, increased trunk tilt at
BR → ↑ pitch velocity
Aguinaldo et al.
– 2009 [29]
69 – C,
PRO
Investigate
correlations between
the onset of trunk
rotation, other
biomechanical
variables with elbow
valgus load
• Increased elbow flexion → ↓ elbow
valgus torque
• Early trunk rotation, maximum
shoulder ER → ↑ elbow valgus
torque
• Sidearm delivery higher elbow
valgus load than overhand
Solomito et al. –
2015 [30] 99 – C
Investigate
correlations between
contralateral trunk
lean and ball velocity
and kinetics at the
elbow and shoulder
joints
• Greatest contralateral trunk lean
occurs at time of peak elbow varus
torque
• Contralateral trunk lean → ↑ pitch
velocity
• Contralateral trunk lean → ↑elbow
varus torque, glenohumeral IR
torque
Post et al. – 2015
[35] 67 – C
Investigate
correlations between
pitch velocity, key
elbow and shoulder
kinetics
• Shoulder distraction force → ↑
pitch velocity
• No correlations between velocity
and elbow valgus torque, shoulder
ER torque

14
These findings may give some insight on how to increase pitch velocity and
performance, as well as what kinetic loads on the body increase with pitch velocity.
However, caution should be taken when prescribing changes to pitching mechanics.
Solomito et al. found a positive correlation between pitch velocity and contralateral trunk
lean at MER and BR, but a positive correlation was also found to elbow varus torque and
glenohumeral IR torque [30]. For every 10˚ increase of the median contralateral trunk
lean at MER, pitch velocity increased 1.1 miles per hour (1.5%), while elbow varus
torque increased 3.7 Nm (4.8%) and IR torque by 2.5 Nm (3.2%) [30]. Therefore, while
increasing contralateral trunk lean may improve pitch velocity, the additional risk in the
form of higher torques on the arm may outweigh the benefits of prescribing this
mechanical change to the pitching motion.
Stodden et al. postulated that the biceps brachii may play a critical role during
pitching due to its biarticular nature allowing it to stabilize both the shoulder and elbow
during pitching [27]. The biceps brachii provides elbow flexion torque, controls the rate
of elbow extension, and enhances the effect of shoulder IR torque on the velocity of the
hand during IR [16,27]. The biceps brachii also resists both distraction forces on the
humerus and the forearm [27]. Without proper mechanics, the biceps brachii may
undergo shoulder proximal force and elbow flexion torque simultaneously, resulting in
overload [16,27]. EMG activity in the biceps is higher in pitchers with shoulder
instability [36], and high forces on the biceps brachii may cause the labrum to tear [16].
Elbow flexion torque and shoulder proximal force are both correlated with pitch velocity,
however simply aiming to increase them may not be the best approach. Close attention

15
should be paid to the timing of peak elbow flexion torque and shoulder proximal force
during the pitching motion [27].
Correlations between kinematic and kinetic metrics are important to provide
insight on what causes high forces and torques, and how to decrease them and reduce
injury risk. Increased elbow flexion (at both the point of peak valgus torque and BR) was
correlated with decreased elbow valgus torque [29]. Early trunk rotation and maximum
shoulder ER were correlated with increased elbow valgus torque [29]. Sidearm pitchers
were found to have increased elbow valgus torque compared to overhand throwers [29].
These results show that peak elbow valgus torque is related to the pitching mechanics of
the elbow and shoulder and should be closely monitored.
Increasing pitch velocity without excessive joint load increases allow pitchers to
efficiently improve performance without increasing risk of injury [29]. Investigating
correlations between velocity, kinematics, and kinetics can give coaches and clinicians
useful information on how to make changes to pitching biomechanics to accomplish this
goal. Studies have found correlations between velocity and elbow flexion torque,
shoulder proximal force, elbow proximal force, and contralateral trunk lean [27,30,35].
Increased elbow flexion, and later trunk rotation may decrease elbow valgus torque [29].
Caution and consideration must be given to increased joint loads and injury risk when
prescribing changes to pitching form. More research must be done to further define
correlations between pitch velocity, kinematics, and kinetics to aid in improving
performance and decreasing injury risk.

16
2.3.3 Comparison of Populations, Parameters
Comparing the biomechanics of different populations and parameters is useful to
understand cause and effect relationships, as well as alterations and compensations in
mechanics. Several studies have investigated differences in pitching biomechanics of
varying populations [25,26,28,31–33]. The results of these studies are outlined in table
2.3. Differences in biomechanics across levels of competition have been found
[25,28,31]. Some studies have found professional pitchers are more efficient in certain
aspects when compared to youth, high school, and college pitchers [25,28].

17
Table 2.3: Subject pool, purpose, and key findings of studies comparing biomechanics of
various populations and parameters. Study Subjects Purpose Key Findings
Luera et al. –
2018 [25]
77 –
HS,
PRO
Compare pitch
velocity, kinematics,
kinetics of HS and
PRO pitchers to
identify differences,
role in UCL injury
• HS pitchers experience high elbow
varus torque relative to their body
size compared to PRO pitchers
• PRO pitchers may utilize forces
generated by trunk rotation and
pelvis better than HS pitchers
Escamilla et al. –
2018 [26]
207 –
PRO
Compare
biomechanics of
overhand, 3-quarter,
and sidearm pitchers
• Sidearm pitchers have less shoulder
anterior force, greater elbow
flexion torque and shoulder ER
• Sidearm pitchers may be at greater
risk for labral injury, less risk for
shoulder joint capsule and rotator
cuff injury
Aguinaldo et al.
– 2007 [28]
38 – Y,
HS, C,
PRO
Effects of trunk
rotation on shoulder
rotational torques
during pitching
investigated across
multiple levels
• PRO pitchers had lowest rotational
torque among mature players,
rotated trunks later in pitching
cycle
• Rotating trunk later optimal to
decreased shoulder joint load by
conserving momentum generated
by trunk
Fleisig et al. –
2009 [31]
93 – Y,
HS, C,
PRO
Compare variability
of pitching
biomechanics within
individuals at various
levels of baseball
• Individual kinematics standard
deviations greatest for youth
pitchers, decreased for higher
levels of competition
• No significant differences in
individuals in temporal or kinetic
metrics across all levels
Laughlin et al. –
2014 [32]
65 – C,
PRO
Evaluate
biomechanics of
pitchers with history
SLAP tear, compare
to control group
• SLAP pitchers less shoulder
horizontal abduction, shoulder ER
• SLAP pitchers more upright trunk,
less forward trunk tilt at BR
Fleisig et al. –
2015 [33]
80 –
PRO
Compare
biomechanics of
pitchers with history
of UCL
reconstruction to
control group
• No significant differences in
pitching biomechanics found
between UCL reconstruction and
control group
Professional pitchers may have more consistent and efficient mechanics than
lower level pitcher. Significant differences were found between kinematics the standard

18
deviations of various levels of pitchers (youth, high school, college, minor league, major
league) including front foot placement and front knee flexion at FC, maximum upper
torso angular velocity, maximum elbow flexion, and maximum shoulder ER at arm
cocking, and trunk forward tilt at BR [31]. A decrease in individual standard deviations
of pitching kinematics indicates greater consistency of mechanics. Individual standard
deviations for pitching kinematics were highest for youth pitchers, and tended decrease in
higher levels [31]. Professional pitchers have displayed key kinetic and kinematic
differences compared to lower levels of competition [25,28]. Kinetic differences include
lower elbow varus torque normalized by height and weight (4.48 ± 0.63 Nm/H*BW)
compared to high school pitchers (5.59 ± 0.81 Nm/H*BW) [25], and lower shoulder IR
torque normalized to body weight and height (25 ± 3% BW*H) than college (43 ± 5%
BW*H), high school (49% ± 5% BW*H), and youth (40 ± 3% BW*H) pitchers [28].
Kinematic differences include increased back hip and pelvis rotation at maximum knee
height and hand separation compared to high school pitchers [25], and later trunk rotation
(34.3% of pitch cycle) compared to youth (5.0%), high school (6.4%) and college
(14.2%) [28].
Decreased standard deviations in higher levels of competition may provide
coaching points of emphasis to improve performance. A pitcher must be able to pitch
with velocity and location, among other things, to be successful and rise to higher levels
of competition. High variability in foot placement and front knee flexion at FC may be
easily correctable due to the slow, easily observable nature of the beginning of the
pitching motion [31]. Decreasing variability in kinematics during more rapid phases of
pitching such as maximum elbow flexion and maximum shoulder ER may be more

19
challenging, and may come with repetition and neuromuscular development [31].
Increased variability in forward trunk tilt at lower levels may result in inconsistent pitch
velocity [31], which is in accordance with its correlation with pitch velocity [27]. More
consistent mechanics may lead to increased performance in the form of both increased
pitch velocity and ability to locate pitches [31].
The increased ability of professional pitchers to generate rotational forces and
transfer them up the kinetic chain may explain their increased efficiency in the form of
lower normalized elbow varus torque than high school pitchers [25]. High school pitchers
may increase velocity by placing additional stress on the pitching arm, resulting in
increased risk to injury [25]. Whereas professional pitchers are able to utilize their lower
half keeping their back hip and pelvis back longer [25], and rotating their trunk later in
the pitch cycle [28]. A focus on the rotational kinematics of the back hip, pelvis, and
trunk may aid in increasing velocity and performance without increasing the relative
torque on the elbow [25,28].
Some studies have compared the pitching biomechanics of different pitching arm
slot styles, such as overhand, 3-quarter, and sidearm [26,29]. Sidearm pitchers have been
found to have decreased shoulder anterior force [26], increased elbow flexion torque [26],
increased ER angle [26], and increased elbow valgus torque [29]. However the study by
Escamilla et al. found no significant differences in elbow varus torque between
populations [26], contradicting the study by Aguinaldo et al. [29]. Results have varied,
indicating pitching with different arm slots may have unique kinetic consequences on
pitchers.

20
Grouping pitchers based on injury history and comparing biomechanics is
important to identify possible compensatory and physiological changes resulting from
specific injuries. Comparisons of the biomechanics of pitchers with a history of SLAP
tears [32] and UCL tears [33] to control groups with no injury history have been
performed. SLAP pitchers displayed decreased shoulder horizontal abduction at FC (10.0
± 13.2 vs 21.0 ± 11.7), maximum shoulder ER (168.3 ± 12.7 vs 178.3 ± 7.3), and trunk
forward tilt at BR (30.2 ± 6.3 vs 34.4 ± 6.6) than the control group [32]. These
differences may aid in rehabilitation and coaching of pitchers returning from SLAP tears.
No differences in pitching biomechanics were found between pitchers with previous UCL
tears and the control group [33].
Comparing the biomechanics of different populations of pitchers such as level of
competition, pitching style, and injury history gives useful insight into possible
mechanical advantages, compensatory and physiological changes, rehabilitation methods,
and coaching points of emphasis to improve performance and decrease injury risk. More
research must be done to discover additional differences in pitching biomechanics
between populations and parameters.
2.4 CLINICAL MEASURES OF STRENGTH AND FLEXIBILITY
2.4.1 Flexibility
The glenohumeral joint is a synovial ball-and-socket joint that undergoes extreme
ROM during the pitching motion. The glenohumeral joint has three degrees of freedom:
flexion/extension in the sagittal plane, abduction/adduction in the frontal plane, and
IR/ER in the transverse plane [37]. Of interest is IR and ER because of the high angular

21
velocities and accelerations experienced during pitching. Numerous studies have shown a
shift in ROM of the glenohumeral joint in pitchers, where ER gains flexibility, and IR
loses flexibility [1–4]. This means that the D arm total ROM is similar to the ND arm but
shifted externally (figure 2.7). All studies examined test the ROM with the shoulder in a
position of 90˚ shoulder abduction and 90˚ elbow flexion.
Figure 2.4: Glenohumeral total ROM in the D arm (A) and ND arm (B) showing a shift in
total ROM externally in the D arm of pitchers [20].
Table 2.4 shows the glenohumeral ROM measures between arms of pitchers in
various studies and levels of competition. Most studies show that the D and ND arms in
pitchers have significant differences in glenohumeral rotational ROM. All studies showed
significant differences in both IR and ER ROM [1–4]. Two studies also showed
significant differences in total ROM [2,4]. The measured ROM varied greatly between
the studies, with total ROMs ranging from 146.9 to 230˚.

22
Table 2.4: Comparison of glenohumeral ER and IR ROM studies (* indicates significant
difference between D and ND arms) Values are means with standard deviations (if
provided) in degrees. Study Subjects
D ER
ROM
ND ER
ROM
D IR
ROM
ND IR
ROM
D Total
ROM
ND Total
ROM
Brown et
al. 1988
[1]
41 PRO 141 ±
14.7*
132 ±
14.6*
83 ±
13.9*
98 ±
13.2* 224 230
Hurd et
al. 2011
[2]
210 HS 130 ±
11*
120 ±
10* 60 ± 11* 75 ± 11*
190 ±
15*
195 ±
15*
Anloague
et al.
2012 [3]
42 C 98.92 ±
17.68*
84.94 ±
10.79
47.98 ±
9.88*
60.69 ±
8.27* 146.9 145.6
Wilk et
al. 2015
[4]
296 PRO 131.2* 124.9* 52.3* 62.8* 183.4* 187.7*
Varying stabilization techniques utilized likely contribute to these differences. A
study by Wilk et al. investigated IR ROM using three different stabilization techniques
[38]. The three different methods include stabilization of the humeral head, stabilization
of the scapula, and visual inspection without stabilization (figure 2.8). Significant
differences in IR ROM were found between all three methods (no stabilization 58˚,
scapular stabilization 46˚, humeral head stabilization 40˚) [38]. Of the studies
summarized in table 2.4, one study did not report their stabilization technique [1], one
utilized the humeral head stabilization method [2], and two utilized the scapular
stabilization method [3,4]. Furthermore, three studies ensured the humerus was in the
scapular plane [2–4] while one did not provide detail on the plane involved [1]. In
summary, although the results between studies varied along with some methodology, all
showed significant bilateral differences in glenohumeral rotational ROM.

23
Figure 2.5: Stabilization of humeral head (left), stabilization of scapula (middle) and visual
inspection without stabilization (right) [38].
Studies have also investigated shoulder rotational ROM patterns in the D arm of
pitchers over time [39–41]. Reinold et al. tested glenohumeral D and ND rotational
motion before, immediately after, and 24 hours after pitching [39]. Table 2.5 displays
their results. Changes were not apparent in the ND arm, with no significant differences
before or after pitching for ER, IR, or total ROM [39].
Table 2.5: Glenohumeral ROM before, immediately after, and 24 hours after pitching in the
D shoulder [40] (* indicates significant difference compared to ROM before pitching). Shoulder, ROM Before After 24 Hours After
D ER 136.5 ± 9.8 135.3 ± 9.3 136.5 ± 9.0
D IR 54.1 ± 11.4 44.6 ± 11.9* 46.5 ± 10.0*
D TOTAL 190.6 ± 14.6 179.9 ± 13.7* 182.9 ± 11.5*
Dwelly et al. tested glenohumeral ROM in collegiate baseball players over the
course of the season to examine changes in ROM over time [40]. Significant increases
were observed in ER ROM from pre-fall to pre-spring, and pre-spring to post-spring [40].
Interestingly, these studies show effects on IR ROM acutely, but ER long term. However,
it is important to note that the studies demographics were different, as Reinold et al.
tested professional baseball pitchers while Dwelly et al. tested collegiate baseball and
softball players, including nonpitchers. The study by Dwelly et al. also excluded players

24
who were injured during the season, and because GIRD (glenohumeral IR deficit) is
correlated with shoulder injury [41], pitchers that may have shown IR decreases became
injured and were excluded.
Wilk et al. measured glenohumeral rotational ROM on D and ND arms of pitchers
over the course of three seasons and recorded days missed due to injury or surgery [41].
It was found that pitchers with GIRD (defined as at least 20˚ less IR in the D arm
compared to the ND) were more likely to be injured than those without GIRD (28% vs.
17% injured) [41]. It was also found that 13% of pitchers with total ROM deficits of 5˚ or
less were injured, while 27% of pitchers with greater than 5˚ of total ROM deficits were
injured [41].
Throughout relevant literature, it is apparent that the demands of throwing alter
the physiology of the tissue responsible for controlling the motion of the glenohumeral
joint. Increases in ER ROM, decreases in IR ROM, or both in the D arm compared to the
ND arm occur [1–4]. Both short and long term ROM differences result from pitching in
individuals [39,40]. GIRD and total ROM losses have been linked to injury [41]. More
research must be done on what the healthy glenohumeral rotation ROM range is, as well
as what specific pitching metrics are altered by shifts in ROM. Determining correlations
between shoulder flexibility and pitching biomechanics can help accomplish these tasks.
2.4.2 Isokinetic Strength
Isokinetic testing is useful in assessing the shoulder strength of pitchers.
Dynamometers are isokinetic measurement devices used to measure IR and ER strength
of the shoulder. Dynamometers can measure shoulder torques both eccentrically and

25
concentrically, and at different rotational velocities. Both arms are often tested and
compared to provide insight on bilateral differences in physiology. In research involving
isokinetic strength of baseball players, the arm is typically placed in a position of 90˚
shoulder abduction and 90˚ elbow flexion due to the similarity to the position of the arm
during throwing. Many studies have been performed to examine the isokinetic parameters
of the shoulders of baseball players and pitchers [5–12] (table 2.6).
Table 2.6: Comparison of isokinetic peak torque (Nm) in ER and IR at 90˚ shoulder
abduction and 90˚ elbow flexion across various studies (Subj = subjects, vel. = velocity, *
indicates significant difference between D and ND arm).
Study Subj. Vel.
(˚/sec)
C ER
(D, ND)
C IR
(D, ND)
E ER
(D, ND)
E IR
(D, ND)
C
ER/IR
Ratio
E
ER/IR
Ratio
Ellenbecker
et al. 1997
[5]
125
PRO
210
36.5 ±
6.8,
37.2 ±
6.1
106.9 ±
26.0,
98.4 ±
23.3*
- -
0.67 ±
0.13,
0.74 ±
0.12
-
300
35.7 ±
6.8,
35.8 ±
5.5
95.7 ±
24.4,
87.7±
21.6 *
- -
0.70 ±
0.12,
0.78 ±
0.12
-
Mulligan et
al. 2004 [6]
39
HS
90
9.45 ±
6.47,
9.91 ±
6.74
16.23 ±
11.02,
14.95 ±
10.18*
10.09 ±
4.41,
10.60 ±
9.22
16.65 ±
11.73,
15.40 ±
12.08
0.58 ±
0.16,
0.68 ±
0.15*
0.63 ±
0.16,
0.65 ±
0.24
180
13.63 ±
9.87,
14.76 ±
10.49
20.70 ±
17.15,
20.47 ±
16.61
14.82 ±
11.43,
15.19 ±
10.71
19.14 ±
12.37,
18.82 ±
12.60
0.71 ±
0.18,
0.76 ±
0.21
0.77 ±
0.17,
0.83 ±
0.16
Hinton et al.
1988 [7]
26
HS
90
26.0 ±
5.2,
24.5 ±
5.4 *
40.5 ±
7.3,
35.1 ±
7.9 *
- -
0.69 ±
0.10,
0.76 ±
0.10 *
-
240
18.2 ±
5.0,
17.8 ±
4.7
29.0 ±
8.3,
25.8 ±
6.9 *
- -
0.71 ±
0.14,
0.80 ±
0.11 *
-
Wilk et al.
1993 [8]
150
PRO 180
46.8 ±
8.4,
49.5 ±
9.2 *
73.1 ±
11.9,
71.0 ±
12.9
- -
0.65 ±
0.09,
0.64 ±
0.11
-

26
300
39.7 ±
6.9,
40.8 ±
8.5
66.4 ±
11.5,
65.1 ±
14.1
- -
0.61 ±
0.10,
0.70 ±
0.13
-
Alderink et
al. 1986 [9]
24
HS/C
90
35.7 ±
8.1,
36.3 ±
7.5
53.0 ±
10.6,
52.1 ±
9.9
- -
0.66 ±
0.09,
0.70 ±
0.09
-
120
34.0 ±
7.2,
35.3 ±
6.9
50.6 ±
9.6,
49.1 ±
9.5
- -
0.68 ±
0.10,
0.72 ±
0.07
-
210
31.9 ±
5.8,
34.2 ±
6.0 *
45.0 ±
8.5,
45.0 ±
8.7
- -
0.71 ±
0.19,
0.76 ±
0.09
-
300
30.0 ±
6.0,
32.0 ±
6.2 *
43.0 ±
8.8,
42.4 ±
8.5
- -
0.70 ±
0.08,
0.76 ±
0.11
-
Sirota et al.
1997 [10]
25
PRO
60
66.2 ±
18.0,
59.9 ±
15.5
70.0 ±
20.5,
70.9 ±
16.7
73.9 ±
21.2,
68.6 ±
15.7
81.2 ±
22.5,
79.2 ±
21.3
0.98 ±
0.31,
0.85 ±
0.17
0.93 ±
0.23,
0.89 ±
0.17
120
58.8 ±
15.6,
56.7 ±
13.8
64.1 ±
18.2,
64.3 ±
15.0
76.5 ±
18.0,
75.4 ±
16.5
84.5 ±
21.2,
81.5 ±
20.6
0.97 ±
0.34,
0.91 ±
0.21
0.92 ±
0.15,
0.95 ±
0.17
Mikesky et
al. 1995
[11]
25 C
90
62.1 ±
3.1,
60.7 ±
2.8
96.3 ±
8.9,
88.0 ±
7.2
66.6 ±
3.1,
69.9 ±
3.8
96.5 ±
8.3,
93.2 ±
6.9
0.69 ±
0.05,
0.76 ±
0.05
0.80 ±
0.07,
0.81 ±
0.06
210
54.6 ±
2.7,
55.0 ±
3.0
85.8 ±
7.5,
82.6 ±
6.1
64.9 ±
3.5,
67.9 ±
3.5
102.1 ±
7.5,
98.2 ±
6.2
0.71 ±
0.05,
0.76 ±
0.07
0.72 ±
0.06,
0.74 ±
0.05
300
53.2 ±
2.8,
50.3 ±
2.8
84.0 ±
7.7,
80.1 ±
6.4
63.0 ±
3.1,
65.8 ±
3.4
108.7 ±
6.8,
102.5 ±
6.6
0.72 ±
0.05,
0.75 ±
0.09
0.62 ±
0.04,
0.70 ±
0.06
Noffal et al.
2003 [12] 16 C 300
30.8 ±
4.8,
30.5 ±
4.6
48.4 ±
9.6,
42.1 ±
7.1
55.0 ±
6.6,
61.1 ±
7.3
71.8 ±
9.4,
59.7 ±
11.6
0.65 ±
0.08,
0.73 ±
0.09
-

27
2.4.2.1 Concentric Strength
Several studies have compared isokinetic concentric measures of the D and ND
arm (table 2.6) [5–10]. Some found statistically significant differences between D and
ND arm ER torque [7–9]. Two studies found ER torque lower in the D arm compared to
the ND arm, at 180 ˚/sec [8] and at 210 and 300 ˚/sec [9]. Multiple studies found a
statistically significant difference in isokinetic IR torque between the D and ND arm [5–
7]. The D arm had higher IR torque than the ND arm in each study, at various rotational
velocities: 90˚/sec [6,7], 210 and 300˚/sec [5]. Only one found no statistically significant
differences between rotational torques in either ER or IR between the D and ND limbs
[10].
When comparing results across multiple studies, it is important to note the
differences in methodology. The subject populations ranged from HS to PRO baseball
pitchers. As expected, peak torques increased with level of competition. All the torque
data in table 2.6 was taken with the arm at a position of 90˚ shoulder abduction and 90˚
elbow flexion. Sirota et al. reported mean torques of IR and ER [10], while all other
studies considered reported mean peak torques [5–9]. Finally, different dynamometers
were used across studies, including Cybex [5,9], Kin-Com [6,10], HUMAC [7], Biodex
[8]. Caution must be used when comparing results obtained from different dynamometer
systems.
2.4.2.2 Eccentric Strength
Some studies have tested eccentric rotational strength (table 2.6) [6,10–12]. No
statistically significant differences were found between the D and ND eccentric mean
28
peak torque [6,10,11]. Noffal et. al did not perform statistical analysis to examine
differences in eccentric torque between arms [12]. Populations ranged from HS to PRO,
and test velocities from 60 to 300˚/sec. While not with significance, most D arm
eccentric ER was lower than the ND arm [6,11,12], with the exception of the study by
Sirota et al. [10]. D arm eccentric IR was higher in the D arm in all studies and test
velocities, but also without significance [6,10–12].
The absence of significant differences between arms in eccentric torque
production is counterintuitive, as the D arm ER musculature is subjected to eccentric
loads during the deceleration phase of the pitching motion. Because of this, it would be
reasonable to expect the D arm to have significantly higher eccentric ER torque than the
ND arm. This was not the case in any of the studies reviewed [6,10–12]. Conversely, one
could also expect D arm eccentric ER to be lower than the ND arm because of concentric
ER bilateral differences [8,9], but this was not the case.
2.4.2.3 Isokinetic Torque ER/IR Ratios
ER/IR ratios are useful to quantify the balance between the rotator muscles of the
shoulder. ER/IR ratios can be compared between arms to discover the physiological
changes that pitching causes in the shoulder. If the D arm has increases in strength in one
rotational direction without concurrent increases in the strength in the opposite direction,
an imbalance is will develop, and the ER/IR ratio will differ from that of the ND arm.
For concentric strength ratios, two studies found significant differences between
arms, with the D arm ratio lower than the ND [6,7]. Others did not perform statistical
analysis to determine if significant differences were present between arms, but also

29
showed a lower concentric ER/IR ratio in the D arm compared to the ND [5,9]. Four
studies found no significant difference between concentric ER/IR ratios at any velocity
[8,10–12]. All studies displayed the trend of lower D arm ratios, except for Sirota et al.,
which showed the D arm ratios higher than all the ND arm at all velocities [10]. Three
studies also compared the D and ND eccentric ER/IR ratio [6,10,11]. Although there
were not significant differences between the D and ND arm ratios, all showed a trend of
lower ratios in the D arm than the ND.
One study was unique in calculating a “functional” eccentric ER/concentric IR
ratio [12]. This ratio may be more relevant to pitching because of the specific demands
placed on the shoulder during pitching. These ratios were higher than the concentric
ER/concentric IR due to the eccentric ER contractions producing higher torques. The
functional ratio of the D arm was lower than that of the ND arm (1.17 ± 0.20 vs 1.48 ±
0.22), however statistical analysis was not run [12].
2.4.3 Isometric Strength
Isometric testing is another method of measuring the shoulder strength of baseball
pitchers. Isometric testing involves utilizing a stationary dynamometer to measure
isometric contraction strength of the shoulder. The muscle fibers remain the same length
throughout an isometric contraction. More isokinetic glenohumeral rotation strength
studies have been performed due to the dynamic nature of the pitching motion. However
smaller and less expensive handheld dynamometers used to measure isometric strength
may be more accessible.
30
Studies have shown the IR strength of the D arm significantly greater than the ND
arm, while the ER strength of the D arm was significantly lower than the ND arm
[14,42]. Decreased preseason isometric strength has also been linked to injury in
professional pitchers [43]. Over a 5-year period, an association between prone ER and
prone ER/IR ratio to injury and injury requiring surgery, as well as prone IR to injury
requiring surgery was found [43]. The positions of all three isometric studies differed,
with one laying supine with the arm at 90˚ shoulder abduction and elbow flexion, and 0˚
ER [14], one seated and upright, with 90˚ shoulder abduction and elbow flexion, and 45˚
ER [42], and one laying prone at 90˚ shoulder abduction and elbow flexion, and 0˚ ER.
The position of the arm in ER is particularly important for measuring isometric strength.
If the arm is in ER, the muscles responsible for ER are shortened, decreasing their force
production capabilities. Conversely, if IR is tested in a position of ER, they will be
stretched, resulting in increased passive tension and total force production.
Isometric testing has shown similar results as isokinetic testing and appears to
also be an effective way to measure glenohumeral rotational strength in pitchers.
Attention must be minded to the arm positioning, particularly in ER when comparing
strength data across studies. Isokinetic testing may be more valuable due to the dynamic
nature of the pitching motion, and ability to analyze concentric and eccentric data.
2.4.4 Grip Strength
Limited research has been done on correlations between grip strength and
clinical or biomechanical metrics. Extrinsic hand flexors and extensors both contribute to
grip strength. Flexor muscles crossing the metacarpophalangeal and proximal and distal

31
interphalangeal joints contract to close the hand, while the extensor muscles neutralize
the flexion action at the radiocarpal joint and place it in slight extension to lengthen the
flexion muscles.
Studies have shown grip strength is significantly higher in the D than the ND
hand of baseball players [44,45]. However this may be common for non-baseball players
as well, as Jarit et al. found no significant differences between D/ND grip strength ratios
of baseball players and a control group [45]. Studies have shown that D hand grip
strength is not significantly different from pregame to postgame in collegiate starting
pitchers [46], or in duration of career in semiprofessional pitchers [47]. One study found
a slight relationship between elbow injuries and D hand grip strengths of 25 kg or more in
youth baseball players, but without statistical significance [48]. The same study also
found no relationship between D/ND grip strength ratio and elbow injuries [48]. Wrist
extension may also contribute to pitching. Pedegana et al. found a strong correlation was
found between wrist extension and pitch velocity [49]. However, these results were
contradicted by Bartlett et al., who found no correlations between wrist extension or wrist
flexion and pitch velocity [50].
More research must be done on grip strength of baseball players, specifically
pitchers. The flexor-pronator group of muscles, originating from the medial epicondyle
(pronator teres, flexor carpi radialis, flexor carpi ulnaris, palmaris longus, flexor
digitorum superficialis) provide dynamic support to valgus stresses on the elbow [21].
Injuries and weakness to this group of muscles may be a precursor for UCL injury.
Identifying healthy grip strength ranges, ratios, and correlations to biomechanics of
pitching may be helpful decrease risk of elbow injury in pitchers.

32
2.5 CORRELATIONS BETWEEN BIOMECHANICS AND CLINICAL MEASURES
Finding correlations between clinical measures of shoulder rotational strength and
flexibility and biomechanics of the pitching motion may be useful for preventing injury
and maximizing performance. Determining healthy ratios of ER/IR strength and
flexibility can be accomplished by determining what ratios are linked to normal kinetics,
and what ratios are linked to abnormally high kinetics. Exploring both concentric and
eccentric contractions is valuable because both are required of the shoulder during
pitching.
Some correlations including clinical measures that have been investigated include
arm strength and flexibility and biomechanics [13], arm strength and velocity [50,51],
and arm strength and injury [43]. No correlation was found between isokinetic ER or IR
at 90˚/sec and pitch velocity [50]. Correlations were found between isometric IR and
concentric elbow extension PT/BW and velocity [51]. A negative correlation was found
between isometric ER strength and likelihood of injury requiring surgical intervention. A
negative correlation was also found between ER/IR ratios and incidence of any shoulder
injury [43]. Future research should continue to focus on investigating correlations
between shoulder rotational strength and velocity and injury.
There has been only one study to our knowledge that has found correlations
between clinical measures of strength and flexibility and biomechanics of pitching. Hurd
et al. measured isometric IR and ER strength and pitching biomechanics of high school
baseball pitchers to evaluate correlations between the measures [13]. The study found an
inverse correlation between ER ROM and elbow adduction (varus) moment, and ER
ROM and peak shoulder IR moment (figure 2.10) [13]. They also found a positive

33
correlation between isometric IR strength and peak shoulder ER moment, and peak elbow
adduction moment and peak shoulder IR moment (figure 2.11) [13]. The study
demonstrated that correlations exist between biomechanical measures and clinical
strength measures. The results indicate that as the IR muscles strengthen, more torque is
placed on the ER musculature during pitching. It also indicates that increasing ER ROM
may elbow adduction and shoulder IR moment.
Figure 2.6: Correlations between clinical ER ROM and peak elbow adduction moment
(left), and peak shoulder IR moment (right) [13].
Figure 2.7: Correlations between peak shoulder ER moment and clinical IR strength (left),
and peak elbow adduction moment and peak shoulder IR moment (right) [13].
34
These findings give potential solutions to decreasing high kinetics. More studies
exploring correlations between clinical measures and pitching biomechanics are needed
to discover additional relationships as well as verify those found by Hurd et al. The study
findings may be limited by only using high school pitchers and only performing isometric
strength testing [13]. Isokinetic strength may be more applicable due to the dynamic
nature of the pitching motion. Due to differences found in pitching kinetics between skill
level [25,28,31] and differences in strength ratios of various levels [6,7] the correlations
found by Hurd et al. may not apply to all levels of pitchers. Determining these
correlations will make biomechanical pitching analyses and strength and flexibility tests
more interchangeable. If ER/IR strength ratios are correlated to a kinetic metric, then
strength tests can be performed instead of a biomechanical analysis when they aren’t
available. Training with the goal of altering a strength ratio could become a method for
improving poor kinetics. Our study aims to increase the understanding of the correlations
that exist between pitching biomechanics and shoulder strength and flexibility ratios to
offer solutions to reduce injuries and improve performance.
Correlations can be used to create predictive NNs. Limited research has been
conducted to determine the use of NNs in the sports setting. Kipp et al. created a
nonlinear autoregressive network to predict hip, knee, and ankle joint torques during a
Olympic lift [52]. The inputs were the mass of the barbell and the vertical and horizontal
positions of the barbell. The joint torques were predicted within 6% of the actual torques,
measured via standard inverse dynamics [52]. This study showed that NNs can be used to
predict kinetics using easily measured inputs.

35
No study to our knowledge has used NNs to predict kinetics using known
correlations to clinical measures. This would be useful because clinical measures are
more readily measurable than kinetics via motion analysis and inverse dynamics. If NNs
can accurately predict kinetics using clinical strength measures, estimates can be made
with convenience.

36
CHAPTER 3: METHODS
3.1 SUBJECTS
Twelve subjects (n=12, age: 21.0 years ± 2.4, height: 184.1 cm ± 7.5, and weight:
90.4 kg ± 14.0, 9 right handed, 3 left handed) participated in both test sessions and were
included in statistical analysis. To be included in the study, subjects were required to be
college age pitchers able to throw 10 fastballs during a testing session. Subjects with
injuries in the previous twelve months or with prior shoulder or elbow surgery on the
throwing arm were excluded from the study. Recruitment was performed by contacting
coaches and managers of local collegiate teams and requesting pitcher participation. This
study was approved by the MCW Institutional Review Board. Written informed consent
was obtained prior to study procedures (Appendix A). Subjects underwent two testing
sessions: clinical measurement and 3D motion analysis testing. A minimum of two days
between clinical measurements and motion analysis was required to ensure maximal
effort for both tests.
3.2 TEST PROTOCOL
3.2.1 Clinical Strength and ROM Testing
Passive ROM, grip strength, isokinetic shoulder strength, and isometric shoulder
strength data was obtained during the clinical measures testing session. Anthropometric
measurements recorded included height and weight. The subject underwent a
standardized warm-up that included static and dynamic bilateral stretches. The static

37
warmup included overhead triceps, arm-across deltoid, and forearm wrist flexion and
extension. All static stretches were held for ten seconds. The dynamic warmup included
jumping jacks, arm circles forwards and backwards, and band-exercises of ten reps each
including flies, reverse flies, and IR and ER rotation at zero- and ninety-degrees shoulder
abduction. These stretches were chosen because they involve all the muscles being used
during strength testing and are common to baseball pitching warmups. Dynamic stretches
also helped prepare the subject for the dynamic nature of the isokinetic testing. The
jumping jacks were performed first to elevate the heart rate, followed by the static
stretches, and concluding with the dynamic stretches. After completion of the warmup,
the subjects could do any additional stretches desired. Next, the passive shoulder ER and
IR ROMs were measured before the strength test to ensure the absence of fatigue.
3.2.1.1 Passive Range of Motion Testing
Passive shoulder ER and IR ROM was measured with the subject laying supine
on an exam table with the arm at 90° shoulder abduction, in the scapular plane, and 90°
elbow flexion. The scapular stabilization method was utilized because it is the most
clinically relevant glenohumeral ROM measurement techniques [38] (figure 3.1). The
scapula was stabilized by applying pressure to the coracoid process and the spine of the
scapula, while allowing normal glenohumeral motion [38]. This method allowed the end
of the ROM of the glenohumeral joint to be determined as when the scapula begins to tilt.
The glenohumeral joint was not stabilized to allow for normal glenohumeral
arthrokinematics [38]. A rolled towel was placed under the shoulder parallel with the
humerus to align the humerus with the scapular plane. A goniometer with a bubble level

38
(Jamar E-Z Read, Cedarburg WI) was used to ensure proper alignment in reference to the
ground. The axis of the goniometer was placed over the olecranon process, with one line
perpendicular the ground and the other line parallel with the ulna and ulnar styloid
process, consistent with methods described by Wilk et al. [41].
The same two investigators tested ROM for all subjects, performing the same role
each time. One investigator stabilized the arm and moved it through the rotation, while
the other investigator measured the ROM using the goniometer. The right arm was
measured first, followed by the left arm. Two measurements of ER followed by two IR
were taken for each limb. The subject was instructed to indicate when they felt the end of
their ROM was reached for safety purposes. Subject feedback along with the beginning
of scapular tilt were used to determine the ROM. The average of the two measurements
was recorded for each rotation direction and arm.
Figure 3.1: Shoulder Rotational ROM testing using the scapular stabilization method.

39
3.2.1.2 Grip Strength Testing
Grip strength was measured next using a digital handheld dynamometer (Jamar
Plus+, Cedarburg, WI). The depth of the dynamometer handle was adjusted to so that the
subject felt comfortable gripping it. The subject was seated with their arm at their side,
90° elbow flexion, 0-30° wrist extension and 0-15° ulnar deviation, and 0° of pronation-
supination (figure 3.2). This position was chosen because it is the natural gripping
position of the wrist and arm, and is consistent with relevant literature [53]. Three
repetitions, each lasting three seconds in duration were performed for each hand, starting
with the right hand. The subject was instructed to squeeze the handle with maximum
effort for three seconds, pausing for ten seconds before moving on to the next repetition.
The peak force of each trial, mean, and standard deviation were recorded.
Figure 3.2: Grip strength testing position.

40
3.2.1.3 Isokinetic Strength Testing
Next, isokinetic shoulder strength testing was performed using a Biodex 3
dynamometer (Biodex Corp., Shirley, NY). The Biodex was calibrated according to user
manual instructions before each subject was tested. The procedures of each strength test
were explained to the subject before each round of testing. The subject was secured by
chest and waste straps with their arm positioned at 90° of shoulder abduction and elbow
flexion, and 30˚ of horizontal shoulder abduction to place the arm in the scapular plane,
in accordance with previous studies [5–12].
The order of testing was isokinetic ER followed by IR, then isometric testing in
both directions. A flow chart representation of the strength testing can be seen in figure
3.3. The subject was given a thirty-second rest period between tests in the same rotation
direction, and a two-minute break between different test sets. All tests were performed
for the ND arm before switching to the D arm. The subject was allowed additional time
to stretch if desired after all tests were completed for the first arm. Both isokinetic ER
and IR tests alternated between concentric and eccentric contractions, with five reps
performed in each direction. Five repetitions were determined to be adequate in
accordance with a study performed by Arrigo et al., which determined that during
isokinetic testing of shoulder rotation strength, the peak torque and maximal work
repetitions both occur most often between the 2nd and 4th test repetition [54]. The
isokinetic testing velocity order was 90, 180, and 270 °/sec, consistent with previous
methods [5–12]. All three velocities were tested for ER, followed by all three speeds for
IR.

41
Figure 3.3: Flowchart of isokinetic and isometric strength testing procedures.
3.2.1.4 Isometric Strength Testing
After isokinetic tests were completed for one arm, the isometric test was
performed. Alternating ER and IR isometric strength was measured in the same position
of 90˚ of shoulder abduction and elbow flexion, at 0, 45, and 90° of ER (figure 3.4).
Three repetitions, each lasting five seconds in duration were obtained in each rotational
direction before moving on to the next testing position. The final isometric test concluded
the strength testing for one limb before the opposite arm was tested in the same manner
using both isokinetic and isometric protocols. The subject could perform additional arm
stretches if desired before testing the opposite arm.

42
Figure 3.4: Shoulder rotational strength testing. Top to bottom: positions for isometric
testing of 90, 45, and 0˚ ER. Isokinetic testing consisted of the full 90˚.
3.2.2 Motion Analysis Testing Session
The second testing session involved a 3D biomechanical pitching analysis. A
system of eight Raptor-E cameras (Motion Analysis Corporation, Santa Rosa, CA) was
positioned around an artificial mound to capture the motion of pitchers at 300 frames per
second. Subjects stretched and warmed up as they normally would before pitching. A
treadmill and elastic bands were provided if necessary. The subjects played catch in the
lab to warmup. Forty-seven reflective markers (12.5 mm diameter) were attached to the
subjects at specific locations: five markers on the hat (front, rear, both sides, and top of

43
head), sterno-clavicular process, xiphoid process, C7 and T10 spinous processes, dorsal
side of D hand’s 3rd metacarpal mid-point, dorsal side of the glove mid-base, and
bilaterally the posterior superior iliac spine (PSIS), anterior superior iliac spine (ASIS),
superior tip of acromion process, lateral portion of mid-bicep, medial and lateral
epicondyles of the humerus, posterior portion of mid-forearm, styloid processes of the
radius and ulna, greater trochanter, lateral mid-thigh, lateral and medial femoral condyles,
lateral mid-shank, lateral and medial malleolus, dorsal midpoint of 3rd metatarsal, and
calcaneus (figure 3.5).
Once the subjects were warmed up and markers applied, a static trial was
recorded with the subject standing on the mound, with arms at 90˚shoulder abduction,
elbow flexion, and IR. Ten fastball pitches were recorded, via either windup or stretch
depending on the preference of the subject. Pitches were thrown into a net with a strike
zone, which was used to record the location of each pitch. Velocity was recorded using a
Stalker Sport 2 radar gun (Stalker Sports Radar, Richardson, TX) set up directly behind
homeplate and the netting. Homeplate was positioned 60.5 feet from the pitching rubber.

44
Figure 3.5: Subject after all markers are placed on anatomical landmarks.
3.3 DATA PROCESSING
3.3.1 Clinical Measures Data
Averages and standard deviations were calculated for ER and IR passive ROM for
both shoulders, and for grip strength of each hand. For the isokinetic testing at all three
velocities, peak torque, peak torque normalized to body weight, work normalized to body
weight, and total work were recorded bilaterally. Concentric ER/IR ratio, eccentric ER/IR
ratio, and eccentric ER/concentric IR ratio were calculated. For isometric testing at all

45
three positions, bilateral peak torque and peak torque normalized to body weight were
recorded. ER/IR isometric ratios were calculated.
3.3.2 Motion Analysis Data
Marker data was identified in Cortex software (Motion Analysis Corporation,
Santa Rosa, CA) for static and pitching trials, and then exported into Visual 3D software
(C-Motion, Germantown, MD) to be processed using a full body biomechanical model
previously developed in the MCW Sports Medicine Lab [55,56].
3.3.2.1 Cortex Processing
The static trial was processed first. In a frame with all 47 markers visible, markers
were identified, the trial was trimmed to one frame, and the coordinate 3D (C3D) file of
the marker positions was exported. Three pitches of different velocities, including the top
or near top velocity pitch were selected to be processed. Different velocities were used so
that the game velocity torques could be interpolated. Pitches within or near the strike
zone were used when possible. All markers were identified during the frames of interest,
which began as the lead leg was lifted for the stride and ended after completion of the
deceleration phase.
Once all markers were identified for as much of the frames of interest as possible,
virtual and cubic join were used to fill in the remaining gaps. Cubic join fills in the gaps
using a cubic spline. Virtual join uses the locations of three adjacent markers to create a
virtual marker to fill the gap. The trial was then filtered using a low-pass Butterworth
filter (13.4 Hz), virtual joint centers calculated, and exported as a C3D file. A template

46
was created to fit to the other dynamic trials to expedite the marker identification process.
This procedure was repeated for the remaining two trials to conclude the Cortex
processing.
3.3.2.2 Visual 3D Processing
The four C3D files, including one static trial and three pitches, were imported into
Visual 3D for processing. Calculations were performed on a biomechanical model built
in Visual 3D. The six basic steps to process data captured via motion analysis in Visual
3D are: 1. Creating a model using a static trial, 2. Associating data from dynamic trials to
model, 3. Performing signal and event processing, 4. Defining kinematic and kinetic
calculations, 5. Generating a report of the kinematics and kinetics, and 6. Exporting data
for additional analysis [57].
The static trial with the subject standing in the modified T-position was used to
create the model. Descriptions of the segment details and their local coordinate systems
(LCS) are provided in table 3.1. Body segments included pelvis, thighs, shanks, feet,
thorax, upper arms, forearms, hands, and head. Segments were defined in Visual 3D
using the proximal and distal joints and radius. Joints were defined using lateral or medial
markers, or joint centers. If lateral or medial markers were used to define the segment
end, markers were directly used. Joint centers were calculated as half the distance
between a lateral and medial markers. The radii of segment ends were also calculated as
half the distance between lateral and medial markers. Additional markers on the segment
that were not used to define it were selected as tracking markers. The LCSs were defined
using a series of unit vectors. The �⃗� vector was always along the long axis of the bone.
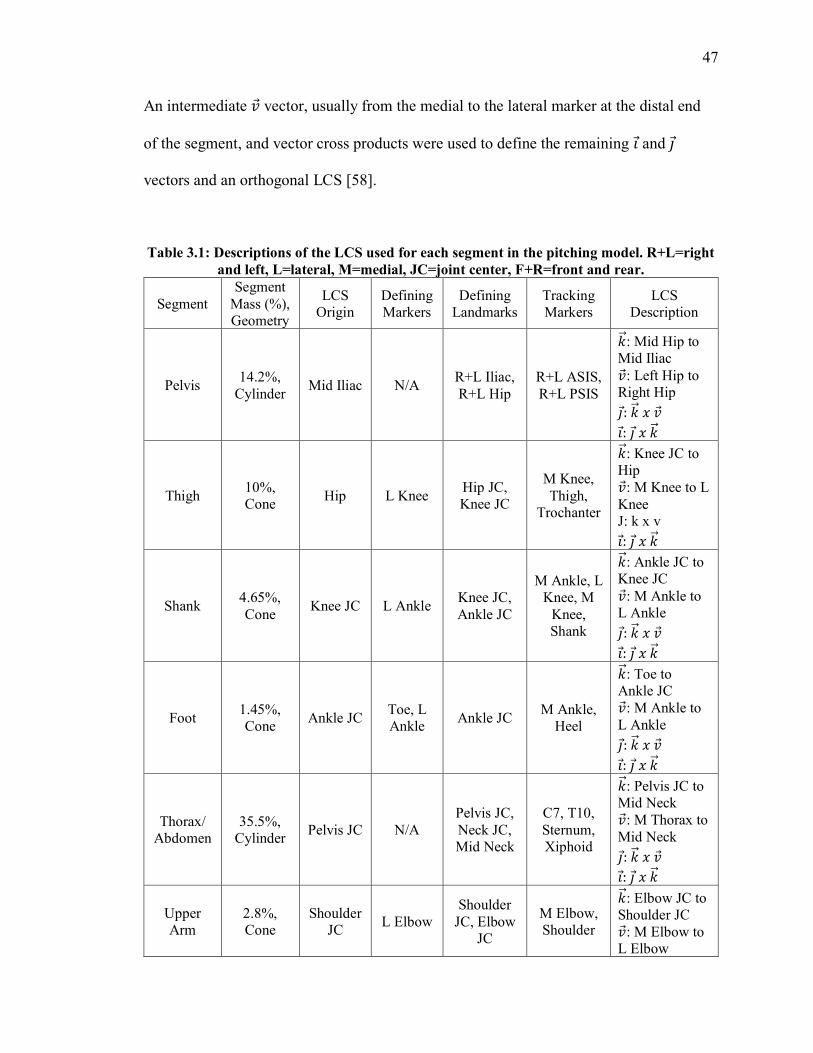
47
An intermediate 𝑣 vector, usually from the medial to the lateral marker at the distal end
of the segment, and vector cross products were used to define the remaining 𝑖 and 𝑗
vectors and an orthogonal LCS [58].
Table 3.1: Descriptions of the LCS used for each segment in the pitching model. R+L=right
and left, L=lateral, M=medial, JC=joint center, F+R=front and rear.
Segment
Segment
Mass (%),
Geometry
LCS
Origin
Defining
Markers
Defining
Landmarks
Tracking
Markers
LCS
Description
Pelvis 14.2%,
Cylinder Mid Iliac N/A
R+L Iliac,
R+L Hip
R+L ASIS,
R+L PSIS
�⃗� : Mid Hip to
Mid Iliac
𝑣 : Left Hip to
Right Hip
𝑗 : �⃗� 𝑥 𝑣
𝑖 : 𝑗 𝑥 �⃗�
Thigh 10%,
Cone Hip L Knee
Hip JC,
Knee JC
M Knee,
Thigh,
Trochanter
�⃗� : Knee JC to
Hip
𝑣 : M Knee to L
Knee
J: k x v
𝑖 : 𝑗 𝑥 �⃗�
Shank 4.65%,
Cone Knee JC L Ankle
Knee JC,
Ankle JC
M Ankle, L
Knee, M
Knee,
Shank
�⃗� : Ankle JC to
Knee JC
𝑣 : M Ankle to
L Ankle
𝑗 : �⃗� 𝑥 𝑣
𝑖 : 𝑗 𝑥 �⃗�
Foot 1.45%,
Cone Ankle JC
Toe, L
Ankle Ankle JC
M Ankle,
Heel
�⃗� : Toe to
Ankle JC
𝑣 : M Ankle to
L Ankle
𝑗 : �⃗� 𝑥 𝑣
𝑖 : 𝑗 𝑥 �⃗�
Thorax/
Abdomen
35.5%,
Cylinder Pelvis JC N/A
Pelvis JC,
Neck JC,
Mid Neck
C7, T10,
Sternum,
Xiphoid
�⃗� : Pelvis JC to
Mid Neck
𝑣 : M Thorax to
Mid Neck
𝑗 : �⃗� 𝑥 𝑣
𝑖 : 𝑗 𝑥 �⃗�
Upper
Arm
2.8%,
Cone
Shoulder
JC L Elbow
Shoulder
JC, Elbow
JC
M Elbow,
Shoulder
�⃗� : Elbow JC to
Shoulder JC
𝑣 : M Elbow to
L Elbow

48
𝑗 : �⃗� 𝑥 𝑣
𝑖 : 𝑗 𝑥 �⃗�
Forearm 1.6%,
Cone Elbow JC L Elbow
Elbow JC,
Wrist JC
M Elbow,
M Wrist, L
Wrist
�⃗� : Wrist JC to
Elbow JC
𝑣 : M Wrist to L
Wrist
𝑗 : �⃗� 𝑥 𝑣
𝑖 : 𝑗 𝑥 �⃗�
Hand 0.6%,
Sphere Wrist JC L Wrist
Wrist JC,
Hand JC
M Wrist,
Hand
�⃗� : Hand JC to
Wrist JC
𝑣 : Wrist JC to
L Wrist
𝑗 : �⃗� 𝑥 𝑣
𝑖 : 𝑗 𝑥 �⃗�
Head 8.1%,
Ellipsoid
Mid
Neck R Ear
Mid Neck,
Mid Head
Top Head,
F+R Head,
R+L Ear
�⃗� : Mid Head to
Mid Neck
𝑣 : Mid head to
R Ear
𝑗 : �⃗� 𝑥 𝑣
𝑖 : 𝑗 𝑥 �⃗�
Segment mass was calculated using predetermined proportions of the subject
mass. Segment lengths were calculated using distances between proximal and distal
markers or joint centers. The segment mass and geometry were used to compute inertial
values. No constraints were placed on segments, and all degrees of freedom were
permitted.
Once the model was created and applied to the static trial, the pitching trials were
then associated with the model. This applied the created model and defined segments and
LCS to the dynamic pitching trials. With the model now created and applied to all trials
of interest, calculations including event detection, kinematics and kinetics were
performed.

49
3.3.2.2.1 Kinematic Metrics
Kinematic metrics calculated included joint angles and joint and segment
velocities and accelerations. Joint angles were calculated in Visual3D using Cardan
angles. Three segment orientation matrices for X, Y, and Z were calculated and
multiplied together to obtain a decomposition matrix. This provided the orientation of a
segment LCS with respect to the global coordinate system (GCS). The decomposition
matrix was computed for two adjacent segments, and then the distal segment matrix was
multiplied by the transpose of the proximal segment matrix to obtain a joint matrix.
Finally, the Cardan angles were then computed to find the joint angles [58]. Lower
extremity joint angles calculated included pelvis, right and left hip, right and left knee,
and right and left ankle. Upper extremity joint angles calculated included thorax, right
and left shoulder, and right and left elbow. The separation angle between the thorax and
pelvis was also calculated. All joint angles calculated were XYZ Cardan sequences,
except for the shoulder which was ZYZ, as recommended by ISB standards [59].
Joint and segment angular velocities were calculated by differentiating the
rotation matrix calculated for joint angles. Once an angular velocity vector was
calculated, additional differentiation provided angular accelerations. Angular velocity and
acceleration were calculated for the pelvis, right and left hip, right and left ankle, thorax,
right and left shoulder, and right and left elbow.
3.3.2.2.2 Kinetic Metrics
Net joint reaction forces and internal moments were calculated using inverse
dynamics. Inverse dynamics in Visual3D compute net moments generated by muscles

50
crossing a joint assuming they are the primary controllers of the movement, and does not
allow for individual muscle contributions to be determined [60]. The segment kinematics
and inertial properties allow inverse dynamics calculations. The assumptions of inverse
dynamics in Visual3D include equal and opposite forces and moments about a joint, and
the distal end of one segment is not assumed to be located at the same point as the
proximal end of the adjacent segment [61]. Net joint forces calculated included bilateral
knee, shoulder, and elbow. Net internal moments calculated included pelvis, thorax, and
bilateral knees, shoulders, and elbows. Joint rate of loading was calculated for the pelvis,
thorax, and bilateral shoulders, and elbows using the first derivative of the calculated net
internal moments.
3.3.2.2.3 Timing Events
With kinematics and kinetics calculated, key events and timing of the pitching
motion were calculated. This allowed the kinematics and kinetics to be extracted at key
points in the pitching motion when peaks often occur. Leg lift (LL) was defined as the
global max of the proximal end position of the lead leg shank segment in the Z direction.
FC was defined as the threshold cross of zero of the lead leg ankle velocity in the X
direction after the global minimum velocity in the same direction. Ball release (BR) was
defined as the frame when the distal end of the forearm segment crossed over the
proximal end in the anterior direction after the global minimum of the center of gravity of
the forearm segment in the Y direction occurred. Maximum MER and MIR were defined
as the frames when global maximum and minimum of the throwing shoulder joint angle
in the Z direction, respectively.
51
Once the timing of all key events was defined, the metrics of interest for each key
event were calculated LL metrics included knee height as a percent of subject height,
pelvis rotation angle, and torso rotation angle. FC, MER, and BR metrics all included
shoulder abduction, horizontal abduction, and ER, elbow flexion, pelvis rotation, torso
rotation, body separation, lead hip flexion, and lead knee flexion angles. FC also included
stride length, which was calculated by subtracting the left foot position from the right
foot position and dividing by subject height. BR also included trunk forward and lateral
flexion angles. MIR metrics included shoulder IR, lead knee flexion, trunk forward
flexion, and elbow flexion angles.
Phases of the pitching motion were also defined, and key kinetics calculated
within these phases. The arm cocking phase was defined as FC to MER, and maximum
values within this phase were calculated for shoulder anterior, superior, and medial shear
forces, shoulder abduction, horizontal adduction, and IR torques, and elbow varus torque.
The arm acceleration phase was defined as MER to BR, and maximum values within this
phase were calculated for elbow anterior shear force and elbow flexion torque. The arm
deceleration phase was defined as BR to MIR, and maximum or minimum values within
this phase were calculated for shoulder compressive, posterior shear, and inferior shear
forces, elbow compressive force, and shoulder horizontal abduction and adduction
torques. Finally, elbow varus torque, shoulder IR torque, and shoulder posterior shear
force values for the three pitches were interpolated to game velocity. After all metrics
were calculated in Visual 3D, data was exported to Excel. Once all data was exported to
excel, group averages and standard deviations for all metrics were calculated.

52
3.4 STATISTICAL ANALYSIS
Minitab (Minitab Inc., State College, PA) was used for determining significant
differences between arms and correlations. Descriptive statistics including mean and
standard deviation were calculated. A distribution test and an outlier test were performed
for all data. Pearson’s correlation was run initially to identify correlations between
clinical measures and kinetics. Linear regression was then performed and plotted for each
correlation and 𝑅2 and p-values were reported.
A NN was created in Matlab (Mathworks, Natick, MA) to investigate predictive
modeling. The regression learner neural network (RLNN) application predicts data by
training the model. Training the model involves machine learning; inputting known
predictor and outcome data. Training allows the model to then predict the output using
only inputs. 4-fold cross validation was selected to validate the model since the sample
size (12) was too small for holdout validation. Cross-validation works by partitioning the
data into a specified number of folds (4), training the data using out-of-fold observations,
and using in-fold observations to estimate the model performance.

53
CHAPTER 4: RESULTS
Twelve subjects (n=12, 9 right hand D, 3 left hand D, with averages of: age: 21.0
years ± 2.4, height: 184.1 cm ± 7.5, and weight: 90.4 kg ± 14.0) completed both the
clinical measures and pitching biomechanics test sessions and were included in statistical
analysis. An outlier test was performed using Minitab (Minitab Inc., State College, PA),
and outlier data points were excluded for linear regression analysis. An additional subject
was excluded entirely for statistical analysis because of a key clinical measure being an
outlier. This chapter summarizes the results from the testing sessions and statistical
analyses.
4.1 CLINICAL MEASURES
Means and standard deviations of each clinical measure of interest were
calculated in Minitab (Minitab Inc., State College, PA). Statistical analysis of clinical
measures consisted of paired t-tests to determine significant differences between D and
ND metrics. The p-value was set to 0.05. Table 4.1 displays the ROM and grip strength
means, standard deviations, and p-values. The D arm had significantly more ER ROM (p-
value=0.001), and total ROM (p-value=0.027) than the ND arm. No statistically
significant differences were found between arms for IR ROM or GS.

54
Table 4.1: ROM and grip strength averages and standard deviations for D and ND arms. *
denotes significance.
Metric D ND P-value
ER ROM
(degrees) 110.4 ± 9.2 101.08 ± 5.25 0.001*
IR ROM
(degrees) 73.5 ± 11.2 76.71 ± 13.14 0.227
Total ROM
(degrees) 183.8 ± 17.2 177.8 ± 16.8 0.027*
GS (kg) 50.5 ± 10.5 49.9 ± 11.0 0.589
Table 4.2, 4.3, and 4.4 show the clinical measures of isokinetic strength at 90,
180, and 270 degrees per second, respectively. These measures include both concentric
and eccentric IR and ER PT normalized to body weight, concentric ER to IR PT ratio,
eccentric ER to IR PT ratio, and eccentric ER to concentric IR PT ratio. No significant
differences were found between arms for any of the measures at all three test velocities.
Eccentric PTs were consistently higher than concentric PTs in both ER and IR at all test
velocities. The mean concentric ER/IR ratio was higher than the eccentric ER/IR ratio.
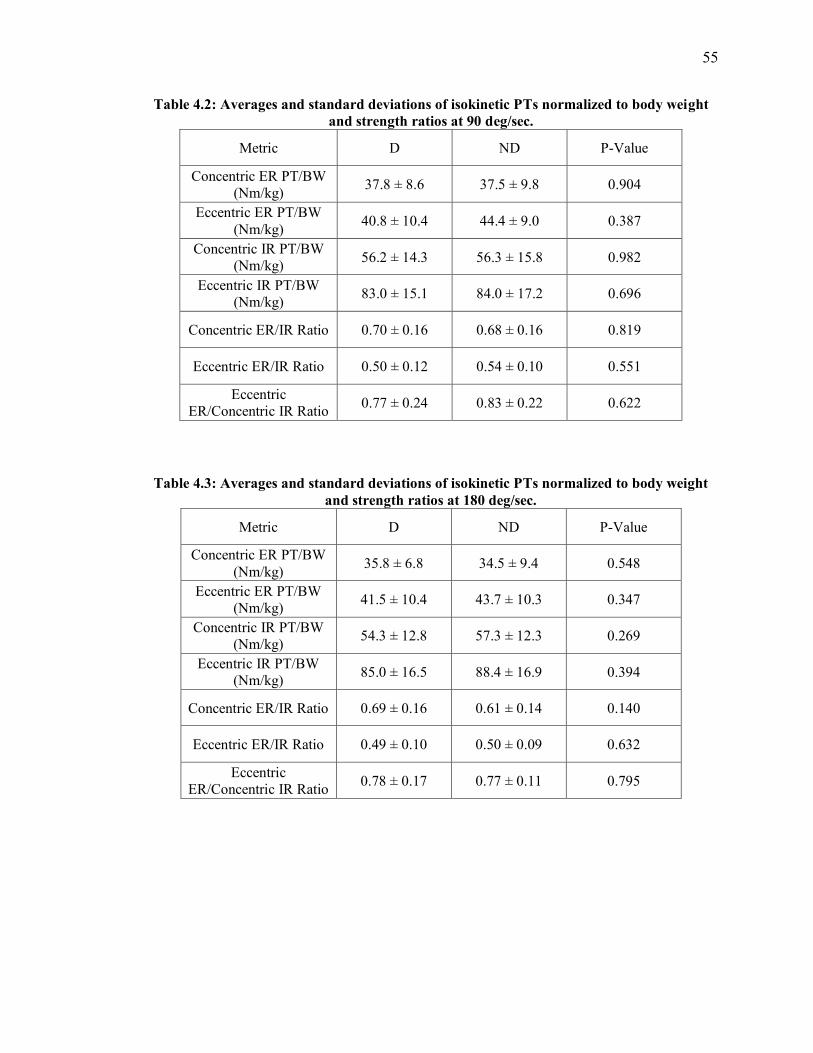
55
Table 4.2: Averages and standard deviations of isokinetic PTs normalized to body weight
and strength ratios at 90 deg/sec.
Metric D ND P-Value
Concentric ER PT/BW
(Nm/kg) 37.8 ± 8.6 37.5 ± 9.8 0.904
Eccentric ER PT/BW
(Nm/kg) 40.8 ± 10.4 44.4 ± 9.0 0.387
Concentric IR PT/BW
(Nm/kg) 56.2 ± 14.3 56.3 ± 15.8 0.982
Eccentric IR PT/BW
(Nm/kg) 83.0 ± 15.1 84.0 ± 17.2 0.696
Concentric ER/IR Ratio 0.70 ± 0.16 0.68 ± 0.16 0.819
Eccentric ER/IR Ratio 0.50 ± 0.12 0.54 ± 0.10 0.551
Eccentric
ER/Concentric IR Ratio 0.77 ± 0.24 0.83 ± 0.22 0.622
Table 4.3: Averages and standard deviations of isokinetic PTs normalized to body weight
and strength ratios at 180 deg/sec.
Metric D ND P-Value
Concentric ER PT/BW
(Nm/kg) 35.8 ± 6.8 34.5 ± 9.4 0.548
Eccentric ER PT/BW
(Nm/kg) 41.5 ± 10.4 43.7 ± 10.3 0.347
Concentric IR PT/BW
(Nm/kg) 54.3 ± 12.8 57.3 ± 12.3 0.269
Eccentric IR PT/BW
(Nm/kg) 85.0 ± 16.5 88.4 ± 16.9 0.394
Concentric ER/IR Ratio 0.69 ± 0.16 0.61 ± 0.14 0.140
Eccentric ER/IR Ratio 0.49 ± 0.10 0.50 ± 0.09 0.632
Eccentric
ER/Concentric IR Ratio 0.78 ± 0.17 0.77 ± 0.11 0.795

56
Table 4.4: Averages and standard deviations of isokinetic PTs normalized to body weight
and strength ratios at 270 deg/sec. Metric D ND P-Value
Concentric ER PT/BW
(Nm/kg) 35.0 ± 8.4 31.8 ± 8.5 0.228
Eccentric ER PT/BW
(Nm/kg) 36.7 ± 12.0 38.7 ± 13.2 0.316
Concentric IR PT/BW
(Nm/kg) 48.5 ± 10.5 51.6 ± 14.3 0.228
Eccentric IR PT/BW
(Nm/kg) 80.3 ± 16.9 81.7 ± 23.8 0.997
Concentric ER/IR Ratio 0.74 ± 0.19 0.63 ± 0.14 0.079
Eccentric ER/IR Ratio 0.46 ± 0.12 0.48 ± 0.08 0.452
Eccentric
ER/Concentric IR Ratio 0.77 ± 0.21 0.76 ± 0.14 0.782
The clinical measures of isometric strength at 90, 45, and 0 degrees shoulder ER
are shown in tables 4.5, 4.6, and 4.7, respectively. These measures include ER and IR PT
normalized to body weight and ER to IR PT ratio. The D arm had significantly lower ER
PT normalized to body weight than the ND arm at 0 degrees shoulder ER (p-value=0.04).
No other statistically significant differences were found between arms for any other
isometric strength measures. Mean IR PTs were higher than mean ER PTs at 90 and 45,
but not 0 degrees of ER.
Table 4.5: Averages and standard deviations of isometric PT normalized to body weight
and strength ratios at arm positions of 90˚ ER. Metric D ND P-Value
ER PT/BW (Nm/kg) 30.8 ± 7.6 29.9 ± 6.2 0.685
IR PT/BW (Nm/kg) 43.6 ± 11.3 43.3 ± 8.1 0.912
ER/IR Ratio 0.75 ± 0.17 0.70 ± 0.13 0.402

57
Table 4.6: Averages and standard deviations of isometric PT normalized to body weight
and strength ratios at arm positions of 45˚ ER. Metric D ND P-Value
ER PT/BW (Nm/kg) 37.2 ± 8.0 39.0 ± 8.1 0.276
IR PT/BW (Nm/kg) 44.5 ± 10.0 44.9 ± 12.5 0.817
ER/IR Ratio 0.84 ± 0.10 0.87 ± 0.15 0.438
Table 4.7: Averages and standard deviations of isometric PT normalized to body weight
and strength ratios at arm positions of 0˚ ER. * denotes significance. Metric D ND P-Value
ER PT/BW (Nm/kg) 36.6 ± 9.7 39.7 ± 7.2 0.044*
IR PT/BW (Nm/kg) 33.8 ± 8.9 35.7 ± 10.4 0.353
ER/IR Ratio 1.08 ± 0.20 1.12 ± 0.28 0.557
4.2 BIOMECHANICAL MEASURES
The average pitch speed was 77.2 ± 4.2 mph. Table 4.8 shows the mean and
standard deviations of the kinetics at the arm cocking and BR phases of the pitching
motion. The variables were normalized to body weight and height to allow for subject-to-
subject and population comparisons and to investigate correlations to the clinical
measures of arm strength and flexibility.

58
Table 4.8: Averages and standard deviations of kinetics at the arm cocking and BR phases
normalized to subject body weight and height. Torque units: Nm and Nm/kg*m, force
units: N and N/kg*m. Arm Cocking Metric
Normalized
Metric
Elbow Medial Shear Force 359.5 ± 20.8 2.18 ± 0.38
Elbow Varus Torque 123.9 ± 8.8 0.75 ± 0.14
Shoulder Anterior Shear Force 196.8 ± 51.6 1.23 ± 0.41
Shoulder Superior Shear Force 281.4 ± 60.3 1.70 ± 0.27
Shoulder Adduction Torque 73.8 ± 14.3 0.45 ± 0.08
Shoulder Horizontal Adduction Torque 30.9 ± 22.8 0.18 ± 0.13
Shoulder IR Torque 116.7 ± 26.1 0.70 ± 0.11
Ball Release
Elbow Anterior Shear Force 697.6 ± 155.2 4.25 ± 0.96
Elbow Flexion Torque 23.6 ± 17.6 0.15 ± 0.10
Elbow Compressive Force 999.1 ± 201.6 6.03 ± 0.83
Shoulder Compressive Force 975.4 ± 188.1 5.89 ± 0.75
Shoulder Posterior Shear Force -645.7 ± 303.9 -3.91 ± 1.82
Shoulder Inferior Shear Force -439.4 ± 287.1 -2.75 ± 1.91
Shoulder Horizontal Abduction Torque 252.1 ± 87.2 1.55 ± 0.61
Shoulder Adduction Torque 191.5 ± 49.0 1.16 ± 0.29
4.3 CORRELATIONS BETWEEN CLINICAL MEASURES, VELOCITY, KINETICS
Correlations were investigated to identify relationships between clinical measures
of arm strength and flexibility and biomechanics of the pitching motion. Normality and
outlier tests were conducted for all data before correlations were investigated. All data
was normally distributed. One outlier was excluded for elbow varus torque/BW*H (1.12).
Correlations were investigated by first performing Pearson’s correlation to identify all
relationships for a variable, then linear regression on the individual correlations found.
R2, the coefficient of determination, was the primary metric used to measure correlation.

59
The value represents the amount of variance explained by the clinical measure. For
example, 51% of the variation in shoulder posterior shear force is explained by eccentric
ER/IR at 270 deg/sec. The remaining 49% may be due to other factors.
The p-level of significance was set to 0.05. Figures 4.1-4.3 show correlations
found between kinetics and strength ratios. All kinetic metrics were normalized to body
weight and height. The correlations found include elbow varus torque and isometric
ER/IR ratio at 90 degrees ER (R2=0.363, p=0.050, figure 4.1), shoulder posterior shear
force and eccentric ER/IR ratio at 180 deg/sec (R2=0.425, p=0.022, figure 4.2), and
shoulder posterior shear force and eccentric ER/IR ratio at 270 deg/sec (R2=0.510,
p=0.009, figure 4.3), All correlations between kinetics and shoulder rotational strength
ratios were negative correlations.
Figure 4.1: Elbow Varus torque normalized by body weight and height (Nm/(kg*m)) vs.
isometric ER/IR ratio at 90 degrees of shoulder ER. R2=0.363, p = 0.050.
1.21.11.00.90.80.70.60.5
0.85
0.80
0.75
0.70
0.65
0.60
0.55
0.50
Isometric ER/IR Ratio, 90 deg
Elb
ow
Varu
s To
rqu
e (
Nm
)/B
W*H
Elbow Varus Torque/BW*H vs Isometric ER/IR Ratio, 90 deg

60
Figure 4.2: Shoulder posterior shear force normalized by body weight and height
(N/(kg*m)) vs. isokinetic eccentric ER/IR ratio at 180 deg/sec. R2=0.425, p=0.022.
Figure 4.3: Shoulder posterior shear force normalized by body weight and height (N/kg*m))
vs. isokinetic eccentric ER/IR ratio at 270 deg/sec. R2=0.510, p=0.009.
0.70.60.50.40.3
-1
-2
-3
-4
-5
-6
-7
-8
-9
Eccentric ER/IR Ratio, 180 deg/sec
Sh
ou
lder
Po
steri
or
Sh
ear
Fo
rce (
N)/
BW
*H
Shoulder Posterior Shear Force/BW*H vs. Eccentric ER/IR Ratio, 180 deg/sec
0.70.60.50.40.3
-1
-2
-3
-4
-5
-6
-7
-8
Eccentric ER/IR Ratio, 270 deg/sec
Sh
ou
lder
Po
steri
or
Sh
ear
Fo
rce (
N)/
BW
*H
Shoulder Posterior Shear Force/BW*H vs. Eccentric ER/IR Ratio, 270 deg/sec

61
Correlations between velocity and clinical measures of strength and flexibility
were also investigated in the same manner. The p-level of significance was set to 0.05.
Figures 4.4-4.9 show the correlations found between velocity and clinical measures. All
correlations found were positive correlations, including velocity and grip strength
(R2=0.444, p=0.018, figure 4.4), velocity and concentric ER PT/BW at 90 deg/sec
(R2=0.357, p=0.040, figure 4.5), velocity and isometric IR PT/BW at 90 deg ER
(R2=0.350, p=0.043, figure 4.6), velocity and ER PT/BW at 45 deg ER (R2=0.529,
p=0.007, figure 4.7), velocity and IR PT/BW at 45 deg ER (R2=0.395, p=0.029, figure
4.8), and velocity and ER PT/BW at 0 deg ER (R2=0.702, p=0.001, figure 4.9).
Figure 4.4: Velocity (mph) vs. grip strength (kg). R2=0.444, p=0.018.
7060504030
84
82
80
78
76
74
72
70
Grip Strength (kg)
Velo
city
(m
ph
)
Velocity vs Grip Strength

62
Figure 4.5: Velocity (mph) vs. concentric ER torque normalized to body weight (Nm/kg) at
90 degrees/sec. R2=0.357, p=0.040.
Figure 4.6: Velocity (mph) vs. Isometric IR PT normalized to body weight (Nm/kg) at an
arm position of 90 degrees ER. R2=0.350, p=0.043.
50454035302520
84
82
80
78
76
74
72
70
Concentric External Rotation Peak Torque/BW (Nm/kg), 90 deg/sec
Velo
city
(m
ph
)
Velocity vs Concentric External Rotation Peak Torque/BW, 90 deg/sec
6050403020
84
82
80
78
76
74
72
70
Isometric Internal Rotation Peak Torque/BW (Nm/kg), 90 deg
Velo
city
(m
ph
)
Velocity vs Isometric Internal Rotation Peak Torque/BW, 90 deg

63
Figure 4.7: Velocity (mph) vs. isometric ER PT normalized to body weight (Nm/kg) at an
arm position of 45 degrees ER. R2=0.529, p=0.007.
Figure 4.8: Velocity (mph) vs. isometric IR PT normalized to body weight (Nm/kg) at an
arm position of 45 degrees ER. R2=0.395, p=0.029.
50454035302520
84
82
80
78
76
74
72
70
Isometric External Rotation Peak Torque/BW (Nm/kg), 45 deg
Velo
city
(m
ph
)
Velocity vs Isometric External Rotation Peak Torque/BW 45 deg
60555045403530
84
82
80
78
76
74
72
70
Isometric Internal Rotation Peak Torque/BW (Nm/kg), 45 deg
Velo
city
(m
ph
)
Velocity vs Isometric Internal Rotation Peak Torque/BW, 45 deg
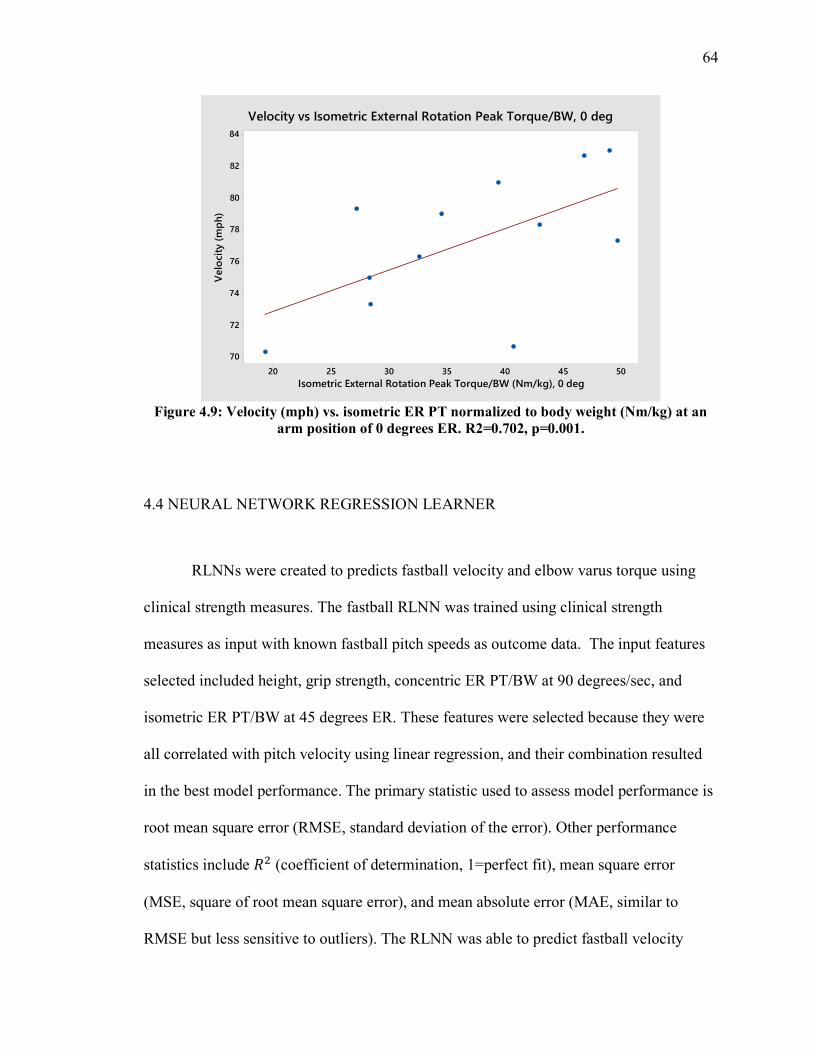
64
Figure 4.9: Velocity (mph) vs. isometric ER PT normalized to body weight (Nm/kg) at an
arm position of 0 degrees ER. R2=0.702, p=0.001.
4.4 NEURAL NETWORK REGRESSION LEARNER
RLNNs were created to predicts fastball velocity and elbow varus torque using
clinical strength measures. The fastball RLNN was trained using clinical strength
measures as input with known fastball pitch speeds as outcome data. The input features
selected included height, grip strength, concentric ER PT/BW at 90 degrees/sec, and
isometric ER PT/BW at 45 degrees ER. These features were selected because they were
all correlated with pitch velocity using linear regression, and their combination resulted
in the best model performance. The primary statistic used to assess model performance is
root mean square error (RMSE, standard deviation of the error). Other performance
statistics include 𝑅2 (coefficient of determination, 1=perfect fit), mean square error
(MSE, square of root mean square error), and mean absolute error (MAE, similar to
RMSE but less sensitive to outliers). The RLNN was able to predict fastball velocity
50454035302520
84
82
80
78
76
74
72
70
Isometric External Rotation Peak Torque/BW (Nm/kg), 0 deg
Velo
city
(m
ph
)
Velocity vs Isometric External Rotation Peak Torque/BW, 0 deg

65
within 2.29 mph (RMSE=2.2924, R2=0.70, MSE=5.2549, MAE=1.9064). The cubic
support machine vector model was selected because it had the lowest RMSE. Figure 4.10
shows the response plot and figure 4.11 shows the predicted vs. actual fastball velocity.
Figure 4.10: Velocity predicting cubic SVM RLNN model response plot: blue=actual,
orange=predicted, red line=errors.
Figure 4.11: Cubic SVM NN linear regression learner model predicted vs. true fastball
velocity: blue=observation, black line=perfect prediction. Model performance:
RMSE=2.2924, R2=0.70, MSE=5.2549, MAE=1.9064.

66
The elbow varus torque RLNN was able to predict torque within 16.34 Nm on
average (RMSE=16.34, R2=0.70, MSE=266.98, MAE=12.417). A rational quadratic
gaussian process regression model was used because it had the lowest RMSE value.
Figures 4.12 and 4.13 show the actual vs predicted value with error, and the predicted vs
true response plots, respectively.
Figure 4.12: Elbow varus torque predicting rational quadratic gaussian process regression
RLNN model response plot: blue=actual, orange=predicted, red line=errors.
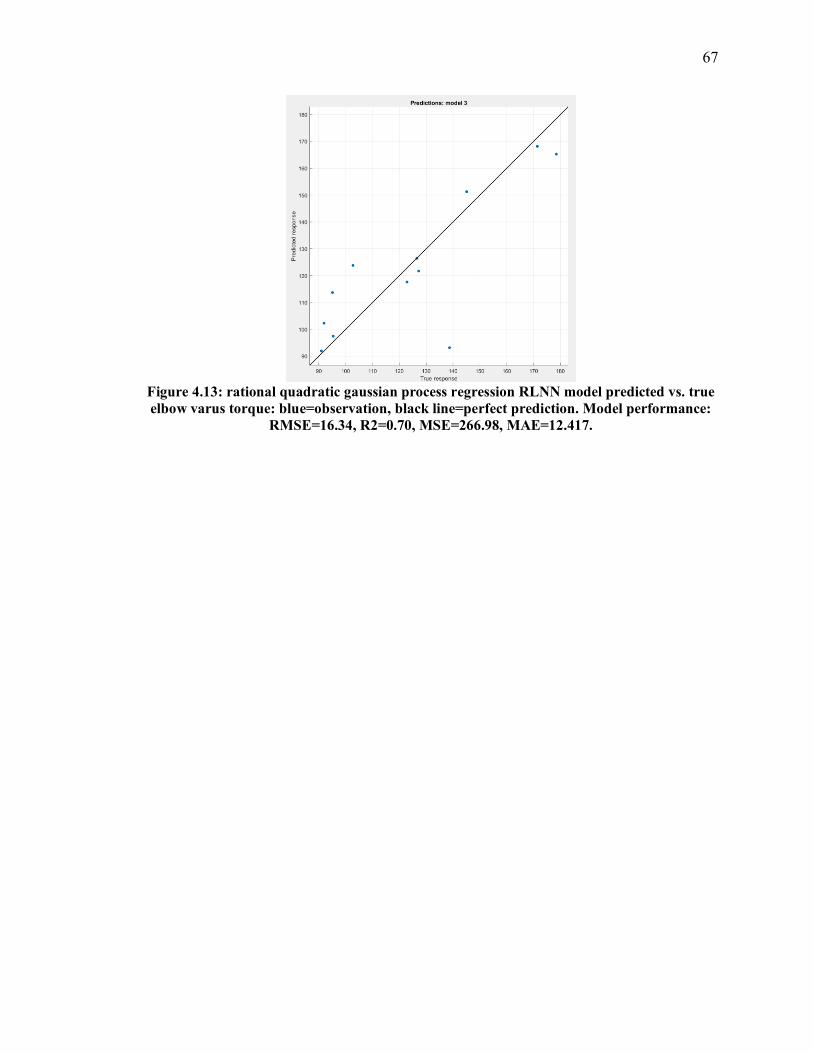
67
Figure 4.13: rational quadratic gaussian process regression RLNN model predicted vs. true
elbow varus torque: blue=observation, black line=perfect prediction. Model performance:
RMSE=16.34, R2=0.70, MSE=266.98, MAE=12.417.

68
CHAPTER 5: DISCUSSION
Limited research has investigated correlations between clinical measures of
strength and flexibility and pitching biomechanics or using correlations to train NNs and
predict key pitching metrics using clinical data. The purpose of this study was to
determine correlations that exist between shoulder rotational strength, ROM, grip
strength, and biomechanical metrics of the pitching motion, and to train a NN to predict
biomechanical metrics using clinical data.
It was hypothesized that significant differences would be found between the D
and ND arm ER and IR ROM, ER/IR strength ratios, grip strength, that negative
correlations would be found between rotational strength ratios and kinetics, and that NNs
can be used to predict key biomechanics using clinical data. The results of this study,
outcomes of the hypotheses, and comparison to previous relevant literature will be
discussed in this chapter. The practical relevance of the results, limitations of the study,
and recommendations for future studies will be discussed.
5.1 CLINICAL MEASURES
5.1.1 Range of motion
Pitching puts unique demands on the shoulder that can alter the rotational ROM in
the D arm. These alterations may be due to osseous changes, soft tissue changes, or a
combination of both. ROM alterations are important to monitor because they may cause
injury [4,41]. It was hypothesized that significant differences would be found between D
and ND arm IR and ER. The hypothesis was found to be partially true. Significant

69
differences were found between D and ND arms for ER ROM (110.4 ± 9.2˚ D vs 101.08
± 5.25˚ ND) and total rotational ROM (183.8 ± 17.2˚ D vs 177.8 ± 16.8˚ ND). No
significant differences were found between D and ND arms for IR ROM (73.5 ± 11.2˚ D
vs 76.7 ± 13.1˚ ND).
The ER ROM results of the current study are consistent with previous studies that
also found ER ROM of the D arm significantly higher than the ND arm [1–4,41]. The IR
ROM results contradict previous studies that found the IR ROM of the D arm
significantly lower than that of the ND arm [1–4,41]. The total ROM results also
contradict previous studies that found the D arm to have less total shoulder rotational
ROM [2,4,41], or did not find any significant difference [3]. The significant difference in
total ROM in our study is likely due to the D arm having increased ER ROM without
concurrent decreases in IR ROM compared to the ND arm. Figure 5.1 displays the
current and previous studies ROM results. The variance in ROM values across studies
was likely due to differences in methodology of testing.
Figure 5.1: ROM results compared across studies.
0
25
50
75
100
125
150
175
200
225
250
RO
M (
deg
)
D vs ND ROM
Brown 1988 Hurd 2011 Anloague 2012 Wilk 2015 Current Study
D ER ND ER D IR ND IR D
70
The method of stabilization during shoulder ROM testing has been shown to yield
significantly different results [38]. Brown et al. did not report their stabilization method
[1], Hurd et al. used the humeral head stabilization method [2], and Wilk et al and
Anloague et al. both used the scapular stabilization method [3,4]. Our study used the
scapular stabilization method. Scapular stabilization may be the best method for
measuring glenohumeral rotational ROM because it does not interfere with the
arthrokinematics of the glenohumeral joint, and eliminates scapular motion [38]. In
addition to stabilization, the plane of the humerus may have differed depending on the
study, with three studies testing in the scapular plane [2–4] and another study not
specifying plane [1]. Our study measured ROM in the scapular plane. The scapular plane
is preferred because this is the functional plane of the glenohumeral joint and does not
put any soft tissue in tension before measurement [38]. The end ROM in this study was
defined as when scapular motion occurred or if subjects indicated they felt they had
reached the end of their ROM or had any discomfort or pain. It is possible that pitchers
were more apprehensive during IR testing of the ND arm since it does not undergo full
rotational ROM as often as the D arm.
Another difference between studies that may account for differences in ROM was
population. The current study tested collegiate pitchers (n=12) along with another study
(n=42 [3]), while two studies tested professional pitchers (n=41) [1], n=296 [4]), and one
tested high school pitchers (n=210 [2]). It has been shown that total ROM decreases with
age in youth baseball players [62], however that trend was not seen with these studies.
ROM decreases with age may be complete by high school, or the differences in sample
size and stabilization method prevented this trend from being realized across the studies.

71
The repetitive, high stress motion of pitching has been shown to create
adaptations to D arm rotational flexibility [1–4,41]. Whether these changes are due to
alterations to osseous bone tissue, soft tissue, or both has yet to be fully determined.
Studies have shown the existence of increased D arm humeral retroversion in pitchers
that also had significant differences in both IR and ER ROM [63,64]. The different
positioning of the humerus in the transverse plane could be the primary cause of ROM
differences between arms. Humeral retroversion is highest in adolescence, and the
humerus naturally derotates with age. With most of the derotation occurring by the age of
8, and full adult values of retroversion occurring between 16-19 [65]. It is possible that
pitching at a young age prevents derotation and results in increased D arm retroversion,
which then alters glenohumeral ROM. A study by Meister et al. showed decreased total
shoulder rotational ROM among youth baseball players with increased age, with the most
dramatic change occurring between the ages of 13 and 14 [62]. These osseous changes
affecting the derotation of humeral retroversion may be primarily responsible for ROM
alterations in youth baseball players, with future alterations due to soft tissue effects.
However, there is also evidence that soft tissue adaptations contribute to the ROM
differences. A significant decrease in both D arm IR and total ROM has been shown
immediately after and 24 hours after pitching [39]. This suggests musculotendinous
adaptations are also responsible for changes in shoulder rotational ROM. Specifically,
muscular and posterior capsule tightness have both been suggested to cause decreases in
IR ROM [66]. Agonist to antagonist strength ratios may also alter ROM; and significant
differences of ER/IR strength ratios between arms of pitchers have been found [6,7].

72
It is not apparent what precise glenohumeral rotational ROM is ideal to avoid
injury, however in general decreased ROM may increase injury risk. Studies have
investigated injury risk of pitchers as it relates to glenohumeral rotational ROM with
varying results [4,41,67]. Conclusions range from decreased D ER ROM correlated to
injury and surgery [4], to pitchers with GIRD twice as likely of injury (but not
statistically significant) [41], to no statistically significant correlations of any shoulder
ROM measure and injury [67]. The musculotendinous factors that may also contribute to
ROM alterations may be primarily due to the eccentric loads placed on the ER muscles.
However, these alterations may be managed by stretching, shoulder exercises, and icing,
especially following pitching [39].
5.1.2 Grip strength
Grip strength may be correlated with pitch velocity [49,68] and higher levels of
professional baseball players have displayed significantly higher grip strength [69]. It was
hypothesized that the grip strength of the D hand would be higher than the ND. This
hypothesis was not supported, as no significant differences were found between D and
ND arms for grip strength (50.5 ± 10.5 kg D vs 49.9 ± 11.0 kg ND). These results
contradict previous studies that showed D grip strength significantly higher than ND in
pitchers [44,45], as well as non-baseball players [45]. Tajika et al. tested high school
pitchers (n=133) using a Takei Scientific Instruments dynamometer, and recorded the
average of three trials [44], while Jarit et al. tested collegiate baseball players as well as a
control group of non-baseball players (n=88) using a Jamar dynamometer, and recorded
the highest of three trials [45]. The position of testing grip strength was the same for all
73
studies with the arm adducted at the side, 90˚ elbow flexion, and forearm and wrist in the
neutral position. Due to similarities to the study by Jarit et al, it was unexpected that our
results did not align with theirs, although this study averaged the trials, while Jarit et al.
took the maximum trial.
Flexor muscles are the primary contributor to grip strength and attach to the
medial epicondyle to help provide elbow stability. The pronator teres, flexor carpi
radialis, palmaris longus, and flexor digitorum superficialis all provide dynamic support
to valgus stresses placed on the elbow and the UCL [21]. It is possible that increased grip
strength provides more muscular stability to the elbow joint and decrease the amount of
torque absorbed by ligaments. A decrease in grip strength may contraindicate throwing,
as more torque would be absorbed by the ligaments, although only one study to our
knowledge has investigated the relationship between grip strength and injury, and found
no statistically significant relationships [48]. More research must be conducted to
establish normal D and ND grip strengths as well as the relationships between D grip
strength and velocity and injury.
5.1.3 Isokinetic Strength
Monitoring the balance between the IR and ER strength is important for shoulder
health. Shoulder injuries are the most common for pitchers [19], especially the posterior
shoulder muscles, which are often overloaded from the repeated eccentric activity during
deceleration. IR muscles may be selectively strengthened, while ER muscles are
eccentrically overloaded [19]. ER/IR ratios are a useful way to measure the balance
between the rotator muscles. It was hypothesized that significant differences would be

74
found between arms for both concentric and eccentric ER/IR isokinetic strength ratios.
The results contradicted this hypothesis, as no significant differences were found between
arms for concentric ER/IR strength ratios at any of the three test velocities (90, 180, or
270˚/sec) (figure 5.2). Additionally, no significant differences were found between arms
for eccentric ER/IR strength ratios, or the functional eccentric ER/concentric IR strength
ratio at any test velocities.
Figure 5.2: D and ND shoulder rotational strength ratios at 90, 280, and 270˚/sec.
The concentric results are in partial agreement with previous literature. Some
studies have found no significant differences between arms for concentric ER/IR strength
ratios at test velocities ranging from 90 to 300˚/sec [6,8–11], although most showed a
trend of lower D arm ratios [6,8,9,11]. Two additional also displayed this trend [5,12],
but did perform statistical analysis to determine differences. Two studies have found
significant differences, with the D arm displaying lower ratios than the ND arm at 90˚/sec
[6,7] and 240˚sec [7]. The eccentric results are consistent with the previous literature. No
significant differences were found between arms for eccentric ER/IR strength ratios at
0.3
0.4
0.5
0.6
0.7
0.8
0.9Strength Ratios at 90 °/sec
D 90 ND 90
C ER/IR E ER/IR E ER/C IR0.3
0.4
0.5
0.6
0.7
0.8
0.9Strength Ratios at 180 °/sec
D 180 ND 180
C ER/IR E ER/IR E ER/C IR0.3
0.4
0.5
0.6
0.7
0.8Strength Ratios at 270 °/sec
D 270 ND 270
C ER/IR E ER/IR E ER/C IR

75
test velocities ranging from 60 to 300˚/sec [6,10,11]. Although not significant, in this
study and previous, the D arm had a trend of lower mean ratios at all test velocities. The
only other study that calculated the functional eccentric ER/concentric IR strength ratio
did not run statistical analysis, but found the D arm lower than the ND at 300˚/sec. In this
study, the D arm functional ratio was lower than the ND at 90˚/sec, but higher at 180 and
270˚/sec.
Directly comparing our results to previous literature was limited due to
differences in subject skill level and testing velocities. Some studies tested high school
pitchers [6,7], while others included collegiate [9,11,12], and professional [5,8,10]. More
advanced skill levels with increased access to strength and conditioning experts,
equipment, and detailed programs may result in more balanced rotational strength ratios.
Varying test velocities also yields different results. For concentric contractions, most
studies show a trend of decreased peak torque with increased rotational velocity [5,7–11].
Eccentric contractions showed a trend of increased peak torque with increased rotational
velocity [6,10,11]. This agrees with the force-velocity physiological relationship of
muscle tissue. This study saw these trends for the D arm during concentric PT/BW, while
eccentric PT/BW showed increases from 90 to 180 ˚/sec but decreased from 180 to
270˚/sec for both IR and ER. It is possible that the subjects were apprehensive to give
maximum effort eccentric contractions at this test velocity. However it would seem that
higher rotational velocities are more relevant to baseball considering the rotational
velocity the shoulder undergoes during pitching (up to 7000˚/sec) [17].
For pitchers in general, the trend of lower D arm ratios compared to the ND arm
is due to lower ER strength and higher IR strength in the D arm vs the ND arm.

76
Differences in concentric IR between arms are expected since the muscles responsible for
IR contract concentrically during pitching. Thus, the act of pitching inherently
strengthens these muscles via plyometrics as they are stretched at MER, before
contracting concentrically to accelerate the arm [43]. Contrary to the IR muscles, the ER
muscles contract eccentrically during pitching to decelerate the arm after BR. The ER
muscles do not undergo plyometric strengthening during pitching as the IR muscles do,
rather they must resist stretching eccentrically [43]. While the IR are naturally
strengthened during pitching, the ER muscles can instead overload, leading to
microtraumas and injury [19]. The ER muscles should be monitored closely and targeted
during offseason training to prepare for the high demands of pitching. It may be
beneficial to incorporate eccentric training, as it has been shown more effective in
increasing muscle hypertrophy and strength than concentric training [70], and it is the
primary contraction that ER muscles will undergo during pitching. Pitchers should have
the goal of creating a higher eccentric ER/IR ratio in the D arm, using the ND arm as a
baseline during offseason training.
5.1.4 Isometric Strength
Like isokinetic strength ratios, isometric ER/IR ratios are a valuable way to
quantify the balance between the rotator muscles. Isometric glenohumeral rotational
strength was in three different positions of ER. The hypothesis that significant differences
would be found between arms for both concentric and eccentric ER/IR isometric strength
ratios was found to be false. No significant differences were found between ER/IR ratios
in any position of ER. The ER/IR ratios increased as the ER position decreased in both
77
arms. The muscle’s force production capability combined with the passive tension are
highest when the muscle is maximally stretched. Therefore, ER strength should be
highest in a position of 0˚ ER, and IR strength should be highest in a position of 90˚ ER.
Interestingly, this was not the case. For the D arm, both ER PT/BW and IR PT/BW
maximums occurred at 45˚ ER. For the ND arm, the ER PT/BW maximum occurred at 0˚
ER, while the IR PT/BW maximum occurred at 45˚ ER. It is possible that since baseball
players typically display increased ER ROM, there is not as much tension at 90˚ ER. The
muscles may contribute more to the force production capability of the pitching shoulder
than the passive tension of ligamentous restraints.
These results are in partial agreement with previous studies. Donatelli et al.
measured isometric strength at 0˚ ER found the D arm ER strength significantly lower
than the ND arm [14], similar with the results of this study at that position. They also
found D arm IR strength significantly higher than the ND arm, which contradicts the
results in this study [14]. Also contradicting our study were results from Hurd et al. that
found significant differences between arms in both ER and IR strength at 45˚ ER [42].
The position of the arm, especially in ER will have a large effect on isometric
strength results. This is the only study to our knowledge that tested isometric shoulder
rotational strength in multiple positions of ER. The significant difference between D and
ND ER PT/BW was only found at the position of 0˚ ER. Shoulder posterior shear force
and horizontal abduction torque peak when the shoulder reaches 0˚ ER after BR [16]. The
extremes of force and torque placed on the shoulder at 0˚ ER might explain why the D
arm may be significantly weaker than the ND arm at this position, but not others. With

78
limited studies performed involving isometric rotation shoulder strength in pitchers, more
research testing isometric strength at various positions of ER need to be conducted.
5.3 BIOMECHANICAL MEASURES
The pitching biomechanics in this study used to investigate correlations included
kinetic metrics during arm cocking and arm deceleration. Several elbow and shoulder
metrics peak during these phases in the pitching motion. Kinetics were chosen because of
their potential to alter health and performance. Shoulder IR torque may be transmitted
through the humerus to the elbow as varus torque, which is largely absorbed by the UCL
[15,16]. Shoulder compressive force and horizontal adduction torque may be the primary
cause of rotator cuff tears during deceleration [16]. Elbow flexion torque, and shoulder
and elbow compressive forces have been correlated to increased pitch velocity
[27,30,35].
Three key kinetics that are included in most studies due to implications on injury
risk are elbow varus torque, shoulder IR torque, and shoulder compressive force. Our
results showed that the elbow varus torque (123.9 ± 8.8 Nm) (figure 5.3), and shoulder IR
torque (116.7 ± 26.1 Nm) (figure 5.4) were higher than other studies
[15,16,25,26,28,32,33], while the shoulder compressive force (975.4 ± 188.1 Nm)
(figure 5.5) was in the middle compared to other studies.

79
Figure 5.3: Comparison of elbow varus torque (Nm) across various levels.
Figure 5.4: Comparison of shoulder IR torque across various levels.
0
20
40
60
80
100
120
140
HS C PRO
Elb
ow
Var
us
Torq
ue
(Nm
)
Elbow Varus Torque
Feltner 1986 Fleisig 1995 Solomito 2015 Fleisig 2015
Luera 2018 Escamilla 2018 Current Study
0
20
40
60
80
100
120
140
HS C PRO
Sho
uld
er I
R T
orq
ue
(Nm
)
Shoulder IR Torque
Feltner 1986 Fleisig 1995 Aguinaldo 2007 Fleisig 2015
Luera 2018 Escamilla 2018 Current Study

80
Figure 5.5: Comparison of shoulder compressive force across various levels.
In general, all three key kinetics appear to increase with level of competition,
although elbow varus torque to a lesser extent. This is expected as mass and height
typically increase with level of competition. Normalizing kinetics by mass and height as
this study did may be more useful for comparing across populations, ages, and skill
levels. Aguinaldo et al. found professional pitchers had significantly lower normalized
elbow varus torque compared to high school pitchers, and significantly lower normalized
shoulder IR torque compared to college, high school, and youth pitchers [28].
Differences in methodology including marker sets, marker placement, sampling
rate, and biomechanical models may contribute to differences in pitching kinetics.
Studies have used different marker sets, ranging from 14 to 46 total markers
[16,25,26,28–30,32,33]. Differences in marker placements and joint center calculations
cause significant differences in results [71,72]. Marker placement is important because it
defines the segment ends and joint centers. Both kinematics and kinetics are affected by
different segment and joint center definitions. Sampling rates also varied greatly, from
0
200
400
600
800
1000
1200
1400
HS C PROSho
uld
er C
om
pre
ssiv
e F
orc
e (N
)
Comparison of Shoulder Compressive Force
Feltner 1986 Fleisig 1995 Fleisig 2015
Luera 2018 Escamilla 2018 Current Study

81
120 up to 480 Hz [15,16,25,26,28–30,32,33]. In general, sampling rate should be at least
twice the maximum frequency of the movement to avoid aliasing [73].
Differences in biomechanical models also lead to kinematic and kinetic
differences [74]. With different marker sets and locations used, segments and joint
centers are defined differently. This will change how the biomechanical model is defined
and how kinematics are calculated. Differences in kinematics will also be reflected in
kinetics since they are calculated via inverse dynamics. Segment mass and geometry
differences also affect kinetic calculations. Details on biomechanical models and
calculations are sparse in literature. Overall, differences in data collection methodology
may have a bigger impact on pitching analyses due to the highly dynamic nature of the
motion, which may account for large differences in kinetics.
5.4 CORRELATIONS
5.4.1 Clinical measures and kinetics
Investigating correlations between clinical measures and pitching biomechanics
provides important insight to medical and coaching staff. Different modalities of testing
can be associated to more readily identify injury risk. Discovering correlations may also
allow improved strength and flexibility training strategies to decrease high kinetics. The
hypothesis of negative correlations existing between rotational strength ratios and
pitching metrics was found to be true. Three inverse correlations between kinetics and
strength ratios were found: elbow varus torque and isometric ER/IR ratio at 90˚ ER, and
shoulder posterior shear force and eccentric ER/IR ratios at both 180˚/sec and 270˚/sec.
These correlations indicate that higher strength ratios may decrease the certain kinetics,

82
providing valuable information. It links two modalities of testing to increase the ways to
evaluate injury risk in pitchers. If motion analysis is not available or practical, shoulder
rotational strength testing can be performed. With known correlations, assumptions can
be made about what kinetics might be of concern without performing motion analysis and
calculating them. Based on these results, if eccentric ER/IR ratios are tested at 180 and
270˚/sec and are low, the pitcher may be at risk for high posterior shear force during
pitching and the potential injuries associated. It is also valuable as a practical training
solution to decrease high kinetics when they are found via motion analysis.
Elbow varus torque is arguably the most important kinetic metric to monitor and
limit in pitchers due to its relation to UCL tears and the associated time missed
[16,22,23]. The inverse correlation between elbow varus torque and isometric ER/IR ratio
at 90˚ ER suggests that increasing this ratio could decrease the torque and risk of UCL
injury. However, this correlation was the weakest in this study, with the lowest 𝑅2 value
and p-value equal to the cutoff for significance (0.05).
Shoulder posterior shear force may be a primary contributor to glenoid labrum
injuries in combination with compressive forces [19]. The inverse correlations between
posterior shear force and eccentric ER/IR ratios at both 180˚/sec and 270˚/sec suggest
that rotational strength plays an important role in protecting the labrum during arm
deceleration. Increasing these strength ratios, specifically eccentric ER strength, may help
decrease high posterior shear forces. The presence of correlations at two of the test
velocities and both eccentric ratios is encouraging to the validity of the results. The
eccentric nature of the strength ratios correlated also match the action of the shoulder
83
posterior shear force during pitching, as muscles contract to resist anterior translation of
the humerus [16].
Only one previous study has investigated correlations between shoulder rotational
strength flexibility and pitching kinetics [13]. Hurd et al. used a handheld dynamometer
to test isometric rotational strength of high school pitchers and calculated kinetic metrics
from motion analysis using a four-segment upper extremity model. They found negative
correlations between ER ROM and elbow adduction (varus) and shoulder IR torque [13],
suggesting that increasing ER ROM may be effective for decreasing high elbow
adduction or shoulder IR torques. However, this may only be a feasible recommendation
for pitchers that don’t already display the high levels of ER ROM in the D arm. They also
found a positive correlation between shoulder ER torque and IR strength [13], which
may have limited meaning as shoulder ER torque has not be associated with injury.
Figure 5.6 compares the 𝑅2 values for the correlations found in this study and by
Hurd et al. 𝑅2 represents the amount of variance of the kinetic metric explained by the
clinical metric. It is always between 0 and 1, and higher values indicate a better
correlation. All 𝑅2 values for correlations found in this study were higher than those from
Hurd et al. While the correlations between strength metrics and pitching kinetics found
are encouraging, more research needs to be done to verify these correlations across
various populations of pitchers before applying them in practice.

84
Figure 5.6: R-squared values for correlations found in this study and Hurd et al. [13]. (EVT
= elbow varus torque, Ism = isometric, SPSF = shoulder posterior shear force, Ecc =
eccentric, SAT = shoulder adduction torque, EAT = elbow adduction torque, SIRT =
shoulder internal rotation torque, SERT = shoulder external rotation torque, IRT =
internal rotation torque)
5.4.2 Clinical measures and velocity
Correlations were also investigated between clinical measures and velocity. This
knowledge would allow for improved strength training routines with the goal of
increasing velocity. The causes of decreases in velocity could be revealed as potential
weakness or injuries to muscles and soft tissue that contribute responsible for rotational
motion. Projected velocity gains during training or recovery could be used as targets for
increased rotational strength.
Positive correlations were found between velocity and grip strength, concentric
ER PT/BW at 90˚/sec, isometric IR PT/BW at 90 and 45˚ ER, isometric ER PT/BW at 45
and 0˚ ER. Of the six correlations found in this study (figure 5.7), isometric ER PT/BW
at 0˚ ER was the strongest, explaining 70.2% of the variability in pitch velocity. This
0.363
0.425
0.51
0.16
0.25
0.181
0
0.1
0.2
0.3
0.4
0.5
0.6
EVT & I
ER/IR, 90 ˚
SPSF & E
ER/IR, 180 ˚/s
SPSF & E
ER/IR, 270 ˚/s
EAT & ER
ROM
SIRT & ER
ROMSERT & I
IRT, 45 ˚
R-s
quar
ed
R-squared, Kinetic Correlations
Current Study Hurd 2012

85
correlation, along with the correlation of isometric ER PT/BW at 45˚ ER, indicate that
ER strength between arm positions of 0 and 45˚ ER are key to pitch velocity. The arm is
in this position between BR and MIR, when the ER muscles are decelerating the arm.
Thus, the ability of the ER muscles to decelerate the arm after BR may be a limiting
factor in velocity. Increasing the strength of ER muscles, especially at the relevant ER
range may increase velocity.
Correlations were also found between isometric IR PT/BW at arm positions of 90
and 45˚ ER. The arm is within that range of ER just after BR as the arm begins to
decelerate [17]. This position is not especially relevant to IR torque, which peaks just
before MER and is low during deceleration [16]. It is possible that a stronger correlation
would be found between velocity and isometric IR strength at an arm position greater
than 90˚ of ER, as IR torque peaks during pitching with the arm near 180˚ ER. However,
this is not practical to measure, as the arm only reaches that level of ER briefly and
dynamically.
Figure 5.7: R-squared values for correlations between velocity and clinical measures.
0.444
0.357 0.35
0.529
0.395
0.702
0
0.1
0.2
0.3
0.4
0.5
0.6
0.7
0.8
GS C ER
PT/BW, 90 ˚/s
I IR PT/BW,
90˚
I ER PT/BW,
45˚
I IR PT/BW,
45˚
I ER PT/BW,
0˚
R-s
quar
ed
R-squared, Velocity Correlations

86
Few studies have investigated correlations between clinical measures and pitch
velocity [50,51]. Clements et al. found a correlation in adolescent players between
isometric IR PT/BW and velocity [51], agreeing with the results of this study. However,
Bartlett et al. found no correlations in professional pitchers between velocity and
concentric IR or ER PT at 90˚/sec [50], contradicting the correlation found in this study.
The results of this study also indicated that grip strength, provided by flexor
muscles primarily and extensor muscles secondarily, contributes to pitch velocity. These
muscles flex the wrist and finger as the ball is released to increase spin. They may also
protect the UCL by absorbing the varus torque experienced at the elbow joint. The
correlation to grip strength is in partial agreement with previous literature. Pedegana et al.
found a correlation between wrist extension strength and pitch velocity [49]. However,
Bartlett et al. found no correlation between wrist extension or wrist flexion strength and
pitch velocity [50]. These studies are slightly different, as they measured peak torques of
wrist flexion and wrist extension independently on professional pitchers [49,50]. More
research should be done on the kinematics of the fingers, hand, and wrist during pitching
to determine the ROM experienced by each, as well as to verify the correlation found in
this study.
5.5 NEURAL NETWORK
NNs can be useful to for making predictions based on known data. Correlations
between clinical measures and velocity and pitching kinetics can be utilized in NNs.
Creating a model that can predict velocity and pitching kinetics would be useful for
multiple reasons. Kinetics linked to injury could be determined using easily measurable

87
strength metrics. Velocity could be determined without throwing. Predictive NN models
were created using clinical measures with known correlations to pitch velocity and elbow
varus torque.
The RMSE is the standard deviation of the error. The RMSE of the regression
learner NN created to predict pitch velocity was 2.2924. This means that the model can
predict pitch velocity within 2.29 mph on average. The average fastball velocity of all
subjects was 77.19 mph; therefore, the average error of the model was 2.97%. The input
features used to predict velocity included height, grip strength, concentric ER PT/BW at
90˚/sec, and isometric ER PT/BW at 45˚ ER. Although there were more metrics
correlated with velocity, adding more than four metrics decreased the accuracy of the
NN. An accurate velocity-predicting model is useful to players, coaches, scouts, strength
and conditioning coaches, and clinicians alike. This model could be used to predict
maximum velocity without maximum effort throwing. This could be useful during
offseason training to monitor how strength gains are likely to affect pitch velocity.
Projections of velocity gains based on growth to the predictive metrics would be useful
goals to strength coaches and athletes. Improvements to young players who are still
growing could be projected, providing a valuable scouting tool.
A regression learner NN was also created to predict elbow varus torque. The
RMSE was 16.34. The average elbow varus torque of all subjects was 123.86, indicating
the average error of the model was 13.19%. With more data to improve accuracy, this
model could be used to predict elbow varus torque without performing a biomechanical
analysis. This would be useful because the equipment and knowledge necessary to
perform a biomechanical analysis is expensive and not always readily available.

88
Cross-validation was used to train the models. Larger datasets can use holdout
validation for greater accuracy. A cubic support vector machine model was used to
predict pitch velocity. This model was chosen because it predicted the velocity with the
highest accuracy. Support vector machine regression is a supervised machine learning
algorithm that finds a hyperplane that contains all the output data within a defined
distance [75]. When there is more than one input, kernelling allows data to be mapped
into higher dimensions, allowing the regression line to become a regression plane.
Support vector machines work well with small data sets [75]. A rational quadratic
gaussian process regression model was used to predict elbow varus torque. The output is
modeled with a probability distribution over a space of functions for Gaussian process
regression [76]. A further in-depth analysis of the types of models used in NNs is beyond
the scope of this study.
NNs have allowed joint torques during squatting to be predicted based on simple
inputs of barbell mass and horizontal and vertical displacement [52]. The current study is
the only one to our knowledge that has investigated the use of regression learner NNs to
predict pitch velocity and pitching kinetics. Future research should continue to investigate
correlations between clinical strength and flexibility measures and pitching kinetics.
These relationships can then be used to create more accurate predictive NNs. The kinetics
linked to injury such as elbow varus torque, shoulder IR torque, and shoulder posterior
shear force would be the most useful to be able to predict. Discovering correlations to
other muscle groups may also prove useful. NN predictions of increased velocity and
decreased torques based on strength gains could be used as offseason training goals and

89
scouting projections. Training NNs on larger data sets may also allow for more accurate
models.
5.6 STUDY LIMITATIONS
There are several limitations that should be acknowledged for this study. The
primary limitation is the small sample size. Thirteen pitchers were recruited for the study,
and the data from one pitcher was excluded due to outliers. With data from only twelve
pitchers to perform statistical analysis on, smaller differences may go undetected. Power
analysis for the differences between D and ND arms ER, IR, and total ROM indicated
that with an alpha level of 0.05 and power of 0.8, the minimum difference that could be
detected for each were 6.22, 7.83, and 7.28˚, respectively. Any smaller differences would
require a higher sample size to detect with the same alpha level and power. This may
have contributed to some type II error where no significant differences were found in this
study while previous studies did.
The effort and apprehension level of the subjects may have decreased the
accuracy of clinical measures. For ROM testing, to prevent injury subjects were
instructed to indicate when they felt the end of their ROM was reached, or if they felt any
pain or discomfort. It is possible that subjects have differing tolerance levels or
discomfort when being stretched to maximum ROM in shoulder rotation. The effort level
during rotational strength testing may have also differed between subjects. Subjects were
instructed to give maximum effort, but effort level cannot be fully controlled. The
isokinetic strength testing may have caused fear or apprehension in some, preventing
truly maximum effort. Maximum effort eccentric contractions may feel unnatural due to

90
their “losing” nature of isokinetic eccentric contractions. Since the dynamometer moves
at a constant velocity throughout isokinetic testing, subjects cannot slow it down during
the eccentric portion. While athletes do undergo eccentric contractions during strength
training, it is typically in a controlling manner before a concentric contraction, not a
maximum effort failure contraction. This study also did not allow for submaximal
contractions before testing. This may have allowed for familiarity and increased comfort
with the test for the first arm tested.
The order of measurement for the clinical testing session was not randomized. For
ROM, the right arm was always measured first, followed by the left. For strength testing,
the ND arm was always tested first, followed by the D arm. It is possible that subjects
were less apprehensive, and more familiar with the testing protocol after the first arm was
measured. For the strength testing, it is also possible that the ND arm was more warmed
up during testing than the D arm. Rotational strength testing of each arm took about 15
minutes. Between arms, subjects got out of the dynamometer chair and were instructed to
repeat stretches if they desired, but it was not mandatory. Future studies should
randomize their order of testing arms. While the two test sessions were separated by a
minimum of two days, subjects were not always prohibited from exercising or throwing
before the test sessions. Explicitly requiring subjects to avoid throwing and exercising
during the span of the test sessions may be more appropriate.
5.7 FUTURE STUDIES
Future studies should continue to investigate correlations to pitching kinetics.
Specifically, correlations to clinical measures of strength and flexibility are useful to find
91
because they are easy to measure and can be improved through training. A higher subject
population may allow for more significant differences and correlations to be found.
Testing various skill levels of pitchers may also yield useful results. Due to differences
existing between kinematic and kinetics in pitchers at different levels of skill [25,28,31],
correlations may also differ.
Future studies should also continue to investigate how correlations can be used to
create NNs. A regression learner NNs that can predict elbow varus torque would be
useful to quantify torque without a biomechanical analysis. Characterizing this torque is
important because of its link to UCL tears [16,22]. NNs could also be created for other
kinetics that are linked to injury and velocity. If positive correlations are found between
strength metrics and velocity, a predictive NN could be used to create training goals by
projecting velocity gains from strength gains.
Measuring isometric rotational strength at different arm positions could be useful.
The metric with the strongest correlation to velocity in the current study was isometric
ER PT/BW at 0˚ ER. The only significant difference between rotational strength of the D
and ND arm was also found at this test position. More research should be done on
investigating the role of the rotator muscles at different positions of ER. Isokinetic
eccentric strength should also be investigated further by future studies. Neither the
current study or any previous studies [6,10,11] have found significant differences
between D and ND eccentric strength. This is unexpected, since the posterior shoulder of
the D arm undergoes an eccentric contraction during pitching. The eccentric ER/IR ratio
does appear important, as it was correlated to shoulder posterior shear force at two test
velocities in the current study. Future research should test larger subject populations for

92
significant differences between arms as well as correlations to kinetics and velocity to
continue to determine the significance of eccentric contractions.
Measuring strength and flexibility metrics of the full body could also uncover
useful correlations. The current study focused on glenohumeral joint flexibility and
strength only, but many other joints and muscles are important to pitching and may yield
useful correlations. Lower extremity, rotational, and back strength and flexibility are a
few additional areas that future research should investigate.
5.8 SUMMARY
Minimal research has been done on correlations between clinical measures and
kinetics of pitching, as well as using correlations to create predictive NNs. This study
found correlations between isokinetic and isometric shoulder rotational strength,
flexibility, grip strength, and pitching kinetics and velocity. A NN was also created to
predict pitch velocity based on clinical measures.
93
CHAPTER 6: CONCLUSION
The purpose of this study was to determine correlations between shoulder
rotational strength and ROM, and kinetics during pitching determined by motion
analysis. Baseball pitching involves repetitive, high stresses to the D arm that may alter
the soft tissue responsible for controlling the biomechanics. The central hypothesis was
that correlations exist between ER/IR ratios and pitching kinetics. The rationale of this
study is that new evidence on relationships between clinical measures and pitching
biomechanics would associate different modalities of testing (i.e. strength, ROM, motion
analysis, NNs) to identify risk of injury, which would be useful to medical and coaching
staff alike. It may reveal strength and flexibility training strategies to decrease
abnormally high kinetics.
Twelve collegiate baseball pitchers completed two test sessions. The clinical
measures session tested shoulder rotational ROM, isokinetic and isometric strength, and
grip strength. The motion analysis session tested pitching biomechanics. Paired t-tests
were performed to investigate differences in strength and ROM between the D and ND
arms. Linear regression was performed to determine correlations between clinical
measures and kinetics and pitch velocity. A regression learner NN was created to predict
pitch velocity and elbow varus torque using clinical measures as inputs.
The D arm had significantly higher ER and total ROM compared to the ND arm.
No significant differences were found between arms for IR ROM. Hypothesis 1 was
partially supported (significant differences will be found between limbs for IR and ER
ROM). No significant differences were found between arms for isokinetic PTs
normalized to BW, or ER/IR ratios. The ND arm ER PT/BW was significantly greater

94
than the D arm at 0˚ ER. No significant differences were found for isometric ER/IR
ratios. Hypothesis 2 was rejected (significant differences will be found between D and
ND ER/IR ratios). No significant difference was found between D and ND grip strength,
hypothesis 3 was rejected (significant differences will be found between D and ND grip
strength). Inverse correlations were found between normalized elbow varus torque and
isometric ER/IR ratio at 90˚ ER and normalized shoulder posterior shear force and
isokinetic eccentric ER/IR ratio at 180˚/sec and 270˚/sec. Hypothesis 4 was supported
(Inverse correlations will be found between rotational strength ratios and key pitching
kinetics). Positive correlations were found between velocity and grip strength, concentric
ER PT/BW at 90˚/sec, isometric IR PT/BW at 90˚ ER, isometric ER PT/BW at 45˚ ER,
isometric ER PT/BW at 45˚, and isometric ER PT/BW at 0˚ ER. The NN created to
predict fastball velocity had RMSE of 2.29. The NN created to predict elbow varus
torque had a RMSE of 16.34. Hypothesis 5 was partially supported (trained NNs can
predict key biomechanical metrics using clinical data).
The results of this study benefit clinicians, coaches, and players alike. Associating
different modalities of testing allows injury risk to be more easily identified. Measuring
clinical strength and flexibility may be more accessible and less invasive than motion
analysis. Improved strength and flexibility training strategies can be utilized to decrease
high kinetics and increase maximum pitch velocity. Increasing ER/IR ratios may decrease
elbow varus torque and shoulder posterior shear force during pitching. Improving grip,
ER, and IR strength may increase fastball velocity. The NN allows maximum pitch
velocity predictions using clinical measures that can be easily measured. Fastball gains
can be projected based on strength increases to the NN inputs.

95
Some limitations of the current study should be acknowledged. The sample size
was small (n=12), which may cause some differences between D and ND metrics to go
undetected. Some subjects may have been apprehensive about full rotational ROM
stretches. Effort level for the strength testing cannot be fully controlled, and some
subjects may not have given maximum effort, especially during eccentric contractions.
The order of measurements was not randomized, and subjects may have been more
comfortable with the protocol on the second arm tested.
Future research should continue to investigate correlations between clinical
measures and kinetics and pitch velocity. Correlations to clinical measures of strength
and flexibility are valuable because they are easy to measure and can be improved
through training. A higher subject population may allow for more significant differences
and correlations to be found. Testing various skill levels of pitchers may also yield useful
results. Future studies should also continue to investigate how correlations can be used to
create NNs. A regression learner NNs that can predict elbow varus torque would be
useful to quantify the torque without a biomechanical analysis.

96
BIBLOIGRPAHY
[1] Brown LP, Niehues SL, Harrah A, Yavorsky P, Hirshman HP. Upper extremity
range of motion and isokinetic strength of the internal and external shoulder
rotators in major league baseball players. Am J Sports Med 1988;16:577–85.
doi:10.1177/036354658801600604.
[2] Hurd WJ, Kaplan KM, ElAttrache NS, Jobe FW, Morrey BF, Kaufman KR. A
Profile of Glenohumeral Internal and External Rotation Motion in the Uninjured
High School Baseball Pitcher, Part I: Motion. J Athl Train 2011;46:282–8.
[3] Anloague PA, Spees V, Smith J, Herbenick MA, Rubino LJ. Glenohumeral range
of motion and lower extremity flexibility in collegiate-level baseball players.
Sports Health 2012. doi:10.1177/1941738111422336.
[4] Wilk KE, Macrina LC, Fleisig GS, Aune KT, Porterfield RA, Harker P, et al.
Deficits in Glenohumeral Passive Range of Motion Increase Risk of Shoulder
Injury in Professional Baseball Pitchers. Am J Sports Med 2015;43:2379–85.
doi:10.1177/0363546515594380.
[5] Ellenbecker TS, Mattalino AJ. Concentric isokinetic shoulder internal and external
rotation strength in professional baseball pitchers. J Orthop Sports Phys Ther
1997;25:323–8. doi:10.2519/jospt.1997.25.5.323.
[6] Mulligan IJ, Biddington WB, Barnhart BD, Ellenbecker TS. Isokinetic profile of
shoulder internal and external rotators of high school aged baseball pitchers. J
Strength Cond Res 2004;18:861–6. doi:10.1519/14633.1.
[7] Hinton RY. Isokinetic Evaluation of Shoulder Rotational Strength in High School
Baseball Pitchers. Am J Sport Med 1988;16:274–9.
doi:10.1177/036354658801600314.
[8] Wilk KE, Andrews JR, Arrigo CA, Keirns MA, Erber DJ. The strength
characteristics of internal and external rotator muscles in professional baseball
pitchers. Am J Sports Med 1993;21:61–6. doi:10.1177/036354659302100111.
[9] Alderink GJ, Kuck DJ. lsokinetic Shoulder Strength of High School and College-
Aged Pitchers*. J Orthop Sports Phys Ther 1986;7:163–72. doi:10.1016/0268-
0033(86)90111-7.
[10] Sirota SC, Malanga GA, Eischen JJ, Laskowski ER. An eccentric- and concentric-
strength profile of shoulder external and internal rotator muscles in professional
baseball pitchers. Am J Sport Med 1997;25:59–64.
doi:10.1177/036354659702500111.
[11] Mikesky AE, Edwards JE, Wigglesworth JK, Kunkel S. Eccentric and concentric
strength of the shoulder and arm musculature in collegiate baseball pitchers. Am J
Sport Med 1995;23:638–42. doi:10.1177/036354659502300520.

97
[12] Noffal GJ. Isokinetic eccentric-to-concentric strength ratios of the shoulder rotator
muscles in throwers and nonthrowers. Am J Sports Med 2003;31:537–41.
doi:10.1177/03635465030310041001.
[13] Hurd WJ, Kaufman KR. Glenohumeral rotational motion and strength and baseball
pitching biomechanics. J Athl Train 2012;47:247–56. doi:10.4085/1062-6050-
47.3.10.
[14] Donatelli R, Ellenbecker TS, Ekedahl SR, Wilkes JS, Kocher K, Adam J.
Assessment of shoulder strength in professional baseball pitchers. J Orthop Sports
Phys Ther 2000;30:544–51. doi:10.2519/jospt.2000.30.9.544.
[15] Feltner M, Dapena J. Dynamics of the shoulder and elbow joints of the throwing
arm during a baseball pitch. Int J Sport Biomech 1986.
[16] Fleisig GS, Andrews JR, Dillman CJ, Escamilla RF. Kinetics of Baseball Pitching
with Implications About Injury Mechanisms. Am J Sports Med 1995;23:233–9.
doi:10.1177/036354659502300218.
[17] Dillman CJ FG& AJ. Biomechanics of Pitching with Emphasis upon Shoulder
Kinematics. J Orthop Sports Phys Ther 1993;18:402–8.
doi:10.2519/jospt.1993.18.2.402.
[18] Fleisig GS, Barrentine SW, Zheng N, Escamilla RF, Andrews JR. Kinematic and
kinetic comparison of baseball pitching among various levels of development. J
Biomech 1999. doi:10.1016/S0021-9290(99)00127-X.
[19] Wilk KE, Andrews JR, Cain EL, Devine K. Shoulder Injuries in Baseball. The
Athlete’s Shoulder, 2009, p. 401–20. doi:10.1016/b978-044306701-3.50036-0.
[20] Wilk KE. Shoulder Injuries in the Overhead Athlete 2009;39:38–54.
doi:10.2519/jospt.2009.2929.
[21] Cain EL, Dugas JR, Wolf RS, Andrews JR. Elbow Injuries in Throwing Athletes.
Am J Sports Med 2003;31:621–35.
[22] Anz AW, Bushnell BD, Griffin LP, Noonan TJ, Torry MR, Hawkins RJ.
Correlation of torque and elbow injury in professional baseball pitchers. Am J
Sports Med 2010. doi:10.1177/0363546510363402.
[23] Roland J. Tommy John Surgery (UCL Reconstruction) and Recovery. Healthline
2018. https://www.healthline.com/health/tommy-john-surgery#symptoms
(accessed June 1, 2019).
[24] Keri J. The Tommy John Epidemic: What’s Behind the Rapid Increase of Pitchers
Undergoing Elbow Surgery. Grantland 2015. http://grantland.com/the-
triangle/tommy-john-epidemic-elbow-surgery-glenn-fleisig-yu-darvish/ (accessed
April 1, 2019).
[25] Luera MJ, Dowling B, Magrini MA, Muddle TWD, Colquhoun RJ, Jenkins NDM.
Role of Rotational Kinematics in Minimizing Elbow Varus Torques for
Professional Versus High School Pitchers. Orthop J Sport Med 2018.

98
doi:10.1177/2325967118760780.
[26] Escamilla RF, Slowik JS, Diffendaffer AZ, Fleisig GS. Differences Among
Overhand, 3-Quarter, and Sidearm Pitching Biomechanics in Professional Baseball
Players. J Appl Biomech 2018. doi:10.1123/jab.2017-0211.
[27] Stodden DF, Fleisig GS, McLean SP, Andrews JR. Relationship of biomechanical
factors to baseball pitching velocity: Within pitcher variation. J Appl Biomech
2005. doi:10.1123/jab.21.1.44.
[28] Aguinaldo AL, Buttermore J, Chambers H. Effects of upper trunk rotation on
shoulder joint torque among baseball pitchers of various levels. J Appl Biomech
2007;23:42–51. doi:10.1123/jab.23.1.42.
[29] Aguinaldo AL, Chambers H. Correlation of throwing mechanics with elbow
valgus load in adult baseball pitchers. Am J Sports Med 2009;37:2043–8.
doi:10.1177/0363546509336721.
[30] Solomito MJ, Garibay EJ, Woods JR, Õunpuu S, Nissen CW. Lateral trunk lean in
pitchers affects both ball velocity and upper extremity joint moments. Am J Sports
Med 2015. doi:10.1177/0363546515574060.
[31] Fleisig G, Chu Y, Weber A, Andrews J. Variability in baseball pitching
biomechanics among various levels of competition. Sport Biomech 2009.
doi:10.1080/14763140802629958.
[32] Laughlin WA, Fleisig GS, Scillia AJ, Aune KT, Cain EL, Dugas JR. Deficiencies
in pitching biomechanics in baseball players with a history of superior labrum
anterior-posterior repair. Am J Sports Med 2014. doi:10.1177/0363546514552183.
[33] Fleisig GS, Leddon CE, Laughlin WA, Ciccotti MG, Mandelbaum BR, Aune KT,
et al. Biomechanical Performance of Baseball Pitchers with a History of Ulnar
Collateral Ligament Reconstruction. Am J Sports Med 2015.
doi:10.1177/0363546515570464.
[34] DiGiovine NM, Jobe FW, Pink M, Perry J. An electromyographic analysis of the
upper extremity in pitching. J Shoulder Elb Surg 1992. doi:10.1016/S1058-
2746(09)80011-6.
[35] Post EG, Laudner KG, McLoda TA, Wong R, Meister K. Correlation of shoulder
and elbow kinetics with ball velocity in collegiate baseball pitchers. J Athl Train
2015. doi:10.4085/1062-6040-50.1.06.
[36] Glousman R, Jobe F, Tibone J, Moynes D, Antonelli D, Perry J. Dynamic
electromyographic analysis of the throwing shoulder with glenohumeral
instability. J Bone Jt Surg - Ser A 1988. doi:10.2106/00004623-198870020-00009.
[37] Neumann D a. Shoulder Complex. Kinesiol. Musculoskelet. Syst. Found. Rehabil.,
2013.
[38] Wilk KE, Reinold MM, Macrina LC, Porterfield R, Devine KM, Suarez K, et al.
Glenohumeral internal rotation measurements differ depending on stabilization
99
techniques. Sports Health 2009;1:131–6. doi:10.1177/1941738108331201.
[39] Reinold MM, Wilk KE, Macrina LC, Sheheane C, Dun S, Fleisig GS, et al.
Changes in Shoulder and Elbow Passive Range of Motion after Pitching in
Professional Baseball Players. Am J Sports Med 2008;36:523–7.
doi:10.1177/0363546507308935.
[40] Dwelly PM, Tripp BL, Tripp PA, Eberman LE, Gorin S. Glenohumeral rotational
range of motion in collegiate overhead-throwing athletes during an athletic season.
J Athl Train 2009. doi:10.4085/1062-6050-44.6.611.
[41] Wilk KE, Macrina LC, Fleisig GS, Porterfield R, Simpson CD, Harker P, et al.
Correlation of Glenohumeral Internal Rotation Deficit and Total Rotational
Motion to Shoulder Injuries in Professional Baseball Pitchers. Am J Sports Med
2011;39:329–35. doi:10.1177/0363546510384223.
[42] Hurd WJ, Kaplan KM, ElAttrache NS, Jobe FW, Morrey BF, Kaufman KR. A
profile of glenohumeral internal and external rotation motion in the uninjured high
school baseball pitcher, part II: Strength. J Athl Train 2011. doi:10.4085/1062-
6050-46.3.289.
[43] Byram IR, Bushnell BD, Dugger K, Charron K, Harrell FE, Noonan TJ. Preseason
Shoulder Strength Measurements in Professional Baseball Pitchers. Am J Sports
Med 2010;38:1375–82. doi:10.1177/0363546509360404.
[44] Tajika T, Kobayashi T, Yamamoto A, Shitara H, Ichinose T, Shimoyama D, et al.
Relationship between grip, pinch strengths and anthropometric variables, types of
pitch throwing among japanese high school baseball pitchers. Asian J Sports Med
2015. doi:10.5812/asjsm.25330.
[45] Jarit P. Dominant-hand to nondominant-hand grip-strength ratios of college
baseball players. J Hand Ther 1991. doi:10.1016/S0894-1130(12)80227-4.
[46] Mullaney MJ, McHugh MP, Donofrio TM, Nicholas SJ. Upper and lower
extremity muscle fatigue after a baseball pitching performance. Am J Sports Med
2005. doi:10.1177/0363546504266071.
[47] Yu JH, Lee GC. Comparison of shoulder range of motion, strength, and endurance
in amateur pitchers practicing repetitive overhead throwing. Isokinet Exerc Sci
2013. doi:10.3233/IES-130489.
[48] Harada M, Takahara M, Mura N, Sasaki J, Ito T, Ogino T. Risk factors for elbow
injuries among young baseball players. J Shoulder Elb Surg 2010.
doi:10.1016/j.jse.2009.10.022.
[49] Pedegana LR, Elsner RC, Roberts D, Lang J, Farewell V. The relationship of
upper extremity strength to throwing speed. Am J Sports Med 1982.
doi:10.1177/036354658201000606.
[50] Bartlett LR, Storey MD, Simons BD. Measurement of upper extremity torque
production and its relationship to throwing speed in the competitive athlete. Am J
Sports Med 1985;17:89–91. doi:10.1177/036354658901700115.
100
[51] Clements AS, Ginn KA, Henley E. Correlation between muscle strength and
throwing speed in adolescent baseball players. Phys Ther Sport 2001.
doi:10.1054/ptsp.2000.0025.
[52] Kipp K, Giordanelli M, Geiser C. Neural Network Prediction of Joint Torques in
Olympic Weightlifting. Am. Soc. Biomech., 2017.
[53] Laudner K, Vazquez J, Selkow N, Meister K. Strong Correlation of Upper-
Extremity Blood-Flow Volume With Grip Strength While in a Provocative
Shoulder Position in Baseball Pitchers. J Sport Rehabil 2017;26:234–7.
doi:10.1123/jsr.2015-0179.
[54] Arrigo CA, Wilk KE, Andrews JR. Peak torque and maximum work repetition
during isokinetic testing of the shoulder internal and external rotators. Isokinet
Exerc Sci 1994;4:171–5. doi:10.3233/IES-1994-4409.
[55] Adhithia D, Cross J, Harris G. Elbow and Shoulder Kinetic Model for Baseball
Pitching: Implications on Injury Risk. GCMAS, 2015, p. 84–5.
[56] Cross J, Caplinger R, Raasch W. Comparison of Pitching and Long-Toss Kinetics
in Professinal Baseball Players. BMES, 2016, p. 95.
[57] Tutorial: Building a Model. C-Motion WIKI Doc 2017. http://www.c-
motion.com/v3dwiki/index.php?title=Tutorial:_Building_a_Model#Key_Concepts
(accessed April 1, 2019).
[58] Rammer J. Orthopaedic Biomechanics. 3D Kinemat., Milwaukee: 2018.
[59] Wu G, Van Der Helm FCT, Veeger HEJ, Makhsous M, Van Roy P, Anglin C, et
al. ISB recommendation on definitions of joint coordinate systems of various joints
for the reporting of human joint motion - Part II: Shoulder, elbow, wrist and hand.
J Biomech 2005. doi:10.1016/j.jbiomech.2004.05.042.
[60] Inverse Dynamics. C-Motion WIKI Doc 2015. https://www.c-
motion.com/v3dwiki/index.php?title=Inverse_Dynamics (accessed July 1, 2019).
[61] Tutorial: Model Based Computations. C-Motion WIKI Doc 2017. http://www.c-
motion.com/v3dwiki/index.php?title=Tutorial:_Model_Based_Computations
(accessed July 1, 2019).
[62] Meister K, Day T, Horodyski M, Kaminski TW, Wasik MP, Tillman S. Rotational
motion changes in the glenohumeral joint of the adolescent/Little League baseball
player. Am J Sports Med 2005. doi:10.1177/0363546504269936.
[63] Osbahr DC, Cannon DL, Speer KP. Retroversion of the humerus in the throwing
shoulder of college baseball pitchers. Am J Sport Med 2002;30:347–53.
[64] Reagan KM, Meister K, Horodyski MB, Werner DW, Carruthers C, Wilk K.
Humeral retroversion and its relationship to glenohumeral rotation in the shoulder
of college baseball players. Am J Sports Med 2002;30:354–60.
doi:10.1177/03635465020300030901.

101
[65] Edelson G. The development of humeral head retroversion. J Shoulder Elb Surg
2000. doi:10.1067/mse.2000.106085.
[66] Myers JB, Laudner KG, Pasquale MR, Bradley JP, Lephart SM. Glenohumeral
range of motion deficits and posterior shoulder tightness in throwers with
pathologic internal impingement. Am J Sports Med 2006.
doi:10.1177/0363546505281804.
[67] Keller RA, De Giacomo AF, Neumann JA, Limpisvasti O, Tibone JE.
Glenohumeral Internal Rotation Deficit and Risk of Upper Extremity Injury in
Overhead Athletes: A Meta-Analysis and Systematic Review. Sports Health
2018;10:125–32. doi:10.1177/1941738118756577.
[68] Pugh SF. Upper And Lower Body Strength in Relation to Underhand Pitching
Speed by Experienced and Inexperienced Pitchers. Percept Mot Skills 2005.
doi:10.2466/pms.93.7.813-818.
[69] Hoffman JR, Vazquez J, Pichardo N, Tenenbaum G. Anthropometric and
performance comparisons in professional baseball players. J Strength Cond Res
2009. doi:10.1519/JSC.0b013e3181bcd5fe.
[70] Farthing JP, Chilibeck PD. The effects of eccentric and concentric training at
different velocities on muscle hypertrophy. Eur J Appl Physiol 2003.
doi:10.1007/s00421-003-0842-2.
[71] Gorton GE, Hebert DA, Gannotti ME. Assessment of the kinematic variability
among 12 motion analysis laboratories. Gait Posture 2009.
doi:10.1016/j.gaitpost.2008.10.060.
[72] Kadaba MP, Ramakrishnan HK, Wooten ME, Gainey J, Gorton G, Cochran GVB.
Repeatability of Kinematic, Kinetic, and EMG Data in Normal Adult Gait.pdf. J
Orthop Res 1989.
[73] Nyquist–Shannon sampling theorem. Wikipedia 2019.
https://en.wikipedia.org/wiki/Nyquist–Shannon_sampling_theorem (accessed
January 3, 2019).
[74] McNally M, Oñate J, Chaudhari A. Comparison of Joint Kinetics Using Common
Models For Baseball Pitching. Am. Soc. Biomech., 2018.
[75] Bambrick N. Support Vector Machines for dummies; A Simple Explanation.
Aylien 2016.
[76] Choose Regression Model Options. MathWorks 2019.
https://www.mathworks.com/help/stats/choose-regression-model-
options.html#bvmwe_w (accessed January 3, 2019).

102
APPENDIX A: CONSENT FORM
103

104

105