CORRELATION MODEL FOR FIBER DIAMETER OF ELECTRO-SPUN ...
12
Thayumanavan, M., et al.: Correlation Model for Fiber Diameter of the Electro-Spun ... THERMAL SCIENCE: Year 2021, Vol. 25, No. 6A, pp. 4371-4382 4371 CORRELATION MODEL FOR FIBER DIAMETER OF THE ELECTRO-SPUN MEMBRANE USING KGM (1, N) MODEL FOR NANOFILTRATION by Menaka THAYUMANAVAN a* , Andy SRINIVASAN b* , and Senthil Kumar ARUMUGAM c a Department of Electronic and Instrumentation, SRM Institute of Science and Technology, Chennai, Tamil Nadu, India b Department of Electronic and Instrumentation, SRM Valliammai Engineering College, Chennai, Tamil Nadu, India c Department of Electronics and Communication, Kings Engineering College, Chennai, Tamil Nadu, India Original scientific paper https://doi.org/10.2298/TSCI210702268T Nanofiltration is an important application for electro-spun fiber as it is well char- acterized by fine fiber diameter, huge density, high penetrability, and flexibility. In this paper, the poly-acrylonitrile fiber diameter is determined experimentally by varying four factors such as voltage, flow rate, the distance between spinneret and collector, and mass fraction in the electrospinning process. The fiber diameter is measured through SEM analysis. A highly accurate kernel-based non-linear mul- tivariable grey model, KGM (1, 1) model is used for the prediction of nanofiber diameter for filtering particulate less than 500 nm. This is proved to be better when compared to the grey model first order one variable and multivariable grey model. Based on simulated outcomes, filtration membranes are prepared and tested for filtration efficiency for the airborne particles relating its air permeability, porosity and quality factor. Key words: electrospinning, nanofiber diameter, morphology, air permeability, porosity, quality factor, KGM (1, N), GM (1, 1), MGM (1, N) model Introduction Particulate matters like airborne particles, aerosol particles, allergens, pollutants, and harmful biological agents in the environment require filters to a nanoscale for filtration. The size of the pores formed with micrometer fibers is large and hence filtration efficiency is low. With this nanofiber membrane, high filtration efficiency can be achieved to the required level. The poly-acrylonitrile (PAN) nanofiber web is used in the filtration due to its high spinnability and good tensile strength properties [1]. Melt-blown fiber, glass fiber are the traditional air filtration media [2]. A grey system theory, which is a prediction of required nanofiber diameter for filtering out such particulate is represented by GM (n, m). Here, n represents the differential equation’s order and m represents the variable’s number. It is designed to deal with any am- biguous problems that proved advantageous over other statistical models because it requires minimum data to start even with inadequate information and does not rely on original data [3]. The existing model GM (1, 1) has many disadvantages such as exponential growth rule, low * Corresponding authors, e-mail: [email protected], [email protected]
Transcript of CORRELATION MODEL FOR FIBER DIAMETER OF ELECTRO-SPUN ...

Thayumanavan, M., et al.: Correlation Model for Fiber Diameter of the Electro-Spun ... THERMAL SCIENCE: Year 2021, Vol. 25, No. 6A, pp. 4371-4382 4371
CORRELATION MODEL FOR FIBER DIAMETER OF THE ELECTRO-SPUN MEMBRANE USING KGM (1, N) MODEL FOR NANOFILTRATION
by
Menaka THAYUMANAVAN a*, Andy SRINIVASAN b*, and Senthil Kumar ARUMUGAM c
a Department of Electronic and Instrumentation, SRM Institute of Science and Technology, Chennai, Tamil Nadu, India
b Department of Electronic and Instrumentation, SRM Valliammai Engineering College, Chennai, Tamil Nadu, India
c Department of Electronics and Communication, Kings Engineering College, Chennai, Tamil Nadu, India
Original scientific paper https://doi.org/10.2298/TSCI210702268T
Nanofiltration is an important application for electro-spun fiber as it is well char-acterized by fine fiber diameter, huge density, high penetrability, and flexibility. In this paper, the poly-acrylonitrile fiber diameter is determined experimentally by varying four factors such as voltage, flow rate, the distance between spinneret and collector, and mass fraction in the electrospinning process. The fiber diameter is measured through SEM analysis. A highly accurate kernel-based non-linear mul-tivariable grey model, KGM (1, 1) model is used for the prediction of nanofiber diameter for filtering particulate less than 500 nm. This is proved to be better when compared to the grey model first order one variable and multivariable grey model. Based on simulated outcomes, filtration membranes are prepared and tested for filtration efficiency for the airborne particles relating its air permeability, porosity and quality factor. Key words: electrospinning, nanofiber diameter, morphology, air permeability,
porosity, quality factor, KGM (1, N), GM (1, 1), MGM (1, N) model
Introduction
Particulate matters like airborne particles, aerosol particles, allergens, pollutants, and harmful biological agents in the environment require filters to a nanoscale for filtration. The size of the pores formed with micrometer fibers is large and hence filtration efficiency is low. With this nanofiber membrane, high filtration efficiency can be achieved to the required level. The poly-acrylonitrile (PAN) nanofiber web is used in the filtration due to its high spinnability and good tensile strength properties [1]. Melt-blown fiber, glass fiber are the traditional air filtration media [2]. A grey system theory, which is a prediction of required nanofiber diameter for filtering out such particulate is represented by GM (n, m). Here, n represents the differential equation’s order and m represents the variable’s number. It is designed to deal with any am-biguous problems that proved advantageous over other statistical models because it requires minimum data to start even with inadequate information and does not rely on original data [3]. The existing model GM (1, 1) has many disadvantages such as exponential growth rule, low
* Corresponding authors, e-mail: [email protected], [email protected]

Thayumanavan, M., et al.: Correlation Model for Fiber Diameter of the Electro-Spun ... 4372 THERMAL SCIENCE: Year 2021, Vol. 25, No. 6A, pp. 4371-4382
accuracy, unsuitable for long term prediction model and cannot be used for the non-linear sys-tem. Since too many factors influence the fiber diameter, GM (1, 1) model could not be utilized.
The drawback of the GM (1, 1) grey model is overcome by changing the variable from 1-D multi-dimension GM (1, N) grey model. This has also the disadvantage of low accuracy due to force linear assumption between the parameters, unsatisfactory error prediction, larger short-term forecasting errors and cannot be used effectively on the non-linear system [4]. The disadvantage of GM (1, N) is overcome by using the MGM (1, N) grey model that even over-comes the disadvantage of the GM (1, 1) model by taking many factors into account resulting in better accuracy. However, it is applicable only for the linear system. The disadvantage of MGM (1, N) is that the accuracy of the prediction model is unsatisfactory rather than worst when the data is of non-linear [5]. By taking into consideration the inaccuracy of both the existing linear models and a non-linear system, KGM (1, N) model is considered for replacement. Some of the previous research works that have been carried out in this domain are described below. Ste-panyan et al. [6] stated that box-Behnken design was used for the prediction of carboxymethyl chitosan diameter by using four parameters such as nozzle inner diameter, voltage, solution concentration, and flow rate and compared with a quadratic regression model. The outcome precision of the fiber diameter was 91.38% which was considered to be high. This could not only predict the diameter but also determined the optimal electrospinning parameters of the fi-bers. Stepanyan et al. [7] observed that charge repulsive force which leads to fiber stretching to make a small diameter and viscous force which prevents fiber from stretching after evaporation of the solvent was considered as the main factor for the prediction of the fiber diameter. How-ever, this relationship between charge repulsive force and viscous force is not appropriate for actual manufacturing. Hou and Cai [8] predicted that the fiber diameter using response surface methodology which provided the accuracy error of 86.59% was still large. Spivak [9] related the jet flow radius and the distance between the nozzle and collector for prediction and con-trolling of fiber diameter but this relationship was insufficient in terms of universality. Larrondo et al. [10] attempted to provide the relationship between process parameters and fiber. Larrondo et al. [11] exhibited that electricity forecasting for the total population using a multivariable grey model. Larrondo et al. [12] proposed forecasting of petroleum production by a novel kernel regularized non-homogeneous grey model. Wu et al. [13] stated the non-linear relation-ship between the input and output series for oil field production. Bae et al. [14] exhibited the outcome of electrospinning factors on filtration properties by conducting filtration and perme-ability tests on micro-particles existing in the water. The data obtained from response surface models were used to spin the filter membrane.
Figure 1. The input-output process diagram of proposed model; electrospinning process consist of: 1 – high voltage, 2 – Syringe pump, and 3 – collector

Thayumanavan, M., et al.: Correlation Model for Fiber Diameter of the Electro-Spun ... THERMAL SCIENCE: Year 2021, Vol. 25, No. 6A, pp. 4371-4382 4373
In this paper, the PAN nanomembrane (with fiber diameter of 200 to 400 nm) is prepared for filtering out the airborne particles of size below 500 nm. The fiber diameter is determined experimentally by varying four different parameters such as voltage, flow rate, distance between the nozzle and collector, mass fraction. Simulation is done using Kernel-based non-linear multivariable grey model which proved that the accuracy of the non-linear grey model is better than linear models such as GM (1,1) and MGM (1, N). Based on the simulation result, the efficacy of the nanofiber for filtration is determined using air permeability, porosity, and quality factor. The input-output process diagram of proposed model is shown in fig. 1.
Material and solution preparation
The PAN powder of molecular weight (Mw = 150000) and N, N-dimethylformamide (DMF, density = 0.945-0.950 g/mL) was purchased from Siscon, Chennai. A solution of PAN was prepared by dissolving PAN powder in DMF. After dissolving, intense stirring was done for about 5 hours using a magnetic stirrer for a clear yellow and uniform solution.
Characterization
The characteristic peak analyzed by FTIR provides the broadening trembling of nitrile groups (-CN-) at 2246 1/cm and methylene (-CH2-) at 1449 1/cm and twisting trembling of methylene (-CH2) at 1450 1/cm and the methyl (-CH3) in CCH3 at 1369 cm.
The characteristics peak analyzed by Raman spectroscopy shows the highest elongat-ing peak at 2500, and the existence of CH2-group occurs at 2800 cm. The C = H vibration peaks occur at 1800 cm/1. The characterization of PAN done using FTIR and Raman spectroscopy is show in the fig. 2.
Figure 2. Characterization of PAN done using; (a) FTIR and (b) Raman spectroscopy
Electrospinning parameters
The determining factors used in, for the prediction of fiber diameter are voltage, V [kV], flow rate, S in ml per hour, the mass fraction of PAN (M %) [g], and the distance between nozzle and collector, L [cm]. The predicted factor is denoted by X (0). The prediction of the fiber diameter is done by varying any one of the parameters at a time while others were kept constant. The factors are valued as the voltage at 18 kV, distance between the nozzle and collector at 16 cm, the flow rate at 0.5 ml per hour and a mass fraction at 12%. The selected inner diameter of the nozzle is 0.57 mm.

Thayumanavan, M., et al.: Correlation Model for Fiber Diameter of the Electro-Spun ... 4374 THERMAL SCIENCE: Year 2021, Vol. 25, No. 6A, pp. 4371-4382
Detection of fiber diameter sample
Electro-spun fibers web (1 cm × 1 cm) was taken on a template and fixed on an alumi-num stub using double side carbon adhesive tape. The stub was placed in a sputter coater device for coating the sample with a thin layer of gold for 10 minutes to eliminate image artifacts that arise from excess surface charge. After this coating, the samples were observed under SEM. The diameter was measured by image analysis software (ImagePro+4.5) by taking random samples from the SEM images. The value of fiber diameter corresponding to the changed parameter is provided below in tab. 1. Due to analytical reasons, the factors are kept within certain ranges. The SEM image of the nanofiber diameter at varying process parameters is shown in fig. 3
Table 1. Change in fiber diameter with the varying parameters voltage, V [kV]; mass fraction, M [%], flow rate, S [ml/hour], distance between needle and collector, L [cm], and fiber diameter, D [nm]V [kV] D1 [nm] M% [g] D2 [nm] S [ml per hour] D3 [nm] L [cm] D4 [nm]
12 323.5 9 226.7 0.3 329.7 14 347.714 344 10 250 0.4 338.8 16 354.916 352.4 11 307.5 0.5 355.9 18 361.918 354.9 12 358.9 0.6 368.8 20 399.420 365.8 13 390.7 0.7 370.4 22 386.122 369.6 14 412.3 0.8 374.9 24 378.513 340.9 10.5 290.2 0.45 340.1 17 357.315 344.2 11.5 338.2 0.55 357.1 19 371.519 356.6 12.5 364.8 0.65 369.8 21 387.5
Figure 3. Shows the SEM image of the nanofiber diameter at varying process parameters; (a) flow rate 0.3 ml per hour, (b) distance between needle and collector 18 cm, (c) mass fraction 9%, and (d) voltage 12 kV

Thayumanavan, M., et al.: Correlation Model for Fiber Diameter of the Electro-Spun ... THERMAL SCIENCE: Year 2021, Vol. 25, No. 6A, pp. 4371-4382 4375
Grey relation analysis
It is one of the methods in the grey model with which the relation degree of every factor in the system can be analysed [15]. The grey relation coefficient Lij(t) in which Δij(t) is the absolute value of the factor and K-value is 0.5 and grey relation grade Rij in which Lij(t) is the absolute value of the factor and M is the no of factors as shown in eqs. (1) and (2), respectively:
min max ( )( ) maxij
ij
kL tt k
∆ + ∆=∆ + ∆ (1)
1
( )M
ijt
ij
L tR
M==∑ (2)
Using eq. (2) grey relation grade is calculate between all four factors concerning to fiber diameter. If the grey relation grade of the factors is greater than 0.5, then the factor will have a great influence over the fiber diameter. The grey relational degree of voltage factor is R1 = 0.7983, mass fraction is R2 = 0.7597, flow rate is R3 = 0.7417, distance between nozzle and collector is R4 =0.7632. The grey relation grade analysis indicates that all the factors have a great influence over the fiber diameter and can be used for grey modelling and prediction of fiber diameter.
The KGM (1, N)
Both existing linear grey models GM (1, 1) and MGM (1, 1) have certain disadvan-tages such as the average prediction error that could not meet the accuracy requirements and the non-functionality of non-linear systems because of the worst accuracy prediction. To overcome this disadvantage, kernel-based non-linear multivariable grey model KGM (1, N) is proposed. The KGM (1, N) is an efficient method to deal with small samples and shows a non-linearity rela-tionship between input and output series for a wide variety of applications. This method converts the linear model into a non-linear model using the Gaussian kernel method and provides better accuracy than the existing method. This model is the combination of the grey model with a kernel algorithm. The simulated value and simulated error of the voltage, flow rate, distance between nozzle and collector, and mass fraction factor are tabulated in tabs. 2(a)-2(d), respectively.
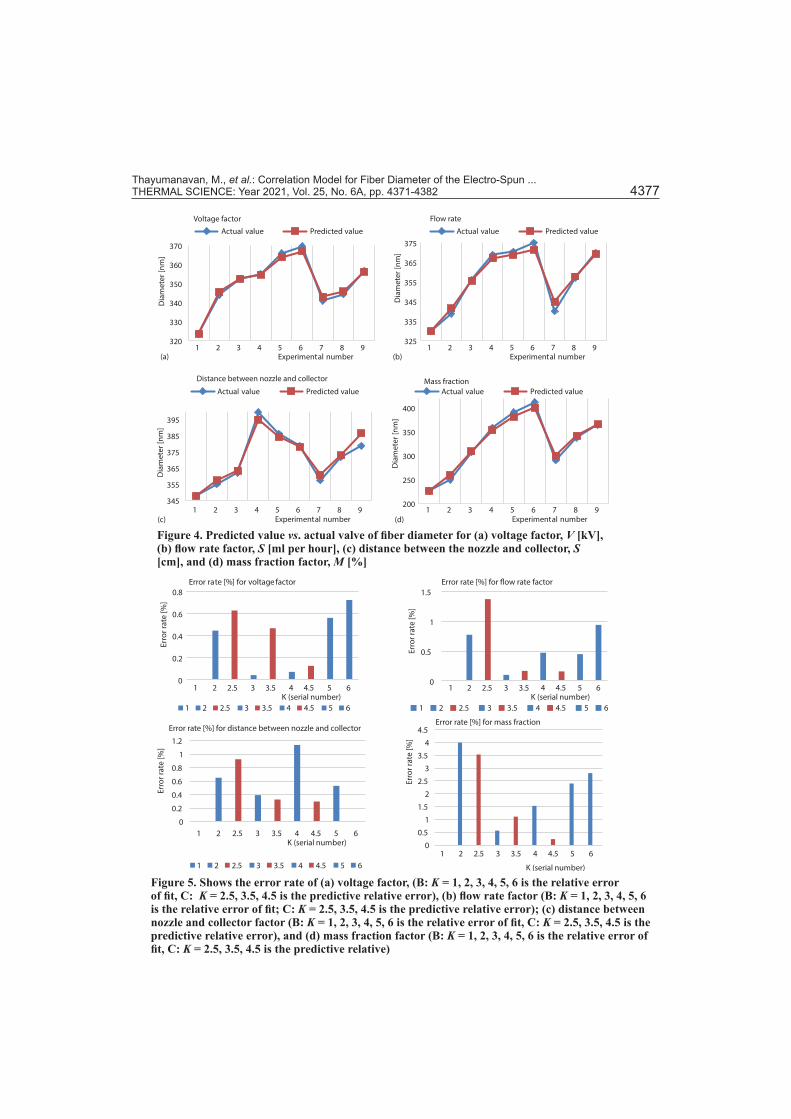
The difference in the predicted value vs. the actual valve of fiber diameter for four different parameters is shown in figs. 4(a)-4(d). The difference in the value is very narrow hence the accuracy is expected to be high. The maximum error and average predictive error of the voltage factor, fig. 5(a), flow rate, fig. 5(b), distance between nozzle and collector, fig. 5(c), and mass fraction, fig. 5(d) are 0.7213 and 0.3065, 0.9393 and 0.4558, 0.1339 and 0.4751, 0.1339 and 1.8825, respectively. For this model, the fixed target error has to be within 3%. If the mean predictive error is within 3%, then the model is said to be good [16]. In this proposed KGM (1, N) model, all the factors have met the accuracy requirements and are found to be more ac-curate than the existing model
Existing models
Zhou et al. [17] conducted experiments to find out the influence of process factors over the fiber diameter. It was simulated using the GM (1,1) and MGM (1, N) models to find out the better accuracy of one over the other. But the models did not meet the accuracy requirement and left the scope to use a better model to provide more accuracy.

Thayumanavan, M., et al.: Correlation Model for Fiber Diameter of the Electro-Spun ... 4376 THERMAL SCIENCE: Year 2021, Vol. 25, No. 6A, pp. 4371-4382
The GM (1, 1)
The GM (1, 1) is a time series prediction and fundamental model. It consists of one variable and a first-order differential equation provide modelling for discrete series with a few data based on the exponential pattern. More than four input values are needed in series to calcu-late this model and the data should be taken at equivalent intervals and successive order without avoiding any data. The advantage of the GM (1,1) model is that it can be used for linear systems [18]. The major disadvantages of the GM (1,1) model are the given input data being only pos-
Table 2. Shows the simulated value and simulated error of the (a) voltage, V [kV], (b) flow rate, S [ml per hour], (c) distance between nozzle and collector, L [cm], and (d) mass fraction factor, M [%]
Sl.No. V [kV] K Real
valueSimulated
value Error
1 12 1 323.5 323.5000 0
2 14 2 344.0 345.5299 0.4447
3 16 3 352.4 352.5475 0.04184 18 4 354.9 354.6485 0.07085 20 5 365.8 363.7495 0.56056 22 6 369.6 366.9338 0.7213
Mape 1 0.3065 Forecast
value Error
7 13 2.5 340.9 343.0348 0.62628 15 3.5 344.2 345.8025 0.46559 19 4.5 356.6 356.1535 0.1252
Mape 2 0.4056 (a)
Sl.No. S [ml] K Real
valueSimulated
value Error
1 0.3 1 329.7 329.7000 02 0.4 2 338.8 341.4185 0.77283 0.5 3 355.9 355.5368 0.10204 0.6 4 368.8 367.0580 0.47235 0.7 5 370.4 368.7371 0.44896 0.8 6 374.9 371.3784 0.9393
Mape 1 0.4558Forecast
valueForecast
error7 0.25 2.5 340.1 344.7589 1.36988 0.35 3.5 357.1 357.7058 0.16969 0.45 4.5 369.8 369.2072 0.1603
Mape 2 0.5665(b)
Sl.No. L [cm] K Real
valueSimulated
value Error
1 14 1 347.7 347.7000 02 16 2 354.9 357.2161 0.65263 18 3 361.9 363.3251 0.39374 20 4 399.4 394.8520 1.13875 22 5 386.1 384.0468 0.53176 24 6 378.5 377.9929 0.1339
Mape 1 0.4751Forecast
value Error
7 17 2.5 357.3 360.6069 0.92558 19 3.5 371.5 372.7221 0.32899 21 4.5 378.5 386.3386 0.2997
Mape 2 0.5180(c)
Sl.No. M [%] K Real
valueSimulated
value Error
1 9 1 226.7 226.7000 02 10 2 250 259.9916 3.99663 11 3 307.5 309.2298 0.56254 12 4 358.9 353.4185 1.52735 13 5 390.7 381.3086 2.40376 14 6 412.3 400.7342 2.8051
Mape 1 1.8825Forecast
value Error
7 10.5 2.5 290.2 300.4463 3.53078 11.5 3.5 338.2 341.9458 1.10759 12.5 4.5 364.8 365.6503 0.233
Mape 2 1.6237(d)
Thayumanavan, M., et al.: Correlation Model for Fiber Diameter of the Electro-Spun ... THERMAL SCIENCE: Year 2021, Vol. 25, No. 6A, pp. 4371-4382 4377
Figure 5. Shows the error rate of (a) voltage factor, (B: K = 1, 2, 3, 4, 5, 6 is the relative error of fit, C: K = 2.5, 3.5, 4.5 is the predictive relative error), (b) flow rate factor (B: K = 1, 2, 3, 4, 5, 6 is the relative error of fit; C: K = 2.5, 3.5, 4.5 is the predictive relative error); (c) distance between nozzle and collector factor (B: K = 1, 2, 3, 4, 5, 6 is the relative error of fit, C: K = 2.5, 3.5, 4.5 is the predictive relative error), and (d) mass fraction factor (B: K = 1, 2, 3, 4, 5, 6 is the relative error of fit, C: K = 2.5, 3.5, 4.5 is the predictive relative)
Figure 4. Predicted value vs. actual valve of fiber diameter for (a) voltage factor, V [kV], (b) flow rate factor, S [ml per hour], (c) distance between the nozzle and collector, S [cm], and (d) mass fraction factor, M [%]

Thayumanavan, M., et al.: Correlation Model for Fiber Diameter of the Electro-Spun ... 4378 THERMAL SCIENCE: Year 2021, Vol. 25, No. 6A, pp. 4371-4382
itive, the pseudo smooth condition, an internal error in the background series caused by mean generating operation and the inverse accumulation always containing residual prediction error. The last disadvantage is that it can forecast and model all data when t = n. Hence, it overlooks new information and cannot replicate the precise characteristic of the current status [19]. The simulated value and simulated error of the voltage, flow rate, distance, and mass fraction factor are tabulated in tabs. 3(a)-3(d), respectively. The error value is a little high compared to KGM (1, N) model and hence the accuracy is bad.
Table 3. Shows the simulated value and simulated error of the (a) voltage, V [kV], (b) flow rate, S [ml per hour], (c) distance between nozzle and collector, S [cm], and (d) mass fraction factor, M [%]
(a)Sl.No.
V [kV] K Real
valueSimulated
value Error
1 12 1 323.5 323.5000 02 14 2 344.0 353.1792 2.66833 16 3 352.4 353.2851 0.25114 18 4 354.9 353.3910 0.42515 20 5 365.8 353.4969 3.36336 22 6 369.6 353.6029 4.3282
Mape 1.8393 Forecast
value Error
7 13 1.5 340.9 353.7089 3.75738 15 2.5 344.2 353.8149 2.79349 19 4.5 356.6 353.9210 0.7512
Mape 2 2.4339
(b)Sl.No
S [ml per hour] K Real
valueSimulated
value Error
1 0.3 1 329.7 329.7000 02 0.4 2 338.8 353.6802 4.3923 0.5 3 355.9 355.3205 0.16284 0.6 4 368.8 356.9684 3.20815 0.7 5 370.4 358.624 3.17926 0.8 6 374.9 360.2872 3.8977
Mape 1 2.4733 Forecast
value Error7 0.25 1.5 340.1 361.9582 6.42698 0.35 2.5 357.1 363.6369 1.83059 0.45 4.5 369.8 365.3233 1.2105
Mape 2 3.1559
(c)
Sl.No.
L[cm] K Real
valueSimulated
value Error
1 14 1 347.7 347.7 02 16 2 354.9 368.7959 3.91543 18 3 361.9 370.45 2.36254 20 4 399.4 372.1114 6.83235 22 5 386.1 373.7803 3.19086 24 6 378.5 375.4567 0.804
Mape 1 2.8508Forecast
value Error
7 17 2.5 357.3 377.1406 5.55298 19 3.5 371.5 378.8321 1.97369 21 4.5 387.5 380.5311 1.7984
Mape 2 3.1083
(d)Sl. No.
M [%] K Real
valueSimulated
value Error
1 9 1 226.7 226.7 02 10 2 250 309.9327 23.9733 11 3 307.5 317.8613 3.36954 12 4 358.9 325.9927 9.16895 13 5 390.7 334.3321 14.4274
6 14 6 412.3 342.8849 16.836
Mape 1 11.2958Forecast
value Error
7 10.5 2.5 290.2 351.6564 21.17728 11.5 3.5 338.2 360.6524 6.63879 12.5 4.5 364.8 369.8784 1.3921
Mape 2 9.736

Thayumanavan, M., et al.: Correlation Model for Fiber Diameter of the Electro-Spun ... THERMAL SCIENCE: Year 2021, Vol. 25, No. 6A, pp. 4371-4382 4379
The MGM (1, N) model
The MGM (1, N) MODEL is the Nth order differential equation containing n elements. The disadvantage of GM (1, 1) is overcome by MGM (1 N) model as it apprises the model, presents new information, and determines the influence of many factors over the predicted data. The major disadvantage of this model is that its accuracy is the worst when the data is non-lin-ear and does not meet the accuracy requirement. The simulated value and simulated error of the voltage, flow rate, distance, and mass fraction factor are tabulated in tabs. 4(a)-4(d), respective-Table 4. Shows the simulated value and simulated error of (a) voltage, V [kV], (b) flow rate, S [ml per hour], (c) distance between the nozzle and collector, L [cm], and (d) mass fraction, M [%]
(a)
Sl.No V K
Realvalue(A)
x1(0)
(M)x2
(0)
(S)x3
(0)
(L)Simulated
value Error
1 12 1 323.5 9 0.3 14 323.5000 02 14 2 344 10 0.4 16 325.3778 5.41343 16 3 352.4 11 0.5 18 327.2666 7.1324 18 4 354.9 12 0.6 20 329.1663 7.25095 20 5 365.8 13 0.7 22 331.0770 9.49236 22 6 369.6 14 0.8 24 332.9988 9.9029
Mape 1 6.5319Forecast
value Error
7 13 1.5 340.9 10.5 0.45 17 334.9318 1.75078 15 2.5 344.2 11.5 0.55 19 336.8760 2.12789 19 4.5 356.6 12.5 0.65 21 338.8314 4.9827
Mape 2 2.9537
(b)
Sl. No. S K
Real value(A)
x1(0)
(V)x2
(0)
(L)x3
(0)
(M)Simulated
value Error
1 0.3 1 329.7 12 14 9 329.7000 02 0.4 2 338.8 14 16 10 331.5489 2.14023 0.5 3 355.9 16 18 11 333.4081 6.31974 0.6 4 368.8 18 20 12 335.2777 9.08955 0.7 5 370.4 20 22 13 337.1579 8.97466 0.8 6 374.9 22 24 14 339.0485 9.5629
Mape 1 6.0144 Forecast
value Error
7 0.25 1.5 340.1 13 17 10.5 340.9498 0.24988 0.35 2.5 357.1 15 19 11.5 342.8618 3.98719 0.45 4.5 369.8 19 21 12.5 344.7844 6.7646
Mape 2 3.6671
(c)
Sl.No. L K
Real value(A)
x1(0
(V)x2
(0)
(M)x3
(0)
(S)Simulated
value Error
1 14 1 347.7 12 9 0.3 347.7 02 16 2 354.9 14 10 0.4 349.6715 1.47323 18 3 361.9 16 11 0.5 351.6541 2.83114 20 4 399.4 18 12 0.6 353.648 11.45515 22 5 386.1 20 13 0.7 355.6531 7.88576 24 6 378.5 22 14 0.8 357.6697 5.5033
Mape 1 4.8580Forecast
value Error7 17 2.5 357.3 13 10.5 0.45 359.6977 0.6718 19 3.5 371.5 15 11.5 0.55 361.7372 2.62799 21 4.5 387.5 19 12.5 0.65 363.7882 6.1191
Mape 2 3.1393
(d)
Sl.No. M K
Real value(A)
x1(0
(L)x2
(0)
(S)x3
(0)
(V)Simulated
value Error
1 9 1 226.7 14 0.3 12 226.7 02 10 2 250 16 0.4 14 227.5311 8.9873 11 3 307.5 18 0.5 16 228.3652 25.7384 12 4 358.9 20 0.6 18 229.2024 0.003615 13 5 390.7 22 0.7 20 230.0426 0.00416 14 6 412.3 24 0.8 22 230.8859 44.0005
Mape 1 25.9982Forecast
value Error
7 10.5 2.5 290.2 17 0.45 13 231.7323 20.14738 11.5 3.5 338.2 19 0.55 15 232.5819 31.22949 12.5 4.5 364.8 21 0.65 19 233.4345 36.0102
Mape 2 29.1289

Thayumanavan, M., et al.: Correlation Model for Fiber Diameter of the Electro-Spun ... 4380 THERMAL SCIENCE: Year 2021, Vol. 25, No. 6A, pp. 4371-4382
ly. The error value is very high compared to KGM (1, N) and GM (1,1) model and hence the accuracy is the worst. The average prediction error of all factors under the three grey models is compared and tabulated in tab. 5.
Table 5. Comparison of average prediction error for all three grey models
ModelAverage prediction error
Voltage [kV] Flow rate[ml per hour] Distance [cm] Mass fraction [%]
KGM (1, N) 0.3065% 0.45585% 0.4751% 1.8825%GM (1,1) 1.8393% 2.4733% 2.8508% 11.2958%
MGM (1, N) 6.5319% 6.0144% 4.8580% 25.9982%
Effect of nanofibrous membrane on airborne particle filtration
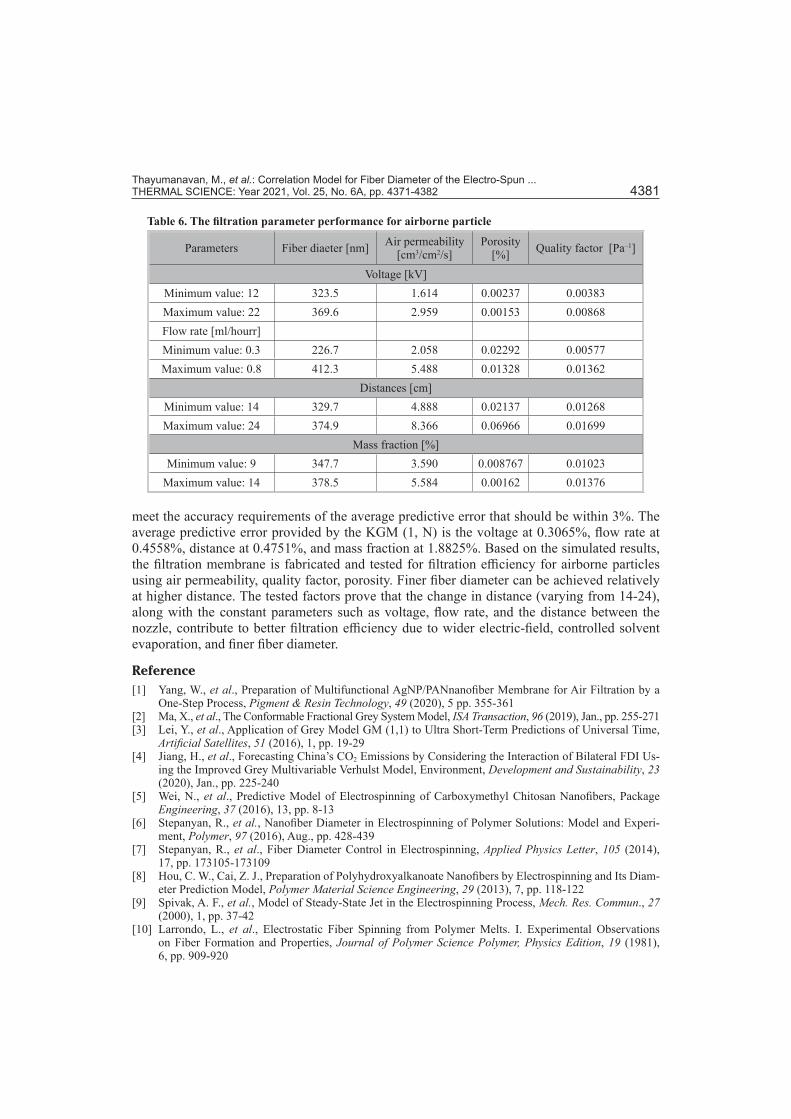
Due to small pores and high surface areas, the filtration membrane is formed by nanofiber, which provides greater filtration efficiency than conventional microfiber fabrics [20]. The better porous media for filtration applications is provided by the non-woven fibrous membranes [21]. The base fabric used is PP non-woven with an areal density of 18 g and thickness 0.2 mm. The outcome of electrospinning factors on filtration properties is tested by conducting porosity, quality factor, and air permeability tests on air-borne particles exist-ing in the air. The data obtained from accurate KGM (1, N) are used to spin the filter mem-brane. The air-permeability of the web (size: 5 cm2) is measured by an air permeability tester (ASTM D737 – 18: air-flow pressure 120 Pa). The distance between the needle and the col-lector is one of the parameters that can affect the electrospinning process since it determines the electric field for the fibers to form and there is sufficient time for the solvent to evaporate. Higher the distance, the thinner diameter should be fiber. The quality factor, Q, was determined using the formula: Q = lnρ/ΔP where ρ is the permeability and ΔP is the pressure drop. The higher quality factor with lower pressuredrops than the pressure drop provided on other filter membranes will provide high fil-tration efficiency [1]. The porosity, ε, was determined using the formula: ε = 1 – m/z × s × ρ ×100%where m [mg] is the weight of the membrane samples measured by an electronic weighing ma-chine, ρ – the density of PVA raw material, z [mm] – the thickness of the membrane samples, and S [mm2] is the sample size of the relevant samples. Table 6 shows the filtration parame-ter performance for airborne particle. The lower fiber diameter will lead to higher filtration efficiency.
It is proved that the distance ranging from 14-24 cm with a constant parameter such as the voltage of 18 kV, the flow rate at 0.5 ml per hour, a mass fraction at 12%. parameter provides good filtration efficiency, porosity, quality factor, and air permeability for the fiber diameter of range from 329.7-374.9 nm.
Conclusion
In this paper, the PAN fiber diameter is determined by varying four-factor one at a time experimentally. The simulation is done using kernel-based non-linear multivariable grey model KGM (1, 1), which is accurate than GM (1,1) and MGM (1, N) models and proves to
Thayumanavan, M., et al.: Correlation Model for Fiber Diameter of the Electro-Spun ... THERMAL SCIENCE: Year 2021, Vol. 25, No. 6A, pp. 4371-4382 4381
meet the accuracy requirements of the average predictive error that should be within 3%. The average predictive error provided by the KGM (1, N) is the voltage at 0.3065%, flow rate at 0.4558%, distance at 0.4751%, and mass fraction at 1.8825%. Based on the simulated results, the filtration membrane is fabricated and tested for filtration efficiency for airborne particles using air permeability, quality factor, porosity. Finer fiber diameter can be achieved relatively at higher distance. The tested factors prove that the change in distance (varying from 14-24), along with the constant parameters such as voltage, flow rate, and the distance between the nozzle, contribute to better filtration efficiency due to wider electric-field, controlled solvent evaporation, and finer fiber diameter.
Reference[1] Yang, W., et al., Preparation of Multifunctional AgNP/PANnanofiber Membrane for Air Filtration by a
One-Step Process, Pigment & Resin Technology, 49 (2020), 5 pp. 355-361[2] Ma, X., et al., The Conformable Fractional Grey System Model, ISA Transaction, 96 (2019), Jan., pp. 255-271[3] Lei, Y., et al., Application of Grey Model GM (1,1) to Ultra Short-Term Predictions of Universal Time,
Artificial Satellites, 51 (2016), 1, pp. 19-29[4] Jiang, H., et al., Forecasting China’s CO2 Emissions by Considering the Interaction of Bilateral FDI Us-
ing the Improved Grey Multivariable Verhulst Model, Environment, Development and Sustainability, 23 (2020), Jan., pp. 225-240
[5] Wei, N., et al., Predictive Model of Electrospinning of Carboxymethyl Chitosan Nanofibers, Package Engineering, 37 (2016), 13, pp. 8-13
[6] Stepanyan, R., et al., Nanofiber Diameter in Electrospinning of Polymer Solutions: Model and Experi-ment, Polymer, 97 (2016), Aug., pp. 428-439
[7] Stepanyan, R., et al., Fiber Diameter Control in Electrospinning, Applied Physics Letter, 105 (2014), 17, pp. 173105-173109
[8] Hou, C. W., Cai, Z. J., Preparation of Polyhydroxyalkanoate Nanofibers by Electrospinning and Its Diam-eter Prediction Model, Polymer Material Science Engineering, 29 (2013), 7, pp. 118-122
[9] Spivak, A. F., et al., Model of Steady-State Jet in the Electrospinning Process, Mech. Res. Commun., 27 (2000), 1, pp. 37-42
[10] Larrondo, L., et al., Electrostatic Fiber Spinning from Polymer Melts. I. Experimental Observations on Fiber Formation and Properties, Journal of Polymer Science Polymer, Physics Edition, 19 (1981), 6, pp. 909-920
Table 6. The filtration parameter performance for airborne particle
Parameters Fiber diaeter [nm] Air permeability[cm3/cm2/s]
Porosity[%] Quality factor [Pa–1]
Voltage [kV]Minimum value: 12 323.5 1.614 0.00237 0.00383Maximum value: 22 369.6 2.959 0.00153 0.00868Flow rate [ml/hourr]Minimum value: 0.3 226.7 2.058 0.02292 0.00577Maximum value: 0.8 412.3 5.488 0.01328 0.01362
Distances [cm]Minimum value: 14 329.7 4.888 0.02137 0.01268Maximum value: 24 374.9 8.366 0.06966 0.01699
Mass fraction [%]Minimum value: 9 347.7 3.590 0.008767 0.01023
Maximum value: 14 378.5 5.584 0.00162 0.01376

Thayumanavan, M., et al.: Correlation Model for Fiber Diameter of the Electro-Spun ... 4382 THERMAL SCIENCE: Year 2021, Vol. 25, No. 6A, pp. 4371-4382
[11] Larrondo, L., et al., Electrostatic Fiber Spinning from Polymer Melts, II. Examination of the Flow Field in an Electrically Driven Jet, Journal of Polymer Science Polymer, Physics Edition, 19 (1981), 6, pp. 921-932
[12] Larrondo, L., et al., Electrostatic Fiber Spinning from Polymer Melts, III. Electrostatic Deformation of a Pendant Drop of the Polymer Melt, Journal of Polymer Science Polymer, Physics Edition, 19 (1981), 6, pp. 933-940
[13] Wu, L., et al., Using a Novel Multi-Variable Grey Model to Forecast the Electricity Consumption of Shandong Province in China, Energy, 157 (2018), C, pp. 327-335
[14] Bae, J., et al., Parametrization Study of Electrospun Nanofiber Including LiCl Using Response Surface Methodology (RSM) for Water Treatment Application, MDPI: Applied Science, 10 (2020), 20, 7295
[15] Ma, X., et al., A Novel Kernel Regularized Non-Homogeneous Grey Model and Its Applications, Commu-nications in Non-linear Science and Numerical Simulation, 48 (2017), July, pp. 51-62
[16] Ma, X., Liu, Z. B., The Kernel-Based on the Non-Linear Multivariate Grey Model, Applied Mathematical Modelling, 56 (2018), Apr., pp. 217-238
[17] Zhou, Q., et al., Prediction and Optimization of Chemical Fiber Spinning Tension Based on Grey System Theory, Textile Research Journal, 89 (2018), 15, pp. 3067-3979
[18] Zhou, Q., et al., Prediction and Optimization of Electrospun Polyacrylonitrile Fiber Diameter Based on Grey System Theory, MDPI Material, 12 (2019), 14, 2237
[19] Di Zhang, D., et al., Electrospun Polyacrylonitrile Nanocomposite Fibers Reinforced with Fe3O4 Nanopar-ticles: Fabrication and Property Analysis, Polymer, 50 (2009), 17, pp. 4189-4198
[20] Lin, C. C., et al., Considering Multiple Factors to Forecast CO2 Emissions: A Hybrid Multivariable Grey Forecasting and Genetic Programming Approach, Energies, 11 (2018), 12, 3432
[21] Alarifi, I., et al., Synthesis of Electrospun Polyacrylonitrile Derived Carbon Fibers and Comparison of Properties with Bulk form, Plos One, 13 (2018), 8, e0201345
Paper submitted: July 2, 2021Paper revised: August 13, 2021Paper accepted: August 18, 2021
© 2021 Society of Thermal Engineers of SerbiaPublished by the Vinča Institute of Nuclear Sciences, Belgrade, Serbia.
This is an open access article distributed under the CC BY-NC-ND 4.0 terms and conditions