CORRELATION - Arkansas State Universitymyweb.astate.edu/sbounds/Statistics_AP/2 Week...
16
CORRELATION Part 2 The association between two variables
-
Upload
duongtuyen -
Category
Documents
-
view
213 -
download
0
Transcript of CORRELATION - Arkansas State Universitymyweb.astate.edu/sbounds/Statistics_AP/2 Week...
CORRELATIONPart 2
The association between two variables

Perfect PositiveAssociation

Perfect NegativeAssociation

CORRELATION ANALYSIS
Pearson’s r (or Pearson’s rho, )
Calculated value ranges from +1.0 to -1.0
Value depends upon
Strength of relationship
Direction
r = +0.94
Very strong, positiverelationship
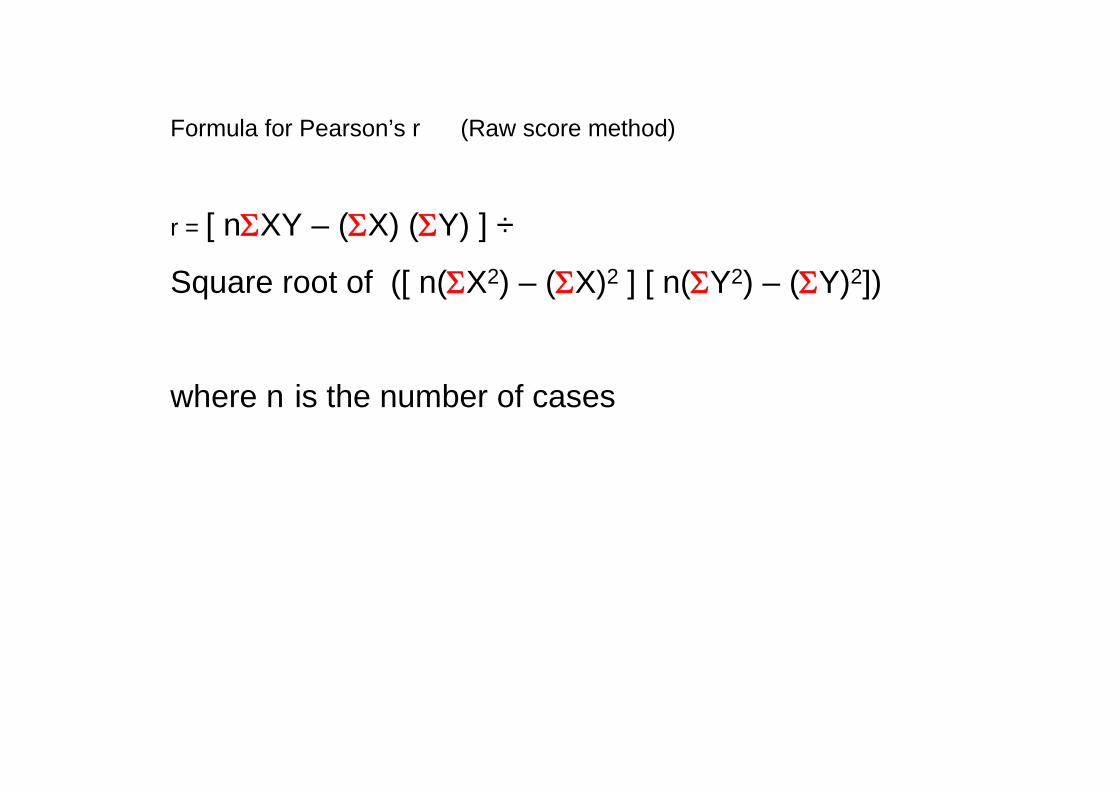
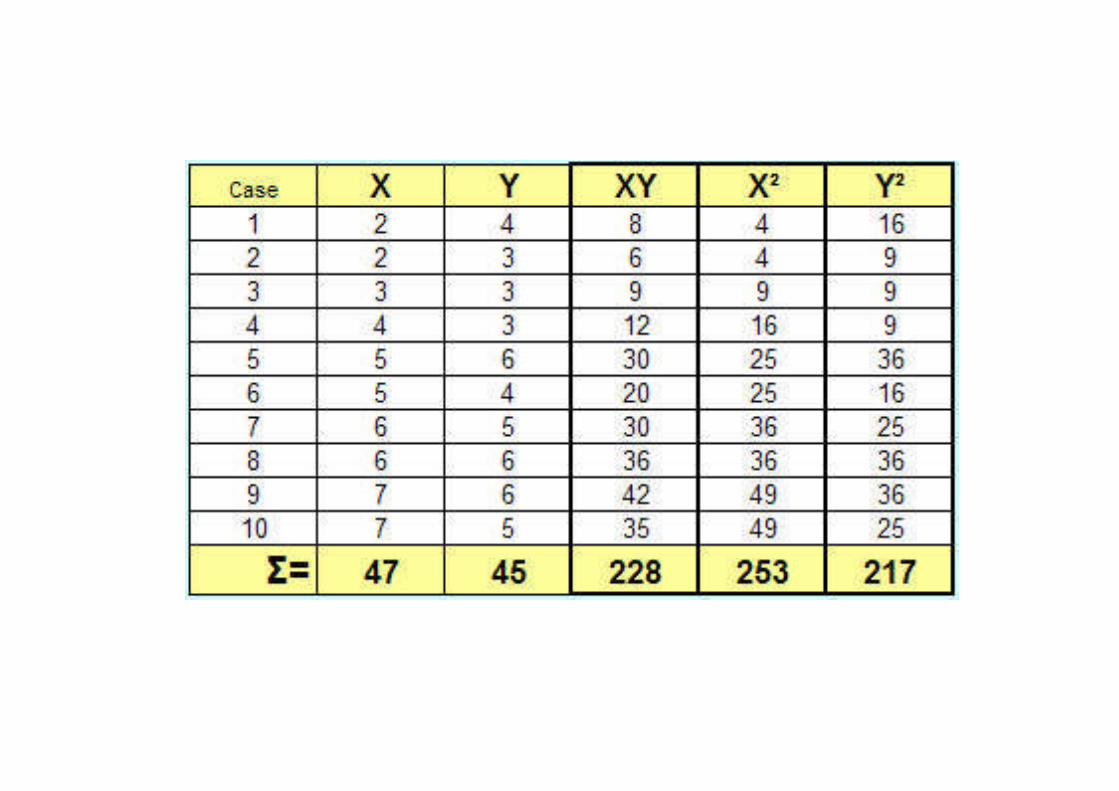
Formula for Pearson’s r (Raw score method)
r = [ nXY – (X) (Y) ] ÷
Square root of ([ n(X2) – (X)2 ] [ n(Y2) – (Y)2])
where n is the number of cases
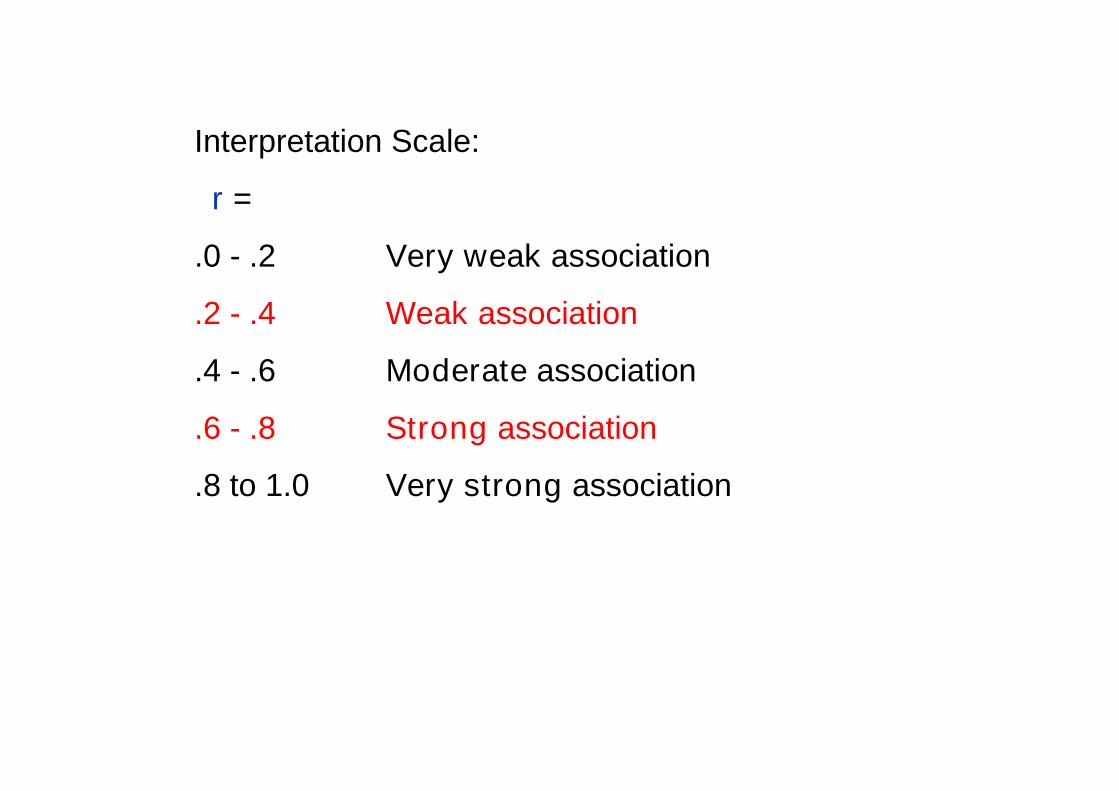
Interpretation Scale:
r =
.0 - .2 Very weak association
.2 - .4 Weak association
.4 - .6 Moderate association
.6 - .8 Strong association
.8 to 1.0 Very strong association

The value of r is referred to as the correlation coefficient
r2 is referred to as the coefficient of determination
A measure of the explained variance
……the amount of variation in one variable that isattributable to variation in the other variable

Example: comparing level of education with number ofmemberships in voluntary organizations results in r =+0.7 (a strong association).
r2 = 0.49 or 49%
Hence, 49% of the variation in the number ofmemberships is attributable to variation in level ofeducation
49%
51% does NOT overlap
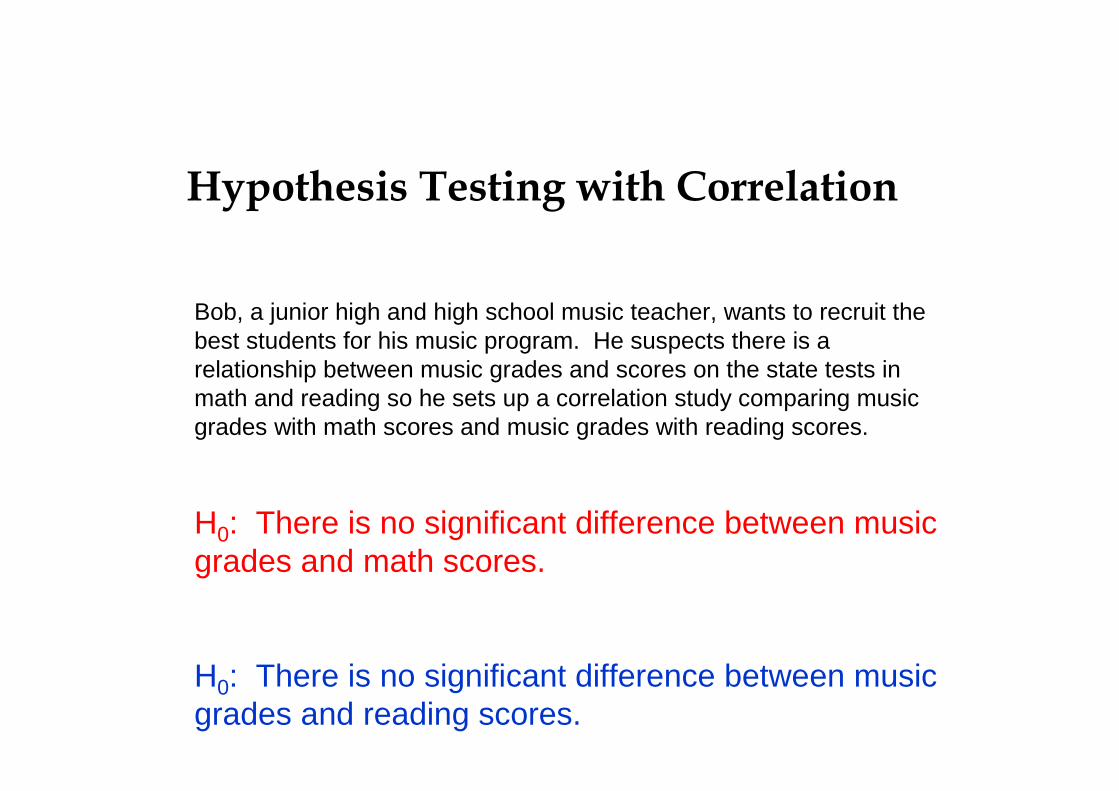
Hypothesis Testing with Correlation
Bob, a junior high and high school music teacher, wants to recruit thebest students for his music program. He suspects there is arelationship between music grades and scores on the state tests inmath and reading so he sets up a correlation study comparing musicgrades with math scores and music grades with reading scores.
H0: There is no significant difference between musicgrades and math scores.
H0: There is no significant difference between musicgrades and reading scores.
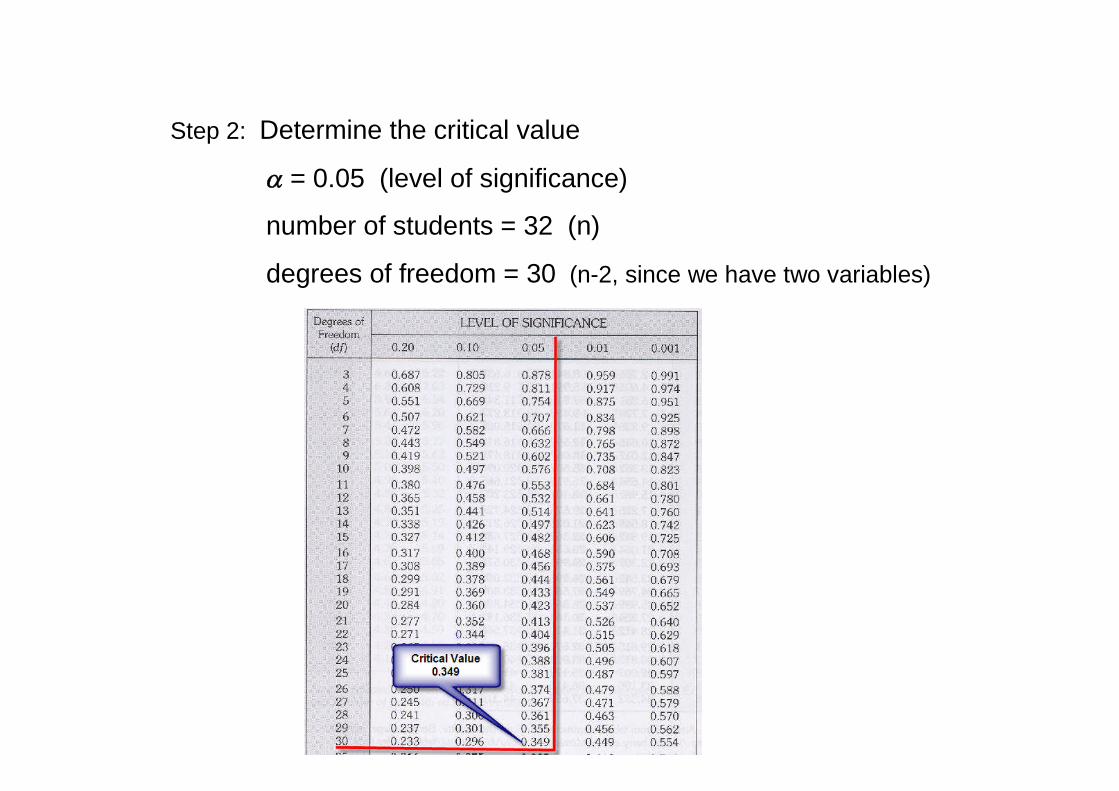
Step 2: Determine the critical value
= 0.05 (level of significance)
number of students = 32 (n)
degrees of freedom = 30 (n-2, since we have two variables)
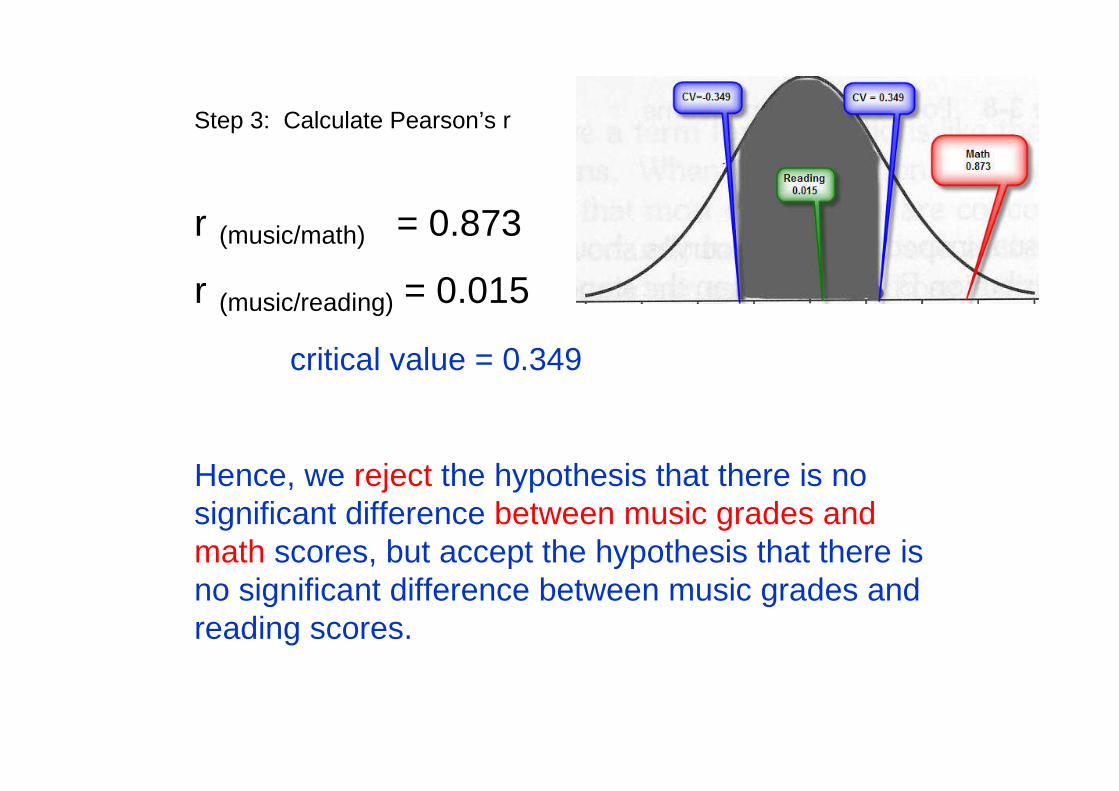
Step 3: Calculate Pearson’s r
r (music/math) = 0.873
r (music/reading) = 0.015
critical value = 0.349
Hence, we reject the hypothesis that there is nosignificant difference between music grades andmath scores, but accept the hypothesis that there isno significant difference between music grades andreading scores.

Bob can reasonably expect that students who scorewell on the state math test will do well in music.

CAUTION!
Correlation does not mean CausationResearchers found a high correlation between water temperature andnumber of drownings
Researchers found a high correlation between the number of bottles ofsuntan lotion sold at a store and number of drownings

Researcher found a strong negative correlation between staff moraleand frequent staff turnover
Does frequent staff turnover cause low morale?
Does low morale cause frequent staff turnover?
Or, is there a third factor that might cause both?
Violent students
Budget restrictions / low salaries
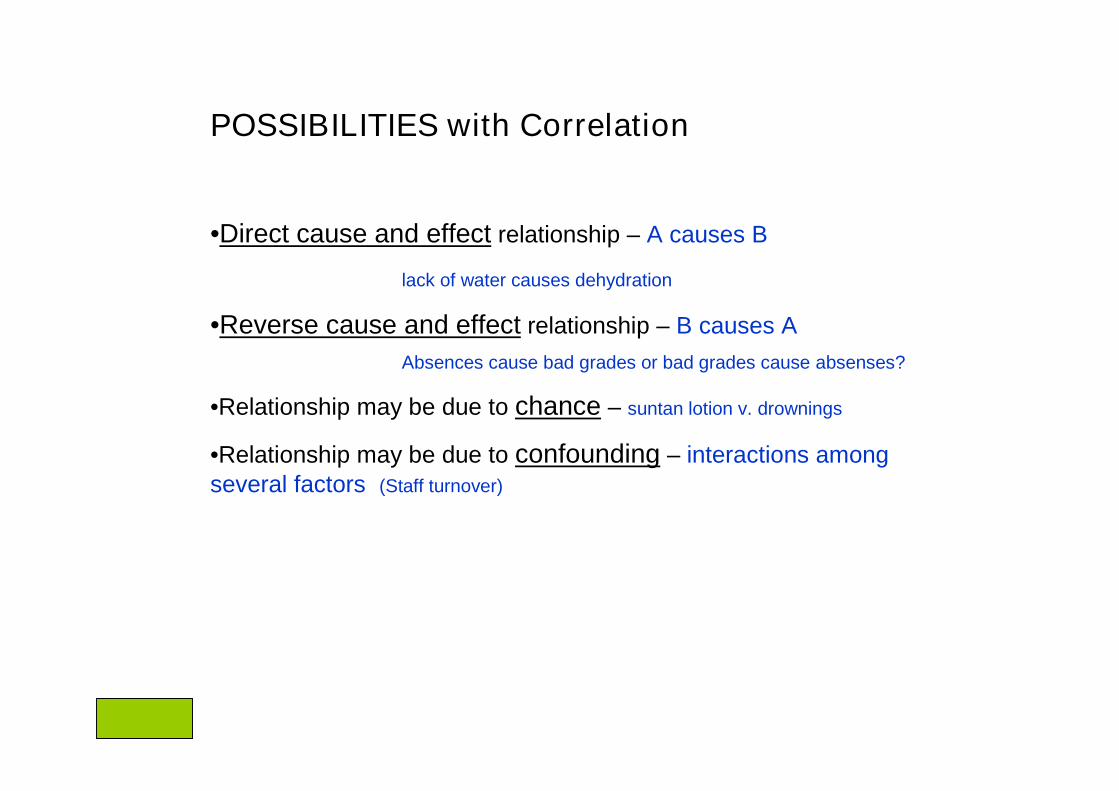
POSSIBILITIES with Correlation
•Direct cause and effect relationship – A causes B
lack of water causes dehydration
•Reverse cause and effect relationship – B causes A
Absences cause bad grades or bad grades cause absenses?
•Relationship may be due to chance – suntan lotion v. drownings
•Relationship may be due to confounding – interactions amongseveral factors (Staff turnover)