Correlating burst events on streaming stock market data
25
Data Min Knowl Disc (2008) 16:109–133 DOI 10.1007/s10618-007-0066-x Correlating burst events on streaming stock market data Michail Vlachos · Kun-Lung Wu · Shyh-Kwei Chen · Philip S. Yu Received: 17 May 2006 / Accepted: 24 January 2007 / Published online: 9 March 2007 Springer Science+Business Media, LLC 2007 Abstract We address the problem of monitoring and identification of corre- lated burst patterns in multi-stream time series databases. We follow a two-step methodology: first we identify the burst sections in our data and subsequently we store them for easy retrieval in an efficient in-memory index. The burst detection scheme imposes a variable threshold on the examined data and takes advantage of the skewed distribution that is typically encountered in many applications. The detected bursts are compacted into burst intervals and stored in an interval index. The index facilitates the identification of correlated bursts by performing very efficient overlap operations on the stored burst regions. We present the merits of the proposed indexing scheme through a thorough analysis of its complexity. We also manifest the real-time response of our burst index- ing technique, and demonstrate the usefulness of the approach for correlating surprising volume trading events using historical stock data of the NY stock exchange. While the focus of this work is on financial data, the proposed meth- ods and data-structures can find applications for anomaly or novelty detection in telecommunication, network traffic and medical data. Keywords Time-series · Indexing · Burst detection · Correlation 1 Introduction “Panta rhei”, said Heraklitos; everything is ‘in flux’. The truth of this famous aphorism by the ancient Greek philosopher is so much more valid today. People Responsible editor: Chang-shing Perng. M. Vlachos (B )· K.-L. Wu · S.-K. Chen · P. S. Yu IBM T.J. Watson Research Center, 19 Skyline Dr, Hawthorne, NY 10532, USA
Transcript of Correlating burst events on streaming stock market data

Data Min Knowl Disc (2008) 16:109–133DOI 10.1007/s10618-007-0066-x
Correlating burst events on streaming stock marketdata
Michail Vlachos · Kun-Lung Wu ·Shyh-Kwei Chen · Philip S. Yu
Received: 17 May 2006 / Accepted: 24 January 2007 / Published online: 9 March 2007Springer Science+Business Media, LLC 2007
Abstract We address the problem of monitoring and identification of corre-lated burst patterns in multi-stream time series databases. We follow a two-stepmethodology: first we identify the burst sections in our data and subsequentlywe store them for easy retrieval in an efficient in-memory index. The burstdetection scheme imposes a variable threshold on the examined data and takesadvantage of the skewed distribution that is typically encountered in manyapplications. The detected bursts are compacted into burst intervals and storedin an interval index. The index facilitates the identification of correlated burstsby performing very efficient overlap operations on the stored burst regions. Wepresent the merits of the proposed indexing scheme through a thorough analysisof its complexity. We also manifest the real-time response of our burst index-ing technique, and demonstrate the usefulness of the approach for correlatingsurprising volume trading events using historical stock data of the NY stockexchange. While the focus of this work is on financial data, the proposed meth-ods and data-structures can find applications for anomaly or novelty detectionin telecommunication, network traffic and medical data.
Keywords Time-series · Indexing · Burst detection · Correlation
1 Introduction
“Panta rhei”, said Heraklitos; everything is ‘in flux’. The truth of this famousaphorism by the ancient Greek philosopher is so much more valid today. People
Responsible editor: Chang-shing Perng.
M. Vlachos (B)· K.-L. Wu · S.-K. Chen · P. S. YuIBM T. J. Watson Research Center,19 Skyline Dr, Hawthorne, NY 10532, USA

110 M. Vlachos et al.
need to make decisions about financial, personal or inter-personal matters basedon the observations of various factoring parameters. Therefore, since everythingis in constant flow, monitoring the volatility/variability of important measure-ments over time, becomes a critical determinant in any decision making process.
When dealing with time sequences, or time-series data, one important indi-cator of change is the presence of ‘burstiness’, which suggests that more eventsof importance are happening within the same time frame. Therefore, the iden-tification of bursts can provide useful insights about an imminent change in themonitoring quantity, allowing the system analyst or individual to act upon atimely and informed decision.
Monitoring and modeling of burst behavior (see Fig. 1) is significant in manyareas;
• First and foremost, in computer networks it is generally recognized that net-work traffic can be bursty in various time-scales (Leland et al. 1993; Jiangand Dovrolis 2005). Detection of bursts is therefore inherently importantfor identification of network bottlenecks or for intrusion detection, since anexcessive amount of incoming packets may be a valid indication that a net-work system is under attack (Scott 2004).
• Detection of bursty behavior can also be useful during the auditing of com-puter system logs, with the goal of spotting problems or system bottlenecks.Additionally, burstiness has been successfully used as a measure of similarityfor the analysis of weblogs (Vlachos et al. 2004).
• For applications such as fraud detection it is very critical to efficiently rec-ognize any anomalous activity (typically in the form of over-utilization ofresources). For example, burst detection techniques can be fruitfully utilizedfor spotting suspicious activities in large stock trading volumes (Lerner andShasha 2003) or for identification of fraudulent phone activity (Nguyen andTjoa 2004).
• In natural sciences, researchers are also interested in unmasking burstybehavior in cosmic radiation, such as gamma-rays (Zhu and Shasha 2003)or sunspot activity, because such measurements can be used as evidence ofa forthcoming climatic change. As an example, it has been noted that thesolar variability greatly affects the earth’s climate and in fact a rise in thesunspot numbers, also suggests an increase in the northern hemisphere landtemperatures (Friss-Cristensen and Lassen 1991).
• In epidemiology and bio-terrorism, scientists are interested in the earlydetection of a disease outbreak. This may be indicated by the discoveryof a sudden increase in the number of illnesses or visits to the doctor withina certain geographic area (Widdowson et al. 2003; Wong et al. 2003; Sternand Lightfoot 1999).
• Finally, in medical sciences, discovery of burstiness in certain biometricmeasures may also suggest a health abnormality. For example, EEG burstpatterns can be a valid indication of brain dysfunction (Muthuswamy et al.

Correlating burst events on streaming stock market data 111
Network Data Weblog Sunspot
Fig. 1 Burst examples in time-series data
1999; Laeven et al. 2001). Additionally, in the field of biology andbioinformatics, scientists are interested in discovering and measuring genecoexpression, that is, genes that display similar patterns of expression. In thisfield, burstiness is typically encountered as ‘up-regulation’ and holds sub-stantial biological significance, because identification of coexpressed genesgives insight into functionally related groups of genes and proteins (Heyeret al. 1999).
Many recent works address the problem of burst detection (Zhu and Shasha2003; Kleinberg 2002; Shasha and Zhang 2005). However, in many disciplines,more effective knowledge discovery can be achieved by identifying correlatedbursts when monitoring multiple data sources. From a data-mining perspective,this task is more exciting and challenging, since it involves the identification ofburst ‘clusters’ and it can also aid the discovery of causal chains of burst events,which possibly occur across multiple data streams. Instances of the above prob-lems can be encountered in many financial and stock market applications, e.g.,for triggering fraud alarms. Additionally, it has also been shown that correla-tion of burst events can indicate useful connections on weblog data or even ononline search patterns (Vlachos et al. 2004; Liu et al. 2006).
Addressing the above issues, this paper presents a complete framework foreffective multi-stream burst correlation. Similar to (Vlachos et al. 2004), werepresent detected bursts as time intervals of their occurrence. We provide anew burst detection scheme, which is tailored for skewed distributions, such asthe financial data that we examine here. Additionally, we introduce a memory-based index structure for identification of overlapping bursts. The new indexstructure is based on the idea of containment-encoded intervals (CEIs), whichwere originally used for performing stabbing queries (Wu et al. 2004). Build-ing on the idea of encoded time intervals, we develop new search algorithmsthat can efficiently answer overlapping range queries. Moreover, we developan approach to incrementally maintain the index as more recent data val-ues are added. Using this new index structure we can achieve more than threeorders of magnitude better search performance for solving the problem of burstoverlap computation, compared to the B+tree solution proposed in (Vlachoset al. 2004). Our contributions are summarized as follows:
1. We elaborate on a flexible and robust method of burst extraction on skeweddistributions.
112 M. Vlachos et al.
2. We present a memory-based index structure that can store the identifiedburst regions of a sequence and perform very effective overlap estimationof burst regions.
3. Finally, we depict the real-time response of the proposed index and we dem-onstrate the intuitiveness of the matching results on financial stock data atthe NYSE.
The work presented here represents an expanded version of the work thatappears in (Vlachos et al. 2005). Additional sections include a thorough com-plexity analysis of the proposed indexing scheme, and a significantly expandedexperimental section which showcases better the index performance. The remain-der of the paper is structured as follows; in Sect. 2 we present an overview ofour framework. Section 3 deals with burst detection schemes for skewed distri-butions and with burst summarization strategies. In Sect. 4 we explain how toefficiently organize the extracted burst digests for facilitating their fast searchand we provide an analysis of the search algorithm. Empirical validation regard-ing the quality and the effectiveness of the proposed index is the focus of Sect. 5.Finally, Sect. 6 concludes the paper and instigates future directions of this work.
2 Problem formulation
Let us consider a database D, containing m time-series sequences of the formS = s1 . . . sn, si ∈ R. Fundamental is also the notion of a burst interval b =[tstart, tend), representing a time-span of a detected burst, with an inclusive leftendpoint and an exclusive right endpoint, where tstart, tend are integers andtstart < tend.
Between two burst intervals q, b one can define a time overlap operator ∩,such that:
q ∩ b =⎧⎨
⎩
0 if tendq ≤ tstart
b0 if tstart
q ≥ tebmin(tend
q , tendb ) − max(tstart
q , tstartb ) otherwise
We dissect the burst correlation problem into the following steps:
(i) Burst identification on sequences residing in a database D. The burstdetection process will return for each sequence A a set of burst intervalsBs = {b1, . . . , bk}, of different cardinality k for every sequence. The setcontaining all burst intervals of database D, is denoted as BD.
(ii) Organization of BD in a CEI-Overlap index I.(iii) Discovery of overlapping bursts with a query Q given index I, where Q
is also a set of burst intervals: Q = {q1, . . . ql}. The output of the indexwill be a set of intervals V = {v1, . . . , vr}, vj ∈ BD such that:
∑
i
∑
j
qi ∩ vj �= 0
Correlating burst events on streaming stock market data 113
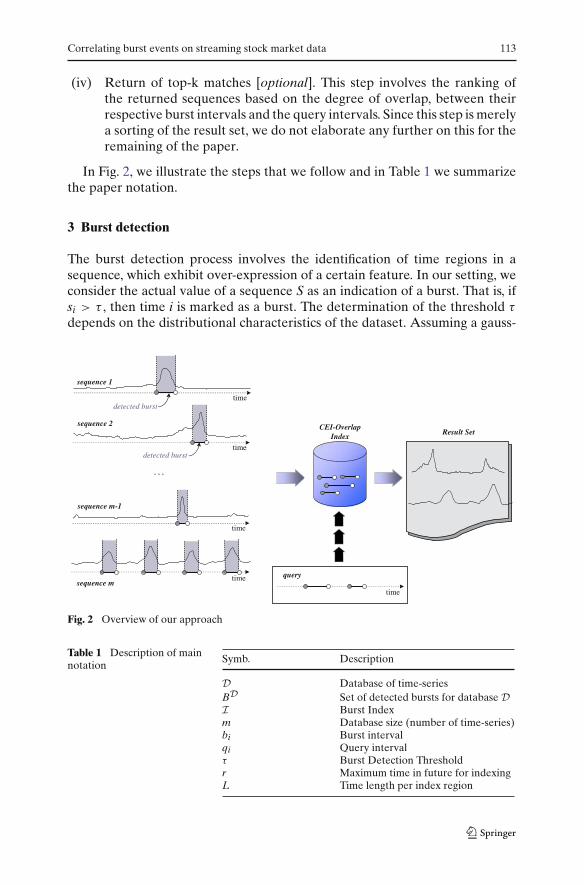
(iv) Return of top-k matches [optional]. This step involves the ranking ofthe returned sequences based on the degree of overlap, between theirrespective burst intervals and the query intervals. Since this step is merelya sorting of the result set, we do not elaborate any further on this for theremaining of the paper.
In Fig. 2, we illustrate the steps that we follow and in Table 1 we summarizethe paper notation.
3 Burst detection
The burst detection process involves the identification of time regions in asequence, which exhibit over-expression of a certain feature. In our setting, weconsider the actual value of a sequence S as an indication of a burst. That is, ifsi > τ , then time i is marked as a burst. The determination of the threshold τ
depends on the distributional characteristics of the dataset. Assuming a gauss-
Fig. 2 Overview of our approach
Table 1 Description of mainnotation
Symb. Description
D Database of time-seriesBD Set of detected bursts for database DI Burst Indexm Database size (number of time-series)bi Burst intervalqi Query intervalτ Burst Detection Thresholdr Maximum time in future for indexingL Time length per index region
114 M. Vlachos et al.
ian data distribution τ could be set as the mean value µ plus three times thestandard deviation.
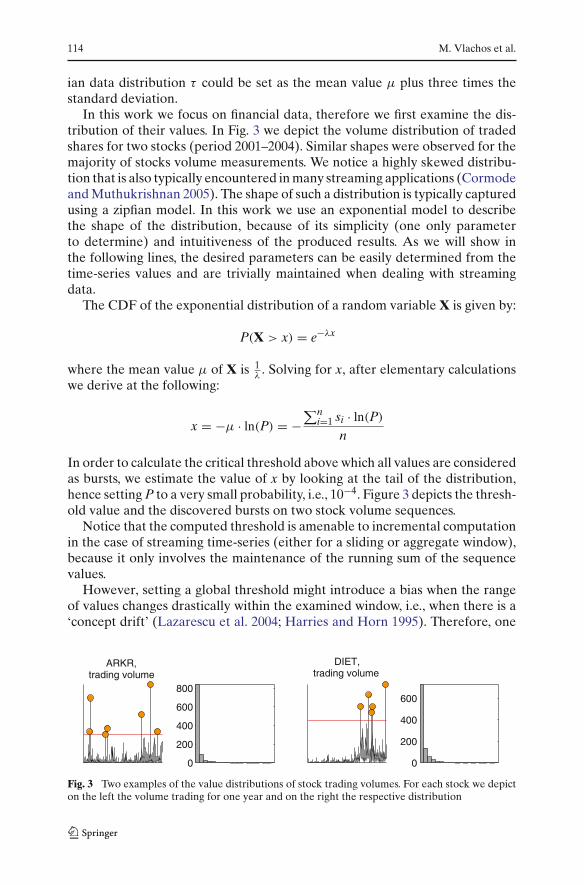
In this work we focus on financial data, therefore we first examine the dis-tribution of their values. In Fig. 3 we depict the volume distribution of tradedshares for two stocks (period 2001–2004). Similar shapes were observed for themajority of stocks volume measurements. We notice a highly skewed distribu-tion that is also typically encountered in many streaming applications (Cormodeand Muthukrishnan 2005). The shape of such a distribution is typically capturedusing a zipfian model. In this work we use an exponential model to describethe shape of the distribution, because of its simplicity (one only parameterto determine) and intuitiveness of the produced results. As we will show inthe following lines, the desired parameters can be easily determined from thetime-series values and are trivially maintained when dealing with streamingdata.
The CDF of the exponential distribution of a random variable X is given by:
P(X > x) = e−λx
where the mean value µ of X is 1λ
. Solving for x, after elementary calculationswe derive at the following:
x = −µ · ln(P) = −∑n
i=1 si · ln(P)
n
In order to calculate the critical threshold above which all values are consideredas bursts, we estimate the value of x by looking at the tail of the distribution,hence setting P to a very small probability, i.e., 10−4. Figure 3 depicts the thresh-old value and the discovered bursts on two stock volume sequences.
Notice that the computed threshold is amenable to incremental computationin the case of streaming time-series (either for a sliding or aggregate window),because it only involves the maintenance of the running sum of the sequencevalues.
However, setting a global threshold might introduce a bias when the rangeof values changes drastically within the examined window, i.e., when there is a‘concept drift’ (Lazarescu et al. 2004; Harries and Horn 1995). Therefore, one
ARKR,trading volume
0
200
400
600
800
DIET,trading volume
0
200
400
600
Fig. 3 Two examples of the value distributions of stock trading volumes. For each stock we depicton the left the volume trading for one year and on the right the respective distribution

Correlating burst events on streaming stock market data 115
200 400 600 800 1000
DIET (stock volume), variable threshold
Fig. 4 Variable threshold using overlapping subwindows
can compute a variable threshold, dividing the examined data into overlappingpartitions. The distribution in each partition still remains highly skewed andcan be estimated by the exponential distribution, due to the self similar natureof financial data (Lux 1996; Turiel and Perez-Vicente 2003). An example of themodified threshold (for the second stock of Fig. 3) is shown in Fig. 4, where thelength of the partition is 200 and the overlap is 100. At the overlapping part,the threshold is set as the average threshold calculated by the two consecutivewindows. We observe that in this case we can also detect the smaller burst pat-terns that were overshadowed by the high threshold value of the whole window(notice that a similar algorithm can be utilized for streaming sequences).
After the bursts of a sequence are marked, each identified burst is tran-scribed into a burst record. Consecutive burst points are compacted into a burstinterval, represented by its start and end position in time, such as [m, n), m < n.Burst points at time m are therefore represented by an interval [m, m + 1).In what follows, we will explicate how these burst regions can be organizedinto an efficient index structure. Notice that in this work we focused primarilyon the skewed distributions that are prevalent on financial data. For differentapplications other definitions of bursts (such as the ones in Shasha and Zhang(2005) and Kleinberg (2002)) might be more appropriate. However, as long asthe detected bursts are eventually transcribed into intervals, the index that willshortly be described, is directly applicable without any modifications.
4 Index structure
For the fast identification of overlapping burst intervals,1 we adapt the notionof containment-encoded-intervals (CEI’s), which were originally utilized foranswering stabbing queries (Wu et al. 2004) (CEI-stab). In this work we pres-ent the CEI-Overlap index, which shares a similar structure with CEI-Stab. Weintroduce a new efficient search technique for identifying overlapping burstsregions. Moreover, we present an effective approach for handling the nonstopprogress of time.
1 For the remainder of the paper, “burst regions” and “burst intervals” will be used interchangeably.

116 M. Vlachos et al.
32=L 32=L 32=L 32=L
1
13121110
98
7654
32
1415
Fig. 5 Example of containment-encoded intervals and their ID labeling
4.1 Building a CEI-Overlap index
There are two kinds of intervals in CEI-Overlap indexing: (a) burst intervalsand (b) virtual construct intervals. Burst intervals are identified as described insect. 3. The notion of virtual construct intervals is also introduced for facilitat-ing the decomposition of burst intervals and for enabling the effective searchoperations. As noted before, burst intervals are represented by their start andend position in time and the query search regions are also expressed similarly.
Figure 5 shows an example of containment-encoded intervals and their localID labeling. Assume that the burst intervals to be indexed cover a time-spanbetween [0, r).2 First, this range is partitioned into r/L segments of length L,denoted as SSi, where i = 0, 1, . . . , (r/L − 1), L = 2k, and k is an integer. Notethat r is assumed to be a multiple of L. In general, the longer the average lengthof burst regions is, the larger L should be (Wu et al. 2004). Segment SSi containstime interval [iL, (i+1)L). Segment boundaries can be treated as guiding posts.Then, 2L−1 CEI’s are defined for each segment as follows: (a) Define one CEIof length L, containing the entire segment; (b) Recursively define 2 CEIs bydividing a CEI into two halves until the length is one. For example, there areone CEI of length eight, two CEIs of length four, four CEI’s of length two andeight CEIs of length one in Fig. 5.
These 2L − 1 CEI’s are defined to have containment relationships amongthem. Every unit-length CEI is contained by a CEI of size 2, which is in turncontained by a CEI of size 4,. . . and so on. The labeling of CEI’s is encoded withcontainment relationships. The ID of a CEI has two parts: the segment ID andthe local ID. The local ID assignment follows the labeling of a perfect binary tree.The global unique ID for a CEI in segment SSi, where i = 0, 1, · · · , (r/L) − 1, issimply computed as l + 2iL, where l is the local ID. The local ID of the parent
2 Section 4.3 will describe how to handle the issue of choosing an appropriate r as time continuesto advance nonstop.

Correlating burst events on streaming stock market data 117
x xx
x x x
burst intervals
CEI’s
xx
CEI-based burst index
1b
4b3b2b
1c
2c 3c
7c6c5c4c
1c
7c6c5c4c3c2c
1b
4b
3b
3b
2b
2b
decomposition
time
kL 2=
2L-1
Fig. 6 Example of CEI-Overlap indexing
of a CEI with local ID l is �l/2�, and it can be efficiently computed by a logicalright shift by 1 bit.
To insert a burst interval, it is first decomposed into one or more CEIs,then its ID is inserted into the ID lists associated with the decomposed CEIs.The CEI index maintains a set of burst ID lists, one for each CEI. Figure 6shows an example of a CEI-Overlap index. It shows the decomposition of fourburst intervals: b1, b2, b3 and b4 within a specific segment containing CEI’s ofc1, . . . , c7. b1 completely covers the segment, and its ID is inserted into c1. b2lies within the segment and is decomposed into c5 and c6, the largest CEI’s thatcan be used for decomposition. b3 also resides within the segment, but its rightendpoint coincides with a guiding post. As a result, we can use c3, instead of c7and c8 for decomposition. Similarly, c2 is used to decompose b4. Burst IDs areinserted into the ID lists associated with the decomposed CEIs.
4.2 Identification of overlapping burst regions
To identify overlapping burst regions, we must first find the overlapping CEIs.One simple approach is to divide the input interval into multiple unit-sizedCEIs and perform a point search for each of the unit-sized CEIs using the CEI-Stab search algorithm. However, replicate elimination is required to removeredundant overlapping CEIs. Figure 7 shows an example of identifying CEIsoverlapping with an input interval. There are 9 unique overlapping CEIs. Usingthe point search algorithm of the CEI-Stab index (Wu et al. 2004), there will be16 overlapping CEIs, four from each upward-pointing dotted arrow. Seven ofthem are replicates. There are four replicates of c1, and two duplicates each ofc2, c3, c5 and c6, respectively, if we use the point search algorithm of CEI-Stabfor searching overlap CEI’s.
118 M. Vlachos et al.
input query burst
1c
2c
4c5c 6c
7c
14c13c12c
11c10c9c8c
15c
3c
CEI’s
CEI’s overlapping withQuery burst
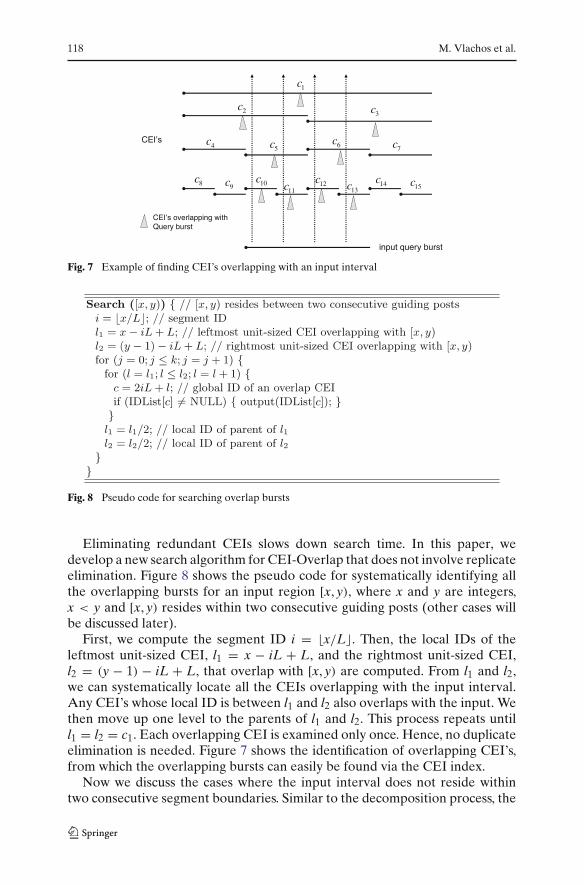
Fig. 7 Example of finding CEI’s overlapping with an input interval
Fig. 8 Pseudo code for searching overlap bursts
Eliminating redundant CEIs slows down search time. In this paper, wedevelop a new search algorithm for CEI-Overlap that does not involve replicateelimination. Figure 8 shows the pseudo code for systematically identifying allthe overlapping bursts for an input region [x, y), where x and y are integers,x < y and [x, y) resides within two consecutive guiding posts (other cases willbe discussed later).
First, we compute the segment ID i = �x/L�. Then, the local IDs of theleftmost unit-sized CEI, l1 = x − iL + L, and the rightmost unit-sized CEI,l2 = (y − 1) − iL + L, that overlap with [x, y) are computed. From l1 and l2,we can systematically locate all the CEIs overlapping with the input interval.Any CEI’s whose local ID is between l1 and l2 also overlaps with the input. Wethen move up one level to the parents of l1 and l2. This process repeats untill1 = l2 = c1. Each overlapping CEI is examined only once. Hence, no duplicateelimination is needed. Figure 7 shows the identification of overlapping CEI’s,from which the overlapping bursts can easily be found via the CEI index.
Now we discuss the cases where the input interval does not reside withintwo consecutive segment boundaries. Similar to the decomposition process, the

Correlating burst events on streaming stock market data 119
input interval can be divided along the segment boundaries. Any remnant canuse the search algorithm described in Fig. 8. The full segment, if any, has all the2L − 1 CEIs within that segment as the overlapping CEI’s.
In contrast to CEI-Stab (Wu et al. 2004), there might be duplicate burst IDs inthe search results of CEI-Overlap. Note that, even though the search algorithmof CEI-Overlap has no duplicate in overlapping CEIs, it might return duplicatesin overlapping burst IDs. This is because a burst can be decomposed into oneor more CEI’s and more than one of them can overlap with an input interval.To efficiently eliminate these duplicates, the burst ID lists are maintained sothat the IDs are sorted within individual ID lists. During search, instead ofreporting all the burst IDs within each overlapping CEI one CEI at a time, wefirst locate all the overlapping CEI’s. Then, the multiple ID lists associated withthese CEI’s are merged to report the search result. During the merge process,duplicates can be efficiently eliminated.
4.3 Incrementally maintaining the index
Since time continues to advance nonstop, no matter what initial [0, r) is chosen,current time will exceed at some point the maximal range r. Selecting a larger to cover a time-span deep in the future is not a good approach because theindex storage cost will increase (Wu et al. 2004). A better approach is to choosean r larger than the maximum window of burst regions at the moment, and tokeep two indexes in memory, similar to the double-buffering concept. Morespecifically, we start with [0, r). When time passes r, we create another index for[r, 2r). When time passes 2r, we create an index for [2r, 3r), but the index for[0, r) will be likely not needed any more and can be discarded or flushed intodisk. Using this approach no false dismissals are introduced, since any burstinterval covering two regions can be divided along the region boundary andindexed or searched accordingly.
4.4 Discussion and limitations
Before proceeding in analyzing the theoretical performance of the search algo-rithm, we identify several issues that can be of practical interest on real systemimplementations of the CEI-overlap index.
First, CEI-overlap indexing is designed for fast insertions and fast searchoperations, but not for fast deletions. To delete a burst interval from the index,we first decompose it into a set of CEIs. For each decomposed CEI, we thensequentially scan the associated ID list to remove the burst ID, which on aver-age is less efficient than an insertion. For the application of burst correlationsthat we are considering in this work, there are no deletions involved, thereforeperformance is not compromised. Second, the storage cost of the CEI-overlapindexing can be large if r is large, especially in the case when we need to store alarge amount of burst intervals. A simple but effective solution for this scenario,

120 M. Vlachos et al.
would be to partition the burst intervals and build a separate CEI-overlap indexfor each partition.
4.5 Complexity of the overlap search algorithm
Here, we analyze the complexity of the overlap search algorithm described inFig. 8. We show that it has an average case complexity of O(L), with a constantfactor of 2
3 , and a worst case complexity of (2L − 1), when the entire CEI’sin the segment need to be examined. In contrast, the simple CEI-Stab searchalgorithm has a complexity of O(L log(L)), where there are (log(L) + 1) CEIsstabbed by each unit-length CEI (see Fig. 7).
We derive a closed-form formula for the average number of CEI’s visitedfor all possible input intervals that are completely inside the same segment,the same as in Fig. 8. The complexity for input intervals that cross at leastone guiding post can be similarly derived. For any segment of length L = 2k,
there is a 1-to-1 mapping between the(
2k
2
)
distinct pairs of unit-length CEIs
and all the input intervals that fall completely inside the segment. We sum upthe numbers of CEIs examined by all the pairs to get the average. We makethe following definitions before establishing recurrence relation equations andderiving closed-form formulas.
Definition 1 Let Nn denote the number of nodes and Fn denote the number ofleaf nodes in a perfect binary tree with (n + 1) levels.
Fn and Nn are easy to obtain since they are general properties of a perfectbinary tree. For example, we have F1 = 2, F2 = 4 and Fn = 2n. Similarly, wehave N1 = 3, N2 = 7, and Nn = 2n+1 − 1.
Definition 2 If we pick any pair of leaf nodes, or unit-length CEIs with local IDsof x and y, from a perfect binary tree to form an input query interval, there isa unique minimal sub-tree that includes all the leaf nodes with IDs from x to y,and all the ancestors of these leaf nodes. Let Bn denote the sum of sizes of all theminimal sub-trees for all possible pairs of leaf nodes in a perfect binary tree with(n + 1) levels.
As an example, Fig. 9(a) shows the case of n = 1, where the tree in the box onthe left includes only 1 distinct pair of leaf nodes, or unit-length CEIs. There isonly one minimal sub-tree on the right. The solid edges form a sub-tree whosenumber of nodes contributes to the total sum. Hence, we have B1 = 3. Figure9(b) shows the case of n = 2, where the tree in the box on the left includes
four leaf nodes, and thus(
42
)
= 6 distinct pairs of leaf nodes, as represented
by the six horizontal lines. The numbers above the individual lines denote thecorresponding contributing amounts to B2, respectively. On the right, we onlyshow two of the six trees with solid edges detailing the contributing CEIs to B2.

Correlating burst events on streaming stock market data 121
46
46
75
4 5
(b) B2 = 4+6+7+5+6+4=32
3 3
(a) B1 = 3
Fig. 9 Examples for B1 and B2
(c) A2 = 7+6+4+3 = 20
(b) A1 = 3 + 2 = 5
(a) A0 = 1
(d) Reverse definition for A1
Fig. 10 Examples for A0, A1, and A2
Our goal is to calculate Bk/
(2k
2
)
, where k = log(L). In order to establish a
recurrence relation for Bk, we need to define an auxiliary term Ak. This termaccounts the cases where the input intervals cross an imaginary vertical linepassing the root of a perfect binary tree with (k + 1) levels.
Definition 3 Let Tm denote a perfect binary tree with (m+1) levels. We define Amas the sum of all the minimal sub-tree nodes in Tm that cover those input intervalswith one endpoint chosen from the leaf nodes of Tm and the other endpoint fixedat one point outside of Tm on the right or the left.
As an example, Fig. 10(a) shows the case of m = 0, where clearly A0 = 1.Figure 10(b) shows the case of m = 1, where the fixed point is on the right ofT1. There are two leaf nodes in T1 to contribute to the total sum of A1, which isfive. Figure 10(d) shows an alternative definition for A1 where the fixed pointis on the left of T1. Figure 10(c) shows the case of m = 2, where there are four
122 M. Vlachos et al.
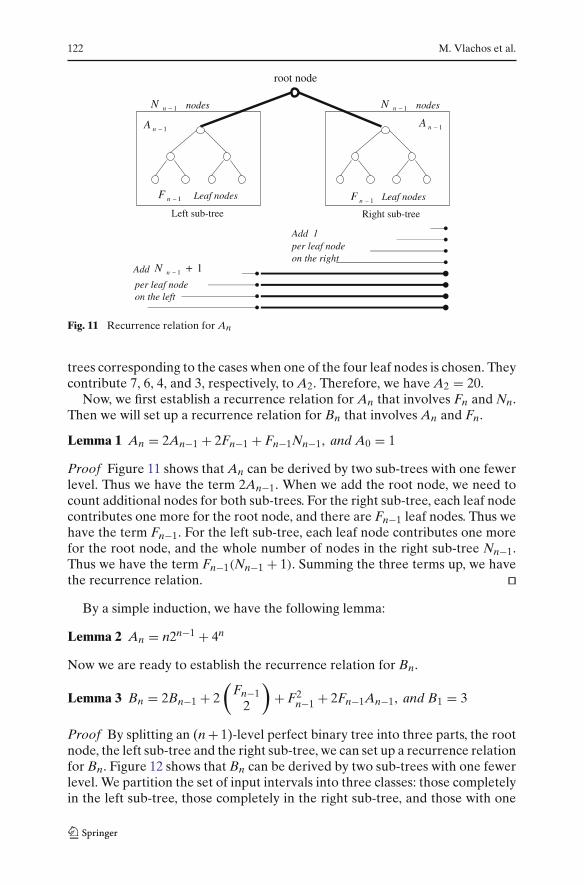
Fig. 11 Recurrence relation for An
trees corresponding to the cases when one of the four leaf nodes is chosen. Theycontribute 7, 6, 4, and 3, respectively, to A2. Therefore, we have A2 = 20.
Now, we first establish a recurrence relation for An that involves Fn and Nn.Then we will set up a recurrence relation for Bn that involves An and Fn.
Lemma 1 An = 2An−1 + 2Fn−1 + Fn−1Nn−1, and A0 = 1
Proof Figure 11 shows that An can be derived by two sub-trees with one fewerlevel. Thus we have the term 2An−1. When we add the root node, we need tocount additional nodes for both sub-trees. For the right sub-tree, each leaf nodecontributes one more for the root node, and there are Fn−1 leaf nodes. Thus wehave the term Fn−1. For the left sub-tree, each leaf node contributes one morefor the root node, and the whole number of nodes in the right sub-tree Nn−1.Thus we have the term Fn−1(Nn−1 + 1). Summing the three terms up, we havethe recurrence relation. �
By a simple induction, we have the following lemma:
Lemma 2 An = n2n−1 + 4n
Now we are ready to establish the recurrence relation for Bn.
Lemma 3 Bn = 2Bn−1 + 2(
Fn−12
)
+ F2n−1 + 2Fn−1An−1, and B1 = 3
Proof By splitting an (n + 1)-level perfect binary tree into three parts, the rootnode, the left sub-tree and the right sub-tree, we can set up a recurrence relationfor Bn. Figure 12 shows that Bn can be derived by two sub-trees with one fewerlevel. We partition the set of input intervals into three classes: those completelyin the left sub-tree, those completely in the right sub-tree, and those with one

Correlating burst events on streaming stock market data 123
Fig. 12 Recurrence relation for Bn
endpoint in the left sub-tree and the other endpoint in the right sub-tree. Theroot should be counted once for every input interval in the first two classes, andhence we have the first two terms. The third term F2
n−1 is due to the cross prod-uct of the An−1’s in the two sub-trees, which has 1-to-1 relation with the thirdclass of the input intervals. Each pair of sub-trees (one from the left sub-treeand one from the right sub-tree) in the cross product and the root node forma unique (n + 1)-level sub-tree. There are F2
n−1 in the third class, where eachshould contribute 1 (the root node) to the count Bn. The last term is trickier. Wefirst look at the left sub-tree, and the right sub-tree is similarly done (thus theproduct term 2). For every sub-tree that contributes to An−1, it will contributeto the final sum by Fn−1 since there are Fn−1 sub-trees from the right sub-tree.Hence we have the final term 2Fn−1An−1. �
As an example, Fig. 13 shows the case of B3, where 6 is added into B2 =4 + 6 + 7 + 5 + 6 + 4 for the left and right sub-trees, respectively. Thus we havethe amount 2 · (32+6) = 76. There is a cross product that includes pairs of inputintervals, where each pair of interval forms a cross sub-tree input interval. Thecross product can be nicely arranged into a matrix as shown in the lower partof Fig. 13. Therefore, we have the amount 2 · 4 · 20 + 42 = 176. Summing theseterms up, we have B3 = 76 + 176 = 252.
Theorem 1 Bn = 8n
3 + n4n
2 −(
n2 + 1
3
)2n, and B1 = 3
Proof By substituting Fn−1 and An−1 into the recurrence relation, and byinduction. �Theorem 2 The average number of covering CEIs per input interval within twoconsecutive guiding posts is O(L), with a constant factor of 2/3.
Proof The average number equals Bk/
(2k
2
)
≈ 8k/322k/2
= 23 · 2k = 2
3 L, for a
large k. �

124 M. Vlachos et al.
4+16+1
4+16+1
7+15+1
4+16+1
4+16+1
7+15+1
76
43
64
3
7
7+3+17+4+17+6+17+7+1
6+3+16+4+16+6+16+7+1
4+3+14+4+14+6+14+7+1
3+3+13+4+13+6+13+7+1
A2
A2
F22+2F2A2=176
+2
22
FB +
22
2
FB
Fig. 13 Recurrence relation example for B3
5 Experiments
We evaluate three parameters of the burst correlation scheme: (i) the qualityof results (is the burst correlation useful?), (ii) the index response time (howfast can we obtain the results?), (iii) indexing scheme comparison (how muchbetter is it than other approaches?).
5.1 Meaningfulness of results
Our first task is to assess the quality of results obtained through the burst cor-relation technique. To this end, we search for burst patterns in stock tradingvolumes during the days before and after the 9/11 attack, with the intention ofexamining our hypothesis that financial and/or travel related companies mighthave been affected by the events. We utilize historical stock data obtainedfrom finance.yahoo.com totaling 4793 stocks of length 1000, that cover theperiod between 2001 and 2004 (STOCK dataset). We use the trading volumeof each stock as the input for the burst detection algorithm. Our burst queryrange is set for the dates 9/7/2001–9/20/2001, while we should note that the stockmarket did not operate for the dates between 9/11 and 9/16.
Figures 14–17 illustrate examples of several affected stocks. The graphs dis-play the volume demand of the respective stocks, while on the top right wealso enclose the stock price movement for the whole month of September (theprice during the search range is depicted by thicker line). Stocks like ‘Priceline’or ‘Skywest’ which are related to traveling, experience a significant increasein selling demand, which leads to share depreciation when the stock market

Correlating burst events on streaming stock market data 125
2001 2002 2003 20040
0.5
1
1.5
2x 10
8 [09/07/01 −> 09/20/01], PCLN on 17−Sep−2001, volume 122969400
Sep Oct0
5
stock price
9/10 9/17
DetectedBurst
Fig. 14 Volume trading for the Priceline stock. We notice a large selling tendency, which resultsin a drop in the share price
2001 2002 2003 20040
2
4
6
x 106 [09/07/01 −> 09/20/01], SKYW on 17−Sep−2001, volume 7025900
Sep Oct0
20
40
stock price
9/10 9/17
DetectedBurst
Fig. 15 Volume trading for the Skywest stock
re-opens on Sep. 17. At the same time, the stock price of ‘NICE Systems’(a provider of air traffic control equipment) and ‘Mercury Computer Systems’(a manufacturer of defense electronics) depict a value increase (Figs. 16 and17).
More examples of stocks with burst trends in the stock demand within therequested time frame are presented in Table 2 and in Fig. 20. In general, we cannotice that stocks related to traveling, air transportation, banking and pharma-ceuticals, experience a strong depreciation. On the other hand, stocks relatedto defense electronics and (surprisingly) cinemas (e.g., Carmike) demonstratean appreciation in stock price, indicated by an accompanied surge in the buyingdemand.
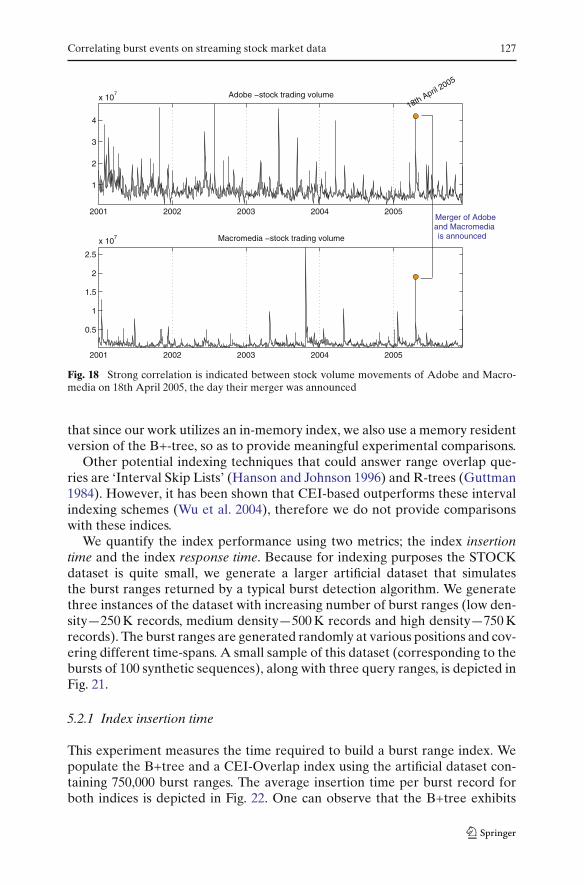
We demonstrate additional examples at different chronological ranges, withthe intention of indicating how powerful a tool burst correlation can be,especially for deducing connections and interactions between companies andevents. The first example is a strong correlated burst on 18th April 2005,between the stock volumes of Adobe (ADBE) and Macromedia (MACR)(Fig. 18). Both companies experience a large buying demand in their stocks.Through browsing of historical news events, one can realize that this was theannouncement day of the merger between the two companies. While the con-nection between these two incidents is simple, it serves as an indication of howburst correlation can be used for inferring the presence of significant newsevents.

126 M. Vlachos et al.
2001 2002 2003 20040
1
2
3x 10
6 [09/07/01 −> 09/20/01], NICE on 18−Sep−2001, volume 965300
Sep Oct12
14
16
stock price
9/10 9/17
DetectedBurst
Fig. 16 Volume trading for the stock of Nice Systems (provider of air traffic control systems).In this case, the high stock demand results in an increase of the share price
2001 2002 2003 20040
2
4
6
x 106 [09/07/01 −> 09/20/01], MRCY on 17−Sep−2001, volume 3822200
Sep Oct20
30
40
9/10 9/17Detected Burst
Fig. 17 Volume trading for the stock of Mercury Computer Systems (designer and manufac-turer of defense electronics). The stock price rose significantly on Sep-17-2001
Our second example is a bit more subtle. We try to examine which stockswere affected by the release of iPod Photo by Apple on 26th of October 2004.Besides the stock of Apple (AAPL), one can observe that there is also a largedemand for TTM Technologies (TTMI), which is a provider of printed circuitboards (Fig. 19). At first we cannot derive an immediate connection betweenthe two companies. However, by examining the 10-K annual report form ofTTM technologies, one can see that Apple is mentioned as one of the com-pany’s customers. This example serves a strong indication of how even indirectconnections can be deduced by careful examination of correlated burst events.
5.2 Index comparison
We compare the performance of the new CEI-Overlap indexing scheme withthe B+tree approach proposed in Vlachos et al. (2004). In that work the burstindex was used to identify similar high demands for a range of keywords posedat the MSN search engine. The B+-tree index employed there recorded the startand end positions of each burst range and performed an efficient identificationof bursts overlapping with the query range by noting the following: any burst boverlapping with the query burst q should have start time before the query endtime (tstart
b < tendq ) and end time after the query start time (tend
b > tstartq ). We note
Correlating burst events on streaming stock market data 127
2001 2002 2003 2004 2005
1
2
3
4
x 107 Adobe −stock trading volume
2001 2002 2003 2004 2005
0.5
1
1.5
2
2.5
x 107 Macromedia −stock trading volume
Merger of Adobe and Macromediais announced
18th April 2005
Fig. 18 Strong correlation is indicated between stock volume movements of Adobe and Macro-media on 18th April 2005, the day their merger was announced
that since our work utilizes an in-memory index, we also use a memory residentversion of the B+-tree, so as to provide meaningful experimental comparisons.
Other potential indexing techniques that could answer range overlap que-ries are ‘Interval Skip Lists’ (Hanson and Johnson 1996) and R-trees (Guttman1984). However, it has been shown that CEI-based outperforms these intervalindexing schemes (Wu et al. 2004), therefore we do not provide comparisonswith these indices.
We quantify the index performance using two metrics; the index insertiontime and the index response time. Because for indexing purposes the STOCKdataset is quite small, we generate a larger artificial dataset that simulatesthe burst ranges returned by a typical burst detection algorithm. We generatethree instances of the dataset with increasing number of burst ranges (low den-sity—250 K records, medium density—500 K records and high density—750 Krecords). The burst ranges are generated randomly at various positions and cov-ering different time-spans. A small sample of this dataset (corresponding to thebursts of 100 synthetic sequences), along with three query ranges, is depicted inFig. 21.
5.2.1 Index insertion time
This experiment measures the time required to build a burst range index. Wepopulate the B+tree and a CEI-Overlap index using the artificial dataset con-taining 750,000 burst ranges. The average insertion time per burst record forboth indices is depicted in Fig. 22. One can observe that the B+tree exhibits

128 M. Vlachos et al.
2001 2002 2003 2004
2
4
6
8
x 107 Apple −stock trading volume
2001 2002 2003 2004
1
2
3
4x 10
6 TTM Technologies −stock trading volume
26th Oct 2004
iPod Photois released
Fig. 19 A strong connection is suggested by correlated bursts of Apple and TTM Technologies,during the release of iPod Photo
Table 2 Some of the stocks that exhibited high trading volume after the events of 9/11/2001
Symbol Name (Description) Price
AVSR Avistar Communications 28% ↓BEAV Be Aerospace Inc 65% ↓CKEC Carmike cinemas 97% ↑EMCI EMC Insurance 4% ↑ESLT ELBIT Systems LTD (defense electronics supplier) 11% ↑FKKY Frankfort First Bancorp 0.3% ↑FLYI Atlantic Coast Airlines Holdings, Inc 35% ↓HAVNP Haven Capital Trust 4.5% ↓INSU Insituform Technologies (pipe tunneling) 38% ↓KEYN Keynote Systems (e-business services) 11% ↓LIFE Lifeline Systems (Medical Emergency Response) 1.5% ↓MAIR Mair Holdings (Airline Subsidiary) 36% ↓MRCY Mercury Computer Systems (defense electronics) 44.8% ↑NICE NICE Systems (Air traffic Control Systems) 25% ↑PCLN Priceline 60% ↓PRCS Praecis Pharmaceuticals 41% ↓SKYW Skywest Inc 61 % ↓STNR Steiner Leisure (Spa & Fitness Services) 51 % ↓STNJ Sterling Bank 2.5% ↓TSBK Timberland Bancorp, Inc. 7% ↓

Correlating burst events on streaming stock market data 129
2001 2002 2003 20040
5
10
15
x 105
Sep Oct1
2
3
9/10 9/17
Detected Burst
2001 2002 2003 20040
2
4
6
8x 10
6
Sep Oct0
10
20
9/10 9/17Detected Burst
2001 2002 2003 20040
0.5
1
1.5
2
x 106
Sep Oct0
1
2
9/10 9/17
Detected Burst
2001 2002 2003 20040
5
10
15
x 105
Sep Oct0.5
1
1.5
9/10 9/17
Detected Burst
2001 2002 2003 20040
2
4
6
x 105
Sep Oct12
14
16
9/10 9/17
Detected Burst
2001 2002 2003 20040
1
2
3
4
x 105
Sep Oct14
16
18
9/10 9/17
Detected Burst
2001 2002 2003 20040
1
2
3
x 104
Sep Oct16
16.5
17
9/10 9/17
Detected Burst
2001 2002 2003 20040
5
10
15
x 106
Sep Oct10
20
30
9/10 9/17
Detected Burst
2001 2002 2003 20040
5
10
x 104
Sep Oct15
15.5
16
9/10 9/17
Detected Burst
2001 2002 2003 20040
1
2
3
4
x 104
Sep Oct16
17
18
9/10 9/17
Detected Burst
2001 2002 2003 20040
5
10
15x 10
4
Sep Oct10.5
11
11.5
9/10
9/17
Detected Burst
2001 2002 2003 20040
2
4
6
x 106
Sep Oct10
20
30
9/10
9/17
Detected Burst
2001 2002 2003 20040
1
2
3
x 106
Sep Oct6
8
10
9/10
9/17
Detected Burst
2001 2002 2003 20040
0.5
1
1.5
2
2.5
x 106
Sep Oct5
10
9/10
9/17
Detected Burst
2001 2002 2003 20040
0.5
1
1.5
2
2.5
x 106
Sep Oct10
11
12
9/109/17
Detected Burst
2001 2002 2003 20040
2
4
6
x 104
Sep Oct9.5
10
10.5
9/109/17
Detected Burst
2001 2002 2003 20040
0.5
1
1.5
2
x 106
Sep Oct10
20
30
9/10
9/17Detected Burst
2001 2002 2003 20040
5
10
15
x 104
Sep Oct14
15
16
9/10
9/17Detected Burst
Fig. 20 More examples of affected stocks after the 9/11 events

130 M. Vlachos et al.
0 100 200 300 400 500 600 700 800 900 10000
20
40
60
80
100
Seq
uenc
e ID
Time
Q1 Q2 Q3
Fig. 21 Artificial dataset and example of three burst range queries
0 250000 500000 75000010
−2
10−1
100
101
Number of Bursts
Tim
e (s
ec)
Insertion Time
250K 500K 750K
3.5
4
4.5
5
x 106
Tim
e(se
c)
B+tree
B+TreeBurst Index
Fig. 22 Time required to populate the index. The B+tree insertion time is linear to the number ofobjects, while the CEI-index exhibits constant insertion time
a linear trend in the insertion time, with respect to the database objects al-ready inserted. This is more clearly indicated in the ‘zoom-in’ of the B+treeindex, which is also shown in top of the same figure. The linear performanceis to be expected, since any tree-based index incurs a balancing phase, whichincreases with the database size. On the contrary, the CEI-based index requiresapproximately constant insertion time, irrespective of the database size. Thisis largely attributed to the fast ‘hash-based’ mechanism of object insertion. Nobalancing is required, hence the insertion expense remains constant and in therange of 10–20 ms for the experiment of Fig. 22. In general, we note that theindex proposed in this paper exhibits three orders of magnitude faster insertiontime, compared to a B+tree based approach.

Correlating burst events on streaming stock market data 131
0 1 2 3 4 5 6 7x 10
4
102
103
104
105
106
107
Run
ning
Tim
e (m
icro
sec)
Answer set size
Low Density − 250K Objects
B+treeCEI−index
0 1 2 3 4 5 6 7x 10
4
102
103
104
105
106
107
Run
ning
Tim
e (m
icro
sec)
Answer set size
Medium Density − 500K Objects
B+treeCEI−index
0 1 2 3 4 5 6 7x 10
4
102
103
104
105
106
107
Run
ning
Tim
e (m
icro
sec)
Answer set size
High Density − 750K Objects
B+treeCEI−index
Fig. 23 B+Tree versus CEI-Overlap runtime
132 M. Vlachos et al.
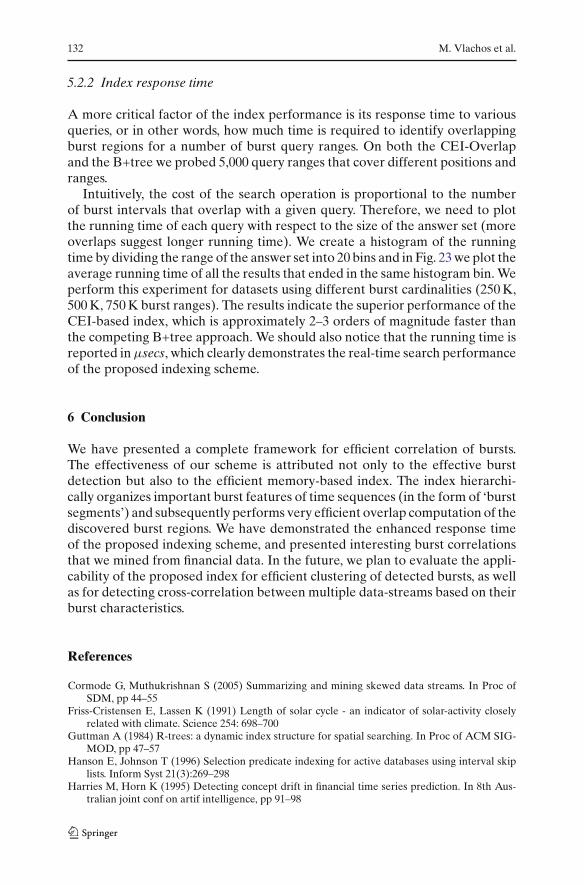
5.2.2 Index response time
A more critical factor of the index performance is its response time to variousqueries, or in other words, how much time is required to identify overlappingburst regions for a number of burst query ranges. On both the CEI-Overlapand the B+tree we probed 5,000 query ranges that cover different positions andranges.
Intuitively, the cost of the search operation is proportional to the numberof burst intervals that overlap with a given query. Therefore, we need to plotthe running time of each query with respect to the size of the answer set (moreoverlaps suggest longer running time). We create a histogram of the runningtime by dividing the range of the answer set into 20 bins and in Fig. 23 we plot theaverage running time of all the results that ended in the same histogram bin. Weperform this experiment for datasets using different burst cardinalities (250 K,500 K, 750 K burst ranges). The results indicate the superior performance of theCEI-based index, which is approximately 2–3 orders of magnitude faster thanthe competing B+tree approach. We should also notice that the running time isreported in µsecs, which clearly demonstrates the real-time search performanceof the proposed indexing scheme.
6 Conclusion
We have presented a complete framework for efficient correlation of bursts.The effectiveness of our scheme is attributed not only to the effective burstdetection but also to the efficient memory-based index. The index hierarchi-cally organizes important burst features of time sequences (in the form of ‘burstsegments’) and subsequently performs very efficient overlap computation of thediscovered burst regions. We have demonstrated the enhanced response timeof the proposed indexing scheme, and presented interesting burst correlationsthat we mined from financial data. In the future, we plan to evaluate the appli-cability of the proposed index for efficient clustering of detected bursts, as wellas for detecting cross-correlation between multiple data-streams based on theirburst characteristics.
References
Cormode G, Muthukrishnan S (2005) Summarizing and mining skewed data streams. In Proc ofSDM, pp 44–55
Friss-Cristensen E, Lassen K (1991) Length of solar cycle - an indicator of solar-activity closelyrelated with climate. Science 254: 698–700
Guttman A (1984) R-trees: a dynamic index structure for spatial searching. In Proc of ACM SIG-MOD, pp 47–57
Hanson E, Johnson T (1996) Selection predicate indexing for active databases using interval skiplists. Inform Syst 21(3):269–298
Harries M, Horn K (1995) Detecting concept drift in financial time series prediction. In 8th Aus-tralian joint conf on artif intelligence, pp 91–98

Correlating burst events on streaming stock market data 133
Heyer LJ, Kruglyak S, Yooseph S (1999) Exploring expression data: identification and analysis ofcoexpressed genes. Genome Res 9:11
Jiang H, Dovrolis C (2005) Why is the Internet traffic bursty in short (sub-RTT) time scales?. InProc of ACM SIGMETRICS, pp 241–252
Kleinberg J (2002) Bursty and hierarchical structure in streams. In Proc 8th ACM SIGKDD,pp 91–101
Laeven R, Gielen C, Coenen A, Rijn CV (2001) Principal component analysis and gabor transformin analysing burst-suppression EEG under propofol anaesthesia. In Sleep-wake research in theNetherlands, Vol 12, pp 75–80
Lazarescu M, Venkatesh S, Bui HH (2004) Using multiple windows to track concept drift. IntelData Analy J 8(1):29–59
Leland WE, Taqqu M S, Willinger W, Wilson DV (1993) On the self-similar nature of ethernettraffic. In Proc of ACM SIGCOMM, pp 183–193
Lerner A, Shasha D (2003) The virtues and challenges of ad hoc + streams querying in finance.IEEE Data Eng Bull:49–56
Liu B, Jones R, Klinkner K (2006) Measuring the meaning in time series clustering of text searchqueries. In Proc of ACM CIKM, pp 836–837
Lux T (1996) Long-term stochastic dependence in financial prices: evidence from the German StockMarket. Appl Econ Lett 3:701–706
Muthuswamy J, Sherman D, Thakor N (1999) Higher-order spectral analysis of burst patterns inEEG. IEEE Trans Biomed Eng 46(1):92–99
Nguyen T M, Tjoa A M (2004) Grid-based Mobile phone fraud detection system. In Proc of PAKMShasha D, Zhang X (2005) Better Burst Detection. NYU, Computer Science Dept, Technical report
TR2005-876Stern L, Lightfoot D (1999) Automated outbreak detection: a quantitative retrospective analysis.
Epidemiol Infect 122:103–110Scott SL (2004) A Bayesian paradigm for designing intrusion detection systems. Comput Stat Data
Anal (special issue on Computer Security) 45:69–83Turiel A, Perez-Vicente C (2003) Multifractal geometry in stock market time series. Physica A
322:629–649Vlachos M, Meek C, Vagena Z, Gunopulos D (2004) Identification of similarities, periodicities &
bursts for online search queries. In Proc of SIGMOD, pp 131–142Vlachos M, Wu K-L, Chen S-K, Yu P (2005) Fast burst correlation of financial data. In Proc of
PKDD, pp 368–379Widdowson M-A, Bosman A, van Straten E, Tinga M, Chaves S, van Eerden L, van Pelt W (2003)
Automated, laboratory-based system using the Internet for disease outbreak detection, theNetherlands. Emerg Infect Dis 9:9
Wong W-K, Moore A, Cooper G, Wagner M (2003) WSARE: what’s strange about recent events?.In J Urban Health 80:66–75
Wu K-L, Chen S-K, Yu P S (2004) Interval query indexing for efficient stream processing. In Procof ACM CIKM, pp 88–97
Zhu Y, Shasha D (2003) Efficient elastic burst detection in data streams. In Proc of SIGKDD,pp 336–345