Corrective Measures Evaluation Work Plan Tijeras Arroyo ...Tijeras Arroyo Groundwater Revision 0...
91
SANDIA REPORT SAND2004-6111 Unlimited Release Printed December 2004 Supersedes SAND2004-3247P Dated July 2004 Corrective Measures Evaluation Work Plan Tijeras Arroyo Groundwater Revision 0 Ryan A. Wymore Michael C. Koelsch Michael F. Skelly Sue S. Collins Prepared by Sandia National Laboratories Albuquerque, New Mexico 87185 and Livermore, California 94550 Sandia is a multiprogram laboratory operated by Sandia Corporation, a Lockheed Martin Company, for the United States Department of Energy’s National Nuclear Security Administration under Contract DE-AC04-94AL85000. Approved for public release; further dissemination unlimited.
Transcript of Corrective Measures Evaluation Work Plan Tijeras Arroyo ...Tijeras Arroyo Groundwater Revision 0...

SANDIA REPORT
SAND2004-6111 Unlimited Release Printed December 2004 Supersedes SAND2004-3247P Dated July 2004 Corrective Measures Evaluation Work Plan Tijeras Arroyo Groundwater Revision 0
Ryan A. Wymore Michael C. Koelsch Michael F. Skelly Sue S. Collins Prepared by Sandia National Laboratories Albuquerque, New Mexico 87185 and Livermore, California 94550 Sandia is a multiprogram laboratory operated by Sandia Corporation, a Lockheed Martin Company, for the United States Department of Energy’s National Nuclear Security Administration under Contract DE-AC04-94AL85000. Approved for public release; further dissemination unlimited.

Issued by Sandia National Laboratories, operated for the United States Department of Energy by Sandia Corporation.
NOTICE: This report was prepared as an account of work sponsored by an agency of the United States Government. Neither the United States Government, nor any agency thereof, nor any of their employees, nor any of their contractors, subcontractors, or their employees, make any warranty, express or implied, or assume any legal liability or responsibility for the accuracy, completeness, or usefulness of any information, apparatus, product, or process disclosed, or represent that its use would not infringe privately owned rights. Reference herein to any specific commercial product, process, or service by trade name, trademark, manufacturer, or otherwise, does not necessarily constitute or imply its endorsement, recommendation, or favoring by the United States Government, any agency thereof, or any of their contractors or subcontractors. The views and opinions expressed herein do not necessarily state or reflect those of the United States Government, any agency thereof, or any of their contractors. Printed in the United States of America. This report has been reproduced directly from the best available copy. Available to DOE and DOE contractors from
U.S. Department of Energy Office of Scientific and Technical Information P.O. Box 62 Oak Ridge, TN 37831 Telephone: (865) 576-8401 Facsimile: (865) 576-5728
E-Mail: [email protected] ordering: http://www.doe.gov/bridge
Available to the public from
U.S. Department of Commerce National Technical Information Service 5285 Port Royal Rd Springfield, VA 22161 Telephone: (800) 553-6847 Facsimile: (703) 605-6900
E-Mail: [email protected] order: http://www.ntis.gov/help/ordermethods.asp?loc=7-4-0#online
2

SAND2004-6111 Unlimited Release
Printed December 2004
Supersedes SAND2004-3247P Dated July 2004
Corrective Measures Evaluation Work Plan
Tijeras Arroyo Groundwater Revision 0
Sandia National Laboratories
P.O. Box 5800 Albuquerque, NM 87185-1182
Abstract
This document, which is prepared as directed by the Compliance Order on Consent (COOC) issued by the New Mexico Environment Department, outlines a process to evaluate remedial alternatives to identify a corrective measure for the Sandia National Laboratories Tijeras Arroyo Groundwater (TAG). The COOC provides guidance for implementation of a Corrective Measures Evaluation (CME) for TAG. This Work Plan documents an initial screening of remedial technologies and presents a list of possible remedial alternatives for those technologies that passed the screening. This Work Plan outlines the methods for evaluating these remedial alternatives and describes possible site-specific evaluation activities necessary to estimate remedy effectiveness and cost. These methods will be reported in the CME Report. This Work Plan outlines the CME Report, including key components and a description of the corrective measures process.
3

This page intentionally left blank.
4

Contents
1.0 INTRODUCTION .............................................................................................................11
1.1 Evaluation Purpose and Work Plan Organization .................................................11
1.1.1 SNL/NM Corrective Measures Evaluation Purpose ................................. 11
1.1.2 SNL/NM CME Work Plan Organization.................................................. 13
1.2 Tijeras Arroyo Groundwater Study Area...............................................................14
1.2.1 TAG Boundaries and Operational Description......................................... 14
1.2.2 Completed Site Characterization and Remedial Investigations................ 14
1.2.3 High-Performing Team............................................................................. 15
1.3 SNL/NM Area of Responsibility ...........................................................................15
1.3.1 SNL AOR Boundaries and Identification of Potential Sources................ 15
1.3.2 SNL Contributions to Site Characterization and Remedial Investigations15
1.3.3 SNL/NM AOR Corrective Measures Evaluation Project Team............... 18
1.4 Site Description......................................................................................................18
1.4.1 Hydrogeology ........................................................................................... 18
1.4.2 Contaminant Source Term ........................................................................ 23
1.4.3 Contaminant Transport through the Vadose Zone.................................... 26
1.4.4 Contaminant Distribution and Transport through the Perched System .... 27
1.4.5 Contaminant Distribution and Transport through the Regional Aquifer .. 30
1.5 Contaminants of Concern ......................................................................................30
2.0 CLEANUP GOALS, OBJECTIVES, AND REQUIREMENTS.......................................35
2.1 Performance Goals and Objectives........................................................................35
2.2 Compliance Goals and Objectives .........................................................................36
3.0 TECHNOLOGY IDENTIFICATION AND SCREENING ..............................................37
3.1. Threshold Criteria ..................................................................................................37
3.2 Technology Identification and Description ...........................................................39
3.2.1 Air Sparging.............................................................................................. 40
3.2.2 Groundwater Monitoring .......................................................................... 41
3.2.3 In Situ Bioremediation.............................................................................. 42
3.2.4 In Situ Chemical Oxidation ...................................................................... 44
3.2.5 In Situ Flushing......................................................................................... 45
3.2.6 Monitored Natural Attenuation................................................................. 46
3.2.7 Monolithic Confinement........................................................................... 48
5

3.2.8 Nanoscale Iron Injection ........................................................................... 49
3.2.9 Permeable Reactive Barriers..................................................................... 49
3.2.10 Phytoremediation ...................................................................................... 51
3.2.11 Pump and Treat ......................................................................................... 52
3.2.12 Soil Vapor Extraction ............................................................................... 53
3.2.13 Thermal Technologies .............................................................................. 54
3.3 Initial Technology Screening.................................................................................55
3.4 Initial Technology Screening Results ....................................................................58
3.4.1 Eliminated Technologies .......................................................................... 59
3.4.2 Applicable Technologies .......................................................................... 60
4.0 REMEDIAL ALTERNATIVE EVALUATION APPROACH.........................................61
5.0 REMEDIAL ALTERNATIVE EVALUATION PLAN....................................................63
5.1 Plan Description.....................................................................................................63
5.2 Evaluation Criteria .................................................................................................64
5.2.1 Threshold Criteria ..................................................................................... 64
5.2.2 Remedial Alternative Evaluation Criteria................................................. 65
5.3 Potential Activities for Remedy Evaluation ..........................................................68
5.3.1 Stage 1 – Paper Study ............................................................................... 68
5.3.2 Stage 2 – Numerical Modeling ................................................................. 69
5.3.3 Stage 3 – Laboratory Studies .................................................................... 69
5.3.4 Stage 4 – Field Scale Studies .................................................................... 70
6.0 CORRECTIVE MEASURES EVALUATION REPORT.................................................72
7.0 PROJECT MANAGEMENT PLAN .................................................................................73
7.1 Project Approach ...................................................................................................73
7.2 Organizational Structure ........................................................................................76
7.3 Schedule.................................................................................................................78
7.3.1 Description................................................................................................ 78
7.3.2 Deliverables .............................................................................................. 78
7.4 Budget ....................................................................................................................81
7.5 Assumptions...........................................................................................................81
7.5.1 General Assumptions ................................................................................ 81
7.5.2 Financial Assumptions.............................................................................. 82
7.5.3 Regulatory Assumptions........................................................................... 82
6

7.5.4 Project Scope Assumptions....................................................................... 82
7.5.5 Project Schedule and Planning Assumptions............................................ 83
7.5.6 Technical Assumptions............................................................................. 83
7.5.7 Public Involvement Assumptions ............................................................. 83
REFERENCES ..............................................................................................................................84
Appendix A—NMED Review Comment
7

Figures 1-1. Tijeras Arroyo Groundwater (TAG) SNL Corrective Measures Evaluation (CME) Area of
Responsibility. ..................................................................................................................... 12 1-2. Monitoring and Water Supply Wells and Potential Release Sites in the Area of
Responsibility. ..................................................................................................................... 16 1-3. TAG conceptual model. ....................................................................................................... 19 1-4. Potentiometric Surface Map for the Perched System in the Area of Responsibility,
March 2002. ......................................................................................................................... 24 1-5. Potentiometric Surface Map for the Regional Aquifer in the Area of Responsibility,
March 2002. ......................................................................................................................... 25 1-6. Distribution of TCE in the Area of Responsibility. ............................................................. 33 1-7. Distribution of Nitrate in the Area of Responsibility. ......................................................... 34 7-1. Logic diagram. ..................................................................................................................... 74 7-2. Project organizational chart. ................................................................................................ 77 7-3. TAG SNL/NM AOR schedule............................................................................................. 79
Tables
1-1. CME Work Plan crosswalk table......................................................................................... 13 1-2. Concern level for potential TCE and nitrate sources in the TAG SNL/NM AOR. ............. 17 1-3. TAG investigation historical timeline and key SNL/NM documents.................................. 20 1-4. Comparison of the perched system and the regional aquifer............................................... 22 1-5. SNL/NM historical and March/April 2002 COC concentrations in the perched system. ... 28 1-6. SNL/NM historical and March/April 2002 COC concentrations in the regional aquifer.... 31 1-7. COCs in the TAG SNL/NM AOR....................................................................................... 32 3-1. Technologies to be evaluated for remediation of VOCs and nitrate during the initial
screening process. ................................................................................................................ 40 3-2. Initial screening process for technologies using the COOC threshold criteria.................... 56 3-3. Perched system technical site-specific characteristics for evaluating the threshold criterion:
Attain Media Cleanup Standards. ........................................................................................ 57 5-1. Example remedial alternative evaluation using the COOC threshold criteria..................... 66 5-2. Example CME evaluation using the COOC corrective measures remedial alternative
evaluation criteria. ............................................................................................................... 66 7-1. Agency deliverable documents............................................................................................ 78 7-2. TAG CME budget................................................................................................................ 81
8

Acronyms AEHD Albuquerque Environmental Health Department
AOR Area of Responsibility
ARD anaerobic reductive dechlorination
ARG Ancestral Rio Grande
CME Corrective Measures Evaluation
COA City of Albuquerque
COC contaminant of concern
COOC Compliance Order on Consent
DNAPL dense non-aqueous phase liquid
DOE U.S. Department of Energy
EPA Environmental Protection Agency
ER Environmental Restoration
FY Fiscal Year
GWRTAC Ground-Water Remediation Technologies Analysis Center
HE High Explosives
HPT High-Performing Team
HWB Hazardous Waste Bureau
IRP Installation Restoration Program
ISB in situ bioremediation
ISCO in situ chemical oxidation
KAFB Kirtland Air Force Base
MCL maximum contaminant level
MNA monitored natural attenuation
NAPL non-aqueous phase liquid
NMED New Mexico Environment Department
OB Oversight Bureau
PCB polychlorinated biphenyl
PRB permeable reactive barrier
PRP potentially responsible party
RCRA Resource Conservation and Recovery Act
9
SNL/NM Sandia National Laboratories/New Mexico
SVOC semivolatile organic compound
SWMU Solid Waste Management Unit
TA technical area
TAG Tijeras Arroyo Groundwater
TCE trichloroethene
VA Veterans Administration
VOC volatile organic compound
10

11
1.0 INTRODUCTION
Sandia National Laboratories/New Mexico (SNL/NM), located on Kirtland Air Force Base (KAFB) south of Albuquerque, New Mexico (Figure 1-1), is owned and operated by the U.S. Department of Energy (DOE) and is co-operated by Sandia Corporation. This Corrective Measures Evaluation (CME) Work Plan has been developed under the direction of the Compliance Order on Consent (COOC) issued by the New Mexico Environment Department (NMED) (NMED 2004). This Work Plan was completed to comply with requirements set forth in the COOC (NMED 2004) and with the guidance of the Resource Conservation and Recovery Act (RCRA) Corrective Action Plan (EPA 1994). Section 1 presents the strategy for defining the historical Tijeras Arroyo Groundwater (TAG) area, the sub-area within the historical TAG boundaries for which SNL/NM has remediation responsibility, evaluation of potential sources within that sub-area, and the factors to be considered in determining fate and transport of contaminants. The remainder of the document is devoted to a screening of technologies to identify remedial alternatives that will undergo a more thorough evaluation during the CME process.
1.1 Evaluation Purpose and Work Plan Organization
Remediation responsibility within the historical TAG boundaries has been assigned to three separate potentially responsible parties (PRPs): SNL/NM, the City of Albuquerque (COA), and KAFB. As a result, it is necessary for each party to clearly define the purpose of their contribution to overall TAG remediation and to summarize their Work Plan organization. The purpose and organization sections below serve to set the basis for the activities that SNL/NM will address through their CME.
1.1.1 SNL/NM Corrective Measures Evaluation Purpose
The primary purpose of this document is to identify the specific area within the overall TAG boundary for which SNL/NM has remediation responsibility and to outline a process for evaluation of remedial alternatives within this area. The boundary of the area addressed in this CME is contained within the overall TAG boundaries (Figure 1-1). In order to clearly distinguish it from the overall TAG area, the area that this CME Work Plan addresses will be referred to as the SNL/NM Area of Responsibility (AOR). Another purpose of this CME Work Plan is to summarize prior work, identify potential source areas, and conduct a screening of technologies that results in identification of remedial alternatives that will undergo a full evaluation during the CME process. The Tijeras Arroyo Groundwater Investigation Work Plan (SNL/NM 2003a) and the recently finalized COOC (NMED 2004) both contain schedules that define dates for the delivery of plans and reports related to TAG. However, the schedules directed by these two documents do not coincide. The schedule submitted in the TAG Investigation Work Plan showed that an Investigation Report (signifying that characterization is complete) must be presented to NMED no later than September 30, 2005. All characterization work completed to support such a report (i.e., the specified six quarters of groundwater monitoring) was planned in order to meet this schedule.

Figure 1-1. Tijeras Arroyo Groundwater (TAG) SNL Corrective Measures Evaluation (CME) Area of Responsibility.
12

According to the COOC (NMED 2004), SNL/NM also is required to complete a CME Report for TAG by September 30, 2005. In order to meet this deadline, SNL/NM must submit this TAG CME Work Plan before the characterization requirements of the TAG Investigation Work Plan are to be fulfilled. In contrast, the COOC (NMED 2004) states that the CME process cannot proceed until characterization is sufficient. To meet the COOC (NMED 2004) schedule, SNL/NM therefore assumes that the existing groundwater data are sufficient to commence the CME process; indeed, the groundwater analytical data collected so far under the provisions of the TAG Investigation Work Plan are in agreement with historical concentrations. Therefore, the previously collected groundwater performance data must be used to initiate the CME process, which will be continuously verified and supplemented as NMED-approved compliance data become available. However, the more holistic investigation activities described in the TAG Investigation Work Plan that apply to the entire TAG area will continue to be fulfilled by all PRPs in parallel to the work described in this CME Work Plan.
1.1.2 SNL/NM CME Work Plan Organization
This document is organized according to guidance presented in the RCRA Corrective Action Plan (EPA 1994). Table 1-1 shows a crosswalk of the sections specified by the guidance in the Corrective Action Plan and the sections of this document. An important aspect of meeting the requirements of the COOC (NMED 2004), as well as being an objective of the CME, is evaluation of existing groundwater and subsurface data and compilation of that information into a current conceptual model to accurately reflect the nature and extent of contamination. The Tijeras Arroyo Groundwater Continuing Investigation Report (SNL/NM 2002) contains the most current and exhaustive data analysis and serves as the current conceptual model of the TAG study area, on the basis of which this CME will proceed. The current conceptual model will be updated based on the characterization being conducted under the provisions of the TAG Investigation Work Plan (SNL/NM 2003a). This update is currently scheduled for completion in September 2005.
Table 1-1. CME Work Plan crosswalk table.
RCRA Corrective Action Plan (EPA 1994) Guidance Section
TAG CME Work Plan (Section)
1.0 Purpose 1.0 Introduction
2.0 Cleanup Goals, Objectives and Requirements
2.0 Cleanup Goals, Objectives and Requirements
3.0 Technology Identification and Development
3.0 Technology Identification and Screening
4.0 Technology Evaluation Approach 4.0 Remedial Alternative Evaluation Approach
5.0 Technology Evaluation Plan 5.0 Remedial Alternative Evaluation Plan
6.0 Corrective Measures Study Report 6.0 Corrective Measures Evaluation Report
7.0 Project Management Plan 7.0 Project Management Plan
13
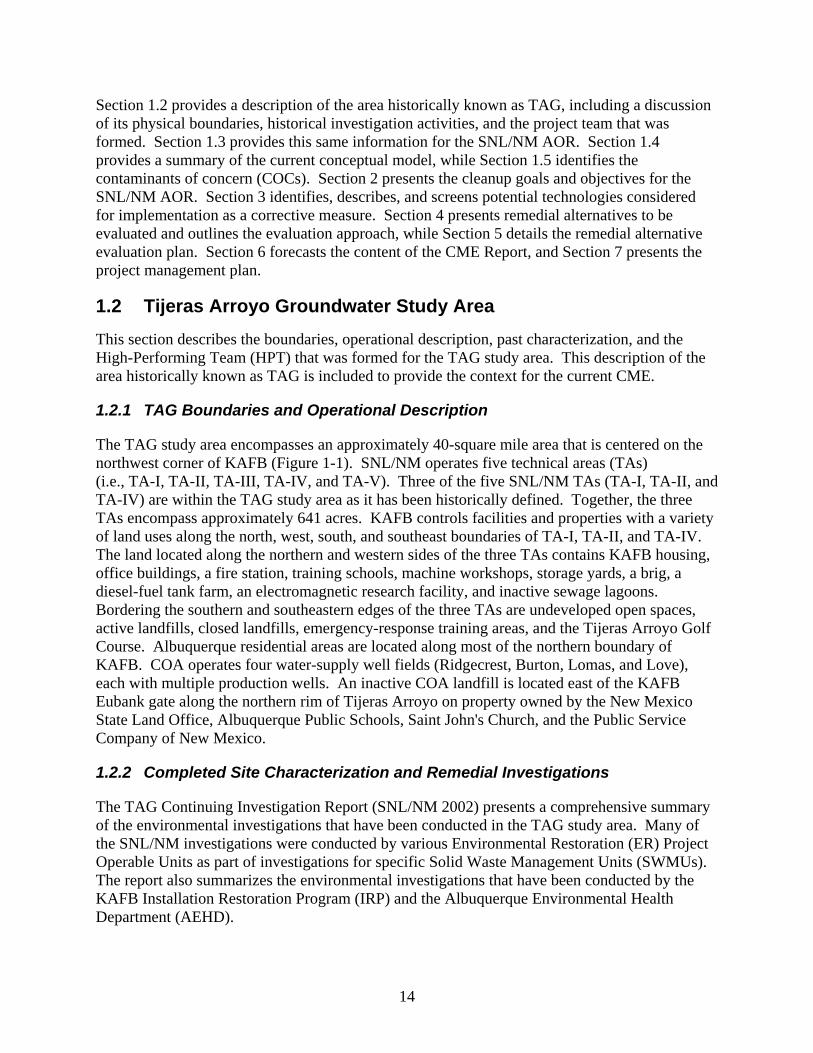
Section 1.2 provides a description of the area historically known as TAG, including a discussion of its physical boundaries, historical investigation activities, and the project team that was formed. Section 1.3 provides this same information for the SNL/NM AOR. Section 1.4 provides a summary of the current conceptual model, while Section 1.5 identifies the contaminants of concern (COCs). Section 2 presents the cleanup goals and objectives for the SNL/NM AOR. Section 3 identifies, describes, and screens potential technologies considered for implementation as a corrective measure. Section 4 presents remedial alternatives to be evaluated and outlines the evaluation approach, while Section 5 details the remedial alternative evaluation plan. Section 6 forecasts the content of the CME Report, and Section 7 presents the project management plan.
1.2 Tijeras Arroyo Groundwater Study Area
This section describes the boundaries, operational description, past characterization, and the High-Performing Team (HPT) that was formed for the TAG study area. This description of the area historically known as TAG is included to provide the context for the current CME.
1.2.1 TAG Boundaries and Operational Description
The TAG study area encompasses an approximately 40-square mile area that is centered on the northwest corner of KAFB (Figure 1-1). SNL/NM operates five technical areas (TAs) (i.e., TA-I, TA-II, TA-III, TA-IV, and TA-V). Three of the five SNL/NM TAs (TA-I, TA-II, and TA-IV) are within the TAG study area as it has been historically defined. Together, the three TAs encompass approximately 641 acres. KAFB controls facilities and properties with a variety of land uses along the north, west, south, and southeast boundaries of TA-I, TA-II, and TA-IV. The land located along the northern and western sides of the three TAs contains KAFB housing, office buildings, a fire station, training schools, machine workshops, storage yards, a brig, a diesel-fuel tank farm, an electromagnetic research facility, and inactive sewage lagoons. Bordering the southern and southeastern edges of the three TAs are undeveloped open spaces, active landfills, closed landfills, emergency-response training areas, and the Tijeras Arroyo Golf Course. Albuquerque residential areas are located along most of the northern boundary of KAFB. COA operates four water-supply well fields (Ridgecrest, Burton, Lomas, and Love), each with multiple production wells. An inactive COA landfill is located east of the KAFB Eubank gate along the northern rim of Tijeras Arroyo on property owned by the New Mexico State Land Office, Albuquerque Public Schools, Saint John's Church, and the Public Service Company of New Mexico.
1.2.2 Completed Site Characterization and Remedial Investigations
The TAG Continuing Investigation Report (SNL/NM 2002) presents a comprehensive summary of the environmental investigations that have been conducted in the TAG study area. Many of the SNL/NM investigations were conducted by various Environmental Restoration (ER) Project Operable Units as part of investigations for specific Solid Waste Management Units (SWMUs). The report also summarizes the environmental investigations that have been conducted by the KAFB Installation Restoration Program (IRP) and the Albuquerque Environmental Health Department (AEHD).
14

15
1.2.3 High-Performing Team
Based on the complex results of the individual investigations, the NMED and the PRPs saw the need to develop a unified approach to continuing groundwater investigations in the greater TAG study area. Starting in October 2000, meetings of the TAG HPT served as a forum for discussing groundwater issues. The format for the TAG Investigation Work Plan (SNL/NM 2003a) was developed and data gaps were identified during HPT meetings attended by representatives of the DOE, the SNL/NM ER Project, the KAFB IRP, the U.S. Environmental Protection Agency (EPA) Region 6, the NMED Hazardous Waste Bureau (HWB), the NMED Oversight Bureau (OB), the NMED Ground Water Quality Bureau, the Bernalillo County Environmental Health Department, and AEHD. The HPT served as the peer review panel for the preparation of the TAG Investigation Work Plan.
In June 2003, SNL/NM finalized the TAG Investigation Work Plan (SNL/NM 2003a), which presented the scope of work concerning the TAG investigation that is currently being conducted by SNL/NM, KAFB, and the COA. The TAG Investigation Work Plan described investigation activities and responsibilities as being shared by SNL/NM, KAFB, and the COA. The NMED approved the approach presented in the TAG Investigation Work Plan and the characterization requirements were implemented by the three PRPs (NMED 2003).
1.3 SNL/NM Area of Responsibility
The scope of this CME includes only part of what historically has been known as TAG. This section describes the newly defined SNL/NM AOR that will be the focus of this CME. This includes a description of the SNL/NM AOR boundaries, identification of potential sources, and an overview of the CME project team.
1.3.1 SNL AOR Boundaries and Identification of Potential Sources
For the purposes of this Work Plan, the SNL/NM AOR encompasses an approximately 2 square mile area in the north central portion of KAFB. The SNL/NM AOR is depicted in Figure 1-2. This study area is a portion of the larger TAG study area, as defined by the TAG Investigation Work Plan (SNL/NM 2003a). Figure 1-2 also illustrates the location of 13 potential release sites within the SNL/NM AOR, as well as COA and KAFB potential release sites that are considered to be outside of the SNL/NM AOR. All of these potential release sites were included in the scope of the greater TAG area investigations. For the SNL/NM AOR evaluation, only the 13 potential release sites within the AOR were considered.
1.3.2 SNL Contributions to Site Characterization and Remedial Investigations
The issue of whether a site should be considered a “potential source” of trichloroethene (TCE) and/or nitrate that could threaten groundwater was evaluated in the TAG Continuing Investigation Report (SNL/NM 2002) and the TAG Investigation Work Plan (SNL/NM 2003a). Criteria such as soil sampling, soil-vapor sampling, and regulatory status were used to screen-out (i.e., eliminate from further consideration) those sites that did not contain significant concentrations of either TCE or nitrate.

16
Figure 1-2. Monitoring and Water Supply Wells and Potential Release Sites in the Area of Responsibility.

The SNL/NM AOR has 13 SWMUs that are potential TCE sources and 9 SWMUs that are potential nitrate sources (Table 1-2). Based on the screening criteria, the potential SNL/NM AOR sources designated as a high concern level include:
TCE sites:
• SWMU 46 (Old Acid Waste Line Outfall)
• SWMU 165 (Building 901 Septic System), and
• SWMU 227 (Bunker 904 Outfall)
Nitrate sites:
• SWMU 46 (Old Acid Waste Line Outfall),
• SWMU 165 (Building 901 Septic System), and
• SWMU 187 (TA-I Sanitary Sewer System).
Table 1-2. Concern level for potential TCE and nitrate sources in the TAG SNL/NM AOR.
Potential Source TCE
ConcernaNitrate
Concerna
SNL/NM SWMU 46, Old Acid Waste Line Outfall High High
SNL/NM SWMU 48, Building 904 Septic System Medium Medium
SNL/NM SWMU 96, Storm Drain System Low None
SNL/NM SWMU 135, Building 906 Septic System Low Low
SNL/NM SWMU 136, Building 907 Septic System Medium Medium
SNL/NM SWMU 159, Building 935 Septic System Low Low
SNL/NM SWMU 165, Building 901 Septic System High High
SNL/NM SWMU 166, Building 919 Septic System Low Medium
SNL/NM SWMU 167, Building 940 Septic System Low Low
SNL/NM SWMU 187, TA-I Sanitary Sewer System Low High
SNL/NM SWMU 226, Old Acid Waste Line Outfall Low None
SNL/NM SWMU 227, Bunker 904 Outfall High None
SNL/NM SWMU 229, Storm Drain System Outfall (Bunker 904 Outfall)
Medium None
a. Screening criteria and results are presented in Tijeras Arroyo Groundwater Continuing Investigation Report (SNL/NM 2002).
17

1.3.3 SNL/NM AOR Corrective Measures Evaluation Project Team
The project team for the SNL/NM AOR is different than the HPT that was formed to investigate the greater TAG area in that only one of the three PRPs is included (SNL/NM). The project team is fully described in Section 7.2. At a high level, the primary functional entities of this project are the Sandia Groundwater Project Leader, NMED, the CME Implementation Team, Site Technical and Field Services, and the Technical Peer Review Panel.
1.4 Site Description
The TAG Continuing Investigation Report (SNL/NM 2002) contains the most current and exhaustive data analysis and serves as the current conceptual model of the TAG study area. Although the SNL/NM AOR is a subset of the greater TAG area, the conceptual model of the TAG area is relevant to the SNL/NM AOR and is summarized in this section.
1.4.1 Hydrogeology
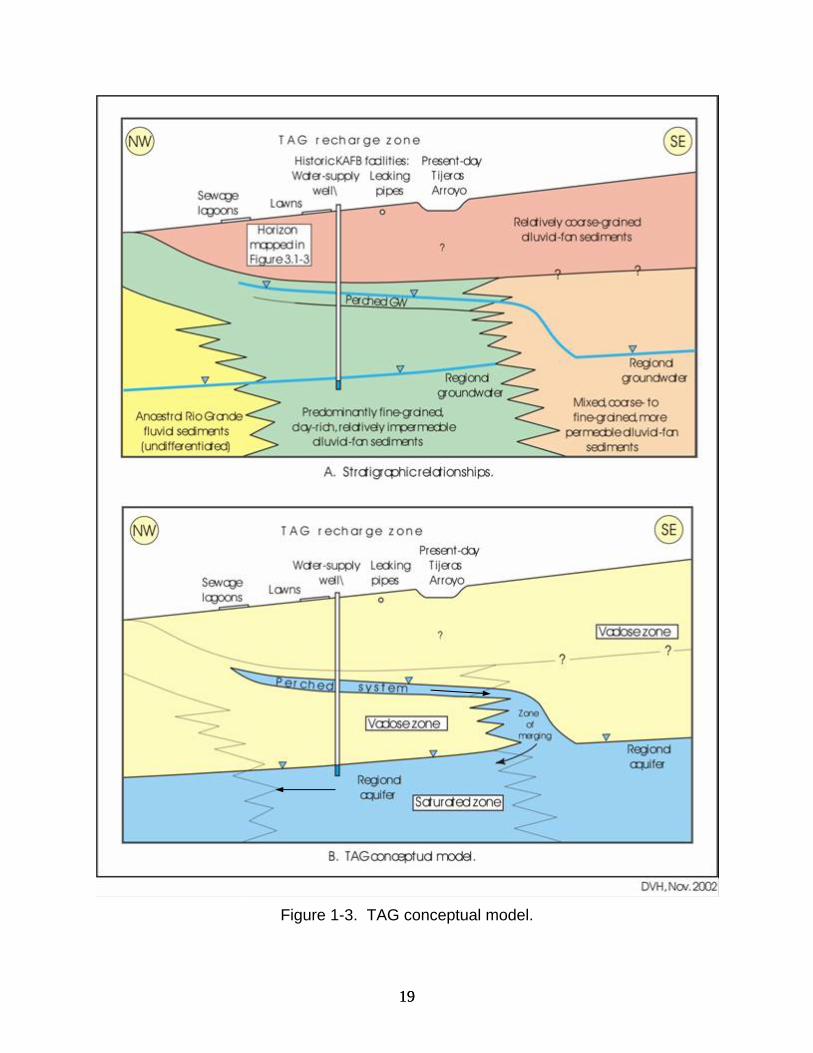
The TAG conceptual model (Figure 1-3), presented in the TAG Continuing Investigation Report (SNL/NM 2002) and the TAG Investigation Work Plan (SNL/NM 2003a), shows that the thickness of the vadose zone is reduced in the central portion of the TAG study area where the perched system is present. Discontinuous, yet overlapping multiple lenses of unsaturated alluvial-fan sediments serve as a perching horizon beneath the perched system in that area. The perched system is present at approximately 220 to 330 ft below ground surface (bgs), and the regional aquifer system is present at approximately 440 to 570 ft bgs. Groundwater in the perched system most likely merges with the regional aquifer southeast of Tijeras Arroyo where the alluvial-fan sediments are slightly more permeable.
Tijeras Arroyo is the most significant surface-water drainage feature on KAFB and trends southwest across KAFB and eventually drains into the Rio Grande, approximately 6 miles west of KAFB. Surface water flows in the arroyo several times per year as a result of storm events. The annual precipitation for the area, as measured at the Albuquerque International Sunport, is 8.2 in. (SNL/NM 2001a). During most rainfall events, rainfall quickly infiltrates into the soil in the study area. However, virtually all of the moisture subsequently undergoes evapotranspiration. Estimates of evapotranspiration for the KAFB area range from 95 to 99% of the annual rainfall (SNL/NM 1998).
The SNL/NM ER Project has conducted groundwater investigations since 1992 (Table 1-3). Many of these investigations were site-specific and were conducted in support of various SWMU assessments. KAFB has also completed numerous groundwater investigations in the TAG study area, with the results of these investigations presented elsewhere (SNL/NM 2002, 2003a). Understanding of the TAG hydrogeologic setting was developed based on a wide range of geologic and hydrologic studies (Table 1-3). This understanding is summarized below and is more thoroughly discussed in the TAG Continuing Investigation Report (SNL/NM 2002) and the TAG Investigation Work Plan (SNL/NM 2003a).
18
19
Figure 1-3. TAG conceptual model.
19

Table 1-3. TAG investigation historical timeline and key SNL/NM documents.
Month Year Event Reference
November–July
1992–1993
SNL/NM began investigation of TA-II groundwater. Perched system discovered as first wells installed (TA2-SW1-320, TA2-NW1-325, and TA2-NW1-595).
SNL/NM 1995
March–July 1994 Installed monitoring wells TA2-W-01 and TJA-2. SNL/NM 1995
October 1994 Analytical results from groundwater sampling first detected TCE.
SNL/NM 1996
August–September
1995 Installed monitoring wells WYO-1, WYO-2, and PGS-2.
SNL/NM 1996
November 1995 Analytical results from groundwater sampling first detected TCE above the EPA MCL of 5 µg/L.
SNL/NM 1996
November 1995 Installed monitoring well TA2-W-19. SNL/NM 1996
March 1996 The Sandia North (now Tijeras Arroyo) Groundwater Investigation Plan was submitted to the NMED/HWB.
SNL/NM 1996
September 1996 The Shallow Water-Bearing Zone Hydrologic Evaluation was prepared.
Wolford 1996
November 1996 Pressure transducer program initiated for select monitoring wells.
SNL/NM 1998
November–December
1996 Installed TA-II soil vapor monitoring wells: TA2-VW-20 and TA2-VW-21.
IT 1997
March 1997 Sandia North Geological Investigation Project Report prepared.
Fritts and Van Hart 1997
March–April
1997 Installed monitoring wells TAI-W-01, TA2-W-25. SNL/NM 1998
August 1997 Borehole geophysical investigation (electromagnetic induction, neutron and natural gamma) completed on 21 SNL/NM and KAFB monitoring wells.
SNL/NM 1998
January–February
1998 Installed monitoring wells TAI-W-02, TAI-W-03, TAI-W-06, TA2-W-24, TA2-W-26, and TA2-W-27.
SNL/NM 2000
March 1998 Fiscal Year 1997 Sandia North Groundwater Investigation Annual Report submitted to NMED/HWB.
SNL/NM 1998
August–December
1998 Installed monitoring wells TAI-W-04, TAI-W-05, TAI-W-07, TJA-3, TJA-4, and TJA-5.
SNL/NM 2000
May–June 1999 Colloidal borescope investigation performed on 18 SNL/NM and KAFB monitoring wells.
AquaVISION 1999
20

Table 1-3. (continued).
Month Year Event Reference
October 1999 Analysis of the USGS aeromagnetic survey performed to revise the interpretation SNL/KAFB area geologic structure.
Van Hart et al. 1999
February 2000 Regional Stratigraphic Framework for an Integrated Three-Dimensional Geologic Model of the Rio Grande Rift
Stone et al. 2000
June 2000 Fiscal Year 1998 Sandia North Groundwater Investigation Annual Report submitted to NMED/HWB.
SNL/NM 2000
October 2000 TAG HPT began regular meetings as a forum for discussing groundwater issues.
Copland 2002
December 2000 Project name changed to the Tijeras Arroyo Groundwater Investigation.
Collins 2000
January–March
2001 Installed monitoring wells TJA-6 and TJA-7, and soil vapor monitoring wells 46-VW-01, 46-VW-02, and 227-VW-01.
SNL/NM 2002
February 2001 Preliminary analytical model of the perched system prepared.
BGW 2001
June 2001 Geologic model of the perched system updated. Van Hart 2001
September 2002 Analytical model of the perched system finalized. BGW 2002
November 2002 Tijeras Arroyo Groundwater Continuing Investigation Report prepared.
SNL/NM 2002
June 2003 Subsurface geology interpretation of KAFB updated. Van Hart 2003
June 2003 Tijeras Arroyo Groundwater Investigation Work Plan prepared.
SNL/NM 2003a
The TAG study area is situated within the Albuquerque Basin, which is bounded on both the eastern and western margins by north-south trending faults related to the Rio Grande rift. The study area overlies the eastern margin of the Albuquerque Basin where the faults mostly trend parallel to the Sandia-Manzanita-Manzano mountain front. For the TAG SNL/NM AOR, the stratigraphic unit of greatest interest is the Upper Santa Fe Group, which is composed mostly of two interfingering lithofacies: an alluvial-fan lithofacies and a fluvial lithofacies. Both lithofacies are less than five million years old and are composed of unconsolidated to poorly-cemented gravel, sand, silt, and clay (Stone et al. 2000). The alluvial-fan lithofacies consists of poorly sorted piedmont-slope deposits derived from the Sandia, Manzanita, and Manzano Mountains east of the study area. Fine-grained units within the alluvial-fan lithofacies produce low-permeability zones that are capable of perching groundwater. The fluvial lithofacies is derived from the Ancestral Rio Grande (ARG) to the north and is typically well sorted and medium- to coarse-grained.
21
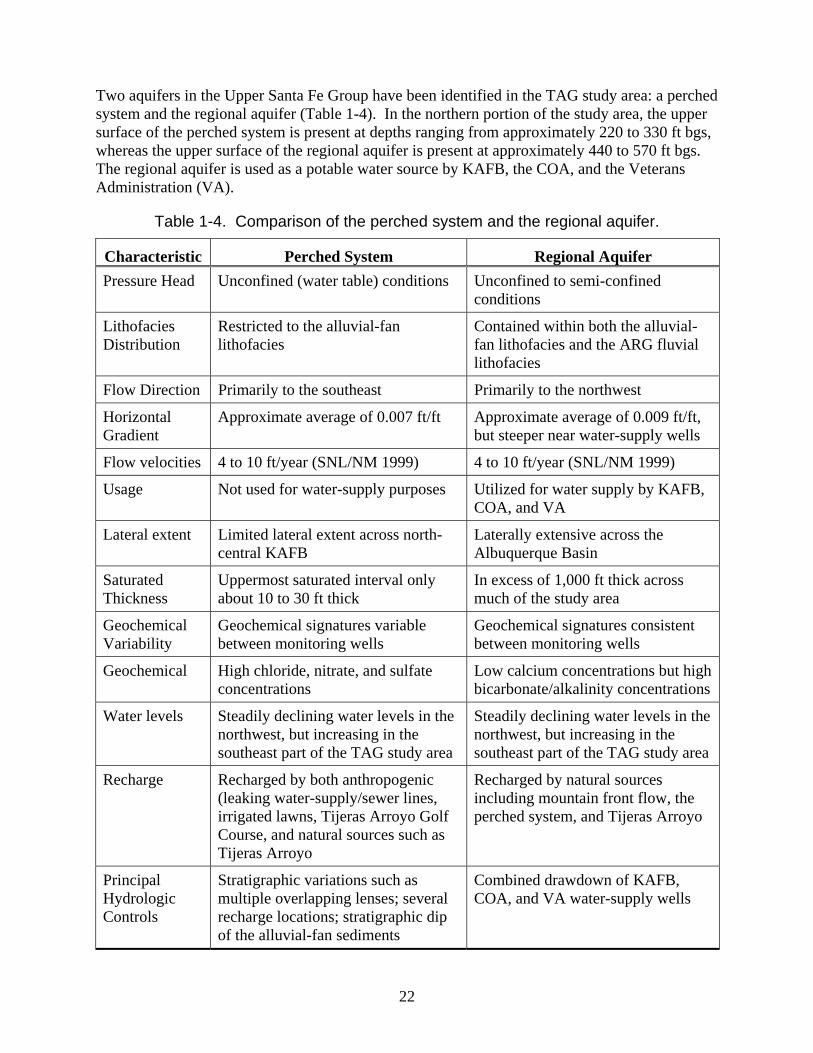
Two aquifers in the Upper Santa Fe Group have been identified in the TAG study area: a perched system and the regional aquifer (Table 1-4). In the northern portion of the study area, the upper surface of the perched system is present at depths ranging from approximately 220 to 330 ft bgs, whereas the upper surface of the regional aquifer is present at approximately 440 to 570 ft bgs. The regional aquifer is used as a potable water source by KAFB, the COA, and the Veterans Administration (VA).
Table 1-4. Comparison of the perched system and the regional aquifer.
Characteristic Perched System Regional Aquifer
Pressure Head Unconfined (water table) conditions Unconfined to semi-confined conditions
Lithofacies Distribution
Restricted to the alluvial-fan lithofacies
Contained within both the alluvial-fan lithofacies and the ARG fluvial lithofacies
Flow Direction Primarily to the southeast Primarily to the northwest
Horizontal Gradient
Approximate average of 0.007 ft/ft Approximate average of 0.009 ft/ft, but steeper near water-supply wells
Flow velocities 4 to 10 ft/year (SNL/NM 1999) 4 to 10 ft/year (SNL/NM 1999)
Usage Not used for water-supply purposes Utilized for water supply by KAFB, COA, and VA
Lateral extent Limited lateral extent across north-central KAFB
Laterally extensive across the Albuquerque Basin
Saturated Thickness
Uppermost saturated interval only about 10 to 30 ft thick
In excess of 1,000 ft thick across much of the study area
Geochemical Variability
Geochemical signatures variable between monitoring wells
Geochemical signatures consistent between monitoring wells
Geochemical High chloride, nitrate, and sulfate concentrations
Low calcium concentrations but high bicarbonate/alkalinity concentrations
Water levels Steadily declining water levels in the northwest, but increasing in the southeast part of the TAG study area
Steadily declining water levels in the northwest, but increasing in the southeast part of the TAG study area
Recharge Recharged by both anthropogenic (leaking water-supply/sewer lines, irrigated lawns, Tijeras Arroyo Golf Course, and natural sources such as Tijeras Arroyo
Recharged by natural sources including mountain front flow, the perched system, and Tijeras Arroyo
Principal Hydrologic Controls
Stratigraphic variations such as multiple overlapping lenses; several recharge locations; stratigraphic dip of the alluvial-fan sediments
Combined drawdown of KAFB, COA, and VA water-supply wells
22

23
The perched system is presently understood to cover approximately 3.5 square miles (Figure 1-4). Monitoring wells bound the perched system on the western and southern margins. The northern margin of the perched system has not been fully defined and may extend across the KAFB boundary north of the Wyoming Gate and east to the Eubank Landfill. A southeastern margin is not discernible because the perched system merges with the regional aquifer. The direction of groundwater flow in the perched system is inferred to be principally to the southeast, with a horizontal gradient of approximately 0.007 ft/ft. The vertical gradient is approximately 0.95 ft/ft over most of the perched system, and continuous vertical flow is suggested by the merging of the two groundwater systems to the southeast.
Historically, water levels in the perched system have fluctuated across the study area (SNL/NM 2002). In the vicinity of the sewage lagoons, water levels have been declining since 1987, apparently in response to the lagoons being removed from service. Conversely, water levels have increased southeast of Tijeras Arroyo.
The direction of groundwater flow in the regional aquifer is to the northwest toward the KAFB, COA, and VA water-supply wells (Figure 1-5). The horizontal gradient of the regional aquifer across the central portion of the study area is approximately 0.009 ft/ft with steeper gradients evident near the mountain front. Vertical flow gradients within the TAG study area have not been measured but are inferred to be downward, consistent with TA-III/V groundwater studies.
Historically, water levels in the regional aquifer have fluctuated across the study area (SNL/NM 2002). A line of demarcation between increasing water levels and declining water levels is evident along the eastern extent of the ARG-fluvial lithofacies, which coincidentally trends along Wyoming Boulevard. Declining water levels approaching 1.5 ft/year are apparently associated with the KAFB, COA, and VA water-supply wells. Increases in groundwater elevations of up to 1.8 ft/year in the southeast portion of the study area probably reflect recharge of the regional aquifer from the perched system, Tijeras Arroyo, the golf course, and the mountain front.
1.4.2 Contaminant Source Term
The SNL/NM ER Project, the KAFB IRP, and the AEHD have evaluated a variety of potentially contaminated sites. The TAG Continuing Investigation Report (SNL/NM 2002) and the TAG Investigation Work Plan (SNL/NM 2003a) present a comprehensive summary of the environmental investigations that have been conducted. Discussion of the environmental investigations conducted by the KAFB IRP and the AEHD are beyond the scope of this CME Work Plan.
As described in Section 1.3.2, three potential TCE and three potential nitrate sources were identified within the SNL/NM AOR. A brief description of each potential release site is included below:
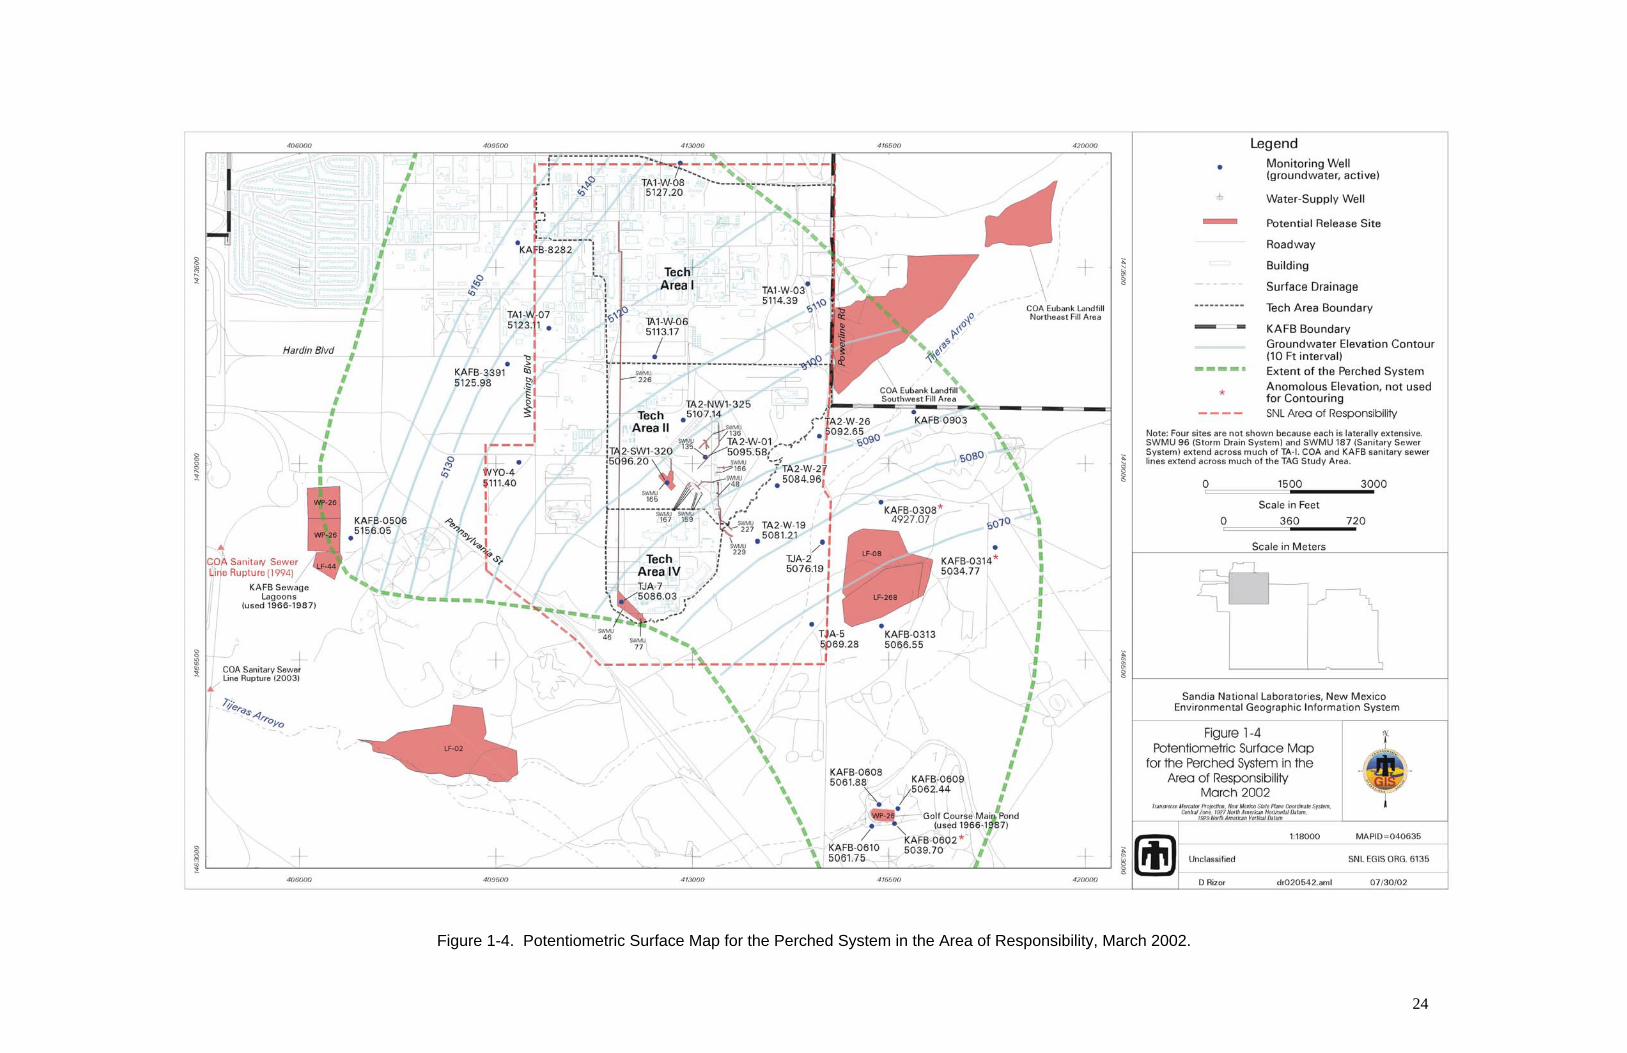
Figure 1-4. Potentiometric Surface Map for the Perched System in the Area of Responsibility, March 2002.
24

25
Figure 1-5. Potentiometric Surface Map for the Regional Aquifer in the Area of Responsibility, March 2002.
1. SWMU 46 (Old Acid Waste Line Outfall)– TCE and nitrate
• Estimated 1.3 billion gal of wastewater from six TA-I research/office buildings (839, 840, 841, 860, 863, and 892) discharged into the three outfall ditches at south end of SWMU 226. Possible TCE in wastewater. Septic water from possible cross-connects between the SWMU 226 waste line and sewer lines may have discharged at SWMU 46. In 2000, two soil-vapor monitor wells installed at SWMU 46; soil-vapor sampling conducted quarterly. Well 46-VW-01 located near waste-line outfall; sampling ports set at 50-ft intervals from 15 to 265 ft bgs; maximum TCE concentration to date of 46,000 parts per billion by volume (ppbv) from 115 ft bgs. Well 46-VW-02 located 900 ft farther southeast with sampling ports set at 50-ft intervals from 46 to 296 ft bgs; maximum TCE concentration to date of 650 ppbv from 96 ft bgs.
2. SWMU 227 (Bunker 904 Outfall) – TCE
• Wastewater from SWMU 48 discharged into outfall ditch at SWMU 227, likely only a fraction of the volume that was disposed to SWMU 46. Possible TCE and HE in wastewater. No significant contamination detected in soil samples. In 2000, soil vapor monitoring well 227-VW-01 installed with sampling ports set at 50-ft intervals from 25 ft to 225 ft below ground surface. Soil vapor sampling conducted quarterly with maximum TCE concentrations to date of 9500 ppbv at 225 ft.
3. SWMU 165 (Building 901 Septic System) – TCE and nitrate
• Leachfield connected to personnel shower/laundry facility (Building 901) and small research/machine shop Building 902. Possible TCE and high explosives (HE) in waste water. No significant contamination detected in soil samples. Groundwater samples from perched-system monitoring well TA2-SW1-320 have contained maximum TCE and nitrate concentrations of 3.9 µg/L and 44 mg/L, respectively.
4. SWMU 187 (TA-I Sanitary Sewer System) – nitrate
• Possibly leaking sewer lines and several cross-connects with wastewater lines. System connected to numerous research/office buildings in TA-I. No significant contamination detected in soil samples.
The contaminant distributions in both the vadose zone and the aquifer are fully described in Sections 1.4.3 through 1.4.5.
1.4.3 Contaminant Transport through the Vadose Zone
Soil vapor and soil samples collected from the vadose zone (land surface to the water table) during drilling operations and from the vapor monitoring network have indicated evidence of vapor-phase contaminants. However, no free-phase TCE products and no water-saturated core samples have been encountered in any of the soil samples collected from the boreholes. The original source of the TCE was the aqueous phase (i.e., wastewater), and the current vapor phase contaminants partitioned from the aqueous phase. All anthropogenic sources of recharge (i.e., wastewater) have been removed from service and no longer contribute water to the vadose zone.
26
27
The highest vapor phase TCE concentrations are currently understood to be present near SWMU 46 and SWMU 227. For SWMU 46, two multi-port soil vapor monitoring wells indicate that low to moderate TCE vapor concentrations exist near groundwater monitoring wells TJA-3 and TJA-7, with the highest concentration of 46,000 ppbv measured over 100 ft above the perched system water table. Concentrations immediately above the perched system water table have ranged from non-detect to less than 500 ppbv. Based on a screening-level Henry's law partitioning calculation, the groundwater concentration that would be in equilibrium with the observed TCE vapor concentration near the perched system water table would be <0.2 µg/L. This is consistent with the fact that the most recent TCE concentration measured in perched system monitoring well TJA-7 was reported as <0.5 µg/L.
For SWMU 227, a multi-port vapor monitoring well indicates that the highest TCE vapor concentration of 9,500 ppbv is present in the deepest sampling port, which is located 40 to 60 ft above the perched system water table. However, this concentration of vapor phase TCE would be in equilibrium with approximately 5 µg/L TCE using conservative assumptions (Skelly 2002). Perched system monitoring well TA2-W-19, located approximately 500 ft downgradient of SWMU 227 has had TCE concentrations of 3.77 – 4.54 µg/L during the July 2003/February 2004 sampling rounds, which is consistent with these predictions
Based on these soil vapor and groundwater data, a residual TCE vapor plume does exist beneath SWMU 227. The primary mechanism for transporting these contaminants to the aquifer would be through partitioning back into the aqueous phase of additional recharge that might move through the system. During operations at SWMU 227, a recharge mechanism did exist (i.e. the wastewater disposal) to transport TCE from the vapor phase to the groundwater, which may have caused the groundwater contamination that is currently observed at TA2-W-19. However, since wastewater disposals have ceased, no recharge mechanism currently exists, and it is unlikely that additional TCE mass will be transported to the aquifer. The latest observations in vapor well 227-VW-01 and in perched system monitoring well TA2-W-19 are consistent with this hypothesis.
Nitrate was present in sewage wastewater disposed to septic systems and sanitary sewer lines in the area. The nitrate was transported to the perched system water table by high volumes of wastewater disposed at the sites. Because nitrate is extremely soluble and cannot exist as a separate phase (i.e., vapor or non-aqueous phase liquid [NAPL]), and because no water-saturated core samples have been encountered in any of the soil samples collected from boreholes, a secondary source of anthropogenic nitrate contamination in the vadose zone does not exist.
1.4.4 Contaminant Distribution and Transport through the Perched System
Overall, the distribution of TCE is discontinuous across the perched system and does not indicate a single release site. Based upon the historic use of chlorinated solvents across SNL/NM and KAFB, the known extent of TCE in groundwater is probably associated with multiple releases of aqueous phase solvents and subsequent transport through the vadose zone.
Table 1-5 presents a summary of nitrate and TCE concentration data from the TAG SNL/NM AOR for wells completed in the perched system. The table shows both historical range as well as the March/April 2002 and the July 2003 through February 2004 data for each of the 14 wells.

Table 1-5. SNL/NM historical and March/April 2002 COC concentrations in the perched system.
28
Well ID
TCE Concentration
(µg/L) March/April
2002a
TCE Concentration
(µg/L) July 2003 -
February 2004b
TCE concentration
(µg/L) Historical
Range
Nitrate Concentration
(mg/L) March/April
2002a
Nitrate Concentration
(mg/L) July 2003 -
February 2004b
Nitrate Concentration
(mg/L) Historical
Range
TA1-W-03 <0.5 <0.36 No detections 7.2 2.09 – 7.3 2.09 – 11
TA1-W-06 <0.5 <0.36 – 0.438 0.23 - 0.6 3.5 2.59 – 3.30 0.84 - 5.3
TA1-W-07 <0.5 Not Sampledc No detections 3.2 Not Sampledc 1.1 - 7.6
TA1-W-08 <0.5 <0.36 No detections 7.8 6.25 – 7.35 6.25 – 11
TA2-NW1-325 <0.5 Not Sampledc <0.1 - 1.2 3.9 Not Sampledc 0.4 - 8.4
TA2-SW1-320 <0.5 <0.36 <0.1 - 3.9 26 22.4 – 25.0 0.33 – 44
TA2-W-01 0.52 J 1.29 – 1.96 0.1 – 2 5.7 4.5 – 5.70 3.1 – 29
TA2-W-19 <0.5 3.77 – 4.54 <0.4 - 6.2 8.8 9.2 – 10.4 3.8 – 44
TA2-W-26 7.5 1.56 –2.13 1.56 - 9.6 5.9 4.67 – 5.30 2.6 – 10
TA2-W-27 <0.5 <0.36 – 0.519 0.28 – 0.519 4.4 2.16 – 4.53 1.2 – 7.3
TJA-2 2.0 [1.6 BJ] 2.36 – 3.08 0.66 - 3.7 8.7 [9.3] 9.30 – 10.1 3.4 – 11
TJA-5 <0.5 Not Sampledc <0.4 - 1.6 10 Not Sampledc 4.1 – 14
TJA-7 <0.5 <0.36 – 1.46 <0.36 – 1.46 30 22.9 – 29.8 22.9 – 41
WYO-4 4.9 [5.3] 6.06 – 7.05 4 – 7.23 2.9 2.12 – 3.0 1.1 – 3.0
Maximum 7.5 7.05 9.6 30 29.8 44Notes: a The March/April 2002 sampling event used the low-flow sampling system. b The July 2003 through February 2004 sampling events used the Bennett pump system for well purging and sample collection.c Per the requirements of the TAG Investigation Work Plan (SNL/NM 2003a), these three wells have not been sampled since March/April 2002. Bold values represent concentrations that meet or exceed established MCLs.
B = analyte detected in blank sample [ ] = duplicate sample
J = estimated value
The March/April 2002 sampling event represents the most complete data set as well as the most recent data set that used the low-flow sampling system. The July 2003 through February 2004 data represents three sampling events with full data validation that comply with the requirements of the TAG Investigation Work Plan (SNL/NM 2003a). These three sampling events used the NMED-required Bennett pump system for well purging and sample collection but did not include all the SNL/NM wells in the AOR.
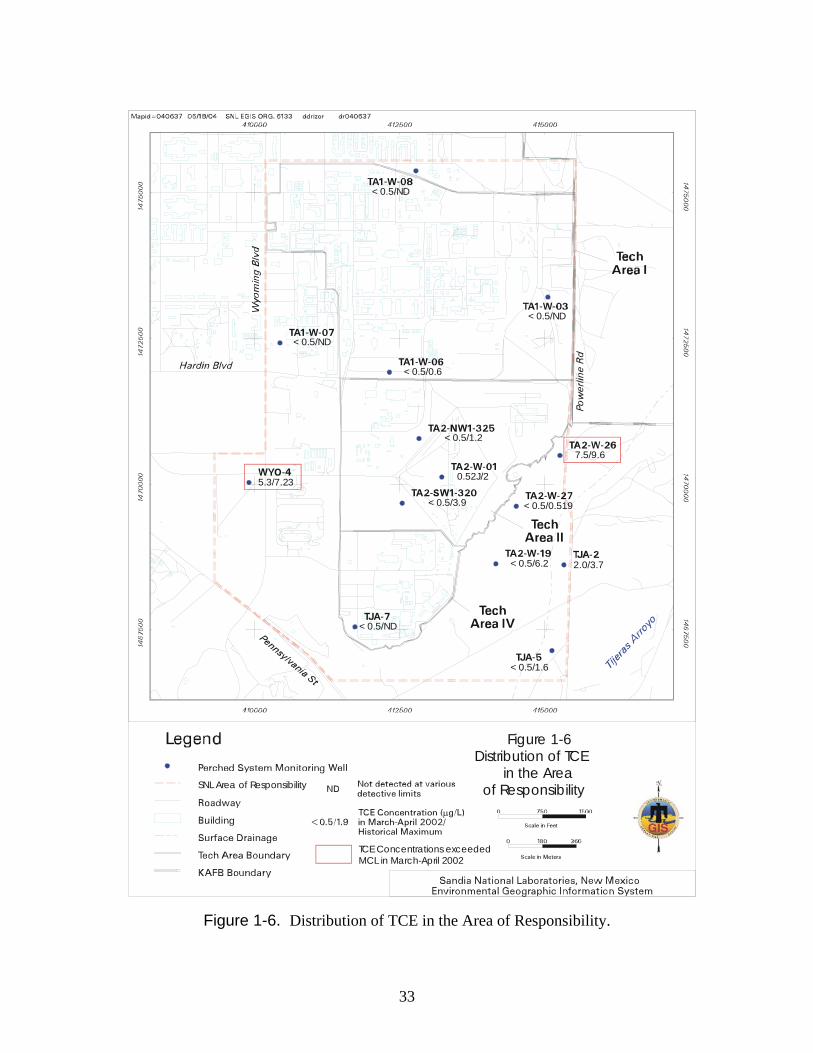
From Table 1-5, the maximum historical concentration of TCE in the perched system was 9.6 µg/L in Well TA2-W-26; only three SNL/NM wells have exceeded the maximum contaminant level (MCL) for TCE (TA2-W-19, TA2-W-26, and WYO-4). In the March/April 2002 groundwater sampling round, two of these three monitoring wells had TCE concentrations that exceeded 5 µg/L; Well TA2-W-26 had a concentration of 7.5 µg/L, while the duplicate samples at WYO-4 had TCE concentrations of 4.9 and 5.3 µg/L (refer to Figure 1-2 for well locations). In the three quarterly sampling events from July 2003 through February 2004, only WYO-4 had TCE concentrations exceeding 5 µg/L, ranging from 6.06 to 7.05 µg/L.
Well WYO-4 is an SNL/NM monitoring well that is located on KAFB property (Figure 1-2). Given that none of the SNL/NM potential release sites are near Well WYO-4 and that groundwater flow in the perched system is to the southeast, the TCE concentrations present in WYO-4 are considered to represent contamination from an upgradient KAFB source. Therefore, the TCE contamination present at this well is not considered to be within the scope of this CME. Table 1-5 also shows that the maximum historical concentration of nitrate in the perched system within the TAG SNL/NM AOR was 44 mg/L in Wells TA2-W-19 and TA2-SW1-320, and that a total of 9 SNL/NM wells have exceeded the MCL for nitrate during at least one sampling event. In March and April of 2002, two of the perched-system monitoring wells had nitrate concentrations that exceeded the MCL of 10 mg/L, with the highest concentration being 30 mg/L in Well TJA-7. In the three quarterly sampling events from July 2003 through February 2004, four of the perched-system wells had nitrate concentrations that exceeded 10 mg/L, with the highest concentration being 29.8 mg/L in well TJA-7. Overall, concentrations of nitrate in the perched system exceeding MCLs are scattered across the TAG study area.
According to KAFB-IRP terminology, the nitrate contamination in the perched system forms what is referred to as Plume 3 (MWH Americas, Inc., 2003). Plume 3, which is centered on monitoring well TA2-SW1-320, is located under the southwest portion of TA-II and may extend southward to TJA-7. Monitoring wells in the perched system that have nitrate concentrations below the MCL surround these wells. The plume is 0.3 miles long and 0.2 miles wide (MWH Americas, Inc., 2003) and is thought to emanate from SWMU 165, the Building 901 Septic System.
29
30
1.4.5 Contaminant Distribution and Transport through the Regional Aquifer
Table 1-6 presents a summary of nitrate and TCE concentration data from the TAG SNL/NM AOR for wells completed in the regional aquifer system. Overall, the regional aquifer monitoring wells have generally yielded no samples with detectable TCE concentrations except for a historic peak in TCE of 3.2 µg/L in Well PGS-2. At no time has an SNL/NM regional aquifer well exceeded the MCL for TCE. During March/April 2002, twelve SNL/NM regional-aquifer monitoring wells were sampled for TCE; none of the samples had detectable concentrations of TCE except for TJA-3 with 0.639 µg/L (an estimated value). The groundwater sample from merging-zone Well TJA-4 did not contain TCE. In the three quarterly sampling events from July 2003 through February 2004, ten SNL/NM regional aquifer monitoring wells were sampled for TCE; none of the samples had detectable concentrations of TCE.
Table 1-6 also shows that the maximum historical concentration of nitrate within the TAG SNL/NM AOR for wells completed in the regional aquifer system was 49 mg/L in merging zone well TJA-4. However, this is the only TAG SNL/NM AOR monitoring well that has ever had nitrate concentrations that exceed the MCL. During the March/April 2002 sampling round, TJA-4 had a nitrate concentration of 28 mg/L. In the three quarterly sampling events from July 2003 through February 2004, nitrate concentrations in TJA-4 ranged from 22.8 to 27.0 mg/L. The nitrate contamination in the regional aquifer southeast of TA-II forms what is referred to as Plume 4 (MWH Americas, Inc., 2003). Plume 4 is most likely responsible for the nitrate concentrations in TJA-4, a well completed in the zone of merging. The plume is 1.9 miles long and 1 mile wide and is associated with the active KAFB Landfill (MWH Americas, Inc., 2003).
1.5 Contaminants of Concern
In Section IV.C of the COOC (NMED 2004) issued to the DOE and SNL/NM, the NMED identified TAG as an area with groundwater contamination:
TAG is an approximately 8.0-square mile rectangular (3.25 miles × 2.5 miles) area located in the north central part of KAFB. Groundwater occurs in a perched system in addition to the regional system. The perched groundwater system is contaminated with TCE and nitrate at levels reaching 7.5 µg/L (MCL – 5.0 µg/L) and 30 mg/L (MCL – 10 mg/L), respectively. Nitrate has been detected in the regional aquifer at concentrations ranging as high as 18 mg/L.
It should be noted that the perched system TCE and nitrate concentrations reported in this section of the COOC (NMED 2004) were based on the March/April 2002 sampling round. Historical maximums across the entire 8.0-square mile TAG area in the perched system were 9.6 µg/L for TCE and 44 mg/L for nitrate. Also, the regional aquifer nitrate concentration of 18 mg/L nitrate appears to be from the March/April 2002 sampling round. However, a concentration of 28 mg/L was actually detected during this same round from wells TJA-4 and KAFB-0508. In addition, the historical maximum nitrate concentration in the regional aquifer was 49 mg/L.
The COCs in groundwater at TAG (TCE and nitrate) have been identified based on peak historical results as of April 2002. The EPA and State of New Mexico drinking water standard (MCL) for TCE is 5 µg/L. The EPA MCL and New Mexico MCL for nitrate is 10 mg/L. The scope of this CME Work Plan only includes the area defined as the SNL/NM AOR, as outlined in Figure 1-2.

Table 1-6. SNL/NM historical and March/April 2002 COC concentrations in the regional aquifer.
31
Well ID
TCE Concentration
(µg/L) March/April
2002a
TCE Concentration
(µg/L) July 2003 -
February 2004b
TCE Concentration
(µg/L) Historical Range
Nitrate Concentration
(mg/L) March/April
2002a
Nitrate Concentration
(mg/L) July 2003 -
February 2004b
Nitrate Concentration
(mg/L) Historical
Range
PGS-2 <0.5 <0.36 <0.16 – 3.2 0.9 0.628 – 0.89 0.4 – 7.2
TA1-W-01 <0.5 <0.36 No detections 2.3 2.23 – 2.50 0.79 - 4.4
TA1-W-02 <0.5 <0.36 No detections 1.0 0.921 – 1.00 0.921 - 3.5
TA1-W-04 <0.5 <0.36 No detections 2.0 1.3 – 1.7 1.3 – 3.8
TA1-W-05 <0.5 <0.36 No detections 1.2 0.967 – 1.06 0.79 - 3.4
TA2-NW1-595 <0.5 <0.36 No detections 3.3 1.85 – 3.40 0.53 - 5.9
TA2-W-24 <0.5 Not Sampledc No detections 2.8 Not Sampledc 1.4 - 4.4
TA2-W-25 <0.5 Not Sampledc No detections 2.1 Not Sampledc 1.4 – 3.7
TJA-3 0.639 J <0.36 <0.36 - 1.39 2.8 1.89 – 2.9 0.84 – 3.7
TJA-4 <0.5 <0.36 No detections 28 22.8 – 27.0 20 – 49
TJA-6 <0.5 <0.36 No detections 2.2 2.17 – 2.50 0.91 – 2.50
WYO-3 <0.5 <0.36 No detections 1.9 1.38 – 2.0 1.38 – 2.1
Maximum 0.639 J <0.36 3.2 28 27.0 49
Notes: a The March/April 2002 sampling event used the low-flow sampling system. b The July 2003 through February 2004 sampling events used the Bennett pump system for well purging and sample collection. c Per the requirements of the TAG Investigation Work Plan (SNL/NM 2003a), these three wells have not been sampled since March/April 2002. Bold values represent concentrations that meet or exceed established MCLs.
B = analyte detected in blank sample J = estimated value

Based on the data described above, both TCE and nitrate are considered COCs for the perched system (Table 1-7). In addition, because no AOR regional aquifer wells have exceeded MCLs for either TCE or nitrate, no COCs are defined for the regional aquifer. Therefore, this CME Work Plan will focus exclusively on TCE and nitrate contamination in the perched system. Figures 1-6 and 1-7 show the SNL/NM AOR wells with their reported TCE and nitrate concentrations from the March/April 2002 sampling round. The wells with concentrations that exceed MCLs during this sampling round are highlighted. These figures summarize the focus of this CME. Because the TCE contamination in well WYO-4 and the nitrate contamination in TJA-4 are attributable to KAFB releases, they are not considered to be within the scope of this CME.
Table 1-7. COCs in the TAG SNL/NM AOR.
Contaminant Maximum
Concentrations Federal Drinking Water Standard
(MCL)a
VOLATILE ORGANIC COMPOUNDS (Perched System)
Trichloroethene (TCE) 9.6 µg/Lc 5 µg/La
INORGANIC CHEMICAL (Perched System)
Nitrate (as nitrogen) 44 mg/Lc 10 mg/Lb
a. 40 CFR 141.61, “Maximum Contaminant Levels for Organic Contaminants” b. 40 CFR 141.62, “Maximum Contaminant Levels for Inorganic Contaminants” c. Maximum concentrations reported as of February 2004.
µg/L = micrograms per liter mg/L = milligrams per liter
32
33
Figure 1-6. Distribution of TCE in the Area of Responsibility.
< 0.5/ND
< 0.5/0.6
< 0.5/1.2
0.52J/2
< 0.5/3.9
5.3/7.23
< 0.5/ND
< 0.5/ND
7.5/9.6
< 0.5/0.519
< 0.5/6.2 2.0/3.7
< 0.5/1.6
< 0.5/ND
µ
SNL Area of Responsibility
TCE Concentrations exceededMCL in March-April 2002
Figure 1-6 Distribution of TCE in the Area of Responsibility
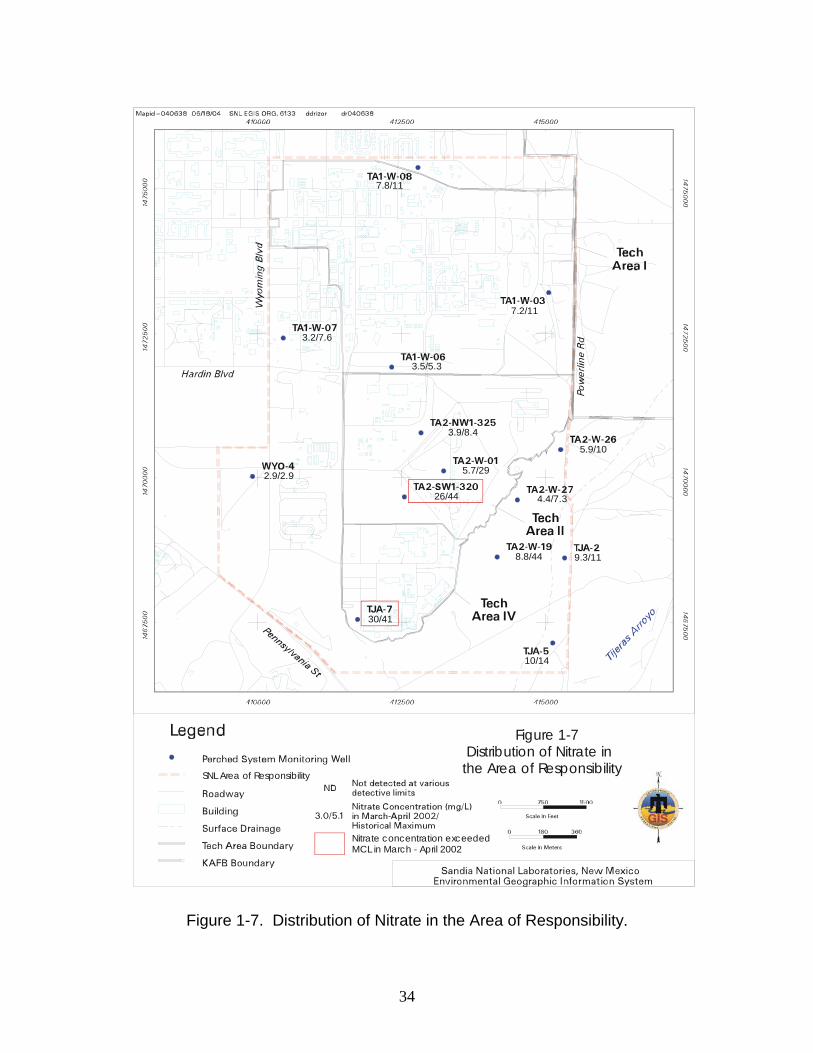
Figure 1-7. Distribution of Nitrate in the Area of Responsibility.
7.8/11
3.2/7.6
3.5/5.3
3.9/8.4
5.7/29
26/44 4.4/7.3
8.8/44 9.3/11
5.9/10
10/14
30/41
2.9/2.9
7.2/11
Nitrate concentration exceededMCL in March - April 2002
SNL Area of Responsibility
Figure 1-7 Distribution of Nitrate in the Area of Responsibility
34
2.0 CLEANUP GOALS, OBJECTIVES, AND REQUIREMENTS
This CME Work Plan provides a framework for identifying the most effective corrective measure for implementation at the TAG SNL/NM AOR. An effective corrective measure will be cost-effective and must ensure that cleanup goals and objectives are met. Cleanup goals and objectives can be divided into two types (performance and compliance) based on when the goal or objective is to be achieved. Goals are established as the milestones to meet upon completion of phases of remediation (i.e., performance or compliance). Objectives are tasks to be completed in order to meet the goals.
Performance goals and objectives are defined to support remedy performance evaluation during implementation of the remedy but before final closure of the site. Compliance goals and objectives are defined to support decision making at the end of the remedy to provide the framework in determining that the remedy has restored groundwater to be eligible for beneficial use within the restoration timeframe. Because the type of data collected may be quite different, it is important to distinguish between performance and compliance goals and objectives. The performance and compliance goals and objectives presented in this document will be finalized in the CME Report. The following sections outline the performance and compliance goals and objectives for remediation of the TAG SNL/NM AOR.
2.1 Performance Goals and Objectives
Performance goals and objectives are criteria and actions used to evaluate remedy performance during the operations phase to support evaluation of system performance data relative to end-state objectives. Analysis of performance monitoring data leads to periodic decisions that the remedy is performing as expected and that the remedy will ultimately achieve the final remediation goal or that the remedy is not performing and operational changes need to be evaluated and implemented. The performance goals and objectives for the TAG SNL/NM AOR include:
Performance Goals:
• Establishing and operating a remedy intended to reduce COC concentrations,
• Monitoring distribution and changes in COC concentrations, and
• Collecting sufficient data to support a decision to move into the compliance phase.
Performance Objectives:
• Collecting groundwater samples for performance parameters (i.e., in addition to COCs) from TAG SNL/NM AOR perched system wells,
• Compiling and analyzing groundwater monitoring data to evaluate trends in COC concentrations,
• Comparing trends to the COC cleanup standards, and
• Recommending continued operation of the remediation system or strategy and proceeding to compliance evaluation.
35
2.2 Compliance Goals and Objectives
Compliance goals and objectives are criteria and actions used to evaluate remediation system or strategy effectiveness both during and at completion of the corrective measure. Compliance requirements may be imposed during remediation system or strategy operations (e.g., air emissions or waste management). In addition, compliance requirements exist for final closure of the site. These compliance goals and objectives serve to show that the remedy is being implemented in a fashion that is consistent with the COOC (NMED 2004) during implementation and that the remedy has accomplished the remediation goals at the end of the corrective measure. Groundwater cleanup levels for the TAG SNL/NM AOR are defined in Section VI.K.1.a of the COOC (NMED 2004) as the more restrictive of EPA MCLs or Water Quality Control Commission standards. As presented in Section 1.5 and Table 1-7, the cleanup levels for COCs are defined by the MCLs, as these are the more restrictive of the two standards. The remedial timeframe for the TAG SNL/NM AOR will be defined in the Corrective Measures Implementation Plan. The compliance goals and objectives for the TAG SNL/NM AOR include:
Compliance Goals:
• Operating all remediation systems or strategies in compliance with applicable requirements,
• Reducing COC concentrations throughout the plume to below MCLs (refer to Table 1-7), and
• Protecting human health and the environment during the remediation timeframe by implementing institutional controls.
Compliance Objectives:
• Monitoring all remediation systems or strategies for compliance with applicable requirements,
• Collecting groundwater samples at TAG SNL/NM AOR perched system wells for COCs,
• Comparing COC concentrations to cleanup standards, and
• Recommending site closure or continuation of long-term operations.
36

3.0 TECHNOLOGY IDENTIFICATION AND SCREENING
This technology identification and screening is an initial evaluation to determine feasible technologies to be considered for implementation for the TAG SNL/NM AOR. The primary objective of this section is to identify potential remediation technologies and subject these technologies to a screening process. The Survey of Subsurface Treatment Technologies for Environment Restoration Sites at Sandia National Laboratories, New Mexico (SNL/NM 2003b) and other scientific and engineering literature were used to facilitate selection of the technologies. This section includes a description of the threshold criteria to be used in the initial screening process, identification and description of remediation technologies, the initial screening process, and results of the initial technology screening.
3.1. Threshold Criteria
In the COOC (NMED 2004), the NMED identified threshold criteria to use for evaluating each remedial alternative. These threshold criteria are reflective of cleanup standards identified in the RCRA Corrective Action Plan (EPA 1994) for evaluation of a final corrective measure alternative. Technologies potentially used as part of a remedy and other remedy components also need to be evaluated against these threshold criteria. The four threshold criteria listed in the COOC (NMED 2004) are described below for the perched system. Following each criterion, a description of relevance to the TAG SNL/NM AOR is also included.
1. Protective of human health and the environment. Any proposed remedy must be protective of human health and the environment. As stated in the RCRA Corrective Action Plan, “Remedies may include those measures that are needed to be protective, but are not directly related to media cleanup, source control, or management of wastes” (EPA 1994). Components of remedies considered for the TAG SNL/NM AOR include evaluating protection of human health and the environment for air emissions, potential formation of hazardous degradation products, any hazards associated with operations and maintenance of the remedy, and remediation within an appropriate timeframe.
2. Attain media cleanup standard or alternative, approved risk-based cleanup goals. Any proposed remedy must attain groundwater cleanup standards or goals. As stated in the RCRA Corrective Action Plan, “Remedies will be required to attain media cleanup standards set by the implementing agency, which may be derived from existing state or federal regulations (e.g., groundwater standards) or other standards. The media cleanup standards for a remedy will often play a large role in determining the extent of, and technical approaches to, the remedy” (EPA 1994). The potential effectiveness of a remedy attaining media cleanup standards relies on a number of site-specific factors. The TAG SNL/NM AOR media cleanup standards apply only to the perched system. Site-specific factors and corresponding evaluation criteria for the TAG SNL/NM AOR perched system include the following:
a. Contamination in a deep heterogeneous perched system: The TAG SNL/NM AOR has discontinuous yet overlapping lenses of unsaturated alluvial-fan sediments that serve as a perching horizon. This has resulted in a perched system that is encountered at approximately 220 to 330 ft bgs with a saturated thickness ranging from 10 to 30 ft. The alluvial-fan lithofacies is a poorly-sorted, low-yielding, and
37

fine-to medium-grained material with low to moderate hydraulic conductivities (estimated 0.01 to 50 ft/day). Will the proposed remedy be effective in a deep heterogeneous perched system with low-permeability lenses?
b. Slow groundwater velocities: Groundwater velocities within the TAG SNL/NM AOR are estimated to be 4 to 10 ft/year based on studies conducted for TA-III/V and locations scattered across KAFB (SNL/NM 1999). Will the proposed remedy be effective given this range of groundwater velocities?
c. Arid environment: Recharge from annual precipitation in the TAG SNL/NM AOR is considered to be insignificant as a mechanism for transporting contaminants through the vadose zone. Annual precipitation is approximately 8.2 in. and virtually all of this subsequently undergoes evapotranspiration. Other potential sources of recharge include leaking water supply/sewer lines, irrigated lawns, the Tijeras Golf Course, and ephemeral flows in Tijeras Arroyo. None of these potential sources of recharge produce observable effects on contaminants within the vadose zone or the perched system. Will the arid environment impact the effectiveness of the proposed remedy?
d. Variable trends in water levels in the perched system: Water levels in the perched system fluctuate across the TAG study area. In the vicinity of the sewage lagoons (northwest), water levels have been declining since 1987 because of the removal of the lagoons from service. Conversely, water levels in the southeast portion of the perched system have increased. Will this fluctuation of water levels affect the effectiveness of the proposed remedy?
e. Several potential contaminant releases: Several potential sites of release of contaminants exist within the TAG SNL/NM AOR (SNL/NM 2003a). Will the proposed remedy be effective for a site with several releases of contaminants?
f. Contaminants in a perched system that feeds a regional system: The perched system flows primarily southeast and merges with the regional aquifer in the vicinity of Powerline Road, southeast of Tijeras Arroyo, which then flows primarily to the northwest. Will the proposed remedy be effective for an aquifer system where the perched system merges with the regional system?
g. Peak historic TCE concentration of 9.6 µg/L: The TCE concentrations within the TAG SNL/NM AOR are low. Only two monitoring wells had TCE concentrations that exceeded the MCL (5 µg/L) during the March/April 2002 sampling event. Will the proposed remedy be effective in reducing TCE concentrations to its MCL of 5 µg/L?
h. Peak historic nitrate concentration of 44 mg/L: Peak nitrate concentrations at the TAG SNL/NM AOR perched system are approximately four times the nitrate MCL of 10 mg/L. Will the proposed remedy effectively reduce these concentrations to below the nitrate MCL of 10 mg/L?
38
3. Control the source or sources of releases so as to reduce or eliminate, to the extent practicable, further releases of contaminants that may pose a threat to human health and the environment. Any proposed remedy must control the original source of the contamination in order to prevent any further releases. As stated in the RCRA Corrective Action Plan, “Unless source control measures are taken, efforts to clean up releases may be ineffective or, at best, will essentially involve a perpetual cleanup” (EPA 1994). According to Section 1.4.3 of this report, the original source of the TCE was the aqueous phase (waste water) and the current vapor phase contaminants present in portions of the TAG SNL/NM AOR partitioned from the aqueous phase. However, the current vapor plume does not contribute significant contaminant mass to the groundwater within the TAG SNL/NM AOR (refer to Section 1.4.3). Given this, source control is not a required component of the TAG SNL/NM AOR corrective measure and any technologies designed for source zone control or remediation are not needed.
4. Comply with standards for management of wastes. Any proposed remedy must comply with all applicable state or federal regulations. As stated in the RCRA Corrective Action Plan, “Waste management activities will be conducted in compliance with all applicable state or federal regulations (e.g., closure requirements, land disposal restrictions)” (EPA 1994). For remedies considered for the TAG SNL/NM AOR, waste could be generated during the life cycle of the remedy in the form of contaminated groundwater brought to the surface, laboratory and field sampling wastes, and at the completion of the remedy during final decommissioning of the remedy system.
3.2 Technology Identification and Description
A number of treatment technologies are considered for remediation of groundwater contaminants present at the SNL/NM AOR. This section identifies technologies selected for initial screening (Table 3-1) and provides a description of the technologies. Table 3-1 lists the technologies alphabetically and identifies if the technology is applicable for volatile organic compound (VOC) and/or nitrate remediation. A literature review of the technologies was performed to compile information for technology descriptions. A description of each technology includes information about applicability, system design, and operation. Also included in this section are the advantages, disadvantages, and references for each technology.
Groundwater contamination in the TAG SNL/NM AOR consists of TCE and nitrate at concentrations slightly above their respective MCLs. Contamination is located in the perched system, which has relatively low groundwater velocities. Recharge from both anthropogenic and natural sources produces little observable effect within the vadose zone or aquifer. There are no immediate groundwater receptors and no water supply wells are completed in the perched system; therefore, risk to human health and the environment is minimal. Given these characteristics, it is appropriate to consider low-cost, minimal impact remedies for cleanup of the TAG SNL/NM AOR.
39
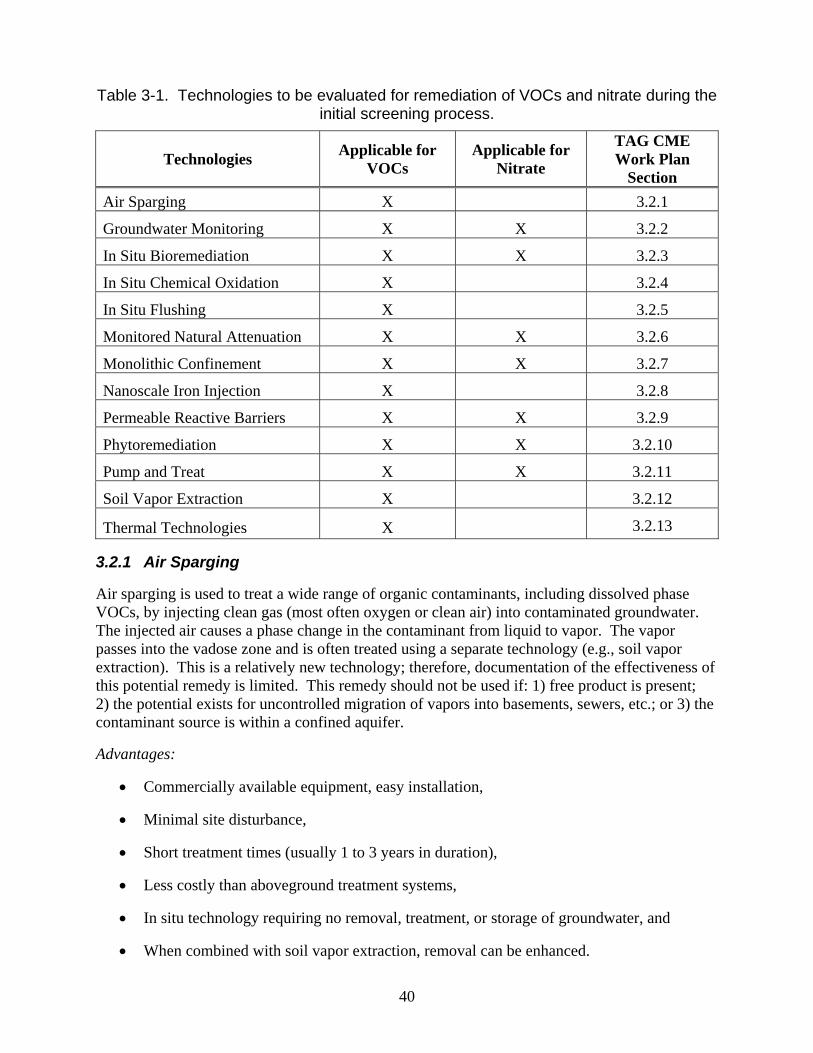
Table 3-1. Technologies to be evaluated for remediation of VOCs and nitrate during the initial screening process.
Technologies Applicable for
VOCs Applicable for
Nitrate
TAG CME Work Plan
Section
Air Sparging X 3.2.1
Groundwater Monitoring X X 3.2.2
In Situ Bioremediation X X 3.2.3
In Situ Chemical Oxidation X 3.2.4
In Situ Flushing X 3.2.5
Monitored Natural Attenuation X X 3.2.6
Monolithic Confinement X X 3.2.7
Nanoscale Iron Injection X 3.2.8
Permeable Reactive Barriers X X 3.2.9
Phytoremediation X X 3.2.10
Pump and Treat X X 3.2.11
Soil Vapor Extraction X 3.2.12
Thermal Technologies X 3.2.13
3.2.1 Air Sparging
Air sparging is used to treat a wide range of organic contaminants, including dissolved phase VOCs, by injecting clean gas (most often oxygen or clean air) into contaminated groundwater. The injected air causes a phase change in the contaminant from liquid to vapor. The vapor passes into the vadose zone and is often treated using a separate technology (e.g., soil vapor extraction). This is a relatively new technology; therefore, documentation of the effectiveness of this potential remedy is limited. This remedy should not be used if: 1) free product is present; 2) the potential exists for uncontrolled migration of vapors into basements, sewers, etc.; or 3) the contaminant source is within a confined aquifer.
Advantages:
• Commercially available equipment, easy installation,
• Minimal site disturbance,
• Short treatment times (usually 1 to 3 years in duration),
• Less costly than aboveground treatment systems,
• In situ technology requiring no removal, treatment, or storage of groundwater, and
• When combined with soil vapor extraction, removal can be enhanced.
40
Disadvantages:
• Cannot be used if free product is present,
• Cannot be used for treatment in confined aquifer systems,
• Stratified soils may render this remedy ineffective,
• Needs extensive site characterization for maximum effectiveness and safety,
• Potential for migration of contaminants,
• Lack of field and laboratory research to support design considerations,
• May not be effective in removing contaminants present at low concentrations,
• May not be compatible with technologies that rely upon anaerobic degradation, and
• Not applicable for nitrate.
References:
• Department of Defense, 2000, “Environmental Security Technology Certification Program (ESTCP) Cost and Performance Report: Multi-Site In Situ Air Sparging,” CU-9808, http://www.estcp.org/documents/techdocs/199808.pdf, December 2000.
• EPA, 2003a, “Air Sparging,” http://www.epa.gov/swerust1/cat/airsparg.htm.
• SNL/NM, 2003b, Survey of Subsurface Treatment Technologies for Environmental Restoration Sites at Sandia National Laboratories, New Mexico, Sandia National Laboratories, Albuquerque, NM, August 2003.
3.2.2 Groundwater Monitoring
Groundwater monitoring consists of collecting samples from a network of monitoring wells with the objective of monitoring contaminant concentrations and transport in groundwater over time. Groundwater monitoring is applicable for relatively low concentration groundwater plumes with long remedial timeframes and minimal risk of harm to human health and the environment. A monitoring plan will be established to identify monitoring locations, frequency and duration of sample collection, and analysis parameters. Extensive knowledge of site-specific geohydrologic conditions and contaminant distribution and transport is required to establish an appropriate monitoring plan.
Groundwater monitoring is not considered to be a no action approach because active monitoring will take place and a contingency plan will be established. If a no action approach was selected, then monitoring would not take place and a contingency plan would not be established. A contingency plan will include reevaluation criteria in the event that groundwater monitoring shows that human health and environment are no longer protected by natural processes (e.g., dramatic increases in contaminant concentrations and contaminant distribution and transport beyond control location). Unlike monitored natural attenuation (MNA), the groundwater monitoring approach makes no attempt to verify pathways of natural attenuation or
41
to predict contaminant transport and degradation. Because of this, groundwater monitoring provides little basis for reducing the monitoring requirements (e.g., frequency or analytes) during the course of the remedy based on predicted performance or degradation.
Advantages:
• Potentially less expensive, although required project duration is unknown,
• Minimal risk to workers compared to aggressive technologies,
• Minimal site disturbance,
• Implementation flexibility, and
• In situ technology requiring no removal, treatment, storage, or destruction of groundwater.
Disadvantages:
• Monitoring can proceed for an indefinite period, resulting in increased life-cycle cost,
• End point may be undefined,
• Potential for transport of contaminants toward receptors, and
• Regulatory approval can be difficult because this technology does not involve active removal or destruction of contaminants.
3.2.3 In Situ Bioremediation
Bioremediation is the application of biological treatment for remediation of contaminants. In situ bioremediation (ISB) is the application of bioremediation in the subsurface and can be used for remediation of a wide variety of contaminants, both organic and inorganic, under both aerobic and anaerobic conditions. It combines an understanding of biology, geochemistry, hydrogeology, and engineering into a cohesive strategy for the destruction of groundwater contaminants using microbes.
Bioremediation can involve aerobic or anaerobic processes. Aerobic bioremediation techniques can include implementation of biosparging. Biosparging is similar to air sparging except that the injected air (or oxygen) can be amended with nutrients, increasing the activity of indigenous microorganisms to stimulate aerobic degradation. Contaminants are removed through microbial degradation and volatilization, whereas air sparging removes contaminants through volatilization only. The operating principles are the same as air sparging and this technology is often used with other technologies (e.g., soil vapor extraction).
Anaerobic bioremediation techniques can include injection of an electron donor to increase activity of indigenous microorganisms to stimulate anaerobic degradation. VOC and nitrate reduction can occur in the absence of oxygen and the presence of an electron donor where VOCs and nitrate can act as electron acceptors in the microbial respiration process. This results in anaerobic reductive dechlorination (ARD) of VOCs to ethene and conversion of nitrate to nitrite and ultimately to nitrogen (N2).
42
Advantages:
• Contaminant degradation occurs in situ, minimizing worker exposure to hazardous contaminants,
• Effective on a wide range of contaminants and concentration levels,
• Commercially available equipment,
• Effective for both dissolved and sorbed phases of organic and inorganic contamination,
• In situ technology requiring no removal, treatment, or storage of groundwater, and
• Anaerobic application can be easily combined with other technologies.
Disadvantages:
• Subsurface heterogeneities may cause non-uniform distribution of electron donor,
• Biological growth may affect injection wells and flowpaths (biofouling),
• Operations and monitoring may be continuous,
• Often requires more than one application due to rebound effects,
• Difficult to implement in low-permeability aquifers,
• Aerobic application (biosparging) cannot be used for treatment in confined aquifer systems, may not be effective in removing contaminants present at low concentrations, and is not compatible with technologies that rely upon anaerobic degradation,
• Remediation may only occur within the higher permeability channels in the aquifer, and
• The potential for activation (transformation of the contaminant into a more hazardous substance) exists.
References:
• Interstate Technology and Regulatory Cooperation Work Group, 2002. “Technical and Regulatory Guidance for In Situ Bioremediation in Groundwater,” 129 pp.
• Martin, J.P., Allison, A.M., Keck, J.F., Peterson, L.N., 2002, Evaluation of Remediation Technologies for DNAPL Source Zone Clean-Up at the OK Tool Site, Milford, NH, NWE-ID-2002-047, Revision 0, North Wind, Inc.
• EPA, 2003b, “Biosparging,” http://www.epa.gov/swerust1/cat/biosparg.htm.
43

3.2.4 In Situ Chemical Oxidation
In situ chemical oxidation (ISCO) is implemented by injecting an oxidizing compound (usually hydrogen peroxide or permanganate) into a NAPL source zone. The oxidant reacts quickly to destroy the aqueous phase contaminant, which acts to drive more contaminant from the NAPL phase to the aqueous phase. This process is non-selective (i.e., anything that can be oxidized in the subsurface will react with the reagent), potentially increasing the amount of reagent needed.
Advantages:
• Capability to destroy large masses of organic contaminants in a relatively short period of time,
• Contaminants are fully degraded into harmless byproducts,
• Effective on high contaminant concentrations,
• Potential for lower costs than other technologies due to shorter remedial timeframe,
• Can be used at sites with deep contamination, and
• Destruction takes place in the aqueous phase.
Disadvantages:
• Subsurface heterogeneities may cause non-uniform distribution of oxidant,
• Effective porosity of the subsurface may be reduced due to the formation of metal oxide precipitates,
• Often requires more than one application due to rebound effects,
• Not effective in low concentration areas,
• Oxidation may harm the indigenous microbial community, potentially limiting options for future aerobic or anaerobic degradation of contaminants, and
• Not applicable for nitrate.
References:
• Martin, J.P., Allison, A.M., Keck, J.F., Peterson, L.N., 2002, Evaluation of Remediation Technologies for DNAPL Source Zone Clean-Up at the OK Tool Site, Milford, NH, NWE-ID-2002-047, Revision 0, North Wind, Inc.
• SNL/NM, 2003b, Survey of Subsurface Treatment Technologies for Environmental Restoration Sites at Sandia National Laboratories, New Mexico, Sandia National Laboratories, Albuquerque, NM, August 2003.
44
• DOE, 1999a, Innovative Technology Summary Report: In Situ Chemical Oxidation Using Potassium Permanganate, DOE/EM-0496, http://apps.em.doe.gov/ost/pubs/istrs/itsr167.pdf, U.S. Department of Energy, 35 pp.
3.2.5 In Situ Flushing
In situ flushing involves injection of a solution into a dense nonaqueous phase liquid (DNAPL) source zone in order to remove DNAPL by dissolution and/or mobilization followed by downgradient extraction of the groundwater and flushing solution. Upon extraction, the flushing solution, which is mixed with the contaminants, is subjected to above ground treatment and reinjected.
Flushing relies on an increase in solubility of hydrophobic organic compounds resulting from the addition of the flushing solution to groundwater and from the reduction of interfacial tension. A typical system consists of arrays of injection and extraction wells arranged to provide an efficient flood of the source zone. Horizontal wells, trenches, or other delivery systems may also be used. Either hydraulic control or containment walls may be used to contain the flushing area. The effluent solution produced at the extraction wells contains water, solvent, and contaminants and must be treated prior to injection or disposal. Flushing solutions may consist of alcohol, cosolvents, acids, bases, solvents, surfactants, or plain water. This technology can be used for a variety of organic contaminants, including DNAPL, and may have some application to inorganic contaminants. Optimal application of this technology is in moderate to high permeability soils with an excellent understanding of the hydrogeology.
The use of surfactants or cosolvents for in situ flushing is common. Remediation using surfactants involves injection of a solution of water plus surfactants into the source zone to remove contaminants through a combination of dissolution, mobilization, and displacement. Selection of surfactants requires consideration of performance, toxicity, biodegradability, and possible chemical reactions with constituents in the water, and the potential for sorption. After extraction, surfactants may be separated from the contaminants and reused (e.g., separation through air stripping or a permeable membrane system for nonvolatile contaminants). If surfactants are not separated, the extracted solution of water, surfactant, contaminants, and other additives must be treated prior to reinjection in the subsurface or disposal in a surface water body or sewer.
Advantages:
• Chemical principles are simple,
• Alcohols are not sorbed significantly,
• Suitable for removal of DNAPL at very high saturations,
• Many surfactants are Food and Drug Administration food-grade compounds and readily biodegradable,
• No significant site disruption, and
• High removal of DNAPL can be achieved in relatively homogeneous areas with moderate to high permeability.
45

Disadvantages:
• Heterogeneities in the aquifer will decrease extraction efficiency; therefore, some areas will require longer treatment times and larger treatment volumes,
• Alcohols are less dense than water, so high concentration solutions will be less dense than groundwater creating problems with even circulation,
• Field trials have required multiple pore volumes of treatment solution with no recycling; therefore, substantial volumes of flushing solution were used and large volumes of extracted fluids had to be treated,
• Decreasing interfacial tension, combined with the addition of solvents, creates a risk that DNAPLs will be mobilized,
• Ultimate cleanup level is unknown, and
• Not applicable for nitrate.
References:
• National Research Council, 1999, “Groundwater and Soil Cleanup: Improving Management of Persistent Contaminants,” National Academy Press: Washington D.C., 285 pp.
• Ground-Water Remediation Technologies Analysis Center (GWRTAC), 2001, Remediation Technologies, http://www.gwrtac.org/html/techs.html.
• Fountain, J.C., 1998, “Technologies for Dense Nonaqueous Phase Liquid Source Zone Remediation,” TE-98-02, GWRTAC, Pittsburgh, Pennsylvania, http://www.gwrtac.org/pdf/e_dnapl.pdf, December 1998.
3.2.6 Monitored Natural Attenuation
MNA typically operates on the principle of indigenous microorganisms using a supply of nutrients and electron acceptors (or donors) already present in the environment to completely metabolize or cometabolize pollutants. In certain applications, non-destructive attenuation mechanisms (i.e., dispersion or dilution) may be sufficient to meet site-specific cleanup goals. Careful characterization and thorough monitoring are essential to ensure that sufficient attenuation will take place to comply with all regulatory requirements. This characterization is the difference between MNA and groundwater monitoring because groundwater monitoring makes no attempt to verify pathways of natural attenuation or to predict contaminant transport and degradation. Because of this, an MNA remedy may provide the basis for reducing the monitoring requirements (e.g., frequency or analytes) during the course of the remedy based on predicted performance or degradation. MNA has wide applicability, relative low cost, and requires minimal infrastructure. The primary costs associated with this remedy are monitoring costs. It can be used for remediation of common groundwater contaminants, including petroleum hydrocarbons and chlorinated solvents. Biodegradation or cometabolism can result in reduction of VOC concentrations, and nitrate can be transformed through redox processes (e.g., denitrification) that are operative in the subsurface.
46

Advantages:
• Less construction and maintenance is required than other treatment options, making the technology less costly,
• Contaminants are ultimately transformed into innocuous byproducts,
• The non-intrusive nature of MNA allows continued use of infrastructure during remediation,
• Requires no removal, treatment, or storage of groundwater. There is less risk than engineered remedies that may transfer contaminants to the air during remediation,
• Not subjected to equipment limitations such as malfunction or other downtime, and
• Can be used in conjunction with, or following, other remedial measures conducted under similar conditions (e.g., anaerobic).
Disadvantages:
• Subject to natural and induced changes in local hydrogeology,
• Aquifer heterogeneity can make characterization difficult,
• Potential for contaminant migration,
• May not be compatible with technologies that introduce oxygen into the subsurface (i.e., air sparging), and
• Remediation timeframes may be longer than some active remediation technologies.
References:
• DOE, 1999b, Decision-Making Framework Guide for the Evaluation and Selection of Monitored Natural Attenuation Remedies at Department of Energy Sites, Office of Environmental Restoration, http://web.em.doe.gov/framework/, U.S. Department of Energy.
• EPA, 1999, Use of Monitored Natural Attenuation at Superfund, RCRA Corrective Action, and Underground Storage Tank Sites, OSWER Directive 9200.4-17P, http://www.epa.gov/swerust1/directiv/d9200417.pdf.
• EPA, 1998, Technical Protocol for Evaluating Natural Attenuation of Chlorinated Solvents in Ground Water, EPA/600/R-98/128, http://www.clu-in.org/download/remed/protocol.pdf.
• Wiedemeier, T.H., J.T. Wilson, K.H. Kampbell, R.N. Miller, J.E. Hansen, 1999, “Technical Protocol for Implementing Intrinsic Remediation with Long-Term Monitoring for Natural Attenuation of Fuel Contamination Dissolved in Groundwater,” Volume I, Revision 0, Air Force Center for Environmental Excellence, Brooks Air Force Base, S.A., Texas.
47

3.2.7 Monolithic Confinement
Monolithic confinement consists of constructing barriers (e.g., cement or grout) to confine groundwater contamination. Barriers can be constructed by digging a trench and backfilling it or by injecting grouting fluids (i.e., cement, clay, or a solution to react in the subsurface to form a low permeability material) into a series of boreholes in order to reduce the permeability of the aquifer matrix. Surrounding a contaminant source with a barrier can reduce the flux of contaminants from the source limiting production of additional groundwater contamination. If the barrier is not set in impermeable areas, then the system will be open and contamination will not be contained.
Advantages:
• Once installed, it is a passive technology that uses no above ground infrastructure,
• In situ technology requiring no removal, treatment, or storage of groundwater,
• If installed properly, no contaminant migration occurs,
• Can be used for any type or state of contamination, and
• If installed properly, can be effective under a variety of geohydrologic characteristics.
Disadvantages:
• Expensive and difficult to implement for deep aquifer contamination,
• Emplacement can be disruptive to the site and is permanent,
• Used as a containment remedy; source area may remain indefinitely,
• Often requires pumping to maintain inward gradient,
• Monitoring can proceed for an indefinite period resulting in increased cost,
• End point may be undefined, and
• Regulatory approval can be difficult because this technology does not involve active removal or destruction of contaminants.
References:
• National Research Council, 1999, “Groundwater and Soil Cleanup: Improving Management of Persistent Contaminants,” National Academy Press: Washington D.C., 285 pp.
48

3.2.8 Nanoscale Iron Injection
This technology involves injecting zero valent nanoscale iron directly into a DNAPL source zone. The nanoscale iron particles are between 1 and 100 nm in diameter. Because of the small size of these particles, it is easy to distribute the amendment by incorporating it into a slurry and injecting the slurry into the aquifer. The iron particles are small enough to reach and react with TCE present in the pore spaces of the aquifer. The addition of nanoscale iron is an application of metal enhanced reduction of contaminants in the subsurface. According to the manufacturer, approximately 25 lb is required to treat an area of 100 m2 from a single injection point.
Advantages:
• Works on the same principles as metal enhanced reduction, so the degradation mechanism is well understood,
• This remedy is passive, requiring no infrastructure once the remedy is emplaced,
• According to the manufacturer, nanoscale iron has the potential to degrade a wide variety of contaminants,
• Contaminant degradation occurs in situ, and
• Reaction rates are rapid.
Disadvantages:
• Precipitates may interfere with hydraulic conductivity,
• The amendment is expensive,
• Competing electron acceptors may increase the demand for the amendment,
• Not as useful on low concentrations, and
• Not applicable for nitrate.
References:
• Nanitech LLC, 2004, Information brochure.
3.2.9 Permeable Reactive Barriers
A permeable reactive barrier (PRB) is a physical barrier that is installed in the aquifer downgradient along the flow path of the contaminant. As the contaminated groundwater passes through the barrier, the contaminants react with the barrier to either transform the contaminant into a less harmful byproduct or irreversibly absorb the contaminants into the permeable material. A PRB can contain such agents as zero-valent metals, chelators, sorbents, microbes, or other agents. A funnel and gate approach can be utilized to contain the contaminant plume with low hydraulic conductivity barriers in the crossgradient direction and direct the flow of the
49

contaminant plume toward the downgradient PRB. PRBs can be used for a wide range of organic and inorganic contaminants. In general, PRBs are only effective for contamination that is shallower than 50 ft.
A biological barrier is a PRB installed across the flow path of a contaminated groundwater plume. It is similar to a conventional PRB in that it consists of an excavated trench filled with a sorbent media. This media retards the movement of organics and supports microbial growth to biodegrade the sorbed organics. Addition of nutrients, co-substrates, and/or electron donors or acceptors to the barrier helps stimulate biodegradation. The target contaminants include aerobically and anaerobically biodegradable compounds such as halogenated and nonhalogenated VOCs and semi-volatile organic compounds (SVOCs), polychlorinated biphenyls (PCBs), nitrates, and other inorganics.
Another method used in PRBs is metal-enhanced reduction of contaminants. Metal-enhanced dechlorination technology uses an electrochemical process involving oxidation of iron and reductive dehalogenation of halogenated VOCs to convert VOCs to hydrocarbons and inorganic halides either in situ or ex situ. The treatment process, stimulated by a metal-enhanced dechlorination PRB, is the same as that of nanoscale iron injection except that the media is employed using a PRB or treatment wall where contaminated groundwater flows through and the contaminants are either sorbed or destroyed.
Advantages:
• Passive technology that uses no above ground infrastructure,
• If installed properly, no contaminant migration occurs beyond the barrier,
• Requires no removal, treatment, or aboveground storage of groundwater,
• Can incorporate different materials to treat a wide range of contaminants,
• Once the barrier is installed, no further costs are incurred (other than monitoring), and
• Metal enhanced reduction uses an inexpensive form of zero-valent iron.
Disadvantages:
• Emplacement of the barrier can be disruptive to the site and difficult where the aquifer is deep,
• The barrier is permanent and the timeframe for contaminated groundwater to pass through the PRB may be long,
• Used as a containment remedy; the source area may remain indefinitely depending on concentration, sorption, and other factors,
• Very high contaminant concentrations and heavy metals can be toxic to microorganisms if using a biological barrier,
• Precipitation of metals and other inorganics may reduce hydraulic conductivity, possibly causing the groundwater flow to bypass the barrier,
50
• For a biological barrier, generation of biomass may limit the permeability of the barrier, and
• For metal enhanced reduction barriers, reactivity of iron may necessitate periodic replacement or treatment of the iron medium.
References:
• SNL/NM, 2003b, Survey of Subsurface Treatment Technologies for Environmental Restoration Sites at Sandia National Laboratories, New Mexico, Sandia National Laboratories, Albuquerque, NM, August 2003.
• Strietelmeier, B.A., M.L. Espinosa, M.W. Jones, J.D. Adams, E.M. Hodge, S.D. Ware, P.A. Leonard, P. Longmire, J.P. Kaszuba, and J.L. Conca, 2001, “Remediation of Nitrate-Contaminated Groundwater Using a Biobarrier,” Waste Management 2001 Conference, February 25-March 1, 2001, Tucson, Arizona, http://www.wmsym.org/Abstracts/2001/54/54-2.pdf.
• EPA, 1997, Metal-Enhanced Dechlorination of Volatile Organic Compounds Using an Above-Ground Reactor, EPA/540/R-96/503, Superfund Innovative Technology Evaluation Report, EnviroMetal Technologies, Inc., http://www.epa.gov/ORD/SITE/reports/540r96503.pdf.
3.2.10 Phytoremediation
Phytoremediation uses plants for remediation of groundwater by taking advantage of the natural abilities of plants to take up, accumulate, and/or degrade constituents of their soil and water environments. It is most appropriate for sites where groundwater is within 10 ft of the ground surface and large areas where contaminants are found in low concentrations.
Advantages:
• Effective for large areas with low contaminant concentrations,
• Potentially less expensive than an aggressive removal technology,
• Implementation flexibility of location for ex situ application, and
• Plants are used for remediation of contaminants, minimizing worker exposure.
Disadvantages:
• Can only be used at sites with shallow groundwater (10 ft),
• Monitoring can proceed for an indefinite period, resulting in increased cost,
• May be difficult to implement in an arid environment, and
• Requires land space for plant growth that may not be possible at some sites.
51

References:
• Ground-Water Remediation Technologies Analysis Center (GWRTAC), 2001, Remediation Technologies, http://www.gwrtac.org/html/techs.html.
3.2.11 Pump and Treat
Pump and treat is a broad term used to describe the pumping of contaminated groundwater to the surface where it can be treated and possibly injected after treatment. Since this is an ex situ treatment, a wide range of contaminants can be treated with a variety of technologies. Designs of pump and treatment systems vary greatly. Systems consist of at least one extraction well used to remove contaminated groundwater for ex situ treatment and a disposition method for the treated water. Disposition of treated water can include injection into the aquifer, onsite reuse (irrigation), misting, or disposal to infiltration trenches or surface water bodies.
Ex situ treatment of the contaminated groundwater can be performed using a variety of technologies. Often, the treatment is in the form of air stripping, which passes air through the contaminated water and volatilizes organic contaminants. Sorption to activated carbon and ion exchange resins may also be used to remove contaminants. Ex situ bioreactors can be constructed in enclosed chambers and used to degrade contaminants using microorganisms. Contaminated groundwater is pumped to the enclosed chamber where it is circulated in an aeration basin creating an environment for microbes to degrade contaminants. Microbial populations are either located on a rotating biological matrix or on a packed bed with a surface area for microbial growth.
Advantages:
• Because of widespread use, it is a well developed technology,
• Generally effective in preventing the spread of contamination in the subsurface, and
• Can be used on a wide range of contaminants.
Disadvantages:
• Not effective at source removal,
• Timeframe for remediation can be long,
• May not be capable of reducing contaminant concentrations to meet cleanup standards,
• Requires extensive site characterization to determine potential for effectiveness,
• Rebound and trailing effects can reduce effectiveness of this remedy,
• Not always effective for cleaning up source areas of contamination, and subsurface heterogeneities can reduce contaminant capture efficiency,
• Operation and maintenance costs can be expensive,
52
• Contaminated groundwater is often too dilute to support an adequate microbial population in bioreactors,
• When an air stripper is used, pollution controls may be needed to manage volatilization of contaminants,
• Nuisance microorganisms can predominate and reduce treatment effectiveness in ex situ bioreactors, and some intermediate degradation products are more toxic than the original contaminants in bioreactors, and
• Treatment media may require treatment or disposal.
References:
• EPA, 1996, Pump-and-Treat Ground-Water Remediation: A Guide for Decision Makers and Practitioners, EPA/625/R-95/005, Office of Research and Development, Washington D.C., http://www.epa.gov/ORD/WebPubs/pumptreat/, July 1996.
• Center for Public Environmental Oversight, 2000, Technology Tree: Bioreactors. http://www.cpeo.org/techtree/ttdescript/biorec.htm.
3.2.12 Soil Vapor Extraction
Soil vapor extraction consists of removing air from the vadose zone to evaporate and entrain contaminant vapors. The vapor and effluent gas are brought to the surface through vacuum extraction wells where the contaminant vapors are treated or destroyed before the effluent gas is released back into the atmosphere. It is primarily used to treat the unsaturated zone and is not applicable to groundwater remediation unless combined with air sparging. When used in the unsaturated zone, it may not be cost effective for remediation of very low concentrations due to mass-transfer limitations.
Soil vapor extraction system designs vary, but a typical setup consists of at least one location where air is injected into the subsurface and at least one extraction point where the vapors are collected and treated or destroyed. In shallow applications (~5 ft), it is common to cap the treatment area with an impermeable barrier to avoid short-circuiting of air from the atmosphere. Passive soil ventilation systems can also be designed that utilize atmospheric fluctuations in barometric pressure. The Baro Ball™ was developed for this passive soil ventilation application. The Baro Ball™ allows air to escape from the subsurface (result of lower atmospheric pressure) but seals the opening of the well to prevent air from entering the subsurface through the well (result of higher atmospheric pressure).
Advantages:
• Wide application for in-situ remediation of VOCs,
• Minimal disturbance to site operations,
• Easily combined with other technologies,
• Technology has been successfully demonstrated in the vadose zone, and
• Potential to remove large quantities of contaminant from the subsurface.
53

Disadvantages:
• Treatment of extracted vapors can be costly,
• Used primarily for vadose zone treatment,
• Difficult to achieve contaminant reductions greater than 90%, and
• Not applicable for nitrate.
References:
• SNL/NM, 2003b, Survey of Subsurface Treatment Technologies for Environmental Restoration Sites at Sandia National Laboratories, New Mexico, Sandia National Laboratories, Albuquerque, NM, August 2003.
• Martin, J.P., Allison, A.M., Keck, J.F., Peterson, L.N., 2002, Evaluation of Remediation Technologies for DNAPL Source Zone Clean-Up at the OK Tool Site, Milford, NH, NWE-ID-2002-047, Revision 0, North Wind, Inc.
3.2.13 Thermal Technologies
Thermal technologies include different methods of altering temperature-dependent properties of in situ contaminants in order to enhance mobility and solubility of DNAPLs. Common mechanisms used during thermal remediation to enhance contaminant removal include: 1) flushing of mobile contaminant from pore spaces, 2) reduction of contaminant viscosity, and 3) vaporization of VOCs and SVOCs. Common types of thermal technologies include steam injection, hot air injection, hot water injection, electrical resistance heating, radio frequency heating, and thermal conduction. A companion technology (i.e., soil vapor extraction) is usually needed to capture contaminant vapors. Any form of thermal remediation will most likely involve a great deal of infrastructure, both in the setup of the thermal system and the removal system, whether it is soil vapor extraction or pump and treat. However, this technology is quick, aggressive, and useful on high concentrations of both the dissolved phase and DNAPLs.
Advantages:
• Potentially quick remediation timeframe,
• Useful in areas where soil removal is not feasible,
• Effective in areas with high contaminant concentrations,
• No excavation needed, and
• Residual heat may provide a polishing step via heat-enhanced bioremediation or hydrolysis.
54

55
Disadvantages:
• Very expensive,
• Extensive infrastructure,
• Not effective for low contaminant concentrations,
• Potential safety issues due to presence of high voltage and thermal hazards,
• May move contaminants deeper or into undesirable locations, and
• Not applicable for nitrate.
References:
• Martin, J.P., Allison, A.M., Keck, J.F., Peterson, L.N., 2002, Evaluation of Remediation Technologies for DNAPL Source Zone Clean-Up at the OK Tool Site, Milford, NH, NWE-ID-2002-047, Revision 0, North Wind, Inc.
• SNL/NM, 2003b, Survey of Subsurface Treatment Technologies for Environmental Restoration Sites at Sandia National Laboratories, New Mexico, Sandia National Laboratories, Albuquerque, NM, August 2003.
• Ground-Water Remediation Technologies Analysis Center (GWRTAC), 2001, Remediation Technologies, http://www.gwrtac.org/html/techs.html.
3.3 Initial Technology Screening
The threshold criteria described in Section 3.1 were used in the initial screening described in this section. Initial screening was performed on all technologies identified and described in Section 3.2. Table 3-2 lists all technologies and the four threshold criteria. Evaluation was conducted on a YES/NO basis, as follows:
• YES = the technology meets the threshold criterion.
• NO = the technology does not meet the threshold criterion.
The first threshold criterion, Protective of Human Health and the Environment, was evaluated based on whether appropriate measures could be taken to ensure that implementation of the technology would be protective of human health and the environment.
The second threshold criterion, Attain Media Cleanup Standards, was evaluated using the technical site-specific characteristics listed in Table 3-3. Each technology was evaluated to determine if the individual technology would be effective or applicable based on these site-specific characteristics of the perched system, without consideration of cost and schedule. Evaluation was conducted on a YES/NO basis, as follows:

Table 3-2. Initial screening process for technologies using the COOC threshold criteria.
Attain Media Cleanup Standards1 Technologies
Protective of Human Health and Environment
TCE Nitrate
Source Control
Waste Management Standards Compliance
Air Sparging YES NO NA YES YES
Groundwater Monitoring YES YES YES YES YES
In Situ Bioremediation YES YES YES YES YES
In Situ Chemical Oxidation YES NO NA NO YES
In Situ Flushing YES NO NA NO YES
Monitored Natural Attenuation YES YES YES YES YES
Monolithic Confinement YES NO NO NO YES
Nanoscale Iron Injection YES NO NA NO YES
Permeable Reactive Barriers YES NO NO YES YES
Phytoremediation YES NO NO YES YES
Pump and Treat YES YES YES YES YES
Soil Vapor Extraction YES NO NA YES YES
Thermal Technologies YES NO NA NO YES
YES = the technology meets the threshold criterion NO = the technology does not meet the threshold criterion NA = the technology was identified as not applicable for nitrate in Table 3-1 1: This threshold criterion will be evaluated using the TAG SNL/NM AOR site-specific characteristics listed in Table 3-3. If a technology receives an
evaluation of YES for all of the site-specific characteristics listed in Table 3-3, then a YES will be recorded in the appropriate location on this table. If a technology receives an evaluation of NO for one or more of the characteristics listed in Table 3-3, then a NO will be recorded in the appropriate location on this table.
56
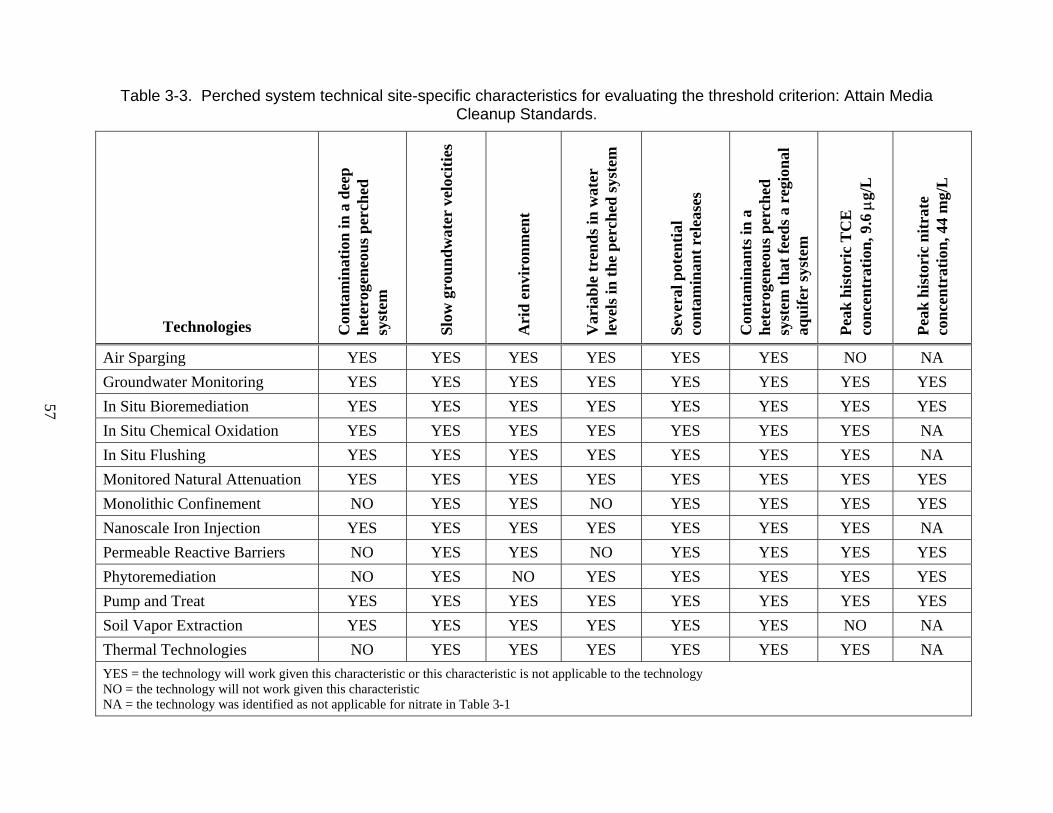
Table 3-3. Perched system technical site-specific characteristics for evaluating the threshold criterion: Attain Media Cleanup Standards.
Technologies Con
tam
inat
ion
in a
dee
p
het
erog
eneo
us
per
ched
sy
stem
Slo
w g
rou
nd
wat
er v
eloc
itie
s
Ari
d e
nvi
ron
men
t
Var
iab
le t
ren
ds
in w
ater
le
vels
in t
he
per
ched
sys
tem
Sev
eral
pot
enti
al
con
tam
inan
t re
leas
es
Con
tam
inan
ts in
a
het
erog
eneo
us
per
ched
sy
stem
th
at f
eed
s a
regi
onal
aq
uif
er s
yste
m
Pea
k h
isto
ric
TC
E
con
cen
trat
ion
, 9.6
µg/
L
Pea
k h
isto
ric
nit
rate
co
nce
ntr
atio
n, 4
4 m
g/L
Air Sparging YES YES YES YES YES YES NO NA
Groundwater Monitoring YES YES YES YES YES YES YES YES
In Situ Bioremediation YES YES YES YES YES YES YES YES
In Situ Chemical Oxidation YES YES YES YES YES YES YES NA
In Situ Flushing YES YES YES YES YES YES YES NA
Monitored Natural Attenuation YES YES YES YES YES YES YES YES
Monolithic Confinement NO YES YES NO YES YES YES YES
Nanoscale Iron Injection YES YES YES YES YES YES YES NA
Permeable Reactive Barriers NO YES YES NO YES YES YES YES
Phytoremediation NO YES NO YES YES YES YES YES
Pump and Treat YES YES YES YES YES YES YES YES
Soil Vapor Extraction YES YES YES YES YES YES NO NA
Thermal Technologies NO YES YES YES YES YES YES NA
YES = the technology will work given this characteristic or this characteristic is not applicable to the technology NO = the technology will not work given this characteristic NA = the technology was identified as not applicable for nitrate in Table 3-1
57

• YES = the technology will work given this characteristic, or this characteristic is not applicable to the technology.
• NO = the technology will not work given this characteristic.
If a technology received a YES evaluation for all of the technical site-specific characteristics listed in Table 3-3, then a YES was recorded in the Attain Media Cleanup Standards location on Table 3-2. If a technology received a NO evaluation for one or more of the characteristics listed in Table 3-3, then a NO was recorded in the Attain Media Cleanup Standards location on Table 3-2.
The YES/NO evaluation for the peak historic TCE and nitrate concentrations technical site-specific categories listed in Table 3-3 apply only to the evaluation of either the TCE or nitrate category under the threshold criterion Attain Media Cleanup Standards in Table 3-2. For example, if a technology for the perched system received a NO evaluation under Peak historic nitrate concentration of 44 mg/L but a YES under Peak historic TCE concentrations 9.6 µg/L, and all of the other technical site-specific characteristics received a YES evaluation, then a YES was recorded for Attain Media Cleanup Standards for TCE and a NO was recorded for Attain Media Cleanup Standards for nitrate.
The third threshold criterion, Control the Source or Sources of Releases, was evaluated using characteristics of the potential release of contaminants presented in Section 1. Since the vapor phase TCE present in portions of the SNL/NM AOR vadose zone does not represent a continuing source of contaminants to the perched system, a NO for the third criterion was recorded for technologies designed to aggressively remediate or control a source zone.
The fourth threshold criterion, Waste Management Standards Compliance, was evaluated based on whether compliance with all applicable state or federal regulations could be met for all waste generated during the life cycle of the technology.
All technologies that received a YES evaluation for all threshold criteria passed this initial screening. These selected technologies will be carried forward for further evaluation in Section 4 to determine remedial alternatives for groundwater cleanup for the TAG SNL/NM AOR.
3.4 Initial Technology Screening Results
Based on the results of the initial screening of technologies conducted in Section 3.3, technologies are categorized as either eliminated technologies or applicable technologies. Eliminated technologies will no longer be considered and applicable technologies will be used in Section 4 to create remedial alternatives.
58
3.4.1 Eliminated Technologies
Technologies that did not meet all of the threshold criteria did not pass the initial screening. These technologies will be eliminated at this point and will not be considered for creating remedial alternatives in Section 4. An explanation of why each technology was eliminated is discussed below.
3.4.1.1 Source Control Technologies
ISCO, in situ flushing, monolithic confinement, nanoscale iron injection, and thermal technologies were all eliminated because they are aggressive technologies designed to target high concentrations of DNAPL/NAPL source zones and are not practical for remediation of low contaminant concentrations in groundwater. Monolithic confinement involves constructing barriers to confine groundwater contamination either by digging a trench or drilling boreholes. Construction of such a barrier around the TAG SNL/NM AOR perched system at greater than 330 ft bgs would be an extremely difficult task. Thermal technologies are generally applied as an aggressive removal of high concentrations in source areas. Injection of steam or generation of heat in situ is intended to increase volatilization and decrease viscosity of VOCs. The technology would not be an efficient method for treating the low concentrations of TCE in the perched system. In addition, of these aggressive source control technologies, only monolithic confinement would potentially address nitrate contamination.
3.4.1.2 Air Sparging
Air sparging is applicable for removing volatile chemicals from groundwater; however, it was determined that air sparging would not be able to remove TCE from the groundwater within the TAG SNL/NM AOR because of the insufficient gradient between the water and air phase due to the low concentrations of TCE. Therefore, it was determined that air sparging is not applicable for attaining media cleanup standards at the TAG SNL/NM AOR.
3.4.1.3 Permeable Reactive Barriers
A PRB would need to be constructed downgradient of each potential contaminant release site, or potentially at the downgradient portion of the perched system, in order to intercept contamination before it reaches the regional aquifer. Construction of such a barrier for the TAG SNL/NM AOR would be an extremely difficult task considering the areal extent of the perched system. Also, due to the depths to groundwater in the perched system (approximately 220 to 330 ft bgs) and the different small contaminant release sources located within the TAG SNL/NM AOR, this would make this technology difficult to implement. Therefore, it was determined that PRBs are not applicable at this site.
3.4.1.4 Phytoremediation
Phytoremediation is most applicable when the groundwater is within 10 ft of the surface. Implementation of this technology for the TAG SNL/NM AOR would be ineffective considering the depth to groundwater is approximately 220 to 330 ft bgs. In addition, the need for irrigation of plants in this arid environment is difficult. Therefore, it was determined that phytoremediation is not applicable at this site.
59
3.4.1.4 Soil Vapor Extraction
Soil vapor extraction is most applicable when contaminants are present in the vadose zone. Although this is the case for portions of the TAG SNL/NM AOR, vapor phase contaminants contribute minimal mass to the perched system (Section 1.4.3). Although soil vapor extraction may be effective at reducing vadose zone TCE concentrations, this would have little or no impact on the low levels of TCE contamination in the perched system because of the small concentration gradients between the aqueous and vapor phase. Since removal of vapor phase contaminants would have little impact on SNL/NM AOR groundwater, it was determined that soil vapor extraction would not attain media cleanup standards for the TAG SNL/NM AOR.
3.4.2 Applicable Technologies
Technologies that met all of the threshold criteria passed the initial screening. These technologies (or combinations of these technologies) will be used in Section 4 to determine remedial alternatives for groundwater cleanup for the TAG SNL/NM AOR.
Applicable technologies include:
• Groundwater monitoring,
• ISB,
• MNA, and
• Pump and treat (ex-situ treatment technology to be determined).
60
4.0 REMEDIAL ALTERNATIVE EVALUATION APPROACH
Technologies that passed the initial screening process in Section 3.0 are used to create remedial alternatives that include one or more technologies, as well as strategies for remedy implementation. Considerations of technology capabilities in relation to site-specific characteristics and cleanup goals were used to create a list of remedial alternatives. It was determined that ISB and pump and treat technologies would need to be followed by MNA or groundwater monitoring to ensure that cleanup goals are met. MNA allows additional time for natural attenuation mechanisms to further reduce the already decreased concentrations, and groundwater monitoring allows additional time to ensure that decreased concentrations will remain below MCLs. This section lists and describes each remedial alternative and includes the general description and approach to investigating and evaluating these potential remedies.
Upon selection of a preferred remedy, a contingency plan and institutional controls specific to implementation for groundwater cleanup at the SNL/NM AOR will be established. A contingency plan will be established to identify circumstances when the remedy will no longer effectively protect human health and the environment. At that point, the preferred remedy will be reevaluated and appropriate actions taken. Institutional controls will be established based on the characteristics of the implemented remedy for the SNL/NM AOR and in accordance with SNL/NM guidance. In August 2001, the DOE and SNL/NM, with input from the public, completed a draft “Long-Term Environmental Stewardship Plan” (SNL/NM 2001b). The outcome of the draft plan was a listing of issues that need resolution for the success of long-term environmental stewardship. These issues include the difficulties of maintaining institutional controls inherent in long-term groundwater monitoring. The DOE and SNL are continuing to work on the issues identified in the draft plan.
Initial screening of technologies, as conducted in Section 3.3, identified technologies that could be used for remediation of the SNL/NM AOR. The CME process usually involves combining individual technologies into potential remedial alternatives. However, in this case, it was determined that the various combinations of the four technologies resulted in remedial alternatives that were not distinct enough from each other to warrant listing them separately. Therefore, the four technologies that passed the screening are listed below; variations within each technology, including which contaminants will be treated and when transitions to other technologies will occur, will be developed during the paper study stage of the CME process:
1. Groundwater Monitoring
A groundwater monitoring remedy would track concentrations, distribution, and transport of TCE and nitrate during the remedial timeframe. A monitoring plan would be written, based on the TAG Investigation Work Plan (SNL/NM 2003a) and the TAG Continuing Investigation Report (SNL/NM 2002), to identify frequency and duration of sample collection and analysis from an adequate network of monitoring wells. A contingency plan would be developed that could be triggered by unacceptable increases in contaminant distribution and/or concentrations. . Implementation of groundwater monitoring could include either or both COCs (TCE and/or nitrate). In addition, groundwater monitoring could be implemented following a more active treatment such as those identified below.
61

2. Monitored Natural Attenuation (MNA).
Implementing MNA for TCE and/or nitrate would allow for attenuation of these contaminants in the subsurface to daughter products without active remediation. Prior to MNA implementation, characterization activities may be performed (e.g., identification of indigenous microorganisms and presence of nutrients and electron donors) to determine if intrinsic contaminant degradation is taking place in the subsurface. In addition, an understanding of contaminant transport and/or degradation will be developed, and numerical modeling may be used to predict contaminant transport to potential receptors. This understanding is the primary distinction between MNA and a groundwater monitoring remedy. Because of this, an MNA remedy may provide the basis for reducing the monitoring requirements (e.g., frequency or analytes) during the course of the remedy based on predicted performance or degradation. A contingency plan would be developed that could be triggered by unacceptable increases in contaminant distribution and/or concentrations. Implementation of MNA could include either or both COCs (TCE and/or nitrate). In addition, MNA could be implemented following a more active treatment such as those identified below.
3. In Situ Bioremediation (ISB).
An ISB remedy would be used to remediate TCE and/or nitrate. Following contaminant reduction, ISB would be followed by either MNA or groundwater monitoring. Anaerobic bioremediation techniques can include injection of an electron donor to increase activity of indigenous microorganisms to stimulate anaerobic degradation. TCE and nitrate reduction can occur in the absence of oxygen and the presence of an electron donor where TCE and nitrate can act as electron acceptors in the microbial respiration process. This results in ARD of VOCs to ethene and conversion of nitrate to nitrite and ultimately to nitrogen (N2).
4. Pump and Treat (Ex Situ Treatment to be Determined).
This remedy would begin with implementation of pump and treat for TCE and/or nitrate. Following concentration reduction, MNA or groundwater monitoring would be implemented for these contaminants to further reduce contaminant concentrations and ensure that sufficient degradation is taking place during the remedial timeframe. Various options for the ex situ treatment technology will be evaluated during the CME process.
The remedial alternative evaluation approach will involve continued screening of remedial alternatives based on the results of evaluation studies; details are presented in Section 5. The approach is intended to choose a remedy that is protective of human health and the environment. Studies can then focus on demonstrating remedy effectiveness and providing information needed to calculate design parameters. The CME threshold criteria, used in Section 3 during initial screening of technologies, will also be used to screen the remedial alternatives. Remedial alternative evaluation criteria derived from the requirements stated in the COOC (NMED 2004) will be used to quantitatively analyze remedy effectiveness and choose a preferred remedy (see Section 5.1).
62
5.0 REMEDIAL ALTERNATIVE EVALUATION PLAN
This Remedial Alternative Evaluation Plan provides guidance on activities and evaluation criteria to be used for evaluating the remedial alternatives presented in Section 4. This document presents the structure of the plan; details of the evaluation will be presented in the CME Report. The Remedial Alternative Evaluation Plan includes a plan description, evaluation criteria, and potential activities for remedy evaluation that can be carried out to gather data. It is intended that the remedy implemented at the TAG SNL/NM AOR will reduce COC concentrations throughout the perched system to below MCLs within a remedial timeframe to be established in the Corrective Measures Implementation Work Plan. This evaluation will lead to the recommendation for implementation of the preferred remedial alternative as the corrective measure for the TAG SNL/NM AOR.
5.1 Plan Description
The remedial alternative evaluation will include activities conducted to gather and evaluate data for each remedy using threshold and remedial alternative evaluation criteria. The remedial alternative evaluation will be conducted in such a way as to optimize data gathering activities. Evaluation of data will be ongoing during data gathering to screen any remedial alternative that does not meet the evaluation criteria.
Data gathering activities will be carried out in a staged process beginning with a paper study (Stage 1). In addition to paper studies, data gathering activities may include numerical modeling (Stage 2), laboratory studies (Stage 3), and field scale studies (Stage 4). These activities will provide site-specific data necessary to evaluate the remedies, provide a recommendation, and calculate design parameters. Each of these studies will only be performed as necessary to provide relevant site-specific data. A description of each stage is as follows:
• Stage 1 – Paper Study. A paper study will be conducted to evaluate the current literature and use existing data to calculate or demonstrate the potential cost and effectiveness of the chosen remedy(s). A literature review has already been performed to provide information necessary for the initial technology screening described in Section 3. However, the paper study will be used to evaluate the remedial alternatives according to the remedial alternative evaluation criteria. Information in the current professional literature and from experience with the technologies will be combined with the site characteristics to create a conceptual design of each remedy. The conceptual design will be used to create initial cost estimates and secondary waste generation estimates. When conducting cost estimates, appropriate timeframes for the technologies within a remedy will be considered (e.g., a short pump and treat timeframe combined with a long MNA timeframe is more appropriate for a cost estimate than considering a long pump and treat timeframe combined with a short MNA timeframe). Costs will be estimated and effectiveness evaluated for application of this conceptual design.
• Stage 2 – Numerical Modeling. Numerical modeling may be conducted to predict contaminant fate and transport. If it is demonstrated during the paper study that a remedy is obviously not applicable, it will not be considered in the numerical modeling study. Data obtained during any laboratory or field scale studies will be used to refine the model. The predictions will account for the effects of each remedial alternative application. This will refine the conceptual model and prediction of the time necessary to comply with remedial action objectives for each remedy.
63

• Stage 3 – Laboratory Studies. Laboratory studies will be conducted if the paper study results suggest a potential for remediation performance improvement or cost savings, but with uncertainties remaining that can be addressed through laboratory testing. Laboratory investigations will be designed to verify initial evaluation assumptions (i.e., reaction rates, mass balance, etc.), refine lifecycle costs and evaluate potential savings over base case costs, and provide data for field demonstration design or conceptual full-scale design.
• Stage 4 – Field Scale Studies. If previous stages indicate that they are needed, field scale studies will provide two significant pieces of information: 1) verification that the performance projections calculated in the Stage 1, 2, or 3 results are accurate and 2) collection of treatment system performance data to support full-scale design. Prominent activities at this stage include obtaining design and cost data for full-scale performance based upon field demonstration of the technology.
Anticipated data gathering activities are detailed in Section 5.3. However, it is important to note that these activities may not be necessary because of the staged elimination process that will be used. Also, studies that are not included in this Work Plan may be necessary as additional data gaps are identified.
5.2 Evaluation Criteria
The purpose of the evaluation criteria is to provide a method for comparing the data gathered for each remedial alternative. Evaluation criteria will be used, as specified in the COOC (Section VII.C.3, CME Criteria [NMED 2004]). The remedial alternative evaluation will select the best remedy for implementation as the corrective measure at the TAG SNL/NM AOR. During the evaluation, each remedial alternative will be evaluated based on the threshold criteria and the remedial alternative evaluation criteria identified here. Evaluation of the remedial alternative evaluation criteria will be a quantitative evaluation, while evaluation of threshold criteria will be qualitative. Remedial alternative evaluation criteria will be assigned a numerical value, which will be detailed in the CME Report. If a remedy does not meet a threshold criterion, it will be eliminated. If a remedy is significantly less effective than other remedies based on the remedial alternative evaluation criteria, it will also be eliminated.
5.2.1 Threshold Criteria
Threshold criteria were used in the initial evaluation to screen out technologies that cannot be implemented at the TAG SNL/NM AOR (see Section 3). All of the technologies used to create the remedial alternatives met the threshold criteria. However, site-specific data gathered during the remedial alternative evaluation may demonstrate that a remedial alternative cannot reasonably meet one or more of the threshold criteria. Therefore, each remedial alternative will be evaluated following each data gathering activity to ensure that it can meet the threshold criteria. The following threshold criteria will be evaluated:
Protective of human health and the environment. Any proposed remedy must be protective of human health and the environment. As stated in the RCRA Corrective Action Plan, “Remedies may include those measures that are needed to be protective, but are not directly related to media cleanup, source control, or management of wastes”
64

(EPA 1994). Components of remedies considered for the TAG SNL/NM AOR include evaluating protection of human health and the environment for air emissions, potential formation of hazardous degradation products, any hazards associated with operations and maintenance of the remedy, and remediation within an appropriate timeframe.
Attain media cleanup standard or alternative, approved risk-based cleanup goals. Any proposed remedy must attain groundwater cleanup standards or goals. As stated in the RCRA Corrective Action Plan, “Remedies will be required to attain media cleanup standards set by the implementing agency, which may be derived from existing state or federal regulations (e.g., groundwater standards) or other standards. The media cleanup standards for a remedy will often play a large role in determining the extent of, and technical approaches to, the remedy” (EPA 1994). The cleanup goals and objectives for the TAG SNL/NM AOR are described in Section 2. If a remedy cannot meet any one of these goals or objectives, it should no longer be considered.
Control the source or sources of releases so as to reduce or eliminate, to the extent practicable, further releases of contaminants that may pose a threat to human health and the environment. Any proposed remedy must control the original source of the contamination in order to prevent any further releases. As stated in the RCRA Corrective Action Plan, “Unless source control measures are taken, efforts to clean up releases may be ineffective or, at best, will essentially involve a perpetual cleanup” (EPA 1994). According to Section 1.4.3 of this report, source control is not a required component of the SNL/NM AOR. Therefore, corrective measures and any technologies designed for source zone control or remediation are not needed.
Comply with standards for management of wastes. Any proposed remedy must comply with all applicable state or federal regulations. As stated in the RCRA Corrective Action Plan, “Waste management activities will be conducted in compliance with all applicable state or federal regulations (e.g., closure requirements, land disposal restrictions)” (EPA 1994). For remedies considered for the TAG SNL/NM AOR, waste could be generated during the life cycle of the remedy in the form of contaminated groundwater brought to the surface, laboratory and field sampling wastes, and at the completion of the remedy during final decommissioning of the remedy system.
The threshold criteria will be evaluated using a matrix similar to the example in Table 5-1. Evaluation will be conducted on a YES/NO basis. A remedy will be eliminated if a NO evaluation is given for any of the criteria.
5.2.2 Remedial Alternative Evaluation Criteria
Remedial alternative evaluation criteria will be evaluated for each remedy. A summary of this comparison will be included in a matrix, as shown in the example in Table 5-2. Numerical values will be assigned to each criterion for the factors that are described in the following sections. These remedial alternative evaluation criteria will be evaluated several times following data gathering activities. If at any time it is determined that a remedy is significantly less effective than the other remedies, then it will no longer be considered. The criteria and considerations for evaluating each remedy are described below.
65

Table 5-1. Example remedial alternative evaluation using the COOC threshold criteria.
Remedial Alternatives
Protective of Human Health
and Environment
Attain Media Cleanup
Standards
Control the Source or Sources of
Release
Waste Management
Standards Compliance
Groundwater Monitoring
Monitored Natural Attenuation (MNA)
In Situ Bioremediation (ISB)
Pump and Treat (Ex Situ Treatment to be Determined)
YES = the remedy meets the threshold criterion NO = the remedy does not meet the threshold criterion
Table 5-2. Example CME evaluation using the COOC corrective measures remedial alternative evaluation criteria.
Remedial Alternatives
Long-Term Reliability
and Effectiveness
Reduction of Toxicity,
Mobility, or Volume
Short-Term Effectiveness
Feasibility Cost
Groundwater Monitoring
Monitored Natural Attenuation (MNA)
In Situ Bioremediation (ISB)
Pump and Treat (Ex Situ Treatment TBD)
66
• Long-term reliability and effectiveness. In general, this criterion will evaluate the reliability of the remedy to meet cleanup standards and reduce risk. As stated in the COOC, “Each remedy shall be evaluated for long-term reliability and effectiveness. This factor includes consideration of the magnitude of the risks that will remain after implementation of the remedy; the extent of long-term monitoring or other management that will be required after implementation of the remedy; the uncertainties associated with leaving contaminants in place; and the potential for failure of the remedy. A remedy that reduces risks with little long-term management, and that has proven effective under similar conditions, shall be preferred” (NMED 2004). This criterion will include defining the institutional controls to be established for the TAG SNL/NM AOR for each remedy.
• Reduction of toxicity, mobility, or volume. This criterion is intended to evaluate the effectiveness of the remedy at reducing TCE and nitrate concentrations in the TAG SNL/NM AOR. As stated in the COOC, “Each remedy shall be evaluated for its reduction in the toxicity, mobility, and volume of contaminants. A remedy that more completely and permanently reduces the toxicity, mobility, and volume of contaminants shall be preferred” (NMED 2004).
• Short-term effectiveness. In general, short-term effectiveness applies to the ability of the remedy to reduce risks during the remediation process. These risks include reducing exposure to contaminants during remedy implementation and risks and hazards introduced by remedy implementation. As stated in the COOC, “Each remedy shall be evaluated for its short-term effectiveness. This factor includes consideration of the short-term reduction in existing risks that the remedy would achieve; the time needed to achieve that reduction; and the short-term risks that might be posed to the community, workers, and the environment during implementation of the remedy. A remedy that quickly reduces short-term risks, without creating significant additional risks, shall be preferred” (NMED 2004).
• Feasibility. As stated in the COOC, “Each remedy shall be evaluated for its feasibility, or the difficulty of implementing the remedy. This factor includes consideration of installation and construction difficulties; operation and maintenance difficulties; difficulties with cleanup technology; permitting and approvals; and the availability of necessary equipment, services, expertise, and storage and disposal capacity. A remedy that can be implemented quickly and easily and poses fewer and lesser difficulties shall be preferred” (NMED 2004).
• Cost. As stated in the COOC, “Each remedy shall be evaluated for its cost. This factor includes a consideration of both capital costs and operation and maintenance costs. Capital costs shall include, without limitation, construction and installation costs; equipment costs; land development costs; and indirect costs including engineering costs, legal fees, permitting fees, startup and shakedown costs, and contingency allowances. Operation and maintenance costs shall include, without limitation, operating labor and materials costs; maintenance labor and materials costs; replacement costs; utilities; monitoring and reporting costs; administrative costs; indirect costs; and contingency allowances. All costs shall be calculated based on their net present value. A remedy that is less costly, but does not sacrifice protection of health and the environment, shall be preferred” (NMED 2004).
67

5.3 Potential Activities for Remedy Evaluation
In order to identify potential study needs for inclusion in this Work Plan, a preliminary evaluation of the data needs was performed. Both the threshold and the remedial alternative evaluation criteria were considered. Paper, numerical modeling, laboratory, and field scale studies, as discussed in Section 5.1, were derived to answer the data needs that are necessary to evaluate each remedy. These stages are described in greater detail in the following sections. Following each stage, the data will be reevaluated to eliminate remedial alternatives that are not feasible or are ineffective to determine which studies will need to be carried out in the next stage. It is important to note that each stage of studies will be performed only if necessary considering the results of the ongoing evaluation process. Results of the studies will be used to evaluate each remedial alternative and calculate design parameters for corrective measure implementation.
5.3.1 Stage 1 – Paper Study
The data gathering activities will begin with a paper study. Information about each remedy and the site will come from professional literature, site characterization (TAG Investigation Work Plan [SNL/NM 2003a]), and professional experience. This information will be used to evaluate each remedy for each of the threshold criteria and each of the remedial alternative evaluation criteria discussed in Section 5.2. The following is a list of example calculations or evaluations:
• The risk of remedy failure can be evaluated by searching the professional literature and professional experience for application of the remedy to a site with similar contaminant concentrations and subsurface conditions. If the remedy has proven effective at a similar site, then it will be rated high depending on the weight of evidence. If application of the remedy at another site with similar characteristics suggests that the remedy would fail or be marginally successful, then the remedy will be rated accordingly.
• A conceptual design of each remedial alternative will be devised using site-specific and remedy-specific information. The conceptual design will include a description of how proposed treatment mechanisms will work. It can include a description of planned construction, operations, and monitoring and will include the operation timeframe of each technology that is part of the overall remedy.
• Capital costs and operations and maintenance costs will be estimated for each remedy. For instance, the cost estimates for MNA will include cost of possible construction of new monitoring wells, periodic groundwater monitoring, data reduction, and modeling. The cost for ISB followed by MNA will include all of these costs, with the additional cost of construction, operation, maintenance, and materials.
• The timeframe and magnitude of institutional controls will be evaluated based on risks to human health and the environment associated with both the short-term effectiveness and long-term reliability and effectiveness of the remedy. Institutional controls associated with long-term reliability and effectiveness can be evaluated by considering the risks remaining after remedy implementation and the extent of long-term monitoring or other management required for the remedy. Overall institutional control requirements for any long-term action will be defined in the CME Report. Some of these institutional controls will be the same for all remedial alternatives. Remedy-specific institutional controls will be identified in the paper study.
68
• Secondary waste stream production will be calculated based on knowledge of each remedy and site-specific characteristics. For instance, the secondary waste stream for MNA would only include waste generated during sampling. Secondary waste for pump and treat followed by MNA would include sampling wastes as well as wastes generated during treatment. Treatment wastes would be calculated considering observed COC concentrations and estimated total volume to be treated. Difficulty dealing with the phase of the waste stream will depend on the type of treatment.
It is anticipated that the paper study will provide much of the information necessary to evaluate the remedial alternatives. The data necessary to answer the remaining questions are referred to as data gaps. The studies described below for Stages 2, 3, and 4 may be performed for those remedies that pass the paper study evaluation.
5.3.2 Stage 2 – Numerical Modeling
Numerical modeling will consider those remedies that passed the evaluation following the Stage 1 paper study. Additional information may be needed to adequately determine the fate and transport of contaminants in groundwater for the TAG SNL/NM AOR, especially regarding contaminant transport to downgradient receptors. SNL/NM has performed numerical modeling that included the greater TAG study area. This included particle tracking for estimating groundwater travel times and the capture zones of groundwater supply wells in the regional system only. The particles were released in the regional system directly below the perched system. Results showed that the fastest particles had travel times of between 34 and 59 years when they reached production well KAFB-3, while particles took between 41 and 68 years to reach Ridgecrest wells (SNL/NM 2002). On the southeastern side of Tijeras Arroyo, the particles released in this location were not captured by the production wells by the end of the model run (year 2100) because of the lower hydraulic conductivity of the alluvial fan lithofacies.
In terms of the TAG SNL/NM AOR, this analysis did not include travel time of a parcel of water through the perched system since the model included only the regional system. In order for particles within the TAG SNL/NM AOR to reach downgradient receptors, they would have to travel through the perched system, to the merging zone, and then into the regional system. Obviously, any travel times for these particles would be in addition to those predicted for the particles released in the regional system during these simulations. The merging zone between the perched and regional systems is thought to be southeast of TA-II and TA-IV. Given that predicted travel times from the regional system in this area are in excess of 90 years, and that particles must travel through some portion of the perched system in order to reach the regional system, it is extremely unlikely that contaminants in the perched system will reach downgradient receptors. Despite this, it is possible that the paper study stage will reveal the need to perform additional numerical modeling, perhaps to more specifically target the perched system.
5.3.3 Stage 3 – Laboratory Studies
The preliminary identification of data gaps demonstrated that laboratory studies would only be performed for remedies involving ISB if those remedies pass the paper study evaluation and it is determined that a field study cannot be completed without laboratory investigations. Laboratory microcosm studies may be necessary to verify that conditions are conducive in the aquifer for effective ISB. TCE and nitrate are known to degrade to less toxic products under anaerobic
69

conditions. Certain site-specific conditions are necessary for complete degradation of both TCE and nitrate. Examples include the presence of the proper microbial community and geochemical conditions required for degradation of these contaminants.
One way to evaluate the degradative potential of the indigenous microbial community is through microcosm studies. These studies would consist of electron donor amended microcosms prepared and maintained under controlled anaerobic conditions using appropriate TCE- and nitrate-impacted groundwater samples from the site. The microcosms would be monitored for TCE, dechlorination daughter products, and electron donor degradation products. Results of the microcosm studies will demonstrate whether the indigenous microbial community has the ability to completely dechlorinate TCE or if the microbial community only has the ability to degrade TCE to cis-DCE. The studies can also be used to determine the ability of the microbial community to degrade nitrate and how this process affects TCE degradation. The laboratory studies will also provide information relevant to a field scale test (i.e., dechlorination and denitrification rates).
5.3.4 Stage 4 – Field Scale Studies
Field scale studies or demonstrations may be performed to verify predictions obtained from the paper studies, numerical modeling, and/or laboratory studies. These field scale demonstrations would be used to verify MNA, ISB, and pump and treat effectiveness at the site.
5.3.4.1 Characterization activities
The TAG Investigation Work Plan (SNL/NM 2003a) has identified several characterization activities for the greater TAG study area that are currently being implemented. These activities include additional groundwater monitoring and soil vapor sampling at various locations throughout the greater TAG study area. Although these activities are not directed by nor conducted as a part of this CME, the data generated during these activities will be used to support this CME as appropriate.
5.3.4.2 Investigating natural attenuation mechanisms (MNA):
In order to establish that natural attenuation of COCs in the TAG SNL/NM AOR will occur, mechanisms for contaminant degradation need to be established. In order to do this, additional sampling may be conducted to fill data gaps in historical data to complete a biodegradation assessment, as defined by the Technical Protocol for Evaluating Natural Attenuation of Chlorinated Solvents in Ground Water (EPA 1998), and for an assessment of the potential for nitrate biodegradation.
5.3.4.3 Electron donor injection field demonstration (ISB):
A field scale demonstration of ISB will be performed if it is necessary to demonstrate the ISB effectiveness at reducing concentrations of TCE and/or nitrate at the site. Paper studies and laboratory microcosm studies may be sufficient to demonstrate that a remedial alternative involving ISB may be the most effective remedy. However, a field scale demonstration will be necessary to confirm ISB effectiveness at the site and calculate design parameters. Site-specific data will be necessary for long-term corrective measures planning. A field demonstration would have the following objectives:
70
• Estimate ARD and/or denitrification rates in the field and provide an estimated timeframe,
• Determine the fate of contaminants and degradation products,
• Determine the extent of electron donor transport compared to the distribution of contaminants,
• Determine the effect of competing electron acceptors, and
• Determine the extent of COC concentration rebound after donor injections have ceased.
5.3.4.4 Aquifer/hydraulic testing
Much of the data necessary to evaluate remedial alternatives involving pump and treat can be estimated during the paper study and numerical modeling exercises using the existing information about aquifer parameters. However, demonstration of pump and treat performance for application in a corrective measure will require site-specific well data. Conducting an aquifer test including existing or proposed pumping wells could provide these data. Objectives of such an aquifer test would be:
• Estimation or verification of predicted capture zones and comparison to the contaminant distribution, and
• Obtaining well yield information to estimate treatment volumes.
In addition, activities could be performed to gather additional information about hydraulic conductivity and/or groundwater velocities to support evaluation of any of the remedial alternatives or to improve numerical modeling predictions.
71

6.0 CORRECTIVE MEASURES EVALUATION REPORT
The results of the CME will be presented in the CME Report. This report will provide the technical basis for any recommendation for implementation of a corrective measure and will include technical and functional requirements for remedy implementation. This report will serve to document the regulatory agreements and will serve as the regulatory basis for the implementation of the corrective measure. The key components of the CME Report are designated requirements from the COOC (NMED 2004). Guidelines of the RCRA Corrective Action Plan (EPA 1994) were also considered. The following is an outline of the key components of the CME Report:
I. Title Page and Signature Block
II. Executive Summary
III. Table of Contents
IV. Figures
V. Tables
VI. Introduction/Purpose
VII. Background Information
VIII. Site Conditions:
a. A summary of surface, subsurface, and groundwater conditions as appropriate.
b. A brief summary/discussion of any new information since the field investigation.
IX. Potential Receptors:
a. Including discussion of sources, pathways, and receptors.
X. Regulatory Criteria
XI. Identification of Corrective Measures Options:
a. Identification.
b. Screening.
XII. Evaluation of Corrective Measures Options:
a. Overview of the evaluation criteria and approach.
b. Presentation of evaluation results.
XIII. Selection of a Preferred Corrective Measure:
a. Demonstrate that the corrective measure will protect human health and the environment.
b. Demonstrate that the corrective measure will attain media cleanup standards.
c. Demonstrate that the corrective measure will comply with any applicable standards for waste management.
d. Demonstrate that the corrective measure is effective in other factors.
XIV. Design Criteria to Meet Cleanup Objectives
XV. Schedule
XVI. Appendices.
72

7.0 PROJECT MANAGEMENT PLAN
This section presents the Project Management Plan for the TAG SNL/NM AOR. This includes the overall approach, the project organizational structure, project schedule and deliverables, project budget, and the project assumptions.
7.1 Project Approach
The corrective measures process that is being undertaken for the TAG SNL/NM AOR, by requirement of the COOC (NMED 2004) and under the direction of the RCRA Corrective Action Plan (EPA 1994), is a phased approach illustrated in Figure 7-1. This approach will be used to determine and implement the selected remedy as the corrective measure for meeting the cleanup standards, objectives, and requirements. The process includes the following four steps:
1. Defining the problem (CME Work Plan),
2. Remedy evaluation (CME Report),
3. Long-term corrective measures planning (Corrective Measures Implementation Plan), and
4. Corrective measures implementation (Corrective Measures Implementation Report).
Following each step will be a decision point to obtain concurrence from the regulatory agencies before proceeding with the next phase of the process.
In conjunction with the TAG Investigation Work Plan (SNL/NM 2003a), this CME Work Plan is represented in Figure 7-1 under the problem definition step. Following agency approval of this CME Work Plan, the CME will proceed. The CME will result in recommendations for the corrective measure, which will be presented in the CME Report.
This process will define the cleanup approach and document understandings and agreements between SNL/NM and the regulatory agencies regarding corrective measure execution. The approach being developed will determine the most cost- and schedule-effective corrective measure that can gain public and regulatory acceptance. An important aspect of this approach, and an objective of this Work Plan, is outlining and defining all of the goals, objectives, requirements, and other criteria that must be addressed in order to design and implement a corrective measure. It is likely that the team of regulators and technical staff that developed the cleanup approach will change during the corrective measure timeframe. For continuity in achieving the project goals and objectives, well-documented requirements and implementation strategies will help future parties execute the cleanup approach in the manner envisioned by the initial project team. The overall goal of developing this document base is to provide clear direction for implementing and attaining the regulatory standards, periodic reporting requirements, and the scope, schedule, and budget, with all leading toward site closure in accordance with pre-determined requirements.
73

Define Problem
Prepare CorrectiveMeasures Evaluation
Work Plan
Develop RegulatoryClean-Up
Requirements, Goals,and Objectives
Develop Detailed Planfor Final Evaluation
Compile DraftCorrective MeasuresEvaluation Work Plan
Conduct Evaluation
Remedy N1 Remedy N2 Remedy N3
Corrective MeasuresEvaluation Report
AgencyDecision Point
AgencyDecision Point - Agree with recommendations/conclusions for a Corrective Action
Alternative RemedyEvaluation
Identify PotentialClean-Up
Technologies
Perform ThresholdScreening and
Develop AlternativeRemedies
Evaluate TAG site
Review CurrentConceptual Model
- Agree that clean-up requirements, goals, and objectives areadequately defined- Agree to the Corrective Measures Evaluation Work Plan
Definingthe
Problem
RemedyEvaluation
Figure 7-1. Logic diagram.
74
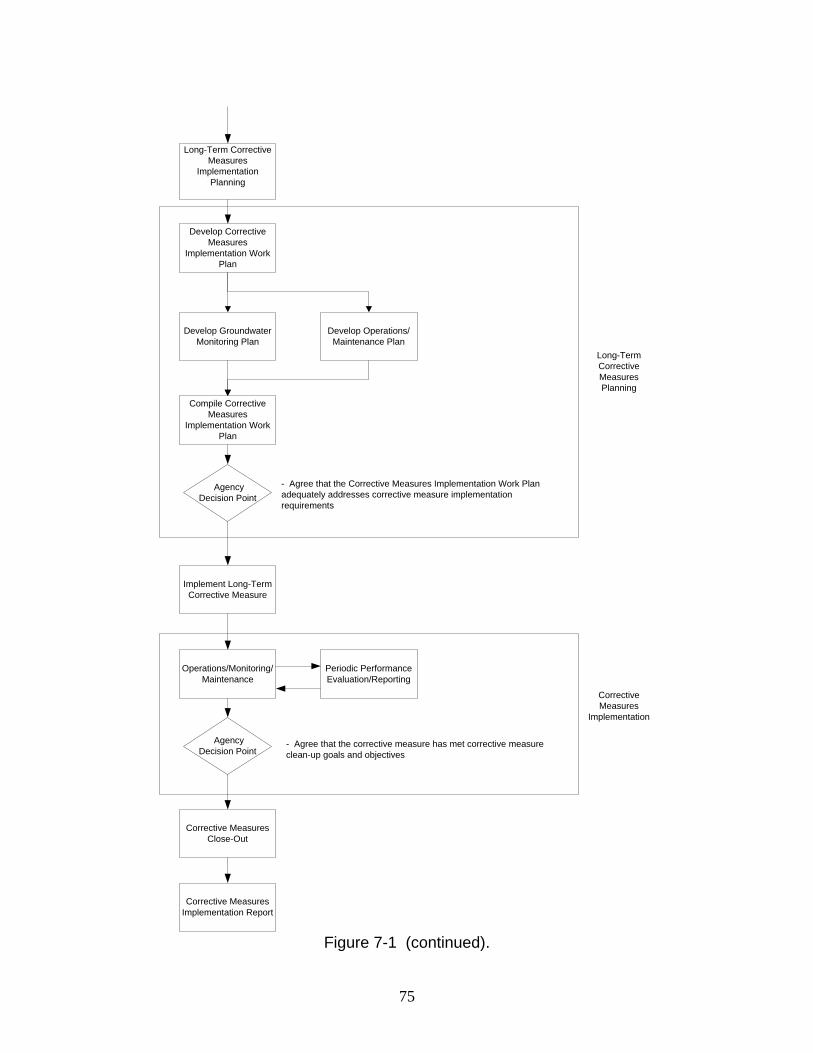
Long-Term CorrectiveMeasures
ImplementationPlanning
Develop CorrectiveMeasures
Implementation WorkPlan
Develop GroundwaterMonitoring Plan
Develop Operations/Maintenance Plan
Compile CorrectiveMeasures
Implementation WorkPlan
AgencyDecision Point
Implement Long-TermCorrective Measure
AgencyDecision Point
Corrective MeasuresClose-Out
Operations/Monitoring/Maintenance
Periodic PerformanceEvaluation/Reporting
- Agree that the Corrective Measures Implementation Work Planadequately addresses corrective measure implementationrequirements
- Agree that the corrective measure has met corrective measureclean-up goals and objectives
Long-TermCorrectiveMeasuresPlanning
CorrectiveMeasures
Implementation
Corrective MeasuresImplementation Report
Figure 7-1 (continued).
75

76
It is important throughout this process to maintain a strong relationship between the team (i.e., technical, regulatory, and the public). An important part of this process consists of scheduled reviews and communication with the regulatory agencies and other pertinent stakeholders to develop a common understanding of the desired outcome of the CME.
7.2 Organizational Structure
Figure 7-2 presents the organizational structure for the SNL/NM AOR CME. The primary functional entities of this project are the Sandia Groundwater Project Leader, the Agency, the CME Implementation Team, Site Technical and Field Services, and the Technical Peer Review Panel.
The Sandia Groundwater Project Leader is responsible for the overall project (i.e., scope, schedule, and budget). This position is responsible to implement the COOC (NMED 2004) for the TAG SNL/NM AOR and to meet regulatory requirements, milestones, and objectives. This position also serves as an interface between the CME Implementation Team, Site Technical and Field Services, and the Agencies. The Sandia Groundwater Project Leader identifies and acquires technical and operational resources to complete the project scope.
NMED is the regulatory agency responsible for enforcing the requirements identified in the COOC (NMED 2004) for this CME. The DOE owns and operates SNL/NM and Sandia Corporation is the co-operator of SNL/NM.
The CME Implementation Team reports to the Sandia Groundwater Project Leader and works with technical support personnel. The primary function of the CME Implementation Team is to lead the screening and evaluation of potential technologies and remedial alternatives that will meet cleanup standards for SNL/NM AOR groundwater. This includes execution of individual technical tasks, as well as overall responsibility for the technical direction of the project. The CME Implementation Team is responsible for interpreting all technical data and for making decisions based on these interpretations.
Technical support personnel will report to the Sandia Groundwater Project Leader and work with the CME Implementation Team. They are responsible for performance and oversight of all onsite field activities that are conducted in support of the SNL/NM AOR CME. This may include groundwater monitoring and analysis, well installation, data compilation, and report writing. Technical support personnel also provide site historical and process knowledge as it pertains to this CME.
A Technical Peer Review Panel may be utilized to ensure that the project is executed in the most technically rigorous and defensible manner possible. This panel, comprised of recognized experts in the field of groundwater characterization and remediation, would be used to review work plans, technical documents, and project reports. The members of the panel may also serve as technical resources for other members of the project team.
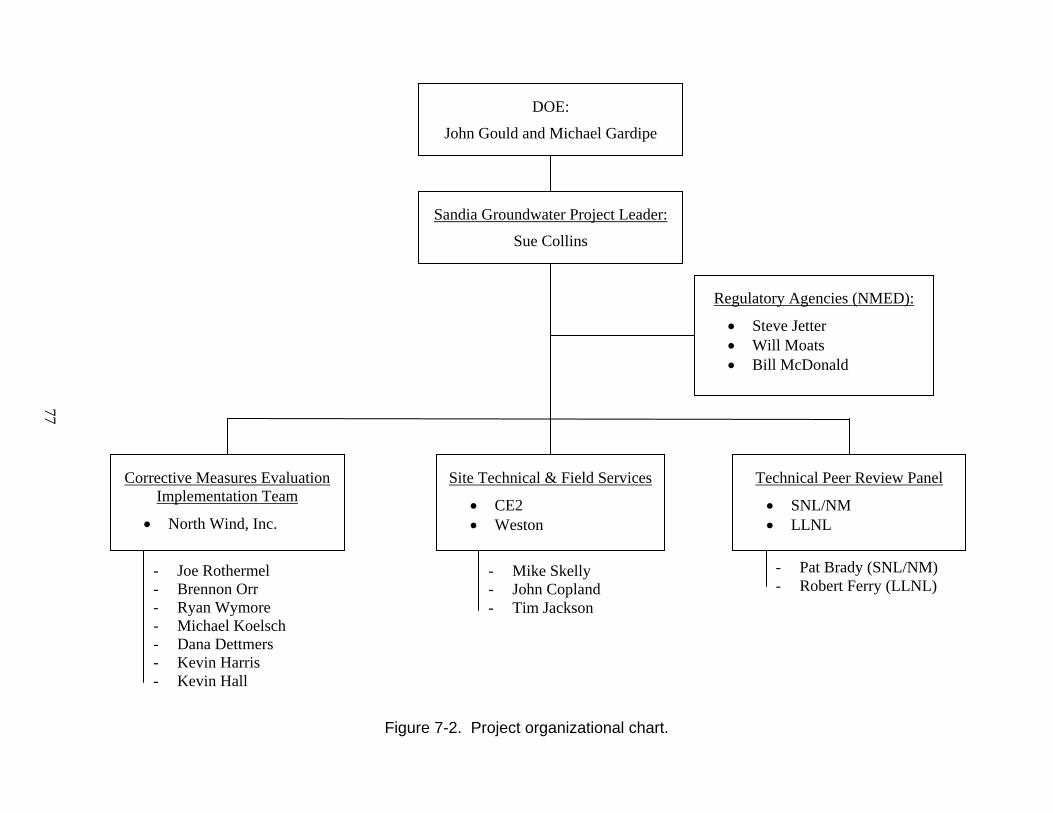
- Mike Skelly - John Copland - Tim Jackson
Corrective Measures Evaluation Implementation Team
• North Wind, Inc.
Site Technical & Field Services
• CE2 • Weston
- Joe Rothermel - Brennon Orr - Ryan Wymore - Michael Koelsch - Dana Dettmers - Kevin Harris - Kevin Hall
- Mike Skelly - John Copland - Tim Jackson
- Pat Brady (SNL/NM) - Robert Ferry (LLNL)
Technical Peer Review Panel
• SNL/NM • LLNL
Regulatory Agencies (NMED):
• Steve Jetter • Will Moats • Bill McDonald
Sandia Groundwater Project Leader:
Sue Collins
DOE:
John Gould and Michael Gardipe
Figure 7-2. Project organizational chart.
77

78
7.3 Schedule
The corrective measures schedule has been derived through development of the project requirements. The basis for the schedule is the logical development of project tasks and activities, which will support the corrective measure under the COOC (NMED 2004). This schedule will include corrective measure commitments, milestones, and NMED decision points. Certain documents require NMED review and approval. These documents are identified deliverables, which are identified within the project schedule as such, and have clearly defined agency review/comment and comment resolution periods.
7.3.1 Description
The corrective measures schedule is presented in Figure 7-3. This schedule identifies the logical progression of tasks and activities aimed at achieving the corrective measures cleanup objectives. This schedule covers development of site characterization knowledge, delineation and preparation of the corrective measures work plan, technology development and evaluation, the corrective measures report, and development and implementation of the corrective measure. It also includes activities being conducted under the TAG Investigation Work Plan (SNL/NM 2003a), which are being conducted in parallel to this CME.
The project schedule has been developed to expedite project execution performance to meet enforceable milestone commitments. As such, the schedule indicates planned and enforceable execution dates. The enforceable dates are those set by the COOC (NMED 2004) for the completion of certain aspects of the project. The planned completion dates are not enforceable, but are the dates by which the project will endeavor to execute the work. The planned dates are usually 1 to 2 months ahead of the actual corresponding enforceable date.
7.3.2 Deliverables
The documents to be submitted to the Agencies as deliverables, with the corresponding submittal dates in accordance with the COOC requirements (NMED 2004), are presented in Table 7-1. Additional documents and delivery dates may be identified in subsequent documents as the work progresses. The schedule may be revised from time to time to reflect these changes.
Table 7-1. Agency deliverable documents.
Deliverable Planned
Submittal Date Enforceable
Submittal Date Agency
Review Duration
Current Conceptual Model
9/29/05 9/29/05 30 days
CME Work Plan1 7/16/04 7/30/04 30 days
CME Report 8/4/05 9/30/05 44 days
Corrective Measures Implementation Plan
4/17/06 9/29/06 38 days
1: 90 days after signing the COOC (NMED 2004).
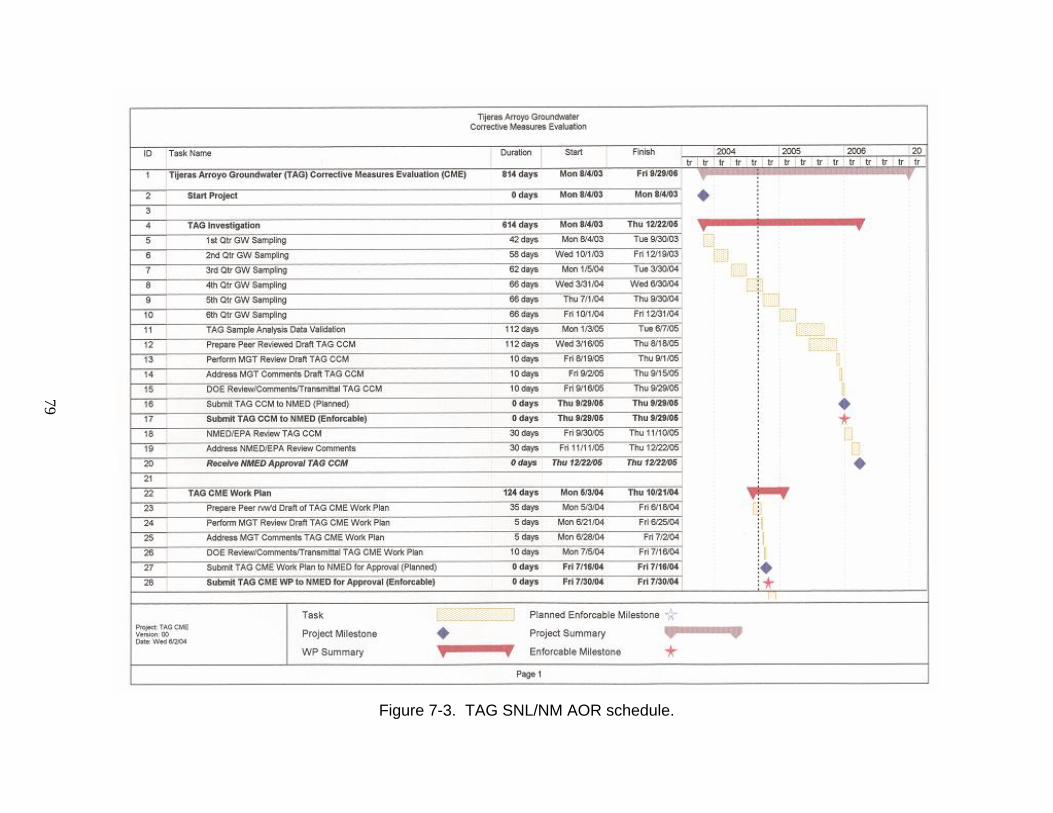
79
Figure 7-3. TAG SNL/NM AOR schedule.
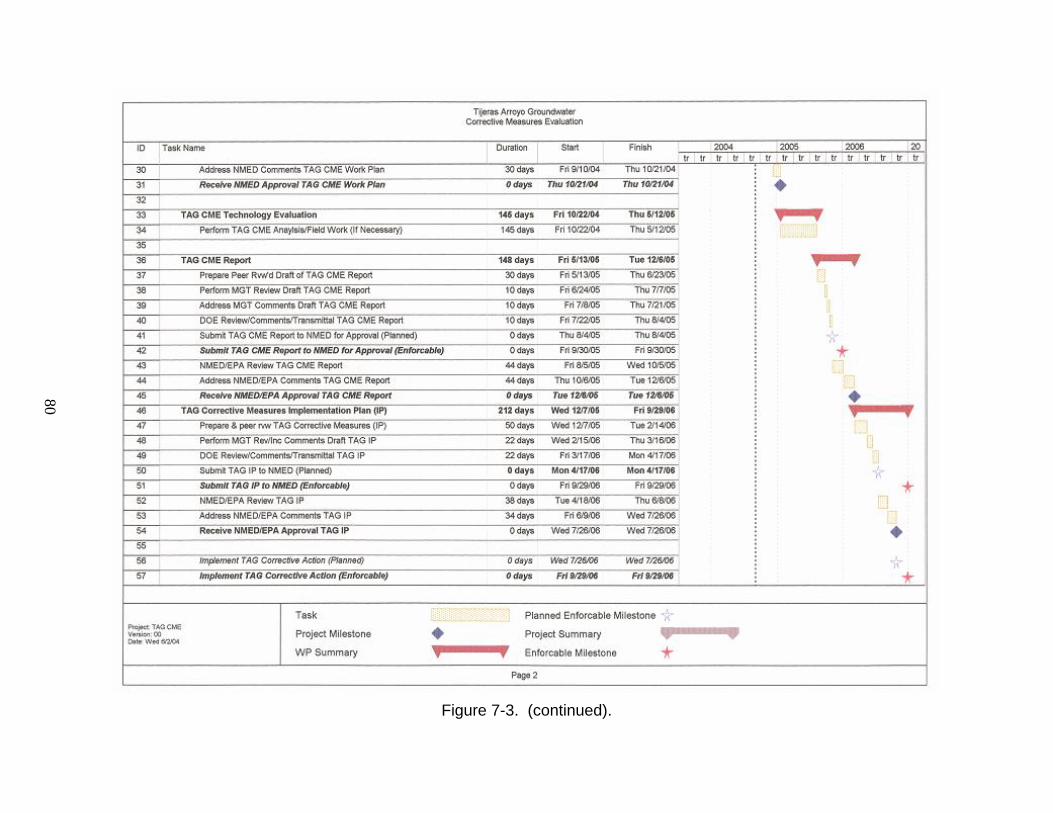
Figure 7-3. (continued).
80

7.4 Budget
Table 7-2 presents the current TAG budget, based on the SNL/NM ER Project Life-Cycle Baseline calculated to 2070 and approved through 2006. It is broken down by project management activities, technology evaluation costs, and site technical services for Fiscal Year (FY) 2004 through FY 2006. A lump sum that assumes an FY 2006 implementation of the final corrective measure is presented for long-term operations.
Table 7-2. TAG CME budget.
Category Timeframe
(Fiscal Year) Amount
($) Overall Project Management (Sandia Project Office Costs)1
2004 through 2006 386,000
Technology Evaluation (Current Conceptual Model, CME Work Plan, Evaluation, Implementation Documents)1
2004 through 2006 546,000
Site Technical Services (Field Sampling, Peer Review, etc.)1
2004 through 2006 1,261,000
Long-Term Operations2 2007 through 2070 (lump sum based on 2006
CME implementation)
18,192,000
1. Based on the SNL/NM ER Project Life-Cycle Baseline calculated to 2070 and approved through 2006. 2. Currently based on groundwater monitoring operations, but will require re-baselining based on outcome of the
CME.
7.5 Assumptions
The TAG SNL/NM AOR groundwater project is managed as part of the SNL/NM ER project. The funding targets listed above depend on funding for the entire ER project. As such, the relevant assumptions for the entire ER project, as well as those for the SNL/NM AOR, are listed below.
7.5.1 General Assumptions
ER program assumptions are as follows:
• The ER project mission, objective, and scope are stable and will proceed as represented by the project documents delivered to the DOE and the baseline from FY 2004 through FY 2006,
• SNL/NM and DOE management will support ER project management as necessary to meet project and regulatory objectives, as described in the project documents developed under the COOC (NMED 2004) and delivered to DOE,
• The current DOE working and teaming relationships with SNL/NM will be maintained and streamlined to conform with implementation of the project goals, and
• No catastrophic events will occur that would significantly delay the project schedule or significantly increase the project scope.
81

7.5.2 Financial Assumptions
This funding profile is based on the following assumptions:
• DOE will provide funding necessary to implement the CME, as enumerated in the approved TAG CME Work Plan through the completion of the CME Report, and
• DOE will provide funding for additional scope resulting from the realization of programmatic risk.
7.5.3 Regulatory Assumptions
• The COOC (NMED 2004) will be the governing document for enumerating the requirements for this corrective action. Changes to the requirements for the corrective measure will be done in accordance with the process for change outlined in the COOC (NMED 2004).
• The documents that are required under the COOC (NMED 2004) for this corrective action are enumerated in Section 7.3.2 of this document. These documents comprise the project’s team basis and implementation requirements, as required by the COOC (NMED 2004), for the execution of this CME. If one or more parties to the COOC (NMED 2004) desire to change a project requirement, either through a COOC modification; a change to a law, permit, or statute; or a change in the site conditions, then the documents which govern the project implementation basis and requirements will be required to be modified. This may include some or all of the scope, schedule, and budget.
• Regulatory agencies, and particularly the NMED, will have adequate resources to provide regulatory decisions and document reviews in support of the schedule.
• NMED regulatory review periods will not increase and the document approval backlog will steadily decrease through time.
• Positive relationships and cooperation with the regulatory agencies will continue and administrative requirements will not increase.
7.5.4 Project Scope Assumptions
• Project scope will not change significantly from that which is currently incorporated in the baseline,
• If unforeseen circumstances occur, then completion milestone can be extended beyond FY 2006, and
• Final stewardship requirements will not significantly increase baseline scope above the level that is currently anticipated.
82

The monitoring assumptions specific to the TAG SNL/NM AOR are as follows:
• The COCs include TCE and nitrate in the perched system only.
• Conventional pumping methods will be used (e.g., Bennett pumps). Labor hours are based on FY 2003 estimates.
• Waste management requirements or disposition costs will not change significantly from those currently in place (e.g., purge water volumes will continue to be about four drums or less per well). It will always be possible to discharge the purge water to a nearby drain connected to a publicly owned treatment works.
7.5.5 Project Schedule and Planning Assumptions
• The project schedule outlined in this document is the basis for the implementation of the CME. This schedule is based upon the requirements of the COOC (NMED 2004). As stated in Section 7.5.4, changes to the CME documents or the COOC (NMED 2004) are grounds for modification of the schedule.
• The schedule presented in this document represents the CME schedule for achieving the 2005 enforceable delivery date of the CME Report. This schedule illustrates agency review periods necessary to achieve the evaluations and preparation of the report.
• The activities described in the TAG Investigation Work Plan (SNL/NM 2003a) that apply to the entire TAG area will continue to be fulfilled by all PRPs in parallel to the work described in this CME Work Plan.
7.5.6 Technical Assumptions
• The data collected under the provisions of the TAG Investigation Work Plan (SNL/NM 2003a) will be in agreement with historical concentrations and will not significantly alter the conceptual model of the TAG SNL/NM AOR, as summarized in Section 1.4.
• The current technical direction of the project will not change significantly. All stakeholders and regulatory authorities will reach a common consensus through their review, recommendation, and/or approval authority on the current technical direction.
• Sufficient independent technical review will be utilized to ensure that approaches are technically sound.
• Proven and tested technologies will be utilized and no technology development activities will be required that would delay planned activities.
7.5.7 Public Involvement Assumptions
• The results of actions or recommendations by the public will not increase project scope or schedule beyond FY 2006, and
• Working groups with public representation will continue to serve as the mode for close involvement of stakeholders in the corrective-action process.
83
REFERENCES
1. 40 CFR 141.61, 2002, Title 40, “Protection of Environment,” Subchapter D, “Water Programs,” Part 141, “National Primary Drinking Water Regulations,” Section .61, “Maximum Contaminant Levels for Organic Contaminants,” Code of Federal Regulations, Office of the Federal Register.
2. 40 CFR 141.62, 2003, Title 40, “Protection of Environment,” Subchapter D, “Water Programs,” Part 141, “National Primary Drinking Water Regulations,” Section .62, “Maximum Contaminant Levels for Inorganic Contaminants,” Code of Federal Regulations, Office of the Federal Register.
3. AquaVISION, 1999, “Colloidal Borescope Investigation of the Sandia North Site,” Albuquerque, New Mexico. July 21, 1999.
4. BGW, 2001, “A Preliminary Three-Dimensional Variably Saturated Model of a Perched Aquifer at Sandia National Laboratories, New Mexico,” Balleau Groundwater, Inc., Albuquerque, New Mexico, February 2001.
5. BGW, 2002, “Model of a Perched Zone of Saturation at Sandia National Laboratories, New Mexico,” Balleau Groundwater, Inc., Albuquerque, New Mexico, September 2002.
6. Center for Public Environmental Oversight, 2000, Technology Tree: Bio-reactors. http://www.cpeo.org/techtree/ttdescript/biorec.htm.
7. Collins, S., 2000. Memo to: All ER Personnel Re: Project Name Change from the “Sandia North Groundwater Investigation” to the “Tijeras Arroyo Groundwater Investigation,” Sandia National Laboratories, Albuquerque, New Mexico, December 2000.
8. Copland, J. R., 2002, Tijeras Arroyo Groundwater (TAG) High-Performing Team (HPT) Meeting Notes, Sandia National Laboratories / New Mexico Environmental Restoration Project, May 14, 2002.
9. Department of Defense, 2000, “Environmental Security Technology Certification Program (ESTCP) Cost and Performance Report: Multi-Site In Situ Air Sparging,” CU-9808, http://www.estcp.org/documents/techdocs/199808.pdf, December 2000.
10. DOE, 1999a, Innovative Technology Summary Report: In Situ Chemical Oxidation Using Potassium Permanganate, DOE/EM-0496, http://apps.em.doe.gov/ost/pubs/istrs/itsr167.pdf, U.S. Department of Energy, 35 pp.
11. DOE, 1999b, Decision-Making Framework Guide for the Evaluation and Selection of Monitored Natural Attenuation Remedies at Department of Energy Sites, Office of Environmental Restoration, http://web.em.doe.gov/framework/, U.S. Department of Energy.
12. EPA, 1994, RCRA Corrective Action Plan (Final), OSWER 9902.3-2A, U.S. Environmental Protection Agency, Office of Solid Waste and Emergency Response, May 1994.
84
13. EPA, 1996, Pump-and-Treat Ground-Water Remediation: A Guide for Decision Makers and Practitioners, EPA/625/R-95/005, Office of Research and Development, Washington D.C., http://www.epa.gov/ORD/WebPubs/pumptreat/, July 1996.
14. EPA, 1997, Metal-Enhanced Dechlorination of Volatile Organic Compounds Using an Above-Ground Reactor, EPA/540/R-96/503, Superfund Innovative Technology Evaluation Report, EnviroMetal Technologies, Inc., http://www.epa.gov/ORD/SITE/reports/540r96503.pdf.
15. EPA, 1998, Technical Protocol for Evaluating Natural Attenuation of Chlorinated Solvents in Ground Water, EPA/600/R-98/128, http://www.clu-in.org/download/remed/protocol.pdf.
16. EPA, 1999, Use of Monitored Natural Attenuation at Superfund, RCRA Corrective Action, and Underground Storage Tank Sites, OSWER Directive 9200.4-17P, http://www.epa.gov/swerust1/directiv/d9200417.pdf.
17. EPA, 2003a, “Air Sparging,” http://www.epa.gov/swerust1/cat/airsparg.htm.
18. EPA, 2003b, “Biosparging,” http://www.epa.gov/swerust1/cat/biosparg.htm.
19. Fountain, J.C., 1998, “Technologies for Dense Nonaqueous Phase Liquid Source Zone Remediation,” TE-98-02, GWRTAC, Pittsburgh, Pennsylvania, http://www.gwrtac.org/pdf/e_dnapl.pdf, December 1998.
20. Fritts, J.E., and D. Van Hart, 1997, “Sandia North Geologic Investigation Project Report,” Prepared for Sandia National Laboratories Environmental Restoration Project by GRAM, Inc. under Contract AS-4959. GRAM, Inc., Albuquerque, New Mexico, March 1997.
21. Ground-Water Remediation Technologies Analysis Center (GWRTAC), 2001, Remediation Technologies, http://www.gwrtac.org/html/techs.html.
22. Interstate Technology and Regulatory Cooperation Work Group, 2002. “Technical and Regulatory Guidance for In Situ Bioremediation in Groundwater,” 129 pp.
23. IT Corporation (IT), 1997. Letter Report to Mr. Rodney Arnold, AFCEE/ERDM. “Soil Vapor Sampling in Technical Area 2, Boreholes 21, 23, and 20, November – December 1996,” IT Corporation, Albuquerque, New Mexico, January 1997.
24. Martin, J.P., Allison, A.M., Keck, J.F., Peterson, L.N., 2002, Evaluation of Remediation Technologies for DNAPL Source Zone Clean-Up at the OK Tool Site, Milford, NH, NEW-ID-2002-047, Revision 0, North Wind, Inc.
25. MWH Americas, Inc., 2003, “Stage 1 Abatement Report for Nitrate-Impacted Groundwater at Kirtland Air Force Base, New Mexico,” July 2003, Environmental Compliance Program Kirtland Air Force Base Albuquerque, New Mexico, July 2003.
26. Nanitech LLC, 2004, Information brochure.
85
27. National Research Council, 1999, “Groundwater and Soil Cleanup: Improving Management of Persistent Contaminants,” National Research Council, National Academy Press: Washington D.C., 285 pp.
28. NMED, 2003, John E. Kieling, Manager - Management Program, correspondence: "Tijeras Arroyo Groundwater Investigation Work Plan, June 2003, Sandia National Laboratories, NM5890110518-1, HWB-SNL-03-006", to Karen Boardman, Manager, Sandia Site Office NNSA, U.S. Department of Energy, September 3, 2003.
29. NMED, 2004, Compliance Order on Consent Pursuant to the New Mexico Hazardous Waste Act 74-4-10: Sandia National Laboratories Consent Order, New Mexico Environment Department, April 2004.
30. Skelly, M.F., 2002. Technical Memorandum—“Tijeras Arroyo Groundwater (TAG) Investigation, Phase Partitioning of TCE in Soil Vapor and Groundwater,” SNL/NM Internal Memo from Michael Skelly (Department 6133) to Sue Collins (Department 6133). January 10, 2002.
31. SNL/NM, 1995, Site-Wide Hydrogeologic Characterization Project, Calendar Year 1994 Annual Report, Sandia National Laboratories, New Mexico, Environmental Restoration Project, Albuquerque, New Mexico, March 1995.
32. SNL/NM, 1996, Sandia North Groundwater Investigation Plan, Sandia National Laboratories Environmental Restoration Project for U.S. Department of Energy, Albuquerque Operations Office, Albuquerque, New Mexico, March 1996.
33. SNL/NM, 1998, Sandia North Groundwater Investigation, Annual Report, Fiscal Year 1997, Environmental Restoration Project, Sandia National Laboratories, Albuquerque, New Mexico, March 1998.
34. SNL/NM, 1999, SNL/NM Summary Report of Groundwater Investigations at Technical Area V, Operable Units 1306 and 1307, Environmental Restoration Project, U.S. Department of Energy, Albuquerque Operations Office, Sandia National Laboratories/New Mexico, March 1999.
35. SNL/NM, 2000, Sandia North Groundwater Investigation, Annual Report, Fiscal Year 1998, Environmental Restoration Project, Sandia National Laboratories, Albuquerque, New Mexico, June 2000.
36. SNL/NM, 2001a, 1999 Annual Site Environmental Report Sandia National Laboratories Albuquerque, New Mexico, Sandia Report SAND2000-2228, Sandia National Laboratories / New Mexico, February 2001.
37. SNL/NM, 2001b, Environmental Restoration Project, Sandia National Laboratories/New Mexico in Association with the U.S. Department of Energy, Kirtland Area Office, Draft Long-Term Environmental Stewardship Plan, Sandia National Laboratories/New Mexico.
86
38. SNL/NM, 2002, Tijeras Arroyo Groundwater Continuing Investigation Report, Sandia National Laboratories Environmental Restoration Project for U.S. Department of Energy, Albuquerque Operations Office, Albuquerque, New Mexico, November 2002.
39. SNL/NM, 2003a, Tijeras Arroyo Groundwater Investigation Work Plan (Final Version), Sandia National Laboratories Environmental Restoration Project for U.S. Department of Energy, Albuquerque Operations Office, Albuquerque, New Mexico, June 2003.
40. SNL/NM, 2003b, Survey of Subsurface Treatment Technologies for Environment Restoration Sites at Sandia National Laboratories, New Mexico, Sandia National Laboratories/New Mexico, Albuquerque, NM, August 2003.
41. Stone, B.D., J.C. Cole, and D.A. Sawyer, 2000, “Regional Stratigraphic Framework for an Integrated Three-Dimensional Geologic Model of the Rio Grande Rift,” in U.S. Geological Survey Middle Rio Grande Basin Study—Proceedings of the Fourth Annual Workshop, Albuquerque, New Mexico, February 15-16, 2000. U.S. Geological Survey Open File Report 00-488. U.S. Geological Survey, February 2000.
42. Strietelmeier, B.A., M.L. Espinosa, M.W. Jones, J.D. Adams, E.M. Hodge, S.D. Ware, P.A. Leonard, P. Longmire, J.P. Kaszuba, and J.L. Conca, 2001, “Remediation of Nitrate-Contaminated Groundwater Using a Biobarrier,” Waste Management 2001 Conference, February 25-March 1, 2001, Tucson, Arizona, http://www.wmsym.org/Abstracts/2001/54/54-2.pdf.
43. Van Hart, D., D.A. Hyndman, and S.S. Brandwein, 1999, “Analysis of the USGS Isleta/Kirtland Air Force Base Aeromagnetic Survey for Application to SNL/KAFB Area Geologic Structure.” Prepared for the Sandia National Laboratories/New Mexico Groundwater Protection Program/ Environmental Restoration Project, October 15, 1999.
44. Van Hart, D., 2001, “Shallow Groundwater System Investigation: Tijeras Arroyo and Vicinity,” prepared for Sandia National Laboratories/New Mexico Environmental Restoration, Department 6133, June 2001.
45. Van Hart, D., 2003, “Geologic Investigation: An Update on Subsurface Geology on Kirtland Air Force Base, New Mexico” SAND2003-1869, prepared for Sandia National Laboratories/New Mexico, Environment Restoration Project, Department 6133, June 2003.
46. Wiedemeier, T.H., J.T. Wilson, K.H. Kampbell, R.N. Miller, J.E. Hansen, 1999, “Technical Protocol for Implementing Intrinsic Remediation with Long-Term Monitoring for Natural Attenuation of Fuel Contamination Dissolved in Groundwater,” Volume I, Revision 0, Air Force Center for Environmental Excellence, Brooks Air Force Base, S.A., Texas.
47. Wolford R., 1996, “Hydrologic Evaluation of a Perched Aquifer Near TA-II Tijeras Arroyo: Estimating Aquifer Parameters, Water Travel Times, and Possible Sources of Recharge in the Perched Zone. Site-Wide Hydrogeologic Characterization Project, Environmental Restoration Program, SNL/NM,” Consultants Report—GRAM, Inc., Albuquerque, New Mexico, September 1996.
87

88
Appendix A NMED Review Comments
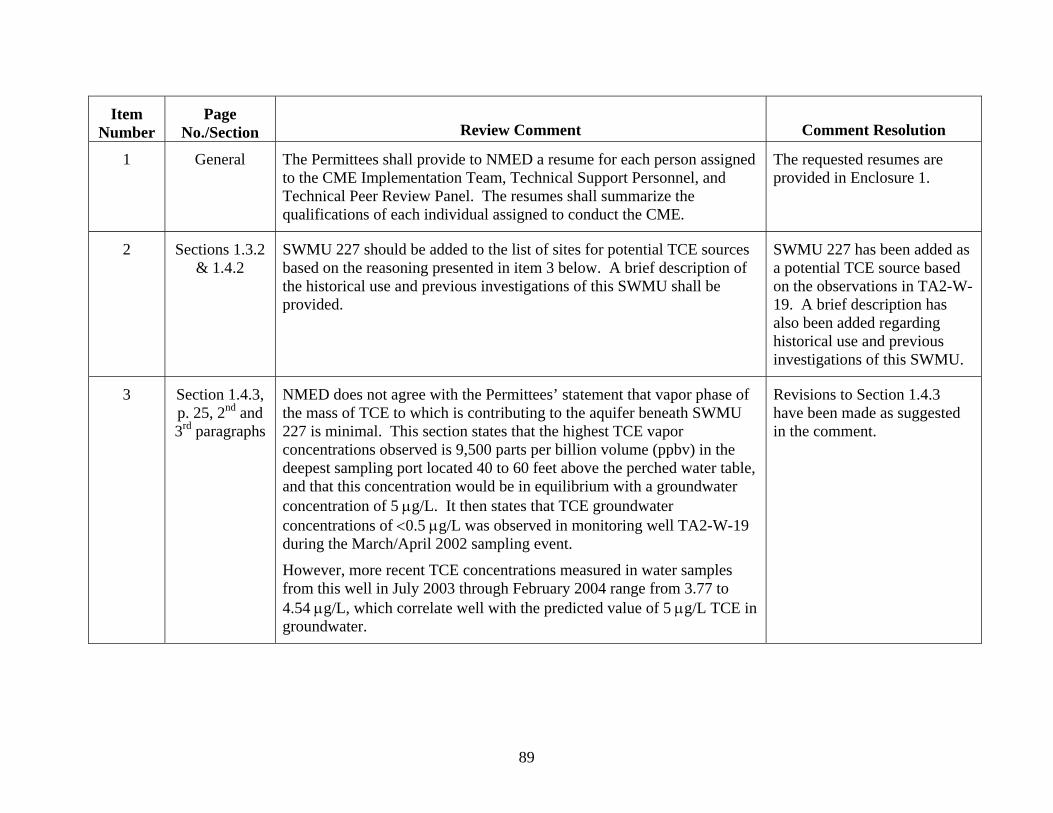
89
Item Number
Page No./Section Review Comment Comment Resolution
1 General The Permittees shall provide to NMED a resume for each person assigned to the CME Implementation Team, Technical Support Personnel, and Technical Peer Review Panel. The resumes shall summarize the qualifications of each individual assigned to conduct the CME.
The requested resumes are provided in Enclosure 1.
2 Sections 1.3.2& 1.4.2
SWMU 227 should be added to the list of sites for potential TCE sources based on the reasoning presented in item 3 below. A brief description of the historical use and previous investigations of this SWMU shall be provided.
SWMU 227 has been added as a potential TCE source based on the observations in TA2-W-19. A brief description has also been added regarding historical use and previous investigations of this SWMU.
3 Section 1.4.3,p. 25, 2nd and 3rd paragraphs
NMED does not agree with the Permittees’ statement that vapor phase of the mass of TCE to which is contributing to the aquifer beneath SWMU 227 is minimal. This section states that the highest TCE vapor concentrations observed is 9,500 parts per billion volume (ppbv) in the deepest sampling port located 40 to 60 feet above the perched water table, and that this concentration would be in equilibrium with a groundwater concentration of 5 µg/L. It then states that TCE groundwater concentrations of <0.5 µg/L was observed in monitoring well TA2-W-19 during the March/April 2002 sampling event.
However, more recent TCE concentrations measured in water samples from this well in July 2003 through February 2004 range from 3.77 to 4.54 µg/L, which correlate well with the predicted value of 5 µg/L TCE in groundwater.
Revisions to Section 1.4.3 have been made as suggested in the comment.

90
Item Number
Page No./Section Review Comment Comment Resolution
3 Section 1.4.3,p. 25, 2nd and 3rd paragraphs
(cont’d)
In addition, data from monitoring well TA2-W-19, located approximately 500 feet downgradient of SWMU 227, and data from the vapor-monitoring well, suggest that higher groundwater concentrations may exist at the source area and/or that no significant degradation or attenuation of TCE is occurring. This suggests that TCE vapor in the vadose zone beneath SWMU 227 is a potential source for contamination in the perched groundwater that has been detected at monitoring well TA2-W-19. Thus, statements made in the 3rd paragraph regarding TCE as not being considered a continuing source have no basis. The Permittees shall re-write the subject 2nd paragraph to incorporate the information discussed above. The Permittees shall delete the 3rd paragraph.
Revisions to Section 1.4.3 have been made as suggested in the comment.
4 General The subject CME is proposed to address TCE and nitrate contamination in the groundwater within the designated area. Corrective action for individual SWMUs and soil contamination shall be addressed separately, as may be needed to protect human health and the environment.
We agree. As proposed, the CME process will address TCE and nitrate contamination in the AOR groundwater only.
5 General Based on the current understanding of site conditions and the site conceptual model, NMED agrees that the TCE contamination associated with the WYO-4 well in the western portion of the Permittees’ Area of Responsibility (AOR), and the nitrate contamination associated with regional aquifer well TJA-4 in the southeast corner of the AOR appear not to be the Permittees’ responsibility. These two areas of groundwater contamination may be the responsibility of Kirtland Air Force Base. NMED also agrees, based on current information, that TCE and nitrate appear to be the only contaminants of concern (COCs). However, NMED reminds the Permittees that the Tijeras Arroyo Groundwater Investigation has not been completed, and that the Permittees are thus making assumptions on the nature and extent of contamination in the Tijeras Arroyo area. Following completion of the Tijeras Arroyo Groundwater Investigation, if the NMED finds evidence of additional COCs or determines that the Permittees are responsible for contamination occurring in the groundwater at the above referenced wells, the CME will need to address these issues. Characterization of the groundwater in the Tijeras Arroyo must also be considered complete and adequate by the NMED before the NMED can deem complete the results of any CME.
The comment is acknowledged.
Distribution:
External: Joe Rothermel (4) North Wind, Inc. 545 Shoup Ave., Suite 200 Idaho Falls, ID 83405-1174 Robert Ferry (1) CE2 Corporation 2702 Gelding Lane Livermore, CA 94551 Karren Suesz (4) DOE/SNL Community Resources Information Office 7007 Wyoming Boulevard NE, Suite C Albuquerque, NM 87109 Kim Ong (1) 316 Dartmouth, SE Albuquerque, NM 87106 Internal: 91
1 MS-0735 C. Ho 6115 1 MS-0750 P. Brady 6118 1 MS-1042 F. Lauffer 6321 1 MS-1087 S. Griffith 6146 1 MS-1088 S. Collins 6146 1 MS-1088 T. Jackson 6146 1 MS-1088 M. Skelly 6146 10 MS-1089 M. Bachicha 6146 2 MS-0899 Technical Library 9616 1 MS-9018 Central Tech Files 8945-1