Correcting Racial Imbalance: A Report of State Funded ... Mrs. Helen B. Power, A.B., Litt. D., ......
89
ED 037 493 TITLE INSTITUTION PUB DATE NOTE EDRS PRICE DESCRIPTORS IDENTIFIERS ABSTRACT DOCUMENT RESUME UD 009 627 Correcting Racial Imbalance: A Report of State Funded Projects, 1966-68. New York State Education Dept., Albany. Div. of Evaluation. Oct 68 88p., EDRS Price MF-$0.50 HC-$4.50 Academic Achievement, Administrator Attitudes, Integration Effects, *Integration Studies, Parent Attitudes, *Program Evaluation, Questionnaires, Racial Balance, Racial Integration, *School Integration, *State Aid, Student Attitudes, Teacher Attitudes *New York This report on New York State projects aimed at correcting racial imbalance in the public schools deals with the actual distribution of funds, the variety of programs implemented, and a summary of project evaluations presented by the participating districts during the first two years of operation, 1966-1968. Funds were appropriated to assist schools in integration projects as well as in desegregation. Tabular data and discussion of statewide findings are included, along with a detailed evaluation of the Buffalo Public School System's integration program. Comparative data analysis of student achievement before and after one year of integration and a survey of principal, teacher, student, and parent attitudes toward the program were the measuring instruments. Copies of opinion questionnaires are included. [Two tables in this document may not be legible in hard copy due to size of type-face used in original document.] (KG) t
Transcript of Correcting Racial Imbalance: A Report of State Funded ... Mrs. Helen B. Power, A.B., Litt. D., ......

ED 037 493
TITLE
INSTITUTION
PUB DATENOTE
EDRS PRICEDESCRIPTORS
IDENTIFIERS
ABSTRACT
DOCUMENT RESUME
UD 009 627
Correcting Racial Imbalance: A Report of StateFunded Projects, 1966-68.New York State Education Dept., Albany. Div. ofEvaluation.Oct 6888p.,
EDRS Price MF-$0.50 HC-$4.50Academic Achievement, Administrator Attitudes,Integration Effects, *Integration Studies, ParentAttitudes, *Program Evaluation, Questionnaires,Racial Balance, Racial Integration, *SchoolIntegration, *State Aid, Student Attitudes, TeacherAttitudes*New York
This report on New York State projects aimed atcorrecting racial imbalance in the public schools deals with theactual distribution of funds, the variety of programs implemented,and a summary of project evaluations presented by the participatingdistricts during the first two years of operation, 1966-1968. Fundswere appropriated to assist schools in integration projects as wellas in desegregation. Tabular data and discussion of statewidefindings are included, along with a detailed evaluation of theBuffalo Public School System's integration program. Comparative dataanalysis of student achievement before and after one year ofintegration and a survey of principal, teacher, student, and parentattitudes toward the program were the measuring instruments. Copiesof opinion questionnaires are included. [Two tables in this documentmay not be legible in hard copy due to size of type-face used inoriginal document.] (KG)
t

09627
EC=C1HRIM
U.S. DEPARTMENT OF HEALTH, EDUCATION & WELFARE
OFFICE OF EDUCATION
THIS DOCUMENT HAS BEEN REPRODUCED EXACTLY AS RECEIVED FROM THE
PERSON OR ORGANIZATION ORIGINATING IT. POINTS OF VIEW OR OPINIONS
STATED DO NOT NECESSARILY REPRESENT OFFICIAL OFFICE OF EDUCATION
POSITION OR POLICY,
The University of the State of New YorkTHE STATE EDUCATION DEPARTMENT
Division of EvaluationAlbany, New York 12224

Pr\
CI%
Pe%
CD
A REPORT ON THE PROJECTSFUNDED UNDER STATE AID FOR CORRECTING
RACIAL IMBALANCE1966-68
Albany, New YorkOctober, 1968
THE UNIVERSITY OF THE STATE OF NEW YORKThe State Education Department
Bureau of Department Programs Evaluation

THE UNIVERSITY OF THE STATE OF NEW YORK
Regents of the University (with years when terms expire)
1984 Joseph W. McGovern, A.BChancellor
1970 Everett J. Penny, B.C.SVice Chancellor
1978 Alexander J. Allan, Jr.,1973 Charles W. Millard, Jr.,1972 Carl H. Pforzheimer, Jr.1975 Edward M. M. Warburg, B.S., L.H.D.1977 Joseph T. King, LL.B.1974 Joseph C. Indelicato, M.D.1976 Mrs. Helen B. Power, A.B., Litt. D., L.H.D1979 Francis W. McGinley, B.S., LL.B., LL.D.1980 Max J. Rubin, LL.B., L.H.D.1971 Kenneth B. Clark, A.B., M.S., Ph.D.
, LL.B., L.H.D., LL.D., D.C.L.,
, D.C.S.,
LL.D., Litt.D.A.B., LL.D., L.H.D.
, A.B., M.B.A., D.C.S
1982 Stephen K. Bailey, A.B., B.A., M.A., Ph.D.,LL.D.1983 Harold E. Newcomb, B.A.
President of the University and Commissioner of EducationJames E. Allen, Jr.
Executive Deputy Commissioner of EducationEwald B. Nyquist
Associate Commissioner for Research and EvaluationLorne H. Woollatt
Assistant Commissioner for Research and EvaluationWilliam D. Firman
Director. Division of EvaluationAlan G. Robertson
Chief. Bureau of Department Programs EvaluationAlbert Klevan
New York
White PlainsTroyBuffaloPurchaseNew YorkQueensBrooklynRochesterGlens FallsNew YorkHastings onHudson
SyracuseOwego
Administrator. Education Practices Act. Division of Intercultural Relationsin EducationWilbur R. Nordos

FOREWORD
A democratic society operates on two basic premises. One is that
in a democracy, the rights of the individual, regardless of national
origin, racial membership, religious affiliation or economic level, are
inviolate and must be protected. The other is that in a democracy in-
dividuals and groups work together in harmonious relationships. The
former enables one to exercise initiative in striving for the attain-
ment of personal objectives. The latter promotes the contribution of
efforts for the common weal. The extent to which these JVrdmises are
effective, determines the extent to which a society will continue to be
identifiable as a democracy.
In a healthy democratic society no cultural group can be alienated
from the society. The exclusion of a minority group from the mainstream
of school activity can have only adverse effects on the members of that
group. Apropos of this truth, in 1960 the Board of Regents in a policy
statement, unanimously adopted, declared in part:
Modern psychological knowledge indicates that schoolsenrolling students largely of homogeneous ethnic origin maydamage the personality of minority group children. Suchschools decrease their motivation and thus impair the abilityto learn. Public education in such a setting is sociallyunrealistic, blocks the attainment of the goals of democraticeducation and is wasteful of manpower and talent, whether thissituation occurs by law or by fact
In the report (Desegregating the Public Schools of New York
City, May 12, 1964), the Commissioner's Advisory Committee of Human

ii
Relations and Community Tensions stated:
TWo reasons compel us to do our best to achieve well integratedschools. One is the moral imperative to assure all children trueequality of opportunity. The other is the educational necessity toprepare every child to take his place in a world where no race mayany longer live alone. The desegregation of the public schoolstherefore, means more than a better education for minority children.It means also a significant addition to the educative power of theschools for all children.
In 1967, based on a nationwide study, the United States Commission on
Civil Rights issued a report, Racial Isolation in the Public Schools. The
report states in part (p. 193, Vol. 1):
The central truth which emerges from this report and from allof the Commission's investigations is simply this: Negro bhildrensuffer serious harm when their education takes place in publicschools which are racially segregated, whatever the source of suchsegregation may be.
Negro children who attend predominantly Negro schools do notachieve as well as other children, Negro and white. Their aspirationsare more restricted than those of other children and they do not haveas much confidence that they can influence their own futures. Whenthey become adults, they are less likely to participate in the main-stream of American society, and more likely to fear, dislike, andavoid white Americans. The conclusion drawn by the U.S. Supreme Courtabout the impact upon children of segregation compelled by law - thatit "affects their hearts and minds in ways unlikely ever to be undone"- applies to segregation not compelled by law.
The major source of the harm which racial isolation inflictsupon Negro children is not difficult to discover. It lies in theattitudes which such segregation generates in children and the effectthese attitudes have upon motivation to learn and achievement. Negrochildren believe that their schools are stigmatized and regarded asinferior by the community as a whole. Their belief is shared bytheir parents and by their teachers. And their belief is founded in fact.
The segregation of any minority group within the society is not only
harmful to the members of the group, but can be potentially deleterious to
the society at large. Basically, it reflects an underlying unhealthy
situation. The 1960 statement of the Regents, recognizing this fact, continues:

The State of New York has long held the principle that equaleducational opportunity for all children, without regard to differencesin economic, national, religious, or racial background, is a manifestationof the vitality of our American democratic society and is essential toits continuation.
It is not difficult to understand the reasons for the possible harmful
effects to society of segregation of cultural minorities. Such segregation
creates inequalities which retard the nurturing of socially needed talents,
fails to develop the fullest manpower potential, breeds mutual distrusts and
hatreds, and corrodes social interactions.
Finally, on this point, the Regents, in Integration and the Schools,
19681position paper number 3, p. 10) states:
The existence of segregation not only creates individual andgroup injustice, abhorrent to all who believe in the dignity ofman and the equality of opportunity implicit in a democracy, butit also poses a threat to the economic, social, and cultural healthof the community, State, and Nation.
Accordingly, supported by the Regents, the Commissioner of Education
has striven to induce school districts to eliminate segregation in the
schools. As a corrective measure in this State, a policy to establish
racial balance has been adopted for the schools to enable students to
learn and work together during their school hours, and thereby gain ex-
perience in the democratic process.
The Commissioner has also had firm legal buttressing from Section
313 of the State Education Law, from the 1954 Supreme Court decision, and
from the 1964 Civil Rights Act. Whereas both the decision and the Act are
national in their jurisdiction, the Regents' policy statements specify the
State's objectives and responsibilities regarding integration. Of equal
importance, is the fact that the State Courts have rendered decisions
in a number of cases' reinfQrcing the basis for implementation of

iv
the policies and activities promoting integration within the
State.
While it is true that de facto segregated housing, reflecting itself
in segregated neighborhood schools, creates problems vis-a-vis integration
in the schools, communities are making attempts to solve the problems:
through demographic studies undertaken to aid districts in planning future
school construction; through the adoption of new plans for assigning pupils
to schools.
Aside from the physical processes of creating racial balance, programs
are being developed to improve understanding by students, teachers, and the
community. Such programs include: plans for improving communications
between community and school; providing pupil personnel services to develop
a better understanding of the integration process; providing inservice
training for teachers to enable them to deal more effectively with minority
children; providing integrated curriculum materials depicting the con-
tributions of minority groups to American civilization.
This report deals with the efforts which are supported by State aid,
and with an assessment of the results thus far obtained. The study itself
analyzes experimental projects for the elimination of racial imbalance and
improvement of integration, and was conducted by Zenobia O'Neal, assisted
by A. Harry Smith, members of the Department's Division of Evaluation.
The findings of the report are based on data and information drawn
from many sources. In addition to a complete review of materials and reports
in the files of George Harrison, Project Coordinator, Division of Intercultural
Relations, information was gathered from the Division of Educational Finance
by William Jaffarian, and information for many tables was derived from data
contained in the New York State Education Department's Racial and Ethnic
Census, by Joan Peek, Bureau of Statistical Services.

V
It is hoped that the summary assessment presented in this report will
give the reader an insight into the scope of the program to correct racial
imbalance and the problems which have arisen in the course of its implementat-
ion. To local program administrators the report should be of value in
strengthening the program and in future planning.
ALAN G. ROBERTSONDirectorDivision of Evaluation

vi
TABLE OF CONTENTS
Page
INTRODUCTION AND PURPOSE. .
APPLICATIONS RECEIVED 2
PROJECTS FOR WHICH AID WAS APPROVED 4
DESCRIPTION OF PROJECTS 8
RESULTS 13
How the funds were used 13
B. Pupils involved in Desegregation Programs 13
C. Teachers involved in Integration Programs 16
D. Change in Racial Imbalance 16
E. Reaction of the Communities involved. . . 30
SUMMARY AND CONCLUSIONS OOOOO OOOOO 32
APPENDIX. . . 36

A REPORT ON THE PROJECTSFUNDED UNDER STATE AID FOR CORRECTING
RACIAL IMBALANCE
INTRODUCTION
The State Legislature, on July 5, 1966, approved a supplemental budget
which contained an appropriation of $1,000,000 for the State Education
Department. This was for State Aid for Experimentation and Research - to
assist local school districts in meeting the excess costs incurred in
approved experimentation and innovation projects for correcting racial im-
balance and improving the quality of integrated education. For the year
1967-68, the grant was increased to $3,000,000. Requests for $5,000,000
were made both years.
This report deals with the actual distribution of the funds received,
the variety of programs implemented by the participating districts, and a
summary of the project evaluations presented by the several districts during
the first 2 years of operation.
PURPOSE OF FUND
The primary purpose of the fund is to assist those school districts that
are in the process of desegregation, to meet the excess cost necessary to
effect racial balance. In some instances aid was given for planning
desegregation, in other instances aid was granted to districts that recently
had desegregated their schools but needed financial help for another year to
complete their desegregation plans, alter their plans, or meet the excess
costs for another year.
Desegregation, the mixing of children to bring about racial balance,

-2-
is the first step toward integration. As reported in the U.S. Office of
Education Report (Coleman) "Equality of Educational Opportunity" and in
"Racial Isolation of the Public Schools," by the U.S. '..ommission on Civil
Rights, an integrated school environment is necessary for equal educational
opportunity.
Some superintendents felt they could not stop at desegregation of the
schools. They had to demonstrate that racial balance was the first step in
making the schools better. They had to assuage the fears of parents,
particularly white parents, that this would not have a deleterious education-
al effect upon their children. State aid was therefore requested not only
for correcting racial imbalance, which is an adminstrative process, but for
integration, which is an educational process.
APPLICATIONS RECEIVED
It was not until the latter part of July, 1966 that the program got
under way, with a letter from the Commissioner dated July 25, 1966, advising
all superintendents of the availability of the appropriation. This was a
most inopportune time for school districts, as in many instances staffs were
not available to plan and prepare projects. Furthermore, districts had
already approved their school budgets for the current fiscal year. Therefore
flexibility had to be extended on the deadline for filing applications.
The districts were advised that applications would be received as long as
money was available.
During the 1966-67 year, a total of 33 applications were received
from 25 school districts. Some districts submitted more than one proposal
and in one instance a proposal was withdrawn for lack of matching funds and
availability of staff.

.3.
The total budgetary requests presented came to over three million dollars.
This created a problem for the panel which reviewed the applications. It was
necessary to make drastic cuts in the budgets presented and to stay close to
the guide lines in determining priorities of projects.
In calculation of aid, the guidelines specified that the school district
indicate the budgeted costs of the proposed project which would be in excess
of the normal costs of instruction by the district. The State's share of
the approved budget in meeting the excess costs was calculated on the district's
normal aid ratio, but not less than 50 percent. This aid arrangement could
be modified, however, and a larger grant made if unusual circumstances pre-
vailed. Several items were aidable at 100 percent so that some districts
received more State aid than their State aid ratio or 50 percent would have
provided. Grants were made for one year only.
For the year 1967-68, 26 districts (including a Board of Cooperative
Educational Services) filed 39 applications, some districts requesting aid
for more than one project. Twenty-three applications were approved for 22
districts. Four were withdrawn or disallowed either for lack of matching
funds, inability to get the program started, or because the proposals did
not meet the requirements as set forth in the guidelines.
In several instances, districts were advised to revise their budgets
downward because it was anticipated that there would be insufficient funds
to meet their requests. Several other districts were ready to file late ap-
plications should funds become available. Funds would become available
should a district report that it could not use all the money allocated to
it due to unfilled positions or the cancellation of part of the program.

-4-
Table I summarizes the distribution of funds:
TABLE I
DISTRIBUTION OTTE FUND FOR RACIAL IMBALANCETotal Budgets Total Budgets Total State's Total State's
Year Presented Approved Share Approved Share Expended
1966-67, $3,601,722.20 $1,549,907.03 $969,987.44 $786,639.31*
1967 -68. $6,854,643.94 $4,387,980.11 $3;047,744.79 $2,482,733.52*
The expenditure for 1966 - 67 of less than one million dollars was a re-
sult of many programs starting late in the school year. As the appropriation
came during the summer months when school staffs were not available, many school
districts could not prepare their requests until fall, therefore, many programs
did not actually go into operation until the spring of that year.
Similarly, for 1967-68, though programs were planned in advance, it was
not always possible to secure on time, staff or rental of relocatable classrooms.
The allocation of more than $3,000,000 for the 1967 - 68 year results
from experience with actual cash expenditures compared with actual amounts
budgeted.
Appended to this report is a listing of the districts which made applica-
tions showing the disposition of their requests.
PROJECTS FOR WHICH AID WAS APPROVED
For purposes of this report, the projects approved are divided into two
categories:
(a) Those involving desegregation - which may be defined as "theabolition of racial imbalance," and
(b) Those involving integration - which may be defined as "theprocess of unlearning prejudices and establishing new democraticvalues through interaction in a non-segregated environment." It in-volves improving the quality of education in an integrated setting.
The names of those districts which received approval for State aid in
*As appear in the Division of Educational Finance

-5-
either of these categories follow the description. Because of the
variety of projects within a given proposal, a district may havereceived approval for aid in more than one category.
Desegregation
1. Rental of Relocatable Classrooms:
In reorganizing the schools to effect racial balance a shortage
of classroom space was created in some buildings. To relieve the shortage,
approval was given for the rental of portable classrooms. (1966 -67 Amityville,
Malverne, Roosevelt, Westbury. 1967 - 68 Amityville, Buffalo, Malverne,
Niagara Falls, Rochester, Roosevelt, Westbury.)
2. Transportation:
Reorganizing of schools sometimes results in some pupils having to
go greater distances to school than before, requiring transportation. State
aid was approved to cover the excess costs of such transportation. (1966 - 67
Freeport, Glen Cove, Malverne, Mount Vernon, Rockville Center, Roosevelt.
1967 - 68 Bellport, Buffalo, Glen Cove, Hempstead, Malverne, Mount Vernon,
New York City, Niagara Falls, Rochester, Roosevelt, Syracuse.)
3. Minor Alterations of School Buildings:
Some school buildings were not suitable to house new grades and
minor alterations were necessary. (1966 - 67 Freeport. 1967 - 68 Bellport,
Buffalo, Hempstead, Westbury.)
4. Demographic studies:
Such studies were approved to help in planning for future district
reorganization of schools to effect racial balance and improve the quality of
education. Several districts felt the need for a study of their communities
to detect population movements and trends. (1966 - 67 Roosevelt, Suffern,

-6-
Wyandanch, Long Beach, New York City. 1967 - 68 Nyack, Wyandanch.)
5. Office of Integration and Planning:
Such offices were established to plan and coordinate the school
districts' efforts to bring about and maintain racial balance of the schools,
prepare staff and community for the successful implementation of plans,and to
evaluate their effectiveness. ( 1966 - 67 Buffalo, Hempstead, Schenectady,
Syracuse, West Irondequoit. 1967 - 68 Buffalo, Hempstead, Syracuse.)
Integration
1. School - Community Relations:
Pmpgrams were planned to develop greater communications, understand-
ingsand support between the community and the schools. (1966 - 67 Greenburgh
# 8. 1967 - 68 Glen Cove, Greenburgh #8, Malverne, New York City, Nyack, Schenectady.)
2. Inservice Training Programs:
Inscrvice programs for teachers and administrators were author-
ized to improve their understanding of minority group children and develop
techniques to deal effectively with them. (1966 - 67 Greenburgh #8, Hempstead,
Rockville Center, Glen Cove, New York City, Peekskill. 1967 - 68 BOCES #1
Westchester, Freeport, Glen Cove, Greenburgh #8, Hempstead, New York City,
Schenectady, Syracuse.)
3. Development of Integrated Curriculum Materials:
Curriculum materials dealing with the contributions of minority
groups in American life and history were developed for inclusion in each subject.
(1966 - 67 Albany, Middle Island. 1967 - 68 Glen Cove, Greenburgh #8, New
York City, Rochester, Schenectady.)
4. Reduction of Class Size:
Additional teaching positions were approved for the reduction of

class size in schools involved in programs to improve racial balance. (1967-
68 Buffalo, New York City, Rochester.)
5. Special Services to Support the Integration Program:
To help make integration work, it was necessary to add special services
to aid white and nonwhite children adjust to a new enviornment, to provide
cultural enrichment, and to improve the achievement of those below grade
level. The schools were not able to support these additional services.
Such services included: reading teachers, librarians, visiting teachers,
guidance counselors, health teachers, language teachers, home-school teachers,
psychologists, music, and art teachers. Some services involved field trips
to cultural and educational centers. The purpose of home-school visitation
was to establish better communications between the homes of "disadvantaged"
children and the school. (1966-67 Hempstead, White Plains, Freeport. 1967-
68 Bellport, Buffalo, Mount Vernon, New York City, Niagara Falls, Rochester,
Syracuse, Westbury.)
6. Use of Teacher Aides:
These paraprofessionals were included in some programs to relieve the
teachers of routine, nonprofessional chores and thus give the teacher more
time for actual teaching. (1966-67 Freeport, Hempstead, Glen Cove, White
Plains. 1967-68 Amityville, Buffalo, Mount Vernon, New York City, Niagara
Falls, Rochester, Syracuse, Westbury.)
7. Special Instructional Materials:
Special instructional materials dealing with intergroup relations were
provided, including textbooks, pamphlets, and visual aids. (1967-68
Bellport, Buffet lo, Mount Vernon, New York City, Niagara Falls, Rochester,
Syracuse, Westbury.)

.8.
8. Tutorial Programs:
After school and early evening tutorial programs were approved
utilizing teachers and volunteers. Volunteers were also used during the
school day to work with students on an individual basis, under the guidance
of a regular teacher. (1966 - 67 Albany, Rockville Center, White Plains.
1967 - 68 Freeport, Glen Cove, Syracuse, White Plains.)
9 Pupil Personnel Services:
The appointment of a coordinator of Pupil Personnel Services, whose
responsibility would include developing better understanding of the integration
process, was approved. (1967 - 68 Malverne.)
DESCRIPTION OF PROJECTS
Projects conducted by selected school districts are described briefly
below to illustrate the extent and diversity of the programs.
Mount Vernon (1966 - 67)
Mount Vernon, on February 1, 1967,opened an Interim Children's Academy.
Three classes of fourth graders from different neighborhood schools were
transported from their neighborhood schools to the Academy and, at the end of
the day, were returned to their neighborhood schools. About 75 children
attended one day a week with a total of about 350 different children per
week. This created an integrated setting.
The instruction was a supplement to the children's classes. Remedialreading,
remedial math, health, psychological.* and health services were included.
Rochester (1966 - 67)
In 1965, Rochester pioneered an innovative program of a Metropolitan
Cooperative Project by sending 24 Negro students from the inner city to
suburban West Irondequoit Schools. The project was expanded in the 1966 - 67
year with 35 children attending the Campus School at State University at Brockport.

Hempstead (1966 - 67)
In Hempstead and Mount Vernon, people of stature from minority groups
were invited to speak to the children in assembly programs and in classrooms.
It was felt that this would bolster the image of minority groups and the self-
image of the children from these groups.
Long Beach (1966 - 68)
Throughout the school year, and particularly in the first 3 or 4
months of the semester, Long Beach was faced with a continuing influx of new
children. Many of these youngsters were minority group children, including
Negro children from the South, who brought few or no school records with them.
They were too poorly prepared academically, socially, or emotion-
ally to take their places in their regular grades. Placed immediately in
regular classes with the little information available to the school, many
failed to make satisfactory adjustments to the class, the curriculum, or the
school.
Long Beach set up a special "holding class" for all such newly arrived
children. The children remained in the class while an overall evaluation was
made of their educational needs and the proper class assignment determined.
In the meantime, they were helped to catch up as much as possible with their
grade placement and oriented to the new school.
New York City (1967 - 68)
Financial assistance was approved for New York City for the development
of a five-part program.
Part I: Improving Quality Integrated Education in schools in the Reverse
Open Enrollment Program through the use of special materials appropriate to
intercultural experiences: speakers from minority groups, supervised bus
service for kindergarten pupils, the addition of specialists such as
psychologists, social workers, guidance teachers and language teachers.

-10-
Part II: Improving Quality Integration in Community Zoned Schools. Four
pairs of schools were involved in this program to study the elements
deemed necessary to maximize the effectiveness of community zoned schools for
the achievement of quality education.
Part III: Reduction of Racial Imbalance in the Classes of Eight Schools
in one district through the Introduction of Heterogeneous Grouping Practices
in Grades 1 - 3.
Part IV: Staff training in human relations, begun in 1966,was continued.
Teacher trainers were prepared to conduct teacher workshops.
Pa, rt V: Improving Quality Integrated Education in the "Receiving
Schools" of the Open Enrollment Program. The purpose was to reduce achievement
desparities between racial groups by more intensive, small group, and
individual instruction and counseling. There were staff contacts with community
leaders and institutional staff who served as resources for the school program.
Nyack (1967 - 68)
The school district of Nyack sponsored a summer program to develop
community self-help and community involvement in the school in the Central
Nyack area.
Central Nyack has a large Negro population in a ghetto area relatively
isolated from the rest of the community. Until the project got under way, there
was no active parent group and the Central Nyack Civic Association was in-
active. The purpose of the project was to integrate this isolated area into
the broader community of activities nearer the center of the population and
to have parents take a more active interest in the school.
The vehicle for this involvement was an athletic and recreational program.
A Little League program for the area was started which brought in the
children from outside the area so that about one-half the participants were
white. Parents of the children, both Negro and white, were involved as
coaches and supervisors.

The Central Nyack Civic Association was revitalized. 4-H Clubs
were organized and a Self-Help Project was formed. This project was
sponsored by women who are currently planning a community center and art
classes for adults, using the school facilities.
The superintendent of schools wrote in December 1967: "Prior to
commencement of this project, we had been plagued with false alarms,
averaging three per week. Starting in July, we have not had a single false
alarm call from this area. . . . Since September of this year the school
has had a minimum of problems with children and parents." The superinten-
dent also reported that the people in the area now look upon the school as
"their school."
A demographic study was also completed, to assist the district in
planning for future school construction, with racial balance as a major
consideration.
Rochester (1967 - 68)
Rochester furthe... developed its open-enrollment plan to improve racial
balance. It introduced a "reverse" open enrollment plan for white students
voluntarily to attend largely Negro schools. Suburban white children were
also invited to transfer to city schools attended mainly by Negro children.
Special services were added to the program to make it more attractive to
white children living outside the area.
Schenectady (1967 - 68)
Schenectady's program was to assure the smooth integration of two
dissimilar populations in a single building. A largely Negro junior high
school will be merged with a largely white junior high school in 1968 - 69.
The program this past year was to prepare teachers, studentsyand parents of
both schools for this integrated experience through teacher inservice
education, parent education, and development of an integrated curriculum.

-12-
Spring Valley (1967 - 68)
Among Spring Valley's projects was the creation of community centers
for integrated learning and living through a school-community activities
program. Two elementary buildings, located close to the main Negro resident-
ial area, were used to develop within these schools, programs, activities, and
experiences that would foster greater comunity use of each building on an
integrated basis.
Syracuse (1967 - 68)
Syracuse planned a reduction of racial imbalance in a segregated school
(90 percent Negro) in these stages, over a period of 3 years. This would not
only racially balance the Negro segregated school but also a number of largely
white schools in the district.
A campus school was constructed at Syracuse University. This
was a cooperative arrangement between the City School District and the
University. About 300 children of the 4th, 5th, and 6th grades from the
Negro segregated school attended this past year. By next
year, the 4th grade will include children from other schools as well, thus
making a totally integrated 4th grade class. This process will continue
until the entire school is integrated.
During the summer of 1967 about 100 Negro children from the inaer city
of Syracuse were transported to 10 Liverpool Central School District Schools
for a 6 week integrated school program.
White Plains (1967 - 68)
White Plains set up neighborhood evening study centers, supervised by
certified teachers, to provide elementary school children from "disadvantaged"
neighborhoods with facilities for additional help in subject skills. The
program made it possible for children who live in crowded and noisy sur-
roundings to study in relative peace and quiet with the assistance of

-13-
sympathetic and understanding adults. The goal was to raise the achievement
level of those children who attend integrated schools.
RESULTS
Now the Funds were Used
Actual expenditures for 1966 and 1967 are listed in Tables 2 and 3. The
totals and State share are given for the various categories of items, showing
the percent of the total amount used by each category. Personnel Services
for 1966 and 1967 accounted for approximately 60 percent and 69 percent,
respectively, of the total State aid for racial imbalance; whereas transportation
accounted for approximately 15 percent of the State aid in 1966 and only 9
percent in 1967.
Pupils Involved in Desegration Programs
Table 4 gives the approximate number of pupils involved in transportation
programs and relocatable classroom programs for desegration, for 1966 and 1967.
In 1966, three times as many nonwhite pupils were transported as white,
and in 1967 approximately twice as many nonwhite pupils were transported as
white. Over twice as many pupils were involved in transportation programs
in 1967. Two more district& participated in 1967 than in 1966.
Nearly four times as many relocatable classrooms were used for desegration
in 1967 as in 1966. There were two more districts involved in relocatable
classroom projects for desegregation in 1967. The numbers in Table 4 are only
approximate, since nearly one third of the districts never submitted final
evaluation reports with adequate information.

TABLE 2
State and Local Costs
1966 - 67
for Correcting Racial Imbalance
Actual Expenditures*
Total
% of Total
State Share
7 of State Share
Relocatables
$60,492.61
5.12
$ 35,321.44
4.49
Minor Alterations
16,577.88
1.40
8,288.94
1.05
Office Supplies, Classroom Desks, Etc.
35,454.20
3.00
24,409.32
3.10
Books, Pamphlets, A-V Aids
62,624.76
5.30
33,491.38
4.26
Transportation
138,999.62
11.76
120,861.44
15.36
Tuition
32,735.00
2.77
16,367.50
2.08
School-Community Relations
6,891.27
0.58
3,498.18
0.44
Professional Services
508,843.02
43.04
351,958.50
44.76
Advisory and Consulting
96,210.91
8.14
83,287.19
10.59
Teacher Aides
35,259.76
2.98
14,340.41
1.82
Transportation Personnel
18,835.15
1.59
9,417.58
1.20
Other Personnel
29,241.57
2.47
16,678.76
2.12
Employee Benefits
130,323.49
11.02
63,494.38
8.07
Field Trips, Programs, Etc.
9,762.19
0.83
5,224.29
0.66
Total
$1,182,251.43
100.00
$786,639.31
100.00
*figures based on the assumption that New York City expended its funds in the samemanner as indicated
in its budget proposal.

TABLE 3
State and
Local Cost for Correcting Racial Imbalance
1967 - 68 Actual Expenditures*
Total
% of Total
State Share
% of State Share
Relocatables
158,001.95
3.96
145,573.10
5.86
Minor Alterations
50,687.52
1.27
37,036.46
1.49
Office Supplies, Classroom Desks, Etc.
32,051.99
0.80
21,292.89
0.86
Books, Pamphlets, A-V Aids
110,693.62
2.78
55,98,18
2.25
Transportation
235,718.76
5.91
227,946.76
9.18
Tuition
211.75
0.01
105.88
0.01
School-Community Relations
5,861.26
0.15
2,930.63
0.12
Professional Services
2,379,512.82
59.71
1,446,705.67
58.27
Advisory and Consulting
37,852.99
0.95
24,758.03
1.00
Teachers Aides
273,112.30
6.85
142,519.47
5.74
Transportation Personnel
75,078.59
1.88
56,235.59
2.27
Other Personnel
110,301.07
2.77
59,048.76
2.38
Employee Benefits
499,595.50
12.54
253,473.89
10.21
Field Trips, Programs, Etc.
16 560.37
0.42
9,121.21
0.36
$3,985,240.49
100.00
$2,482,733.52
100.00
*figures based on the assumption that New York City expended its funds in the same manner as indicatedin its
budget proposal.

-16-
TABLE 4APPROXIMATE NUMBER OF PUPILS INVOLVED IN TRANSPORTATION
PROGRAMS AND RELOCATABLE CLASSROOM PROGRAMS FORDESEGRATION, IN SCHOOL DISTRICTS RECEIVING STATE AID FOR
RACIAL IMBALANCE*1966 and 1967
Year Number ofDistricts
Number of Pupilsin Transportation Programs
Total
Number ofDistricts
RelocatabLe Classroomsused for Desegration
Number ofPupils
White Nonwhite Number ofRelocatables
1966 9 1,056 2,952 4,008 5 17 436
1967 11 3,322 6,510 9,832 7 60 1,650
*excluding New York City
Teachers Involved in Integration Programs
A comparison of the State Integration Fund's impact on total New York
State professional staff for 1966 - 67 through 1967 - 68, is presented in
Table 5. The table gives the number and percent of white and nonwhite pro-
fessional staff for New York State Schools as a total and also for the schools
in districts that requested State aid for racial imbalance. It may be
observed that the total nonwhite professional staff for school districts re-
questing State aid for racial imbalance, is proportionally twice as much in
percentage as the total nonwhite professional staff for New York State.
(TABLE 5)
Change In Racial Imbalance
Table 6 gives a comparison of 1961, 1966, and 1967 ethnic data for the
public elementary schools in 26 districts receiving aid for racial imbalance.
The table shows the number of schools in each district, for each of the 3
years, that have a percent of Negroes in each category between 31 percent
and 100 percent. Noted, are those districts that did not add schools to their
highest category of imbalance in 1967.

n,77
37,,S
.WPF
MT
W,
September 12, 1968
TABLE 5
1967-68 PROFESSIONAL STAFF ETHNICDATA
COMPARISON OF NEW YORK STATETOTAL PROFESSIONAL STAFF
WITH TOTAL PROFESSIONAL
STAFF OF
DISTRICTS REQUESTING STATE AIDFOR CORRECTING RACIALIMBALANCE FOR FISCAL YEARS
1966-67 and 1967-68
Total No. of Schools in New
York State=4354
Total No. of Schools in School
Districts Requesting
Aid*=1,439
(838 School Districts as of
7/1/68)
(39 School Districts)
Total New York StateProfessional Staff = 181,209
Total Professional Staff
=77,311
Total New York State White
Staff
= 172,285
(95.1%)
Total White Staff
=69,841
(90.37)
Total New York State Negro
Staff
7,549
(4.27)
Total Negro Staff
6,546
(8.5%)
Ims
Total New York State Puerto
Rican Staff =
432
(0.27)
Total Puerto Rican Staff
367
(0.5%)
,1 1
Total New York State Other
Staff
943
(0.57)
Total Other Staff
557
(0.7%)
Source:
1967-68 Ethnic Data
Basic Educational Data System


-19-
Sixteen districts actually corrected the racial imbalance in their
most segregated schools by moving pupils to other schools having a lower
percentage of Negroes in 1967 or by participating in a program that avoided
an increase in percentage of Negroes. Figures 1 and 2 illustrate this com-
parison. Albany, Rockville Conter,and West Irondequoit have been omitted
for 1967, in figure 1 because these districts did not receive funds for
racial imbalance in 1967 and were therefore not participating in a desegrega-
tion program.
In 1961 - 62, a school was considered racially imbalanced if 31 percent
or more of its students were Negro. There were 20 districts ( of the 26 in-
cluded in the present study) containing 67 elementary schools which met
that criterion. In 1966 there were 23 districts containing 98 schools which
had 31 percent or more Negro students, and in 1967 there were 21
districts containing 107 schools meeting that criterion. Of course, the
total elementary buildings in the districts also increased from 1961 to 1967,
which may account for the increase in the total number of affected buildings.
Figure 3, and tables 7 and 8 present a different approach to the def-
inition of racial imbalance in the schools by defining imbalance, for a
school, in terms of variance from the ethnic distribution of students in the
entire school district. Variance is defined as the amount by which the
percent of Negro pupils in a school differs from the percent of Negro pupils
in the school district in which the school is located. A positive variance
indicates that the percent of Negro pupils in a given school exceeds the
percent of Negro pupils in the school district by the number of percentage
points shown. A school with a positive variance has a greater proportion of
Negro students than the total school district student population.

FIGURE I
A Comparison of School Districts, Receiving State Aid for Racial Imbalance, Having Elementary
Schools With 3170 or More Negro Pupils for 1961, 1966,and 1967
(Excluding New York City)
No.
of School
Districts
28
18
16
14
12 10 2
Percent of Negroes in a School
Legend
1961
Or
1967111

-21-
FIGURE 2
THE HIGHEST PERCENT OF NEGRO STUDENTSIN ONE SCHOOL, FOR SCHOOL DISTRICTS RECEIVING
STATE AID FOR RACIAL IMBALANCE 1961, 4966, 1967
School. District
1961
Albany 1966
1967I I
1961 I; 1
Amityville 1966
1967I
mir1961 11
Bellport1966
1967 MI
1961.I I
1966 IBuffalo1967
Highest Percent of Negroes in any one School
31-40% 41-50% 51-60% 61-70% 71-80% 81-90% 91-100%
I
I
1961
Freeport1966
1
1967I I
1961I
Gleneove 1966 I
1967 II
19611
Greenburgh 1966
1967
1961
Hempstead 1966
1967
1961
Long Beach 1966
1967 I
a
I

School District
1961
Malvern 1966
1967
1961
1967
Middle Island 1966
-22-
FIGURE 2(continued)
Highest Percent of Negroes in any one School
31-40% 41150% 51160% 61-70% 71-80% 81-90% 91-100%
1961
Mount Vernon 1966
1967
1961 )
Niagara Falls 1966 t
1967
19611
Nyack 1966
1967
1961
Peekskill 1966
1967
1961
Rochester 1966
1967
1961
Rockville Center 1966
1967
1961
Roosevelt 1966
196711011miliMml

- 23-
FIGURE 2( continued )
School District Highest Percent of Negroes in any one School
31-40% 41-50% 51-60% 61-70% 71-80% 81-90% 91-100°'
1961I I
SchenectadyPM
1966 MEI
1967 pIIIIIIIIIII
1961(
Spring Valley 1966
11
I
Suffern 1966 111.1
1967
Syracuse
Westbury
1
1961
1966j_1967
1961 611111111111111111111111111111111111,.19661967
1961 II
West Irondequoit 1966d1967d
1961
White Plains 196611967
1961 1
Wyandanch 1966
1967

FIGURE 3
A Comparison of School Districts,
Receiving State Aid for Racial Imbalance, Having Elementary and
Secondary
Schools with a Greater Percentage of
Negro Pupils Than the District Percentage,
for 1966-67 and 1967-68 School Years
(Excluding New York City)
No.
ofSchool
Dist.
28
18
16
14
12
10 8 6 0
5.0
to9.9
... .
10.0
to
14.0
Legend
1966-67 110H
_1967-68
15.0
20.0
to
to
19.9
24.9
::.
25.0
to
29.9
30.0
to
34.9
....
:::.
::-:
:-::.
on I
L35.0
40.0
to
to
39.9
44.9
45.0
50.0
to
to
49.9
54.9
55.0
60.0
to
to
59.9
64.9
Number of Percentage points by which the Percent of Negro Pupils
of Negro pupils in the particular School district
65.0
70.0
to
to
69.9
74.9
in a School exceeds
75.0
to
79.9
80.0
to
84.9
the Percent

TABLE 7
TOTAL ENROLLMENT, PERCENT
NEGRO STUDENTS, AND HIGHEST
NUMBER OF PERCENTAGE POINTS
BY WHICH
A SCHOOL PERCENT NEGROEKCEEDED THE DISTRICT PERCENTNEGRO
PUBLIC SCHOOL STUDENTS
1961
1966
1967
School
District
1961
1966
Pita
Total Number
of Students
Enrolled in
District
Percent of
Negro Students
Enrolled in
Disttict
Highest Number of
Percentage Points
in Excess of Dist-
rict 2 Negro
Total Number
of Students
Enrolled in
District
Percent
of
Negro Students
Enrolled in
District
Highest Number of
Percentage Points
in Excess of Dist-
rict 2 Negro
Total Number
of Students
Enrolled in
District
Percent of
THighest
Negro Students
Enrolled in
District
Number of
Percentage Pants
In Excess of Dist
rict 2 Nero
Albany
7,149
24.6
58.6
12,991
28.4
67.6
12,674
29.1
65.6
Amityville
2,097
31.6
64.3
4.496
36.0
5.9
4,499
37.5
7.6
Bellport
1,543
6.6
6.0
3,849
17.2
35.4
4,023
18.9
12.9
Buffalo
34,444
33.2
66.8
72,762
34.8
65.1
72,692
35.3
64.7
Freeport
3,121
10.2
81.2
7,262
...
21.7
19.6
7,334
25.1
,14.2
Glen Cove
2,177
10.8
61.2
5,025
9.7
53.7
5,236
9.6
46.3
Greenburgh
1,214
37.0
4.8
2,989
36.6
17.8
3.073
38.2
26.0
Hempstead
2,256
53.5
30.8
5,306
67.4
27.7
5.497
69.7
26.5
Long Beach
2,406
3.4
6.0
6,089
7.3
19.4
6.195
8.8
20.2
Malverne
1,446
33.6
37.6
2.999
44.4
15.7
2,911
46.8
13.5
Middle Island
956
26.9
11.2
2.854
29.3
5.7
2,868
25.2
10.9
Mount Vernon
5,465
36.4
49.8
12,059
45.4
52.1
12.964
48.2
50.4
Niagara Falls
9,229
14.0
84.7
19,043
15.0
84.8
18.860
15.8
76.3
Nyack
**
*3.584
22.2
27.2
3.589
23.8
30.7
Peekskill
1,502
23.5
27.2
3.244
25.5
23.3
3.322
26.0
24.0
Rochester
20,864
22.0
69.7
45,365
26.4
72.2
46,570
27.4
71.6
Rockville Center
1,713
5.9
50.9
4,201
4.7
29.5
4.314
5.6
23.8
Roosevelt
1,691
28.9
66.1
3,676
52.2
10.3
3,846
59.2
20.1
Schenectady
5,532
5.3
32.2
12,409
6.8
32.1
12.624
7.1
33.8
Spring Valley
3.438
4.1
12.8
12,366
6.8
27.9
j14.327
8.1
9.2
Suffern
**
*4,286
2.6
32.5
4.908
2.8
50.5
Syracuse
15,042
13.1
76.9
30,650
17.6
74.1
30,862
19.3
58.3
Westbury
2.280
24.9
40.9
5,044
33.8
20.7
5.078
36.4
11.5
West Irondequoit
2,493
0.0
0.0
5,999
.9
5.4
5,977
1.2
4.7
White Plains
3,780
15.9
41.0
8,831
17.1
9.1
8.867
16.9
11.9
Wyandanch
798
70.3
0.0
2,255
81.6
0.6
2,253
85.1
5.0
Note: 1961 data are for grades
1-6 inclusive: 1966 and 1967
data are for all elementary
and secondary public schools.
*1961 data for Nyack and
Suffern are not available.

TABLE 8
NUMBER OF PUBLIC SCHOOLS AND SCHOOL DISTRICTS AFFECTED BY RACIAL IMBALANCE
AT DESCENDING INTERVALS OF POSITIVE VARIANCE*
SCHOOL DISTRICTS RECEIVING STATE AID FOR RACIAL IMBALANCE
1961, 1966 AND 1967
imii.
*Variance
Interval
(Positive)
Number of Districts
Affected in This Interval
Number of Schools
Affected in This Interval
Names of Districts Affected in Each Interval with Number
of Schools Affected in Each District Given in Parentheses
1961
1966
1967
1961
1966
1967
1961
1966
1967
80.0% - 84.9%
21
03
20
Freeport (1)
Niagara Falls (2)
Niagara Falls (2)
75.0% - 79.9%
10
11
01
Syracuse (1)
Niagara Falls (1)
70.0% - 74.9%
02
10
42
Rochester (3)
Rochester (2)
Syracuse (1)
I
65.0% - 69.9%
33
19
42
Buffalo (5)
Albany (1)
Rochester (2)
Rochester (3)
Buffalo (1)
Roosevelt (1)
Rochester (2)
60.0% - 64.9%
42
38
16
19
Amityville (1)
Buffalo (15)
Buffalo (17)
Buffalo (5)
Rochester (1)
Niagara Falls (1)
Glen Cove (1)
Rochester (1)
Rochester (1)
55.0% - 59.9%
33
27
64
Albany (2)
Albany (1)
Buffalo (3)
Buffalo (4)
Buffalo (4)
Syracuse (1)
Syracuse (1)
Niagara Falls (1)
50.0% - 54.9%
54
45
46
Albany (1)
Albany (1)
Buffalo (2)
Buffalo (1)
Glen Cove (1)
Mount Vernon (1)
Mount Vernon (1)
Mount Vernon (1)
Rochester (2)
Niagara Falls (1)
Rochester (1)
Suffern (1)
Rockville Centre (1)

TABLE 8
(Continued)
*Variance
Interval
(Positive)
Number of Districts
Affected in This Interval
1961
1966
1967
Number of Schools
Affected in This Interval
1961
1966
1967
Names of Districts
of Schools Affected
1961
Affected in Each Interval with Number
in Each District Given in Parentheses
1966
1967
45.07 - 49.9%
40.07. - 44.9%
35.0% - 39.9%
30.07 - 34.97.
25.0% - 29.9%
20.07 - 24.9%
1 5 2 2 5 2
2 4 3 5 6 7
1 3 2 4 5 9
1 6 2 2 6 2
3 5 3 7 8 8
1 6 2 4 7 13
Rochester (1)
Albany (1)
Buffalo (1)
Rochester (2)
Westbury (1)
White Plains (1)
Malverne (1)
Mount Vernon (1)
Hempstead (1)
Schenectady (1)
Albany (2)
Buffalo (1)
Mount Vernon (1)
Peekskill (1)
Schenectady (1)
Albany (1)
Hempstead (1)
Albany (1)
Buffalo (2)
Buffalo (1)
Mount Vernon (2)
Rochester (1)
Syracuse (1)
Bellport (1)
Mount Vernon (1)
Syracuse (1)
Mount Vernon (2)
Rochester (1)
Schenectady (2)
Suffern (1)
Syracuse(1)
Hempstead (3)
Mount Vernon (1)
Nyack (1)
Rochester (1)
Rockville
Centre (1)
Spring Valley (1)
Albany (1)
Buffalo (2)
Nyack (1)
Peekskill (1)
Schenectady (1)
Syracuse (1)
Westbury (1)
Glen Cove (1)
Buffalo (1)
Mount Vernon (2)
Syracuse (3)
Mount Vernon (1)
Rochester (1)
Mount Vernon (1)
Nyack (1)
h.)
Rochester (1)
jSchenectady (1)
'
Buffalo (1)
Greenburgh (1)
Hempstead (3)
Mount Vernon (1)
Schenectady (1)
Buffalo (2)
Hempstead (2)
Long Beach (1)
Niagara Falls (2)
Nyack (1)
Peekskill (2)
Rochester (1)
Roosevelt (1)
Syracuse (1)

TABLE 8
(Continued)
*Variance
Interval
(Positive)
Number of Districts
Affected in This Interval
Number of Schools
Affected in This Interval
Names of Districts Affected in Each Interval with Number
of Schools Affected in Each District Given in Parentheses
1961
1966
1967
1961
1966
I1967
1961
1966
1967
15.0% - 19.97.
57
45
10
5Albany (1)
Albany (1)
Buffalo (1)
Hempstead (1)
Freeport (2)
Rochester (1)
Rochester (1)
Greenburgh (1)
Schenectady (1)
Schenectady (1)
Long Beach (1)
Syracuse (2)
White Plains (1)
Malverne (1)
Niagara Falls (3)
Peekskill (1)
10.0% - 14.97.
810
13
10
16
17
Middle Island (2)
Albany (1)
Bellport (1)
Mount Vernon (1)
Buffalo (3)
Buffalo (1)
Niagara Falls (1)
Niagara Falls (2)
Freeport (2)
Peekskill (1)
Peekskill (2)
Malverne (1)
Rochester (1)
Rochester (1)
Middle Island (1)
Spring Valley (2)
Roosevelt (1)
Mount Vernon (2)
Syracuse (1)
Schenectady (1)
Niagara Falls (2)
White Plains (1)
Spring Valley (2)
Peekskill (1)
Syracuse (2)
Rochester (1)
Westbury (1)
Roosevelt (2)
Schenectady (1)
Westbury (1)
White Plains (1)
5.0% - 9.97.
914
17
10
20
29
Bellport (1)
Amityville (2)
Amityville (2)
Buffalo (2)
Buffalo (1)
Buffalo (1)
Freeport (1)
Freeport (2)
Freeport (1)
Long Beach (1)
Greenburgh (1)
Glen Cove (1)
Mount Vernon (1)
Long Beach (1)
Greenburgh (1)
Peekskill (1)
Middle Island (1)
Long Beach (1)
Rochester (1)
Rochester (2)
Malverne (1)
Schenectady (1)
Roosevelt (2)
Niagara Falls (2)

TABLE 8
(Concluded)
*Variance
Interval
(Positive)
Number of Districts
Affected in This Interval_
Number of Schools
Affected in This Interval
Names of Districts Affected in
Each Interval with Number
of Schools Affected in Each District
Given in Parentheses
1961
1966
1967
1961
1966
1967
1961
1966
1967
5.07. - 9.97
(Continued)
White Plains (1)
Schenectady (1)
Spring Valley (1)
Syracuse (2)
Westbury (1)
West Irondequoit
(1)
White Plains (2)
Peekskill (1)
Rochester (2)
Roosevelt (2)
Schenectady (1)
Spring Valley (6)
Syracuse (2)
Westbury (3)
White Plains (1)
Wynandanch (1)
NOTE:
Although Albany and Rockville Centerhad schools at variance in
1967, they are not shown because
Albany and
Rockville Center received no State
Aid for racial imbalance in
1967.
*Positive Variance is defined as
the number of percentage points
by which the percent of Negropupils in a school exceeds
the percent of Negro pupils in
the school district in which
the school is located.
I3 0

-30-
Figure 3 shows a comparison of school districts, receiving State aid for
racial imbalance, having elementary and secondary schools with a greater per-
centage of Negro pupils than the district percentage, for 1966 - 67 and 1967 -
68 school years (excluding New York City). The data for 196.1 - 62 was not
included in this particular comparison because secondary schools were not
included in the original racial and ethnic census at that time. It can be
seen that in 1967 (excluding Albany, Rockville Center,and West Irondequoit)
the one district that had previously contained schools with a percent of
Negro pupils exceeding the district percentage by a plus 80.0 to 84.9 points,
changed to the lower category of 75.0 to 74.9 percentage points.
Reaction of the Communities Involved
Table 9 gives an analysis of the results of a questionnaire (Exhibit
2 mailed to school district superintendents concerning come.
munity reactions to State funded projects to eliminate racial imbalance.
School superintendents were asked to check the appropriate response to 15
issues which, in their opinionsbest described the feelings of the community
concerning the State funded projects in their own school district, to
eliminate racial imbalance. They were directed to give the response for both
white and nonwhite members of the community. A three category response mode
was used, specifying either a negative reaction, a positive reaction, or
"does not apply."
Questionnaires were mailed to 27 district superintendents, and a total
of 19 were returned. The total positive responses to 15 items for 19 districts
was 280 (136 white and 144 nonwhite). The total negative response was 27
(22 white and 5 nonwhite).

-31-
Eight items on the questionnaire received negative responses. Items
receiving negative responses for both white and nonwhite were: items no.
1, 2, and 3, which deal, respectively, with transporting pupils (3 white,
1 nonwhite negative response), renting relocatable classrooms (4 white, 2
nonwhite negative response), and reassigning pupils to other schools ( 5
white and 1 nonwhite negative response).
Negative responses for white only, included items 8, 10, 12, 14, and
15 which, respectively, concern:
(a) providing guest speakers, consultation and advisory services ( 1
negative)
(b) planning future district reorganization to effect racial imbalance
(2 negative)
(c) special programs to improve school-community relations (1 negative)
(d) assigning additional staff (2 negative), and
(e) office of school integration (3 negative).
A few district superintendents checked both positive and negative
columns for issues which, in their opinion, involved both positive and
negative attitudes in their particular communities.
TABLE 9
ANALYSIS OF RESULTS OF QUESTIONNAIRESFOR SCHOOL SUPERINTENDENTS CONCERNING COMMUNITY
REACTIONS TO STATE FUNDED PROJECTS TO ELIMINATE RACIAL IMBALANCE
CommunityNumber
"positive"Responses
Number"Negative"Responses
Items Receiving"Negative"
Responses
Number-"Does Not Apply"Responses
White 136 22 #1,2,3,8,10,12,14115 132
Nonwhite 144 5 # 1,2,3 I 137
Total 280 27 8 269Number Questionnaires Mailed = 27
Number Questionnaires Returned = 19
Number Objective Questionnaire Items = 15

-32-
SUMMARY AND CONCLUSIONS
For the year 1966 - 67 the State Legislature appropriated one million
dollars to the State Education Department to help school districts develop
programs for correcting racial imbalance and improving the quality of in-
tegrated education. For the year 1967 - 68, the grant was increased to
$3,000,000. In some instances aid was given for planning desegregation, in
other instances aid was granted to districts that recently had desegregated
their schools but needed financial help for another year to complete their
desegregation plans, alter their plans, or meet the excess costs for another
year.
The number of districts applying for. aid was about the same both years
but the total amount of the budgets requested in 1967 was more than twice
that of the year before. Many districts, because of their own financial
difficulties, pleaded for more State aid than was allowable under the guide-
lines. As previously indicated, it became necessary to request a number of
school districts to revise their programs so that costs could be covered by
the funds available.
The racial and ethnic census data for both years indicated that in over
half of the districts receiving State aid, the number of schools with a great
percentage of Negroes decreased. Many of these 16 districts were involved in
transportation and relocatable classroom projects which may account for the
change in imbalance, The other districts which did not show a change in
racial imbalance were mostly involved in such programs as: demographic
studies, inservice training programs, curriculum planning, etc., which
would not reveal a change in school racial census.
The responses received from objective questionnaires mailed to school
superintendents in participating districts indicated that the majority of
community reactions concerning the various racial imbalance programs were
favorable.

-33-
Information from the school district evaluation reports, concerning
number of pupils participating in desegregation programs, showed that
the majority of pupils transported were nonwhite and that both transportation
projects and relocatable classroom projects increased considerably in
number from 1966 to 1967.
Actual expenditure reports from the finance office at the State Education
Department indicate that approximately two thirds of the State funds for
racial imbalance for 1966 and 1967 were used for personnel services.
How State aid funds were used for desegregation and integration purposes,
and the effect of the program on various communities may be described by the
following quotes from letters received from districts:
" The programs we have been able to operate as a result of State aid for
integration have been invaluable. Our Board would have been unable to
support these activities with local funds alone. We urge the continuation
of this type of special State Aid." (These activities included an inten-
sive planning session for staff members, purchase of human relations films
mmd equipment for disadvantaged pupils, and a tutorial program.)
"Efforts to provide racial balance with a quality educational program
have been somewhat hampered by lack of space for certain special teachers
(art, music, etc.) and special services (psychological, speech, reading, etc.)
in the elementary buildings. The 19 relocatable buildings we are renting
are meeting reguLAr classroom needs, but additional funds are vital in providing
the needed space for these services."
"In our budget and tax situation, with the community split as it is, the
funds available through the Division of Intercultural Relations were an
absolute necessity for the implementation of our program. We have been
questioned many times as to whether or not such funds will continue to be
forthcoming for the next several years. If, perchance, they are not, it is
our considered judgment that the Board will be forced to terminate the project."

-34-
"Rochester has demonstrated that enriched programs both cause greater
achievement and encourage parents, black and white, to become involved in
transfers.
"Parents of black children enjoying the Compensatory Education Program
being conducted in two Rochester schools certainly are supportive of the
State's efforts. The formal evaluation of the first year's program showed
these youngsters to be achieving at a rate superior to those in larger
unintegrated classes."
"A recognition of the increasing costs of any project undertaken is
essential. Without assurances of continued and increasing support, it is
difficult for a community to undertake certain projects."
"We are most pleased with the operation of our fifth and sixth grade
center, known as the Park Intermediate School, which was implemented as
a means of correcting a racial imbalance situation that had developed in
the district.
"As you are aware, there was considerable opposition to this plan,
primarily on the part of neighborhood school advocates, and it was extremely
critical that the plan we implemented meet with success. We felt it of
utmost importance that the educational program initiated be superior to
that which was previously in operation, and we feel now that this has been
accomplished even though it has only been in effect a few months.
"We are particularly grateful for the money allocated to us under the
State Integration Fund, for we would not have been able to achieve our
goals without it."
The appropriation for State aid for Correcting Racial Imbalance has
proven an incentive to districts to proceed at a more rapid rate to effectuate
racial balance and it has given those districts in which racial imbalance is

-35-
not a concern, an opportunity to develop programs leading to greater
understanding of minority groups. It has also inspired suburban districts
to accept into the schools, Negro children from the inner city.


-37-
THE UNIVERSITY OF THE STATE OF NEW YORKThe State Education Department
Office Of The President Of The UniversityAnd Commissioner Of Education
ALBANY
June 14, 1963
Tq: All Chief Local School Administrators and Presidentsof Boards of Education
Subject: Racial Imbalance in Schools
The State Education Department is constantly seeking to improve
policies and practices which will bring about the full operation of the
principle of equality of educational opportunity for persons of allsocial, economic and cultural backgrounds. In line with this effortand after studying the implications of the 1954 decision of the United
States Supreme Court, the Board of Regents adopted and announcedin January 1961, a Statement of Policy which contained the following
paragraph:
"The State of New York has long held the principlethat equal opportunity for all children, without regard todifferences in economic, national, religious or racialbackground, is a manifestation of the vitality of ourAmerican democratic society and is essential to itscontinuation. This fundamental educational principle haslong since been written into Education Law and policy.Subsequent events have repeatedly given it moralreaffirmation. Nevertheless, all citizens have theresponsibility to reexamine the schools within their localsystems in order to determine whether they conform tothis standard so clearly seen to be the right of every
The Regents' statement goes on to point out that modernpsychological and sociological knowledge seems to indicate that inschools in which the enrollment is largely from a minority group ofhomogeneous, ethnic origin, the personality of these minority groupchildren may be damaged. There is a decrease in motivation andthus an impairment of ability to learn. Public education in such a

-38-
situation is socially unrealistic, blocking the attainment of the goalsof democratic education, and wasteful of manpower and talent,whether the situation occurs by law or by fact.
To implement the Regents' policy, the Department has carriedon through its Division of Intercultural Relations, a continuing programof education and assistance aimed toward securing greater understand-ing and constructive action throughout the schools and colleges of theState. Important progress has been made, especially in highereducation.
To assemble additional information on the problem, the Depart-ment conducted in November 1961, a racial census of the elementaryschools of the State. The findings of that study were reported in July1962. The report identified a number of districts in which the ratio ofNegro to white pupils was relatively high and suggested that thesedistricts should give added attention to this situation.
In June 1962, I appointed a three-member Advisory Committee onHuman Relations and Community Tensions to advise and assist theDepartment and the local school districts. From its studies, theCommittee has developed a statement of principles for dealing withracial imbalance in the schools. A copy of this statement is enclosed.
The position of the Department, based on the policy of the Regents,and the principles of the Commissioner's Advisory Committee, is thatthe racial imbalance existing in a school in which the enrollment iswholly or predominantly Negro interferes with the achievement ofequality of educational opportunity and must therefore be eliminatedfrom the schools of New York State.
If this is to be accomplished, there must be corrective action ineach community where such imbalance exists. In keeping with theprinciple of local control, it is the responsibility of the local schoolauthorities in such communities to develop and implement the necessaryplans.
It is recognized that in some communities residential patterns andother factors may present serious obstacles to the attainment ofracially balanced schools. This does not, however, relieve the schoolauthorities of their responsibility for doing everything within theirpower, consistent with the principles of sound education, to achieve anequitable balance.

-39-
In order that the Department may know what your plans are for
carrying out this responsibility, I request that you submit to me by
September 1, 1963, the following information:
1. A statement indicating the situation in your district with
regard to any problem of racial imbalance, regardless
of the number of Negro children enrolled, or to the
actual existence of or trend toward racial imbalance.
At this time and for the purpose of this report, aracially imbalanced school is defined as one having 50
per cent or more Negro pupils enrolled.
2. A statement of policy by your board of education with
respect to the maintenance of racial balance in your
schools.
3. In districts where racial imbalance exists, or is a
problem, a report of progress made toward eliminating
it.
4. In such districts, your plan for further action,
including estimates of the additional cost, if any, and
of the time required for carrying out your plan.
In addition to this request for information from your district, I
have directed the staff of the State Education Department to reexamine
all State laws, rules, regulations, policies and programs pertinent
to the issue here under discussion, and to submit to me by the same
date any revisions that may be necessary for making them more
effective instruments for the elimination of racial imbalance.
These requests for more positive action to eliminate racial
imbalance in the schools of New York State are a logical extension of
State law and policy, necessary if the principle of equality of
educational opportunity is to apply to all, regardless of race, color,
creed or economic background. I am aware that many of you have
already taken constructive action in this regard and that you will
continue to do so. I am confident that working together we shall be able
to achieve solutions which will truly serve the purposes of education in
a democracy.
Please let me know how the Department can be of assistance to you
in this important effort.
Sincerely,
Enclosure James E. Allen, r.
Commissioner of Education

THE UNIVERSITY OF THE STATE OF NEW YORKTHE STATE EDUCATION DEPARTMENT
ALBANY, NEW YORK 12224
LORNE H. WOOLLATTCommtsslopicp roe FOCILTAIIKN
AND EVALUATION
September 24, 1968
Superintendent of Schools
The State Education Department is in the process of collecting
evaluation information concerning the effectiveness of the New York
State funded projects to eliminate racial imbalance and equalize
educational opportunity. This information is necessary for a report
to be presented to the legislature in October, for the purpose of
requesting continued and additional funds to further support the
efforts of school districts for quality integrated education.
You are being asked to give the reaction of the community in
your school district concerning the projects implemented to correct
racial imbalance during the 1966.67 and 1967.68 school years.
It would be appreciated if you would complete and return the
enclosed questionnaire within 10 days to the Division of Evaluation,
Room 471.
Sincerely,
Lorne H. H. Woollatt
Enc.

-41-
The University of the State of New YorkThe State Education Department
Division of EvaluationAlbany, New York 12224
School District Superintendent
Questionnaire Concerning Community Reactions to StateFunded Projects to Eliminate Racial
Imbalance
Please read each statement and check the response to those issues which in youropinion best describe the feelings of the community concerning the State fundedprojects, in your school district, to eliminate racial imbalance.
Check the appropriate response for both white and non-white.
1.
2.
3.
COMMUNITY RESPONSE
whitePos. Lek Does not apply
TransportingPupils 10
(8,11,2/5)(1,11,3/5)
Rentingrelocatableclassrooms 8 4
(71/2) (311)
Reassigningpupils toother schools 8
(7X7(4,0
4. Revising schoolcurriculum toinclude integratedmaterials
Trii)
non whitePos. Elg, Does not apply
-2-(10 3/4)(1k)
111121..MM
12 1
14 0

5. Using Para-professionals
6. Providing afterschool and earlyevening enrich-ment and tutorialcenters
7. Providing tripsto educationaland culturalcenters
-42-
wPos. Eta,
hiteDoes not apply
IMINNO MMENOWNIO
9 0 10
11 0 8
8. Providing guestspeakers, con-sultation andadvisory services 10
9. Minor alterationsof school build-ings
1 8
7 0 12MIMI
10. Planning fue_uredistrict reorgan-ization of schoolsto effect racialimbalance 5 2 12
11. In-servicttrainingprograms
12. Special programsto improve schoolcommunity relat-tions
12 0 7
11 1 7
non whitePos. Esal Does not apply
9 0 10
10 0 9
10 0 9
7 0 12
7 0 12
12 0 7
11 0 8

13. Providing in-
structionalresourcecenters
-43-white
Pos. tim Does not app
.5.... .0- ..L4
14. Assigning ad-ditional staff A.. 2._
15. Office of SchoolIntegration toplan and coordinateschool districtprojects 314) q(2k) Ilk.
Totals 133 19 123
non white
Pos. assi, Does not apply
.5-- --LL. --14
-9-- --0 --la
-5-- 0-- -44-
143 4 124
16. Any area not mentioned above which is applicable to your particular community
(please write statement here)
17. Suggestions for improving the program?
Completed by(Title)

STATE AID FOR CORRECTING RACIAL IMBALANCE
1966-67 SUMMARY REPORT
Project
Number
District
Budget*
Presented
Budget**
Approved,
State's
Share
Actual Expenditures
State's
Approved
Share
1019
Albany
6,615.02
4,645.00
2,322,50
4,343.91
2,171.95
1027
Albany
6,465.32
6,106.00
3,053.00
6,465.32
3,232.66
1007
Amityville
25,620.00
25,620.00
15,218.00
25,620.00
15,218.00
1016
Buffalo
247,864.00
247,864.00
130,598.50
149,452.68
79,702.51
1032
Buffalo
10,000.00
9,020.00
9,020.00
7,224.20
7,224.20
1005
Freeport
41,337.25
41,337.25
20,668.63
17,367.20
8,683.60
1011
Glen Cove
185,841.00
30,004.50
25,426.00
32,590.32
26,719.66
1009
Greenburgh 7
11,079.80
11,079.80
5.539.90
11,079.80
5,539.90
1012
Hempstead
246,739.00
63,072.00
31,536.00
41,332.89
20,666.44
1030
Long Beach
16,426.33
7,200.00
3,600.00
2,990.16
1,495.08
1031
Long Beach
5,000.00
5,000.00
5,000.00
5,000.00
5,000.00
1001
Malverne
769,972.00
51,200.00
51,200.00
1013
Middle Island
4,000.00
4,000.00
4,000.00
4,000.00
4,000.00
1025
Mount Vernon
82,129.73
82,129.73
41,065.00
68,487.32
34.243.66
1018
New Rochelle
52,727.00
Withdrawn
1023
New York City
62,983.00
62,183.00
31,091.50
62,183.00
31,091.50
1033
New York City
1,196,672.00
349,132.00
275,000.00
275,000.00
275,000.00
1026
Peekskill
18,606.00
18,606.00
9,303.00
Withdrawn
Withdrawn
October 24, 1968
(1)

STATE AID FOR CORRECTING RACIAL IMBALANCE
1966-67'SUMMARY REPORT
Project
Number
District
Budget*
Presented
Budget**
Approved
State's
Share
Actual Expenditures
State's
App
rove
dShare
1003
Rochester
$156,402.00
$120,000.00
$60,000.00
$164,608.91
$82,304.45
1002
Rockville Center
31,328.00
22,043.00
11,021.50
16,077.60
8,038.80
1008
Roosevelt
104,700.00
70,450.00
58,278.00
70,450.00
55,888.20
1024
Roosevelt
5,000.00
5,000.00
5,000.00
5,000.00
5,000.00
1017
Schenectady
40,743.00
40,743.00
23,590.00
33,085.95
19,156.76
1022
Spring Valley
9,242.08
9,242.08
5,646.00
6,938.33
4,239.31
1028
Spring Valley
9,219.84
9,219.84
5,633.00
8,872.57
5,421.14
1029
Suffern
3,000.00
3,000.00
1,500.00
3,000.00
1,500.00
1010
Syracuse
154,138.00
154,138.00
77,069.00
107,364.66
53,682.33
1006
Westbury
17,040.00
17,040.00
8,520.00
14,799.63
7,399.82
1004
West Irondequoit
30,387.83
30,387.83
15,193.91
2,325.00
1,162.50
1014
White Plains
31,100.00
31,100.00
15,550.00
27,470.28
13,735.14
1020
Wyandanch
19 344.00
19.344.00
19 344.00
9,121.70
9,121.70
$3,601,722.20
$1,549,907.03
$969,987.44
$1,182,251.43
$786,639.31
*Budget presented represents what the school district deemed necessary.
** Budget approved represents the review by the committee as toapprovable
priority of these items.
(1)
Approximate Figure - Final Expenditure report not
submitted.
October 24, 1968
items and to the establishment of a

STATE AID FOR CORRECTING RACIAL
IMBALANCE
1967-68
Project
Number
District
Budget *
Presented
SUMMARY REPORT
Actual Expenditures State's
Approved,
Share
Budget **
Approved
State's
Share
1137
Albany
5,605.04
$ Disallowed
1110
Amityville
30,411.00
30,411.00
28,408.00
24,366.22
23,108.46
1136
Bellport
8,374.06
Withdrawn
1101
Bellport #1
99,614.00
85,918.00
85,146.00
82,399.72
81,854.25
1104
Bellport #2
133,236.00
Withdrawn
1103
B.O.C.E.S.
18,606.00
18,606.00
9,303.00
12,917.00
6,458.50
1131
Buffalo
1,779,934.00
986,200.00
600,000.00
839,616.77
409,491.77
1127
Freeport
48,882.00
48,882.00
24,441.00
20,620.79
10,310.39
1125
Glen Cove
52,584.00
52,584.00
26,849.00
37,658.88
19,993.94
1112
Great Neck
15,071.00
Disallowed
1116
Greenburgh #7
20,516.89
20,216.89
10,108.44
15,761.97
7,880.98
1138
Greenburgh #7
8,005.52
8,106.12
8,106.12
8,175.20
8,175.20
1117
Hempstead
156,184.00
156,184.00
83,692.00
118,559.57
65,415.39
1108
Long Beach
16,426.33
16,573.00
8,286.00
10,984.50
5,492.25
1135
Malverne
199,971.00
151,730.00
98,425.00
96,019.90
90,665.04
1128
Mount Vernon
129,833.00
47,420.00
23,710.00
36,963.73
17,725.53
October 24, 1968

STATE AID FOR CORRECTING
RACIAL IMBALANCE
Project
Number
District
Budget *
Presented
1967-68 SUMMARY REPORT
Actual Expenditures
Budget **
Approved
State's
Share
Approved
State's
Share
1137
Mount Vernon
3,187.50
Disallowed
1139
Mount Vernon
450.00
200.00
200.00
150.00
150.00
1136
New York City
2,143,028.00
1,000,000.00
1,000,000.00
985,919.96
750,000.00
(1)
1113
Niagara Falls
69,575.86
56,067.00
34,158.00
48,194.66
29,717.84
1105
Nyack #1
8,000.00
8,000.00
4,000.00
8,000.00
4,016.00
1106
Nyack #2
19638.71
1,418.71
712.19
1,418.71
712.19
1111
Rochester
1,125,588.00
782,691.00
471,287.00
760,004.06
443,608.55
1115
Rockville Center
23,973.00
Withdrawn
1109
Roosevelt
138,879.30
138,879.00
99,027.00
132,292.87
93,576.36
1107
Schenectady
59,660.00
59,660.00
36,034.00
54,058.50
32,651.33
1102
Spring Valley
128,921.60
128,921.60
79,157.00
128.046.00
78,620.24
1114
Spring Valley
3,200.00
Withdrawn (2)
1132
Syracuse
400,000.00
400,000.00
200,000.00
390,396.13
195,198.07
1119
Westbury
137,891.00
137,891.00
84,415.00
128,540.99
79,360.42
1133
West Irondequoit
32,394.13
Withdrawn
1129
White Plains
30,000.00
26,750.00
13,375.00
20,559.59
10,279.78
1134
Wyandanch
10 222.04
199222.04
10,222.04
10 222.04
10,222.00
$6,854,644.54
$4,387,980.11
$3,047,744.79
$3,985,240.49
$2,482,733.52
October 24, 1968

STATE AID FOR CORRECTING RACIAL IMBALANCE
1967-68 SUMMARY REPORT
*Budget presented represents what the school district deemed
necessary.
**
Budget approved represents the review by the committeeas to approvable items and to the establishment of a
priority of these items.
(1) Approximate Figure
- Final Expenditure report incomplete.
(2) Combined with their first project.
October 24, 1968

Two Year. Comparison of Projects for Which State Aid Grants
Were Approved
To Eliminate Racial Imbalance and Improve Integration
Projects Dealing
With the Problems of Racial
Imbalance
School District
Projects Approved
1966 - 67
School District
Projects Approved
1967 - 68
1.
Rental of Relocatable Classrooms
and temporary rental of rooms ex-
isting outside the school district
jurisdiction.
Amityville
Glen Cove
Malverne
Westbury
Roosevelt
Amityville
Buffalo
Malverne
Niagara Falls
Rochester
Roosevelt
Westbury
2.
Transportation
Freeport
Malverne
Rockville Center
Roosevelt
Glen Cove
Mount Vernon
Bellport
Buffalo
Glen Cove
Hempstead
Malverne
Mount Vernon
New York City
Niagara Falls
Rochester
Roosevelt
Syracuse
3.
Minor Alterations of School
Buildings
Freeport
Bellport
Buffalo
Hempstead
Westbury
4.
Demographic, Planning and Other
Studies Related to Future District
Reorganization of Schools to Effect
Racial Imbalance and Improve Quality
Integrated Education
Roosevelt
Suffern
Wyandanch
Long Beach
New York City
Nyack
Wyandanch

5. Office of
Integration and
Other Such Offices
to Plan and
Coordinate School District
Efforts
to Bring About and Maintain
Racial
Balance, Etc.
6. Children'sAcademy
Hempstead
Syracuse
Buffalo
West Irondequoit
Schenectady
Mount Vernon
Buffalo
Hempstead
Syracuse
U UI 0
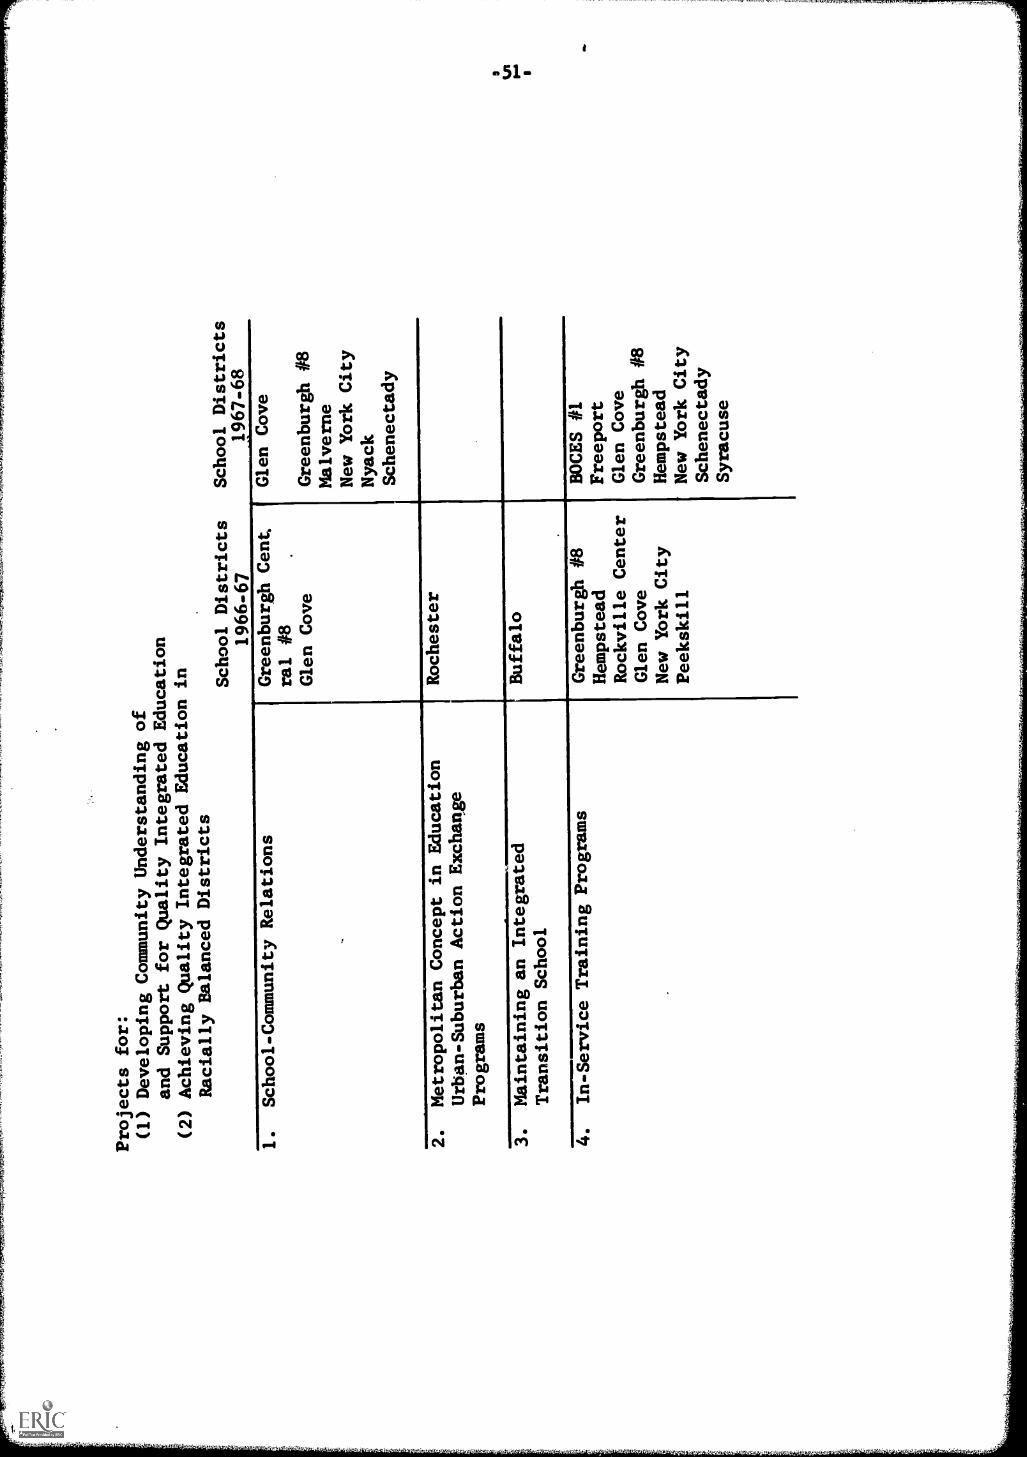
Projects for:
(1) Developing Community Understanding
of
and Support for Quality Integrated
Education
(2) Achieving Quality Integrated Education
in
Racially Balanced Districts
School Districts
1966-67
School Districts
1967-68
School-Community Relations
Greenburgh Cent,
ral #8
Glen Cove
Glen Cove
Greenburgh #8
Malverne
New York City
Nyack
Schenectady
Metropolitan Concept in Education
Urban-Suburban Action Exchange
Programs
Rochester
3.
Maintaining an Integrated
Transition School
Buffalo
4.
In-Service Training Programs
Greenburgh #8
Hempstead
Rockville Center
Glen Cove
New York City
Peekskill
BOCES #1
Freeport
Glen Cove
Greenburgh #8
Hempstead
New York City
Schenectady
Syracuse

Development of Integrated
Curriculum
Middle Island
Albany
Glen Cove
Greenburgh #8
New York City
Rochester
Schenectady
I UI N
Reduction of Class Size
- Additional
Teaching Positions involved in Prog-
rams to improve Racial Balance
Buffalo
New York City
Rochester
Special Services to Support the
Integration Program
Hempstead
White Plains
Buffalo
Freeport
Glen Cove
Greenburgh #8
Mount Vernon
New York City
Roosevelt
Schenectady
Syracuse
Westbury
8.
Use of Para-Professionals (Teachers
Aides)
Freeport
Hempstead
Glen Cove
White Plains
Amityville
Buffalo
Glen Cove
New York City
Niagara Falls
Rochester
Roosevelt
Schenectady
Syracuse
White Plains

Other Related Components
School Districts
School Districts
of Projects
1966-67
1967-68
p
1. Pupil Personnel Services
Malverne
2.
Instructional Resource Centers
of Intercultural Materials and
Special Instructional Materials
For Intergroup Education
Bellport
Buffalo
Mount Vernon
New York City
Niagara Falls
Rochester
Syracuse
Westbury
3.
After-School And Early Evening
Enrichment and Tutorial Programs
Rockville Center
Albany
White Plains
Freeport
Glen Cove
Syracuse
White Plains
4.
Trips to Educational and Cultural
Centers
5.
Living Camping Experiences
Spring Valley
6.
Consultation and Advisory Services
Guest Speakers
Hempstead
Mount Vernon
BOCES (Peekskill)
New York City

1.
Holding Class
Long Beach
8.
Reverse Open Enrollment Programs
New York City
9.
Heterogeneous Classes
New York City
New York City
0.
Linear City
New work City
1.
ricrtiOnninoterrtlAyediragroncOrk-
ops
New York City
2.
Preventing School Dropouts
Spring Valley
1

-55-
A STUDY OF THE
EDUCATIONAL EFFECTIVENESS OF
INTEGRATION
A Comparison of Pupil Achievement
Before and One Year After Integration
A Survey of the Attitudes of
Principals, Teachers, Parents, and Pupils
Involved in the Program

-56-
BUFFALO PUBLIC SCHOOLSBUFFALO, NEW YORK
Superintendent of Schools - Dr. Joseph Manch
Board of Education
Dr. Bernard S. Rosenblat, PresidentGeorge F. Goodyear, Vice-President
Joseph E. MurphyDr. George E. BlackmanDr. Matt A. GajewskiAnthony J. NitkowskiCarmelo A. Parlato
Research Design Developed and Report Prepared by:
Ronald Banks, Director of Evaluation
Mrs. Mary Ellen DiPasquale, Supervisor of Curriculum
Division of Curriculum Evaluation and DevelopmentDr. Frank J. Dressler -- Associate Superintendent

-57-A STUDY OF THE
EDUCATIONAL EFFECTIVENESS OFINTEGRATION
FINDINGS
Negro pupils integrated into classes with white pupils make greater
gains in academic achievement than do pupils who remain in segregated
schools.
White pupils do not suffer losses in academic achievement as a
result of integration.
Negro pupils make the greatest gains when they are in integrated
classes where the number of Negro pupils is 30 percent or under.
Principals and teachers in schools receiving Negro pupils believe
that the integration program has demonstrated positive educational
results.
Parents of Negro and white pupils involved in the integration program
believe that it is educationally sound.
Negro and white pupils involved in the integration program believe
that it is a good idea.
These conclusions are drawn from a study of the effects of bussing
nearly 1,200 Negro oupils in the Buffalo (N.Y.) Public Schools from segre-
gated inner city schools to other schools where the pupil population was
composed primarily of white children. The Negro pupils, in grades 5, 6 and
7 were bussed from six inner city schools (37, 39, 48, 53, 59, 74) to 22
receiving schools (9, 11, 18, 19, 21, 22, 30, 42, 43, 44, 45, 51, 63, 64,
65, 66, 67, 69, 72, 78, 79, 80) where they were integrated into classrooms
with white pupils.
This bussing took place in September 1967 as a part of the racial
balance program approved by the Buffalo Board of Education upon the
recommendation of the Superintendent of Schools, Dr. Joseph Manch.
Previously, in November 1965, approximately 350 pupils, most of whom were
Negro children, were bussed to 12 peripheral schools where the student
population was 30 percent or more white and about 210 pupils in grades 1-7
were transferred from School 37 to five other peripheral schools to reduce

-58-
class size at School 37 (1). Further transfers from inner city schools
to peripheral schools in 1966 have increased the number of inner city
children being integrated in classes in peripheral schools to over 2,000.
Comparison of Pupil Achievement
In preparation for this transfer, all white and Negro pupils in
grades 5, 6 and 7 in both the sending and the receiving schools were
tested early in June 1967. The Stanford Achievement Test (1964 Edition)
Intermediate Level II, Form X, was used to pre-test grades 5 and 6 and the
Advanced Level, Form X was used to pre-test grade 7. The Intermediate
Level II, Form X contained sub-tests on Word Meaning, Paragraph Meaning,
Arithmetic Computation and Arithmetic Concepts. The Advanced Level,
Form X, contained sub-tests in Paragraph Meaning, Arithmetic Computation,
Arithmetic Concepts, and Arithmetic Applications.
After one year, in June 1968, all pupils, now in grades 6, 7 and 8,
were again tested. The Stanford Achievement Test (1964 Ed.) Intermediate
Level II, Form X, was used for grade 6 and the Advanced Level, Form X,
was used for grades 7 and 8. All answer sheets were scored by an IBM
Optical Scanner with Card Punch Model 530. Data processing of score con-
version and statistical analysis was performed on a Honeywell 200 computer.
A total of 3,051 pupils was tested both in June 1967 and June 1968
and matched. Pupils who did not take both the pre-test and the post-test
were excluded from the analysis.
The research design for the study, prepared by the Director of
Evaluation of the Buffalo Public Schools with consultative advice from
research personnel at the State University of New York at Buffalo, posited
three hypotheses. These were:
1. Black children will gain in achievement more rapidly in an
integrated class than in a segregated class.
(1) A Study, issued in March 1967, of the Reading Achievement of thepupils transferred from Schools 15 and 37 to other schools, ascompared with the pupils who remained at School 37, showed positivegains for the bussed pupils after one year of integrated education.

-59-
2. White children from segregated white classes will gain in achieve-
ment at a normal rate after their classes have become integrated.
3. Negro children will continue to gain at a lower rate of achieve-
ment in segregated black classes if they remain in such classes.
To check the three hypotheses, the data were treated in different
ways. The achievement of Negro children in integrated classes was
compared with that of Negro children who remained in segregated black
classes and with white children in integrated classes. The sub-tests,
Paragraph Meaning, of the Intermediate Level II, Form X, and the Advanced
Level, Form X were selected for this comparison, since these tests most
nearly correlate with successful school achievement. The statistical
results of this treatment are shown in Table I.
As a further check of the hypotheses the total number of pupils
pre- and post-tested was divided into groups on the basis of the number
of Negro children in each class at the time of the testing in June 1968.
Group 1, with 0-5% black pupils, was considered a segregated white
group; groups 2 and 3, ranging from 5-10% and 10-30% black pupils, were
considered integrated groups; and groups 4 and 5, ranging from 30-75%
and 75-100% black pupils, were considered as segregated black groups.
Pupil scores on the pre- and post-tests were treated statistically
in terms of the variance th;r1 these groups. The results of this
treatment are shown in Table II.

-60.
Table I
Differences in achievement in Paragraph Meaning, as shown bymean grade equivalent scores and mean growth for each group.
GRADE EQUIVALENT SCORES
Grade Mean of Mean of Mean GrowthLevel Pre-Test Post-Test Mean Growth for Grou.
§/..-----rf- 6/68
INTEGRATED NEGRO PUPILS
5-6 3.9 4.5 .66-7 5.3 6.1 .8 .837-8 5.8 6.9 1.1
NEGRO PUPILS REMAINING IN SEGREGATED INNER CITY SCHOOLS
5-6 4.0 4.8 .86-7 5.2 5.4 .2 .567-8 5.2 5.9 .7
WHITE PUPILS IN RECEIVING SCHOOLS
5-6 5.3 6.5 1.26-7 6.6 7.6 1.0 1.237-8 7.1 8.6 1.5
Grade Level = grade for pre-test, June 1967 and grade for post-test,June 1968
Interpretation of Table I:
1. The pre-test scores clearly show that white pupils started
higher in each grade.
2. Negro pupils who were integrated and Negro pupils who remained
segregated in inner city schools started at about the same point,
except for grades 7-8 where the integrated pupils were higher
than the non-integrated Negro pupils.
3. The post-test scores show that the white pupils gained the
most in the year at each grade level and in mean growth (1.23).
This analysis does not show how the annual growth of the white
pupils compares with their previous rate of growth.

While it was not possible to isolate the scores of white pupils
in this study for previous years, it was possible to analyze
the scores achieved in Paragraph Meaning in these 22 schools in
the grades in which the children were or should have been for
the three years previous. During these years the annual average
gain was between 0.8 and 0.9.
4. Negro pupils who were integrated gained in mean growth (.83) at
a rate higher than the non-integrated Negro pupils whose mean
growth was (.56).
Table II summarizes the results of achievement in reading and
mathematics and substantiates the hypotheses.
Group
1
2
3
4
5
PercentageBlack Pupils
0 - 5%
5 - 10%
10 - 30%
30 - 75%
75 - 100%
Table II
Adjusted Mean ScoreBefore
Integration 6-67
25.0
20.1
19.2
16.3
14.2
Adjusted Mean ScoreAfter
Integration 6-68
32.1
.25.9
24.9
20.1
17.6
MXYGains*
25.2
24.7
24.6
22.4
21.9
* MXY Gains represents the gains in achievement made between June 1967
and June 1968 with a correction factor inserted which rules out all
factors that might affect the pre- and post-test scores, other than
the percentage of integration.
Interpretation of Table II:
1. Among the five groups studied, the range of integration by percent
of black students ranged from 0% to 100%.
2. The segregated white (0-5% black) classes started at a higher
level of achievement and ended after one year at a higher level
of achievement than the other four groups. However, the growth
rate, as given in the MXY Gains column, was of the same magnitude
as that of groups 2 and 3, the integrated groups.

-62-
3. There is no difference statistically between groups 2 and 3 and
group 1 in terms of growth rate. That is, classes with a black
membership of between 5% and 30% grow at a rate comparable to
white classes with less than 5% black membership.
4. Segregated black classes, groups 4 and 5, start at a lower level
of achievement and gain less than do integrated classes. There
does not appear to be any difference in growth patterns between
groups 4 and 5, even though the range of black students differs
in the two groups. Apparently, when the percentage of black
pupils in a class is over 30% black, the class tends to gain at
the same rate as if the class were at or near 100% black.

-63-
SURVEY OF ATTITUDES OFPRINCIPALS, TEACHERS, PARENTS AND PUPILS
In order to determine aspects of the racial balance program
other than the academic achievement of the pupils, a questionnaire
survey of attitudes and opinions of persons involved in the program
was made. Questionnaires were sent to all principals in the receiving
schools and to a random sample of teachers who had bussed pupils in
their classes and to pupils and their parents.
All survey questionnaires were, by direction, returned unsigned
and there was no way to determine who responded or failed to respond.
A summary of the survey is contained in Table III.
Table III
SUMMARY OF SURVEY RESPONSESINTEGRATION STUDY
Percent who thinkthe bussing-integrationprogram is education-
Number Number Percent ally sound, demonstrated
Sent Returned Returned positive results, or isa good idea.
Principals 22 17 17 75
Teachers 22 20 91 85
Negro Parents 160 45 28 91
White Parents 264 161 61 71
Negro Students 160 41 26 76
White Students 264 165 63 71
A detailed analysis of the questionnaire survey follows. Also
included in each classification are unedited comments of principals,
teachers, parents and pupils as they appeared on the questionnaires
returned.

-64-
PRINCIPAL SURVEY
Twenty-two principals of receiving schools were sent questionnaires.
Seventeen, or 77% were returned. These principals responded as follows:
Percent of Non-White Pupils in School
Number of Schools % of Non-White Pupils
4 less than 5%
8 5% to 10%
2 11% to 20%
21% tp 30%1
Principals said school and pupil characteristics had changed after
integration as follows:
Achievement:
6% higher or significantly higher
44% no change
50% somewhat lower or significantly lower
Intelligence:
0% higher or significantly higher
63% no change
37% somewhat lower or significantly lower
Incidence of discipline problems:
13% somewhat lower or significantly lower
13% no change
74% higher or significantly higher
\ppearance of building and classroom:
0% better appearance or significantly better
56% no change
44% poorer or significantly poorer
Non-White students' attitude toward the new school environment:
44% seem to be satisfied or enthusiastic
23% no evident change
33% show a negative or rebellious attitude

-65-
Principals responded to the effect of integration upon the wFite
student in their schools in terms of:
Achievement:
0% white students have shown gain orconsiderable gain in achievement
93% white students have remained the samein achievement level
7% white students have shown a considerableloss in achievement level
Social Behavior:
73% white students are getting along fairly wellor extremely well with non-white students
27% there doesn't seen to be much change insocial behavior because of the bussing andintegration program
As educators, principals responded that integration of non-white
pupils in their schools has demonstrated positive results as follows:
73% yes
27% no
Principals Commented as Follows:
"I should like to explain what seems a contradiction in answers.
The level of achievement in the school seems to be lower, but this is
not due primarily to the question of integration per se. The neighbor-
hood is changing, particularly with a more educated group moving out
and a lower socio-economic group moving in."
"Also, the bussed-in children, on the surface and as far as
behavior goes, do not seem to be too unhappy."
"The purpose, I thought, was to raise the level of achievement of
the Negro Children. I have found that some children are better than our
own and many are the same as the children who belong in this area and they
are people who need as much help as the children who are being bussed
into the school."

natiag,0,4
-66-
"It is difficult to assess the results based on a small number
of students."
"Some of the non-white students have been surly and seem negative
in approach and general outlook. It seems to be a matter of individual
differences in attitudes. Of course, 7th and 8th grade is too late to
begin bussing or integrating. Adolescent pupils have quite strongly
established habits and attitudes before they come to a new school."
"Approximately 12 new pupils were put into each 7th and 8th grade
last year. Most of them came with all failing marks and with low
achievement levels. Those who came with good marks found they had to
work much harder. Not many new friendships were made - and most of
these pupils formed a group within each class."
"However, about half of these pupils who are here this year are
now assimilated and have made some friends."
"This year when bus pupils had been screened so that they were
about the same achievement level, the school has been able to function
approximately the same as before bussing."
"Last year, children at 3rd grade level of achievement who were
defiant and disturbed caused so much trouble that lessons could not
be taught as before. They set a poor example of non-whites. The bus
children this year have come ready to learn and to behave."
"The conclusion I draw is that integration should start at an
earlier age before wrong attitudes have been established; and that
pupils should be at about the same achievement level so that they
can work together harmoniously."

-67-
TEACHER SURVEY
Of the 22 sent out, twenty surveys or 91% were returned. They
responded on their non-white class membership as follows:
Number of Teachers Non-White Class Membership
4 less than 5%
8 5% to 10%
4 11% to 20 %
2 21% to 30%
131% to 407.
1over 40%
Characteristics of the class after integration are considered by
the teachers as follows:
Achievement:
6% higher or significantly
63% no change
31% somewhat lower or significantly lower
Intelligence:
0% higher or significantly higher
94% no change
6% somewhat lower or significantly lower
Incidence of discipline problems:
29% somewhat lower or significantly lower
24% no change
47% higher or significantly higher
Appearance of buildings and classrooms:
6% better or much better
63% no change
31% somewhat poorer or significantly poorer

-68-
Non-white students' attitude toward new school environment:
56% seem satisfied or enthusiastic
19% no change
25% negative or rebellious attitude
Teachers responded to the effect bussed pupils have upon the white
students in their classes in terms of:
Achievement:
0% white students have shown some gain orconsiderable gain in achievement level
100% white students have remained the same inachievement level
0% white students have shown a considerableloss in achievement level
Social Behavior:
70% white students are getting along fairlywell or extremely well with non-whitestudents
15% there doesn't seem to be much change insocial behavior because of the bussingand integration program
15% white students show indifference or aredefinitely not getting along with non-whitestudents
As educators, teachers felt that integration of non-white pupils
in their schools has demonstrated positive results as follows:
85% yes
15% no
Teachers Commented as Follows:
"It seems to me that our results would be more satisfactory if it
were possible to screen out both white and non-white pupils suffering
from severe emotional disturbances. We would be able to accomplish so
very much more. The whole program would then be a pleasant experience
for all concerned. Some non-white children are delightful to have in
the classroom and are always accepted by everyone."
"It is unfortunate that one or two tend to spoil a very favorable
learning climate and give support to arguments against integration."

-69-
"Non-white students do not get along with other non-white students.
Ihave encountered few instances of white and non-white friction. The
majority of the problems He in the realm of non-white --- non-white
elationships."
"The program would be more effective scholastically and socially if
begun in the early grades."
"Children's attitudes toward one another are good but to my knowledge
contact does not extend outside of school - possibly due to distances -
or parental pressures."
"Since our bussed children this year are for the most part very
good, discipline and interest in school have remained the same."
"In our school, Ithink the program is effective and worth continuing."
"This is an unfair analysis for an educator. In many instances
the child came with a lower rating and therefore needed far greater help
than one could allow, therefore, all children lost in such instances."
"Where children were chosen from nearly the same levels in own
school, there was much gained by all children."
"It is surprising how quickly young children adjust to each other
if the teacher makes the child feel welcome."
"The answer is yes, if the aim was to raise the level of
achievement of the non-white children. However, my experience with
four students last year showed the extremely low achievement in every
area because of their lack of background --- basic concepts, under-
standings, and skills. Through working with them independently, a
few did show much growth. However, they realized they lacked more
basic ideas than any of the schools slowest white children during the
normal procedures. The children who are ready for new work and progress
cannot be held back to wait for these few to grasp the early primary
concepts. They need much remedial reading and mathematics concepts
and skills."

-70-
PARENT SURVEY
Parents of Negro Children
Of 160 surveys sent to parents of Negro children, 45 or 28% of the
surveys were returned. All parents had children in fifth, sixth, seventh
or eighth grade.
Asked their opinion of the bussing program, these parents in the
Inner City responded in the following areas:
Child's interest in school:
60% improved or greatly improved
31% stayed the same
9% declined or declined a great deal
Child's behavior in school:
49% improved or greatly improved
38% stayed the same
13% declined or declined a great deal
Child's attitude toward the white pupils:
73% have a satisfactory or enthusiastic attitude
20% no change
7% have a negative or rebellious attitude
Child's school achievement:
54% improved or greatly improved
30% stayed the same
16% declined or declined a great deal
Child's attitude toward bussing program:
67% favorable or very favorable
13% neutral
20% unfavorable or very unfavorable
When asked if they felt the bussing and integration programs were
educationally sound, Negro parents responded:
91% yes
9% no
Parental response as to whether or not they wished their children to
continue in classes in their present school was:
78% yes
22% no

-71-
Negro Parents Commented as Follows:
"My children have learned more about the city since they were bussed.
Know how to go to different places and so far, I have not had any complaint
in the school about my children, and the teachers get along fine, since
both of them in this school are in the 90 bracket. They get along with the
white children very fine in school and after."
"My children who are bussed like the idea, now that it has continued
this long. I want it continued. They have made many white friends and
they like their principal and teachers, all but one. The white kids have
learned there is no difference in children of all races and have accepted
that fact. I have been there to visit, and such warm reception I never
received at an all Negro school. Thanks again for the bussing program."
"Until my children were bussed their interest in school was enthusiastic.
Opening of school was anxiously awaited during summer vacation. Now it is
different. They have to be coaxed to get up and get to school on time. I
sincerely feel after several visits to the school, that the children are
not treated properly. Rather than bussing, I think the money should be
used to provide adequate schools in their neighborhood."
"I am very pleased the way my daughter has improved in all of her
subjects. The integration program is wonderful. I wish all the schools
were integrated, because we still have a long way to go."
"To me it doesn't make sense for my child to go 15 or 20 miles when
he or she could go nearest to their home, and I don't approve of it and
will not bus my child."
"My child has made a great improvement in school. I am very pleased
with his school. Ihave been out to visit his teachers; they are very
nice I think."
"I think bussing is a very good idea. There should be more bussing,
mainly when they are in 5, 6, 7 grades. My child's attitudes were very
good in every way; so were her marks. Any they still are very goA."

-72-
Parents of White Children
Of 264 surveys sent to parents of white children, 161 or 61% were
returned. These parents had children in the fifth, sixth, seventh or
eighth grade. Ninety-four percent had children in classrooms with less
than eleven black children.
Parents responded to changes that have taken place in their children
as follows:
Child's interest in school:
11% improved or greatly improved
86% stayed the same
3% declined or declined a great deal
Child's behavior in school:
6% improved or greatly improved
90% stayed the same
4% declined or declined a great deal
Child's behavior toward bussed pupils
56% favorable or very favorable
37% don't know
7% unfavorable or very unfavorable
Child's school achievement:
15% improved or greatly improved
80% stayed the same
5% declined or declined a great deal
Asked if they considered having bussed children in their child's
classroom educationally sound, white parents responded:
71% yes
29% no
Asked if they wished their child to continue in classes with bussed
children, they responded:
79% yes
21% no

-73
White Parents Commented as Follows:
"I believe in racial equality and if other people want their children
bussed to the school where my children go, I want my children to accept
them as they would anybody else."
"I have four daughters attending 72, and thus far have not heard one
complaint against the bussed children. Maybe if we all got along as well
as the children do, this would be a better world."
"I feel that integration should begin in the lower grades so that all
children have the same educational background. Bringing non-white pupils
into the upper grades causes many disruptions, and unless the white child
is fortunately bright, he will be held back in his work while non-white
children catch up. Unfortunately, these children present behavior problems
that might not be as bad if they had observed proper discipline while
younger. Their dislike and distrust of the white children is very notice-
able, probably because their feelings are set by the time they've reached
this age."
"I feel this is beneficial since the child will accept a racial
different as an equal, and this concept will be likely to continue through-
out life. Therefore, although this may not be a cure all to tensions,
it will alienate some problems we now face. In addition, to know someone
different than ourselves, helps us to see them as individuals, not as
groups through a person-to-person relationship."
"Being a member of the minority group, I am for what will best serve
humanity; so what is better than people of all colors, creed and religion
being exposed to each other's culture, hopefully leading to understanding
and living in peace with your fellowmen."
"I see no great difference in my child's attitude or work since
attending school with non-white pupils, but believe it will teach white
students tolerance and understanding if they spend their school hours with
non-white students, as well as white. This system will be very beneficial
to both races."
"It is a great injustice to the bussed non-white child in forcing him
to commute 2 or 3 miles out of his neighborhood in order to appease a
minority militant pressure group. This does not represent the wishes or
desires of either the non-white parent or the white parent. It can only
aggrevate racial tensions."

.74.
"It is necessary for students to have a well-rounded quality
integrated classroom. Children should be exposed to all types of races,
creeds, colors, so that they are able to develop into mature adults
capable of adjusting to a realistic society in the adult world. Integra-
tion should, however, be started at the primary or kindergarten level, as
this is the time children are least prejudice and most receptive to
learning. Also parent seminars, community education, programs such as
the opening of public school for adult activities, and family activity
of an interest to the entire family is necessary to promote understanding
of one another. To date there has been such a separation of black and
white students and families, that the school must portray the part of a
cultural center allowing both cultures to adjust and learn from one
another."
"Children should attend school in their own community. In case of
emergency, many parents would find it a hardship to go and get this child."
"It doesn't bother me one way or another. After all, these children
have a right to an education no matter where it may be."
"No complaints re: bussing of children to this school, but would
not want my children bussed out of this area. Have purchased property in
area principally because of nearness to schools."
"Give the bussed-in pupils the same education as the white pupils,
but do keep the children in their own area."
"In adult life we meet people from all walks of life. People tend to
like and approve all situations that are familiar to them. My son's life
has been enriched at an early age through the meeting and understanding
of people from different backgrounds."
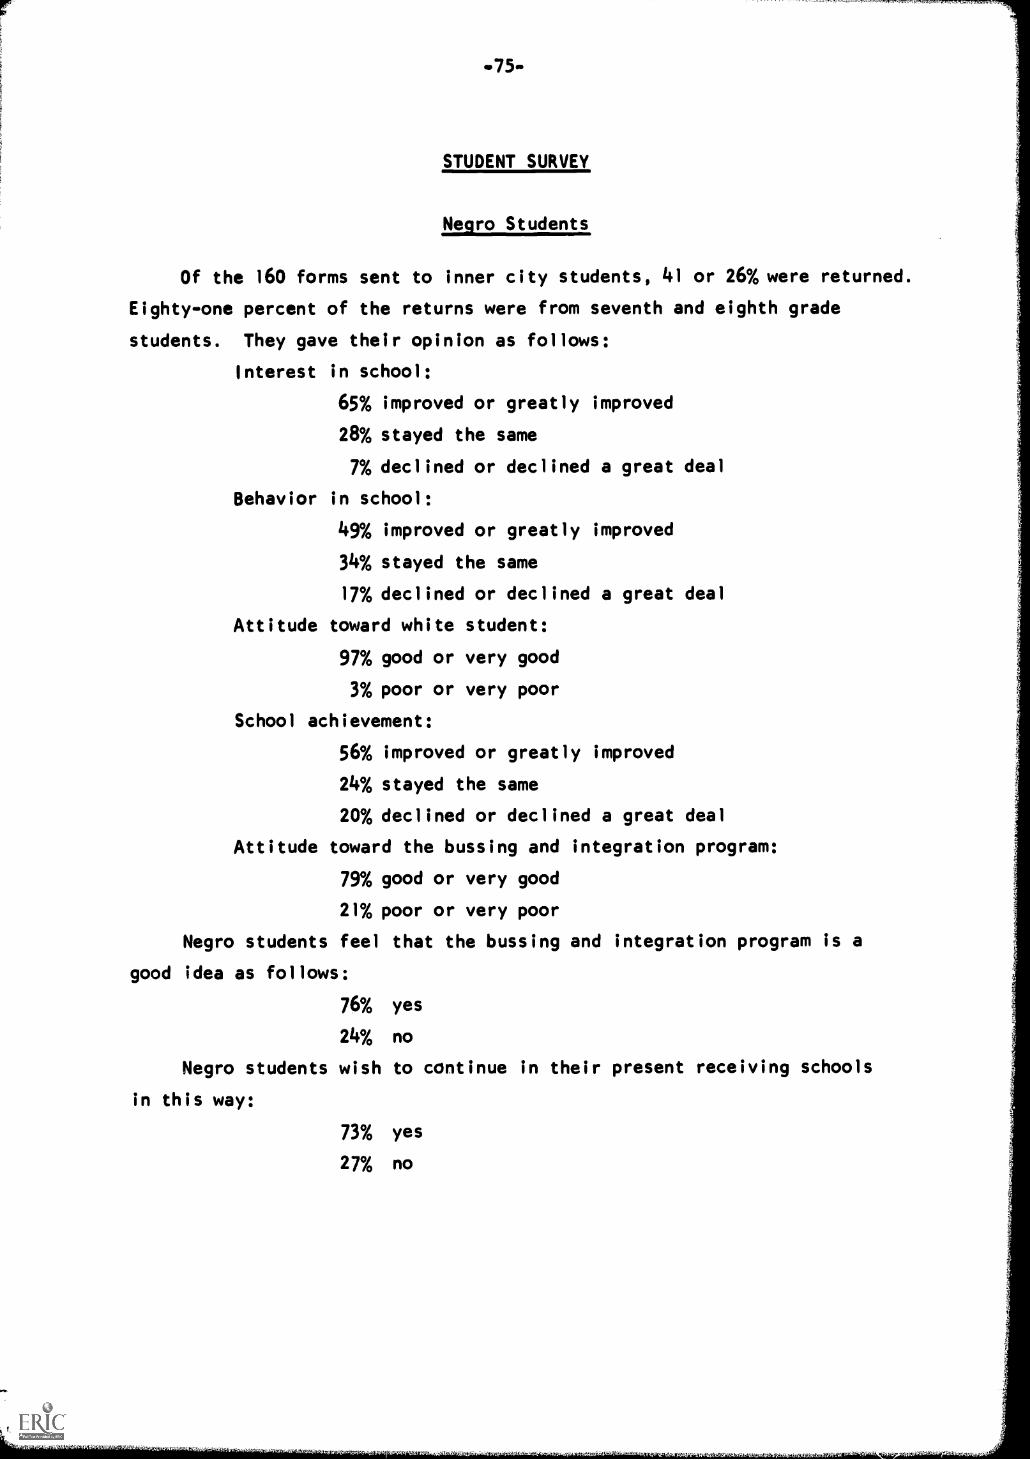
-75-
STUDENT SURVEY
Negro Students
Of the 160 forms sent to inner city students, 41 or 26% were returned.
Eighty-one percent of the returns were from seventh and eighth grade
students. They gave their opinion as follows:
Interest in school:
65% improved or greatly improved
28% stayed the same
7% declined or declined a great deal
Behavior in school:
49% improved or greatly improved
34% stayed the same
17% declined or declined a great deal
Attitude toward white student:
97% good or very good
3% poor or very poor
School achievement:
56% improved or greatly improved
24% stayed the same
20% declined or declined a great deal
Attitude toward the bussing and integration program:
79% good or very good
21% poor or very poor
Negro students feel that the bussing and integration program is a
good idea as follows:
76% yes
24% no
Negro students wish to continue in their present receiving schools
in this way:
73% yes
27% no

-76-
Negro Students Commented as Follows:
, as a student of School , think that if the whites
and the blacks will ever reunite, it will be by the process of the school
children grouping up together, and by the bussing program. This brings
whites and blacks together starting this process."
"I get along very well at my school. My teachers are understanding.
Sometimes there is a problem, but nottoo great that can't be ironed by
our principal or our teachers. I want to continue the school I now attend
until I graduate from the eighth grade. My mother didn't like the idea
at first, but she does now and thinks it should be continued just like I
do. Thank you, for this opportunity to attend the white school #80 and
thank them for accepting me the way they did."
"I don't think color should be talked about so much by classroom
teachers."
"Being bussed is good for furthering my education. It also helped
up my marks."
"Please keep us in the school. I like the idea, I have many friends,
and the teachers and principal are ideal:- Any problem there is can be
ironed out okay. Thank you for this opportunity to be bussed."
"Well for one think there are more schools closer to my house that I
would like to go to. It is not that I don't like white people, I like
them just as like they were my color."
"It is a better idea, and you learn more. We have all kinds of hops,
plays, clubs on Thursdays, free homework periods.I didn't have this at
the other schools."
"I think that children like us that are being bussed out should stay
where we belong, because we learn just the same out there as we learn
here in school around us. Plus I feel that it is unreasonable to wait out
in the cold weather for 30 minutes when we could be in school. Also out
there there are no recreation areas such as swimming pools, more Home
Economics rooms, larger gyms and after school dancing."
"I like the school very w01. And would like to say that it is
better than an all negro school. Some of the white students treat me as
he or she would treat a white student. I get along with the white very,
well and they get along with me very well also."

-77-
White Students
Of the 264 survey forms sent to white students, 165 or 63% were
returned. Ninety-four percent of the students are in classrooms whose
enrollment includes less than eleven non-white students.
The students responded to the change since bussed children have come
to their classes as follows:
Interest in school:
17% improved or greatly improved
80% stayed the same
3% declined or declined a great deal
Behavior in school:
16% improved or greatly improved
81% stayed the same
3% declined or decline a great deal
Attitude toward bussed pupils:
96% good or very good
4% poor or very poor
School achievement:
25% improved or greatly improved
70% stayed the same
5% declined or declined a great deal
Asked if they felt having bussed pupils in the classroom is a good
idea, the white students responded:
71% yes
29% no
They answer as follows to whether they wished to continue in classes
with bussed children:
79% yes
21% no
3

White Students Commented as Follows:
"Some of my best friends are bus girls. They are polite and like to
learn. I hope the city keeps up the good work and likes the program as
much as I do."
"At first, I suppose, the white kids felt uneasy when around the
Negro kids, and vice versa. After a while we developed special friend-
ships and began to understand each other well. I guesswith so many prob-
lems of racism, we felt obligated to get to know each other well, so we
could make a judgement for ourselves if there was any reason for racism
itself."
"I think they should have a school by their homes somewhere so they
would not have to take a bus back and forth to school."
"I think that the bussed people should remain under any circumstances
and should be fair treated like any other child. One of the bussed
children is my best friend and very smart."
"Having non-white kids in my class doesn't bother me in the least."
"I think the bussed-in pupils should have a better attitude towards
the teachers."
"I feel that all schools should be integrated to make better communi-
ties for the future. Working, going to school with children of different
race, color or religion should be done. We should all work together and
try to make our city a better one by helping each other. I enjoy having
other people of another color around me. I do not judge the color of a
person but just by their personality. I have many colored friends in
school (and they are the nicest friends I have ever had)."
"The bus kids are okay. I haven't got anything against them. Some of
them are a little wild but not that bad. I don't really care one way or
tht other. I think they liven up the class a little. Some of the bus
kids are real nice and I like them a lot, but some of the others I don't
like much. I don't like some of the white kids either."
"They learn things from us and we learn things from them."
"There is nothing wrong with going through school with bussed children
no matter what color they are. We are all God's children."
"1 have learned that I could get along better with the core area
children."

-79-
"Most of the bussed kids at our school get along very well with the
other kids, in fact, we are mostly good friends with them."
"I get along very well with the colored students, and I don't see
any reason why they shouldn't be in my rooms."
"I like them very much, but I don't think they should have to be
bussed, but instead live where they want to so they don't have to be
bussed in."
"Just because these children are a different color doesn't mean
they aren't as good as we are. I myself got along with them very well.
Ithink they are all very nice once you get to know them. I know how
hard it must be for them to adjust to being in a classroom with mostly all
white children, but they are nice to have in the same room as I. What
right have people to judge another person by the color of their skin and
not by their personality?"
"I really don't mind as long as there is no trouble."